 Bradley B. Tolar
 Kristin Boye
 Callum Bobb1
 Kate Maher
 John R. Bargar
 Christopher A. Francis
- 1Department of Earth System Science, Stanford University, Stanford, CA, United States
- 2Stanford Synchrotron Radiation Lightsource, SLAC National Accelerator Laboratory, Menlo Park, CA, United States
Riparian floodplains represent an interaction zone between the terrestrial subsurface and rivers, where regional groundwater flows, infiltration, and evapotranspiration drive mixing of water and import/export of nutrients and contaminants. These dynamics create seasonally transient redox conditions that drive biogeochemical transformations, which strongly modify groundwater quality. Microbial responses to changing hydrological conditions are perhaps the critical step connecting hydrology to geochemical transformations and groundwater quality, yet are not well understood. We aimed to address this knowledge gap by monitoring seasonal transitions at the United States Department of Energy legacy uranium ore processing site in Riverton, WY, through spring-summer-fall hydrological transitions. Our goal was to characterize the microbial community throughout the soil profile, down to the saturated aquifer, and observe its response to wet-dry transitions across a full season and compare to changes in geochemistry and hydrology. Next-generation sequencing was employed to identify biogeochemically relevant microbial taxa based on the 16S rRNA gene; we found a broad diversity of microbial clades including taxa involved in sulfur and metal cycling, as well as nitrification. These data were paired with measurements of soil moisture, major nutrients and cations, and trace elements. Overall microbial community composition was dependent on soil depth or type, with seasonal effects only observed in the topsoil or subsurface aquifer. This finding indicates that microbial communities in the transiently reduced center of the soil profile at the Riverton, WY site are remarkably stable, despite moisture and redox inversions. In addition, these communities likely impact the communities in surrounding soil horizons through export of metabolites and solutes as the water table rises and falls throughout the season.
Introduction
Alluvial aquifers are profoundly important as water supplies and for underground water storage, particularly in arid and semiarid regions such as the Western United States, notably including the Colorado River Basin (Rumsey et al., 2015; Miller et al., 2016). Shallow unconfined aquifers are excellent locations for examining biogeochemical dynamics, as they offer relative ease of access and monitoring, while exhibiting sediment compositions and biogeochemical functions representative of those occurring at greater depth in alluvial aquifers. In addition, riparian floodplains form an interaction zone between terrestrial and riverine systems, with subsurface exchanges of water, nutrients, and contaminants occurring across saturated-unsaturated interfaces and sediment layers (McClain et al., 2003; Vidon et al., 2010, and references therein; Boano et al., 2014; Lynch et al., 2014; Hauer et al., 2016; Noël et al., 2017a, b; Dwivedi et al., 2018). Importantly, floodplains are sites of intermittent and sometimes intense hydrological shifts including seasonal water table fluctuations, flooding, and drought (Burt et al., 2002; Dam et al., 2017; Noël et al., 2017a; Chudasma et al., 2018), similar to changes that may occur in deep alluvial aquifers in response to pumping/recharge or climate-driven changes in water levels. Such hydrological changes drive precipitation and dissolution of solids and control the diffusion of oxygen and the mobility/availability of aqueous nutrients and contaminants (Carlyle and Hill, 2001; Lair et al., 2009; Schulz-Zunkel et al., 2015). As a result, transitions in soil moisture of floodplains (as well as other alluvial systems) stimulate a number of important geochemical transformations (both biotic and abiotic) that further modify the solubility of nutrients and contaminants (Ford et al., 1997; Shuman, 1997; Baldwin and Mitchell, 2000; Vidon and Hill, 2004; Qafoku et al., 2009; Weber et al., 2009; Vidon et al., 2010; Noël et al., 2017a, b, 2019). Understanding the links between timing and extent of hydrological oscillations and the rates, types, and intensity of (bio)geochemical responses is critical for determining mobilization and transport of elements that ultimately controls water quality in these systems. A key element to this understanding is increased knowledge about how microbiological and geochemical processes couple (or decouple) in response to hydrological transitions, as this should provide clues about which biogeochemical processes are active at different stages.
The biogeochemical responses to hydrological transitions are, in part, dictated by sediment texture and organic matter content (Janot et al., 2016; Noël et al., 2017a). Alluvial aquifers and floodplains typically host sediment layers and lenses of strongly contrasting texture and organic matter contents juxtaposing each other (Devito et al., 2000; Hill et al., 2000; Carlyle and Hill, 2001; Gurwick et al., 2008; Blazejewski et al., 2009). Higher organic matter content tends to coincide with finer sediment textures – a consequence of sediment deposition in slow flow areas, whereas coarser sediments deposit in fast flow areas. Thus, in addition to elevated organic matter content – which promotes aerobic microbial respiration and hence oxygen consumption – fine-grained sediments have lower permeability and exhibit slow oxygen diffusion rates. As a consequence, they are often reported to turn anoxic when they become water saturated (Ford et al., 1997; Shuman, 1997; Qafoku et al., 2009; Weber et al., 2009; Noël et al., 2017a) and it is widely assumed that this results in large changes in the sediment microbial community, as aerobes are replaced by anaerobes. Rarely, however, have geochemical observations been coupled to genomic analyses to confirm this assumption. If sediments with elevated organic carbon and clay content are positioned within the depth range of seasonal water table fluctuations, they will alternate between reduced and oxidized conditions, turning them into transiently reduced zones (TRZs). Because of the strong influence of redox conditions on nutrient and metal solubility, hydrological transitions may cause TRZs to switch from sinks to sources (and sources to sinks), with considerable implications for groundwater quality. The underlying dynamics of the microbial community, and in particular the extent and rates of its change, are profoundly important to these geochemical behaviors.
In this article, we have focused on the impacts of seasonal water table excursions in a system where spring wet-up has been observed to trigger strong redox responses leading to onset of sulfate-reducing conditions. The field site for the study is a former uranium (U) ore processing mill near Riverton, WY, which hosts persistent groundwater plumes of U, molybdenum (Mo), and sulfate (Looney et al., 2014; Dam et al., 2015). It is one of several sites in the intermountain Western United States contaminated from legacy U ore-processing activities (Robinson, 2004). At Riverton, as at most of these sites, snowmelt in late spring results in rising water tables that rapidly saturate pore space, which then gradually desaturates through summer. Previous work has shown that TRZs are widespread in the Upper Colorado River Basin (Noël et al., 2017a), strongly accumulate U, and play important roles in maintaining the persistent U groundwater plume (Campbell et al., 2012; Noël et al., 2017b). The groundwater plume of U at Riverton is most pronounced in an area of the floodplain where several layers of organic matter-rich TRZs are positioned within the zone of seasonal water table fluctuations. Additionally, roots are relatively abundant throughout the soil profile at Riverton (including TRZs), which together with the dry, hot summers promotes strong upward transport of solutes through evapotranspiration (Looney et al., 2014; Dam et al., 2015). This results in evaporite precipitates in unsaturated soils that accumulate an appreciable amount of U both in TRZs and shallower soil layers (Looney et al., 2014; Dam et al., 2015; None, 2016).
Under reducing conditions, U accumulation is driven by microbially mediated reduction of highly soluble U(VI) to much less soluble U(IV) (Bargar et al., 2013; Lefebvre et al., 2019). This reduction can be performed by sulfate- or metal- reducing bacteria (e.g., Desulfobacter and Desulfovibrio, or Geobacter and Shewanella, respectively), either through direct enzymatic action (Lovely et al., 1991; Lovely and Phillips, 1992; Majumder and Wall, 2017) or indirectly through the formation of reductants such as mackinawite (Boyanov et al., 2011; Bargar et al., 2013). Noël et al. (2017b, 2019) suggested that the onset of seasonal oxidizing conditions in TRZs could be fast enough to drive major changes in the chemical form and stability of U trapped within. However, recent research shows that oxidative release of U by seasonal increases in oxygen (Bone et al., 2017; Pan et al., 2018) and nitrate reduction (Nolan and Weber, 2015) is impeded by bioavailable organic carbon (C) in suboxic sediments, especially TRZs. Thus, rapid oxidant consumption and subsequent anaerobic respiration in TRZs link C cycling and U distribution and mobility. Microbial communities in these soils consume oxidants, produce soluble organic C, and also generate reduced species (especially HS–) that drive precipitation of sulfide minerals. Such minerals subsequently buffer local redox conditions, protecting U from re-oxidation and limiting the amount of U re-mobilized via oxidative dissolution (Noël et al., 2017b). Hence, the duration and spatial extent of reducing conditions and U contaminant behavior are profoundly influenced by responses of microbial communities to the changing moisture status of the soil.
In summary, the coupling between hydrology and biogeochemistry in the Riverton floodplain, and many similar alluvial systems across the Western United States, is highly complex. Detailed knowledge of how various microbial and geochemical processes are connected to hydrological processes in these spatially heterogeneous systems is lacking. We expect that microbial communities should provide essential clues about when and where specific geochemical processes are triggered, and how this links to nutrient and contaminant mobility. To assess the level of coupling and decoupling of microbial and geochemical responses to hydrological changes, we characterized the microbial community composition over space and time in alluvial soils at Riverton, WY, through a full cycle of water table rise, flooding, and summer drought (from April to September 2017). Here we compare the relative stability of the microbial community (at the taxon level) to the dramatic changes that we observed in geochemical parameters and hydrology during this same period.
Materials and Methods
Sample Collection
We collected samples from the Wind River-Little Wind River floodplain near Riverton, WY (42° 59′ 19.1″ N, 108° 23′ 58.6″ W; Supplementary Figure S1) about once per month from April to September 2017 (Supplementary Table S1). Hydrological data was obtained from the USGS monitoring station on the Little Wind River1. Flooding at the site during almost the entire month of June prevented sample collection in this month, so instead two samples were collected in July (7th and 25th). Soil samples were collected using a hand-auger (30 cm long, 10 cm diameter collection head) from a new location within a ∼1 m diameter circle at the site for each sample date. The cores were taken in an area between a soil pit dug (and re-filled) in 2016 (profile description in Supplementary Figure S2) and a gallery of porewater samplers [10 cm long, 0.15 μm pore size rhizons (Rhizosphere Research Products)].
Cores were divided into ∼10 cm intervals or consistent with distinct soil layers (if noted as being smaller than 10 cm). All samples used for microbial or redox-sensitive analyses were immediately frozen on dry ice in the field and subsequently shipped on dry ice and stored in −80°C until analysis. Total elemental composition and C analyses were conducted on samples preserved and shipped on ice and stored at −20°C prior to fresh sample extractions (water-extractable concentrations), extractions inside an anoxic chamber (3–4% hydrogen, H2, 96–97% nitrogen, N2; redox sensitive samples), or drying in ambient conditions (total concentrations). Soil moisture was determined gravimetrically by weighing subsamples of field moist soils upon arrival in the laboratory and again after drying for 24 h at 105°C. Samples from April were not analyzed for soil moisture.
Porewater from the nearby sampling gallery (5 depths) were collected at a finer time interval than soil samples, generally once a week; however, porewater was always collected on the same occasions as sediment soil for comparison. Porewater samples were immediately injected into pre-evacuated and crimp-sealed serum vials containing nitric acid (final concentration after injection of porewater was 1–2%) and shipped on ice. Porewater samples were stored at 2°C prior to analysis.
Chemical Analysis
Total C and N concentrations of soil samples were determined in duplicates on finely ground, air-dried soils by a Carlo Erba NA 1500 elemental analyzer. Total organic C was determined in the same way, but after removal of carbonate C (CO3-C) through dropwise 1M HCl treatment of soil slurries until fizzing stopped and subsequent rinsing with MilliQ-water and drying at 30°C. Total concentrations of other elements in soils (Na, Mg, S, Fe, K, Ca, As, Mo, U) were also determined on finely ground, air-dried samples by X-ray fluorescence (XRF) spectroscopy (Spectro Xepos HE). Acid-extractable Fe(II) was determined by the ferrozine method (Stookey, 1970; Viollier et al., 2000) on MilliQ-diluted samples (to get within the analytical range for the method) from 1 g:10 mL (soil:0.5M HCl) extracts that had been shaken for 2 h and subsequently filtered (0.22 μm, syringe-filters). Water-extractable concentrations of elements (organic C, Na, Mg, S, Fe, K, Ca, As, Mo, U) were determined on 1 g:10 mL (soil:MillliQ-water) extracts after 2 h of shaking and subsequent filtration (0.22 μm, pre-rinsed syringe filters) of the supernatant. Water-extractable organic C in these extracts was analyzed by the non-purgeable organic C (NPOC) method on a Shimadzu TOC-L analyzer with in-line acidification (phosphoric acid) of samples to volatilize inorganic C. All other water-extractable element concentrations were analyzed by inductively coupled plasma (ICP) spectroscopy after acidification with nitric acid (final concentration of nitric acid in analyzed sample was 2%). Fe, S, Ca, Mg, Na, and K concentrations were analyzed by ICP optical emission spectroscopy (ICP-OES, iCAP6000, Thermo Fisher Scientific, Cambridge, United Kingdom), whereas As, Mo, and U were analyzed by ICP mass spectrometry (ICP-MS, XSERIES 2, Thermo Fisher Scientific). Porewater samples were analyzed by ICP-OES and ICP-MS in the same way as the water extracts. All chemical data is included in Supplementary Table S1.
Molecular Microbial Analysis
DNA was extracted from 0.25–0.5 g of soil from 9 to 17 depths per sample date (Supplementary Table S1) using the PowerSoil DNeasy Extraction Kit (Qiagen) with slight modifications: cell lysis was performed on a FastPrep (Thermo Fisher Scientific) bead beater twice at speed 5.5 for 30 s with a 1 min incubation on ice in between; DNA was eluted after a 1 min incubation at room temperature. The concentration of DNA in each sample was determined on the Qubit system with the high sensitivity assay (Invitrogen). Samples were submitted to the Georgia Genomics and Bioinformatics Core2 for Illumina library preparation and 16S rRNA amplicon sequencing, using V4–V5 primers (Parada et al., 2016). A total of 8,063,477 reads were generated from 120 samples (available in the NCBI Single Read Archive – BioProject ID: PRJNA626616). Sequences were pooled from replicate samples to a total of 83 unique samples (Supplementary Table S2). These reads were quality checked and processed through mothur (v. 1.41.3; Schloss et al., 2009) following the MiSeq SOP (Kozich et al., 2013; accessed December 2019), including trimming to 450 bp and removal of chimeras. Sequences were aligned against the SILVA SSU database (Release 132; Quast et al., 2013; Yilmaz et al., 2014) and classified. The resulting 6,828,356 reads were grouped into operational taxonomic units (OTUs) at 97% similarity (Supplementary Table S2) for further analysis, with singleton and doubleton OTUs removed (a total of 26,531 OTUs were analyzed).
Statistical Analysis
Analysis of molecular variance (AMOVA), homogeneity of molecular variance (HOMOVA), and linear discriminant analysis (LDA) effect size (LEfSe) tests were run on microbial communities grouped by soil horizon and sample date in mothur (as described in Schloss, 2008). LEfSe is further described in Segata et al. (2011). All other statistical analysis was performed in R (v. 3.5.3; R Core Team, 2017). Geochemical values missing from <15% of samples in our dataset (Supplementary Table S1) were imputed prior to statistical analysis, predicted from a multivariable regression model using the Multivariable Imputation by Chained Equations (MICE) method, implemented in R with the mice package (v. 3.8; van Buuren and Groothuis-Oudshoorn, 2011) with parameters set to: maxit = 100, seed = 500. The following variables were included: total and soluble organic C; total inorganic C; total and soluble Ca and As; soluble Na, Mg, S, Mo, and U; and acid-extracted Fe(II). Soil moisture had too many missing data points for inclusion in the imputation model; therefore, it was analyzed further with a reduced dataset that excluded data from April samples.
We combined our geochemical data with microbial sequencing data (taxonomy and OTU counts) for analysis in phyloseq (v. 1.24.2; McMurdie and Holmes, 2013). Relative abundance of OTUs was calculated using the transform_sample_counts function from count data, as a percentage of total sequence counts per OTU per sample. For all ordination plots, we rarefied the sequencing data to an even number of sequences per sample using rarefy_even_depth in phyloseq. We used redundancy analysis (RDA) to analyze geochemical data. For OTU data, we used a Bray–Curtis dissimilarity matrix to evaluate community variability across samples with unconstrained [non-metric multidimensional scaling (NMDS)] and constrained [Constrained Analysis of Principal Coordinates (CAP)] ordinations. Correlation coefficients (r) for CAP were extracted from biplot scores. Figures were made in R using the ggplot2 package (v. 3.3.0; Wickham, 2016).
Results
Soil Characteristics
Based on the profile description from the nearby soil pit we dug in 2016 (Supplementary Figure S2), we identified seven major categories of soil layers: Topsoil (∼0–30 cm), Evaporite (∼30–55 cm), Sand (∼55–75 cm), Evaporite-Clay (∼75–100 cm), TRZ (∼100–140 cm), Clay (∼140–150 cm), and Aquifer (∼150–170 cm). Although each core exhibited the same distinct layers, due to slight variability in surface elevation and layer thicknesses between the core locations, the exact depth intervals varied slightly between sample dates. The grouping of samples into categories for each time point was therefore done by matching soil properties (color, texture, visual evaporite abundances, and total organic C content), rather than by exact depth. Depth designation was adjusted accordingly (i.e., assuming the same layer occurred at the same depth at each sample location) to enable direct comparisons of data for the same layer between time points.
Three organic-enriched zones (>1% organic C, wt%) were identified, largely corresponding to the Topsoil, Evaporite, and bottom of Evaporite-Clay extending through the TRZ layers (Supplementary Figure S3), i.e., mainly coinciding with a clayey texture (Supplementary Figure S2). Coarser horizons typically contained ≤0.05% organic C (Supplementary Figures S2, S3). Solid phase carbonate content varied between sampling times (Supplementary Figure S3, difference between Tot-C and Org-C), with the Evaporite-Clay and TRZ layers exhibiting the highest carbonate concentrations (up to 89% of the total C content) as well as the most variable carbonate concentrations throughout the season.
Seasonal Hydrology and Geochemistry
Over the period sampled, the Riverton site experienced seasonal transitions in hydrology (Figure 1A): (1) groundwater table rise in April/May due to spring snowmelt, eventually culminating in overbank flooding of the Little Wind River; (2) inundation at the sampling location for almost the entire month of June, followed by rapid and seasonal decline of the Little Wind River discharge and onset of summer drought conditions; and (3) water table recession below the bottom clay layer. As snowmelt runoff saturated the aquifer and flooded the site, a reducing front propagated upward through the soil profile, as indicated by an almost simultaneous increase in porewater concentrations of Fe and Mn (Figures 1B,C). In this period, the corresponding oxidizing front propagated downward at a much slower pace than water table recession, as evidenced by porewater concentrations of Fe and Mn, which at a given depth remained elevated for several weeks after the water table had fallen below this depth (Figures 1B,C). Notably, the HCl-extractable Fe(II) concentrations post-flood continued to accumulate with depth throughout the TRZ and Clay during the falling water table stage (Supplementary Figure S4).
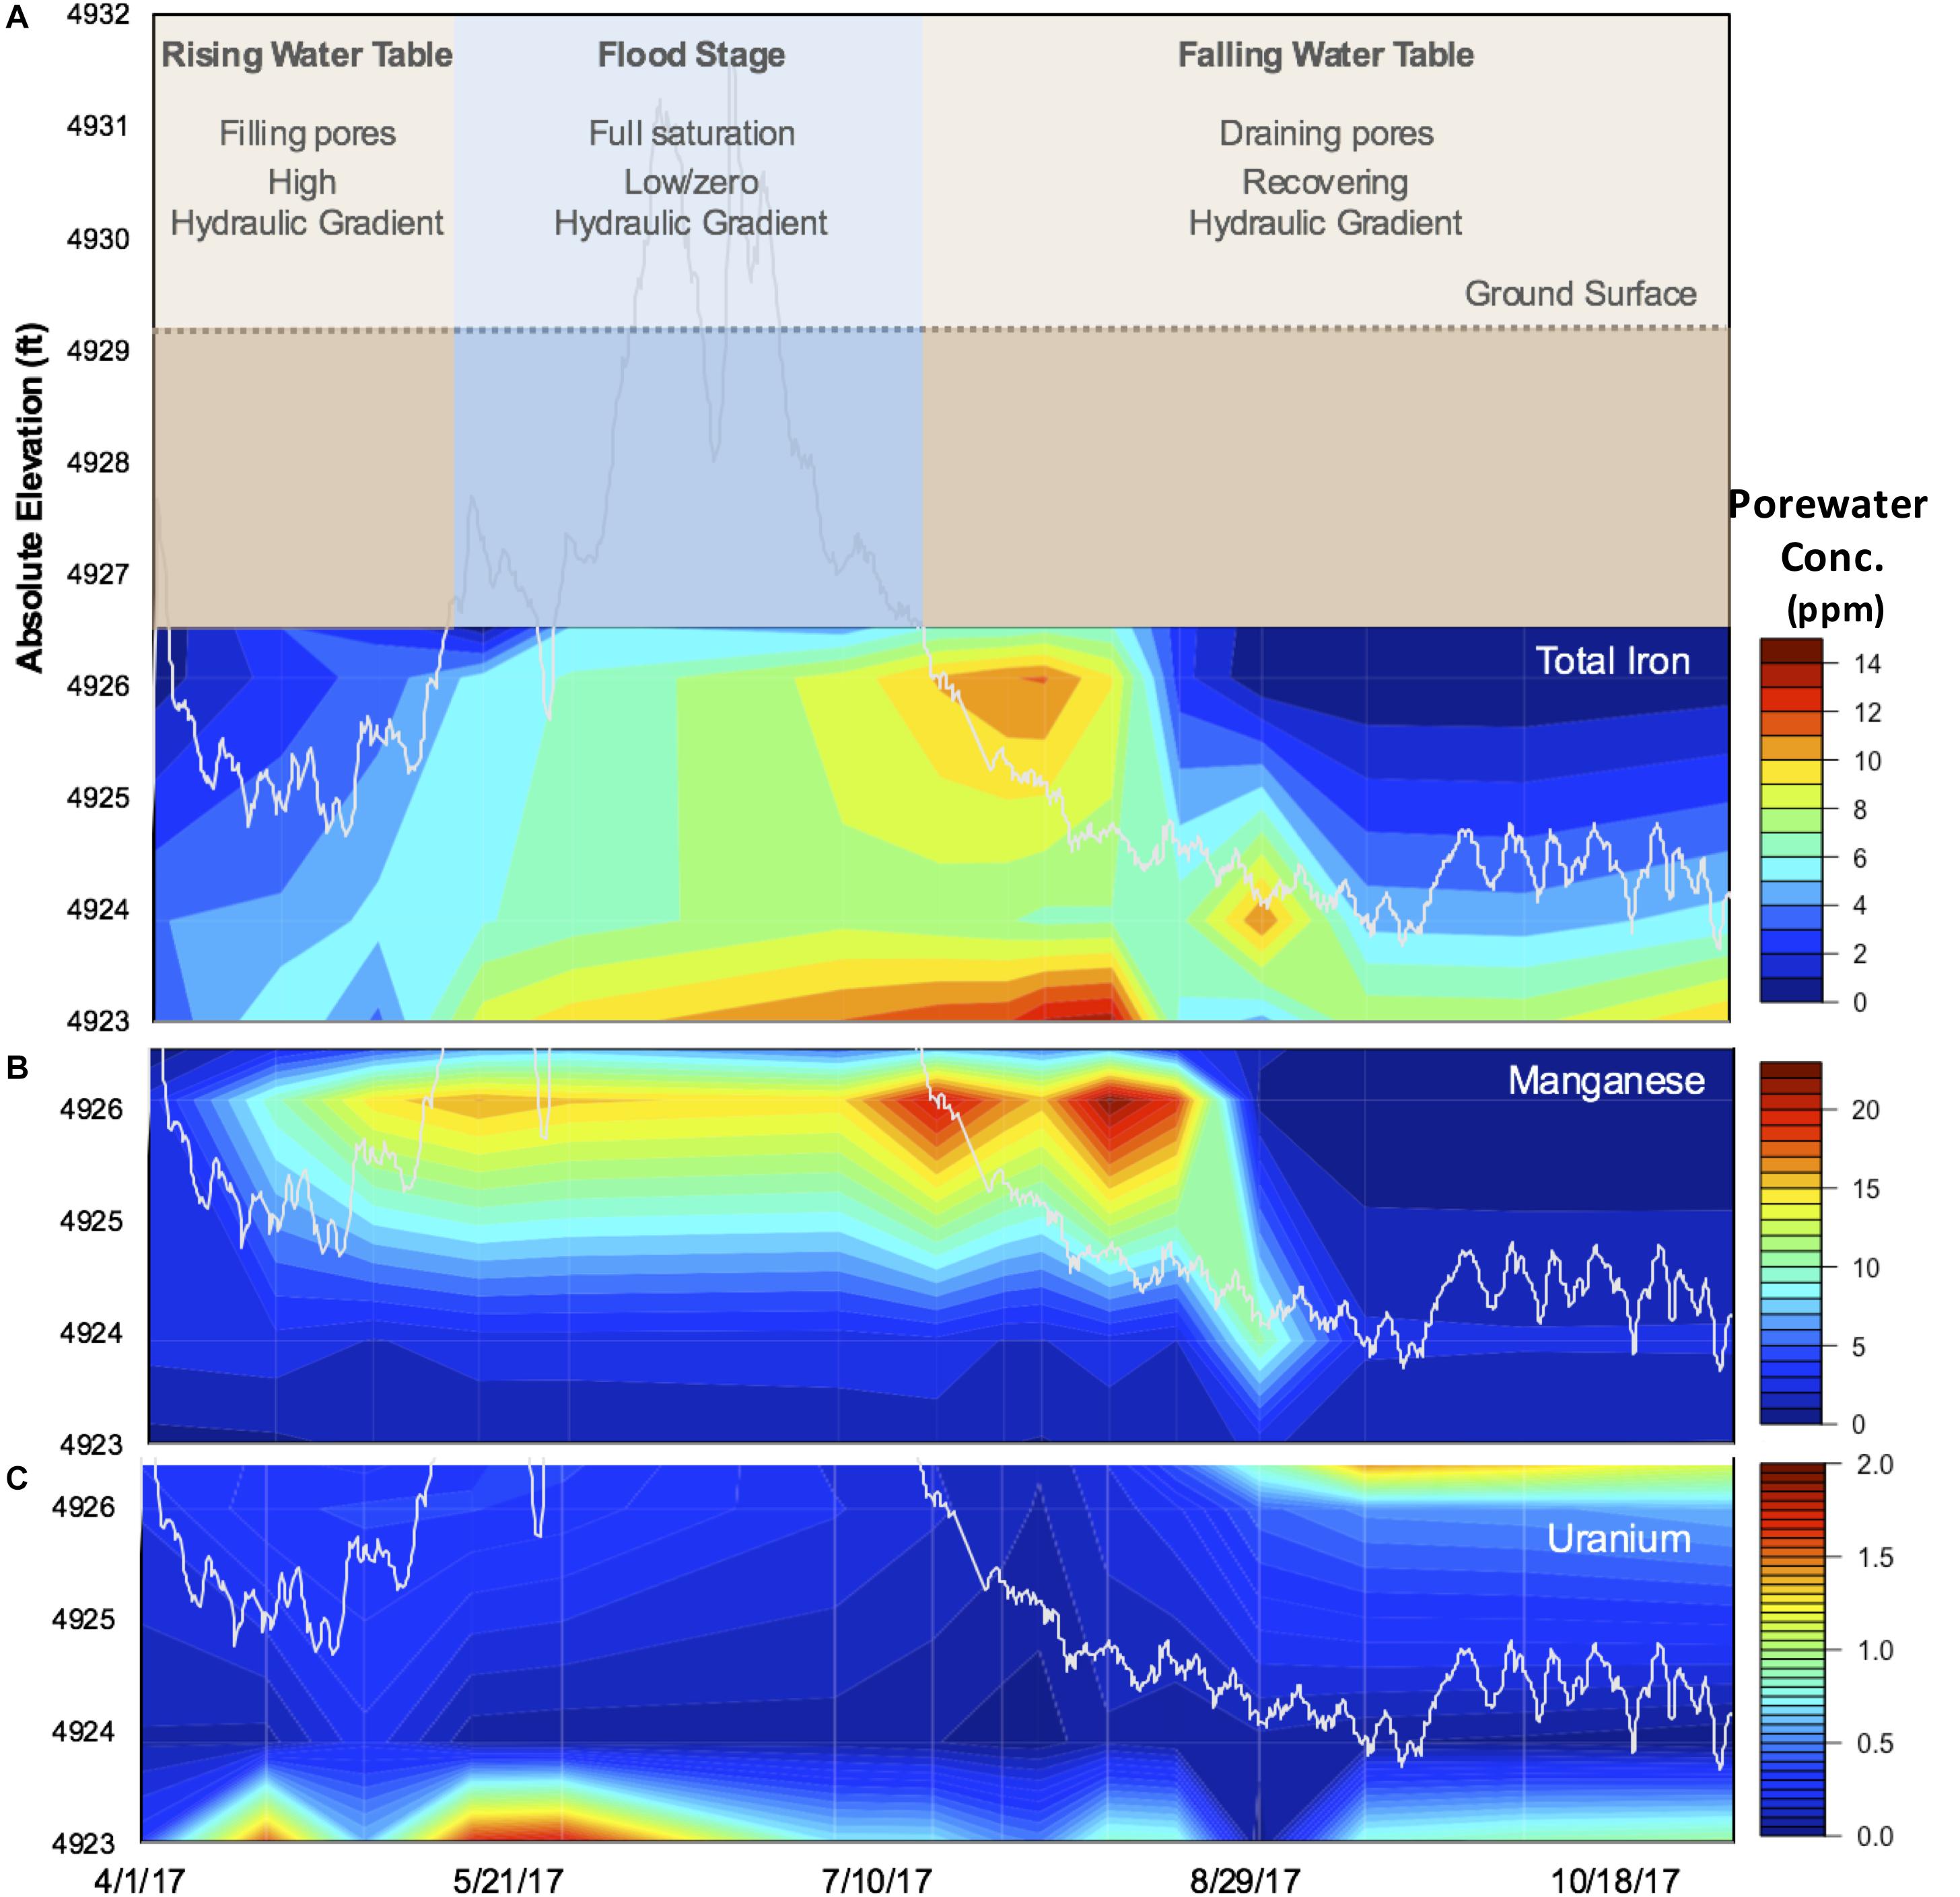
Figure 1. Seasonal changes at the Riverton study site in 2017. Observed (A) hydrological flow regimes over time, categorized into three distinct periods: (1) rising water table, (2) flood stage, and (3) falling water table (see section “Results” for a further description). Porewater concentrations (mg/L) of (B) Fe, (C) Mn, and (D) U represented as heat maps as a function of depth (y-axis, absolute elevation in feet). Water table elevation is indicated by the white line (B–D).
Another effect of the flood was that water-soluble organic C was released and re-distributed throughout the profile (Supplementary Figure S4). This pool was then quickly depleted in the sand and (more slowly) in the TRZ, whereas it remained high in the Topsoil and the Evaporite-Clay layers. The Evaporite-Clay apparently forms a distinct moisture boundary at Riverton; the soils above dried relatively quickly whereas those at and below maintained high moisture throughout the sampling period (Supplementary Figure S4). The maintenance of high water-soluble organic C concentrations in the Topsoil is not surprising, given the large pool of solid phase organic C in this layer (Supplementary Figure S3) and the abundance of roots (Supplementary Figure S2). Moreover, the maintained pool of HCl-extractable Fe(II) into September further indicates that root and microbial respiration of infusing O2 likely prevented re-oxidation of Fe(II) at the top of the soil profile (Supplementary Figure S4), which is consistent with a maintained supply of soluble organic C from microbial decomposition and root exudation.
Total and water-soluble U (Supplementary Figure S5) exhibited the same general trends, with the TRZ having the highest concentrations before the flood, which appears to have flushed U downward. The Evaporite-Clay and Clay layers appear to have accumulated U as it moved downward with the receding water table, but the Aquifer maintained the highest U concentrations after the flood. As the soil dried, U accumulated in the layers containing evaporites, as well as in the bottom of the profile in a similar pattern to HCl-extractable Fe(II), with a considerably higher proportion of U being water soluble in the Evaporite-Clay than in the bottom Clay and Aquifer (Supplementary Figure S5).
Overall, statistical analysis of geochemical measurements at the Riverton site strongly separated samples based on depth across the primary axis (RDA1, 41.3% variance explained; Figure 2), in accordance with the soil horizons defined above. Depth was the strongest contributor to this axis (r = 0.94), along with organic C, N, and metals, including Mo, U, and Fe(II). Though minor, RDA2 (10% variance explained) represented K (r = 0.71) and HCl-extractable Fe(II) (−0.69), followed by Mg, S, Fe, and U.
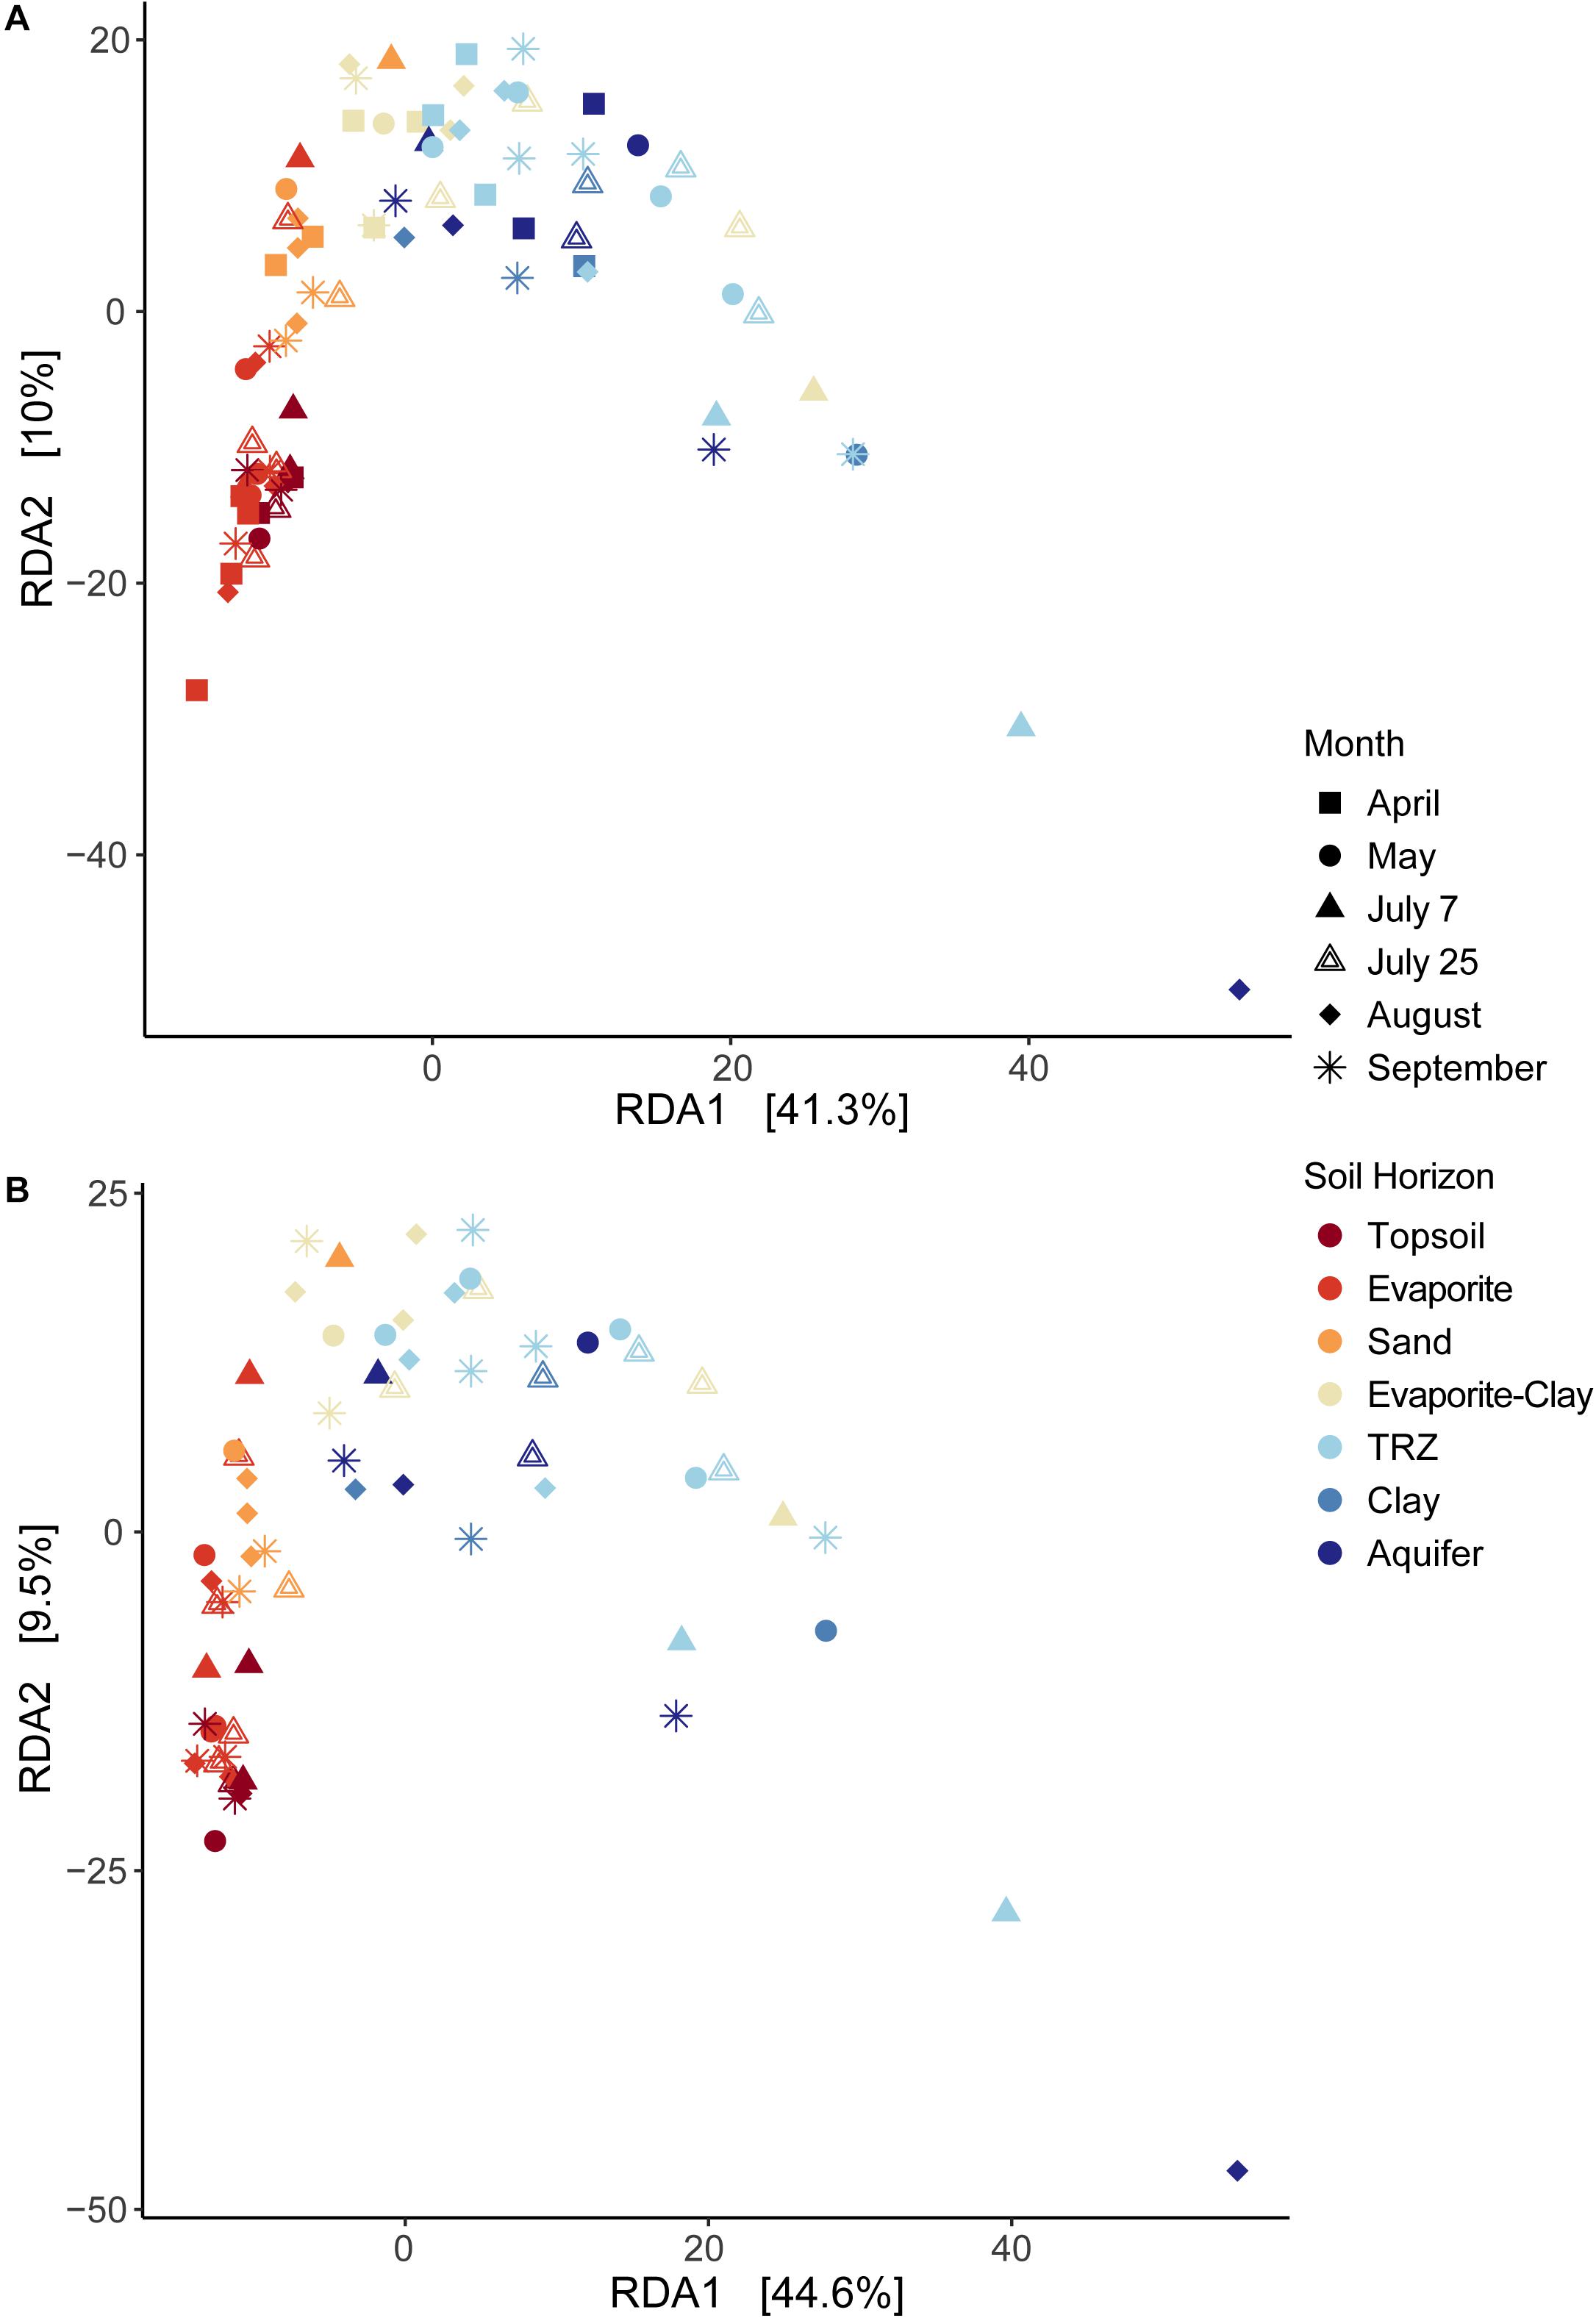
Figure 2. Redundancy Analysis (RDA) of environmental data at Riverton Site, using (A) the full dataset or (B) a reduced dataset excluding April samples to include soil moisture data. Samples are identified by month sampled (shape) and soil horizon (color).
Microbial Community Composition at Riverton
A total of 26,532 OTUs were recovered and analyzed from Riverton soils, representing 58 bacterial and 9 archaeal phyla; our dataset includes 190 different taxa at the class level, and 847 families. Microbial community composition strongly separated by depth – an indicator of soil type – at the phylum level (Figure 3A). A majority of taxa recovered belong to the Proteobacteria phylum, specifically Alphaproteobacteria, Deltaproteobacteria, and Gammaproteobacteria classes (Figure 3B). Deeper depths at our site become dominated by Proteobacteria (43–50% of total community), primarily Deltaproteobacteria. Surface layers in the soil have approximately equal proportions of Alphaproteobacteria (12–13%) and Gammaproteobacteria (10–12%), as well as Actinobacteria (18–19%) and Acidobacteria (10–12%), and to a lesser extent Gemmatimonadetes (7–11%). Other groups showed relatively consistent proportional abundance throughout the soil column, including Bacteroidetes (4–8% of total community), Chloroflexi (6–13%), Planctomycetes (5–8%), and Thaumarchaeota (1–2%). Though minor portions of the overall community, members of the phyla Rokubacteria and Firmicutes were two to three times more abundant in the upper soil layers, whereas Nitrospirae became more prominent in the deepest parts of the soil column (in Clay and Aquifer samples, Nitrospirae comprised 1–2% of total community compared to 0.4–0.6% in other layers).
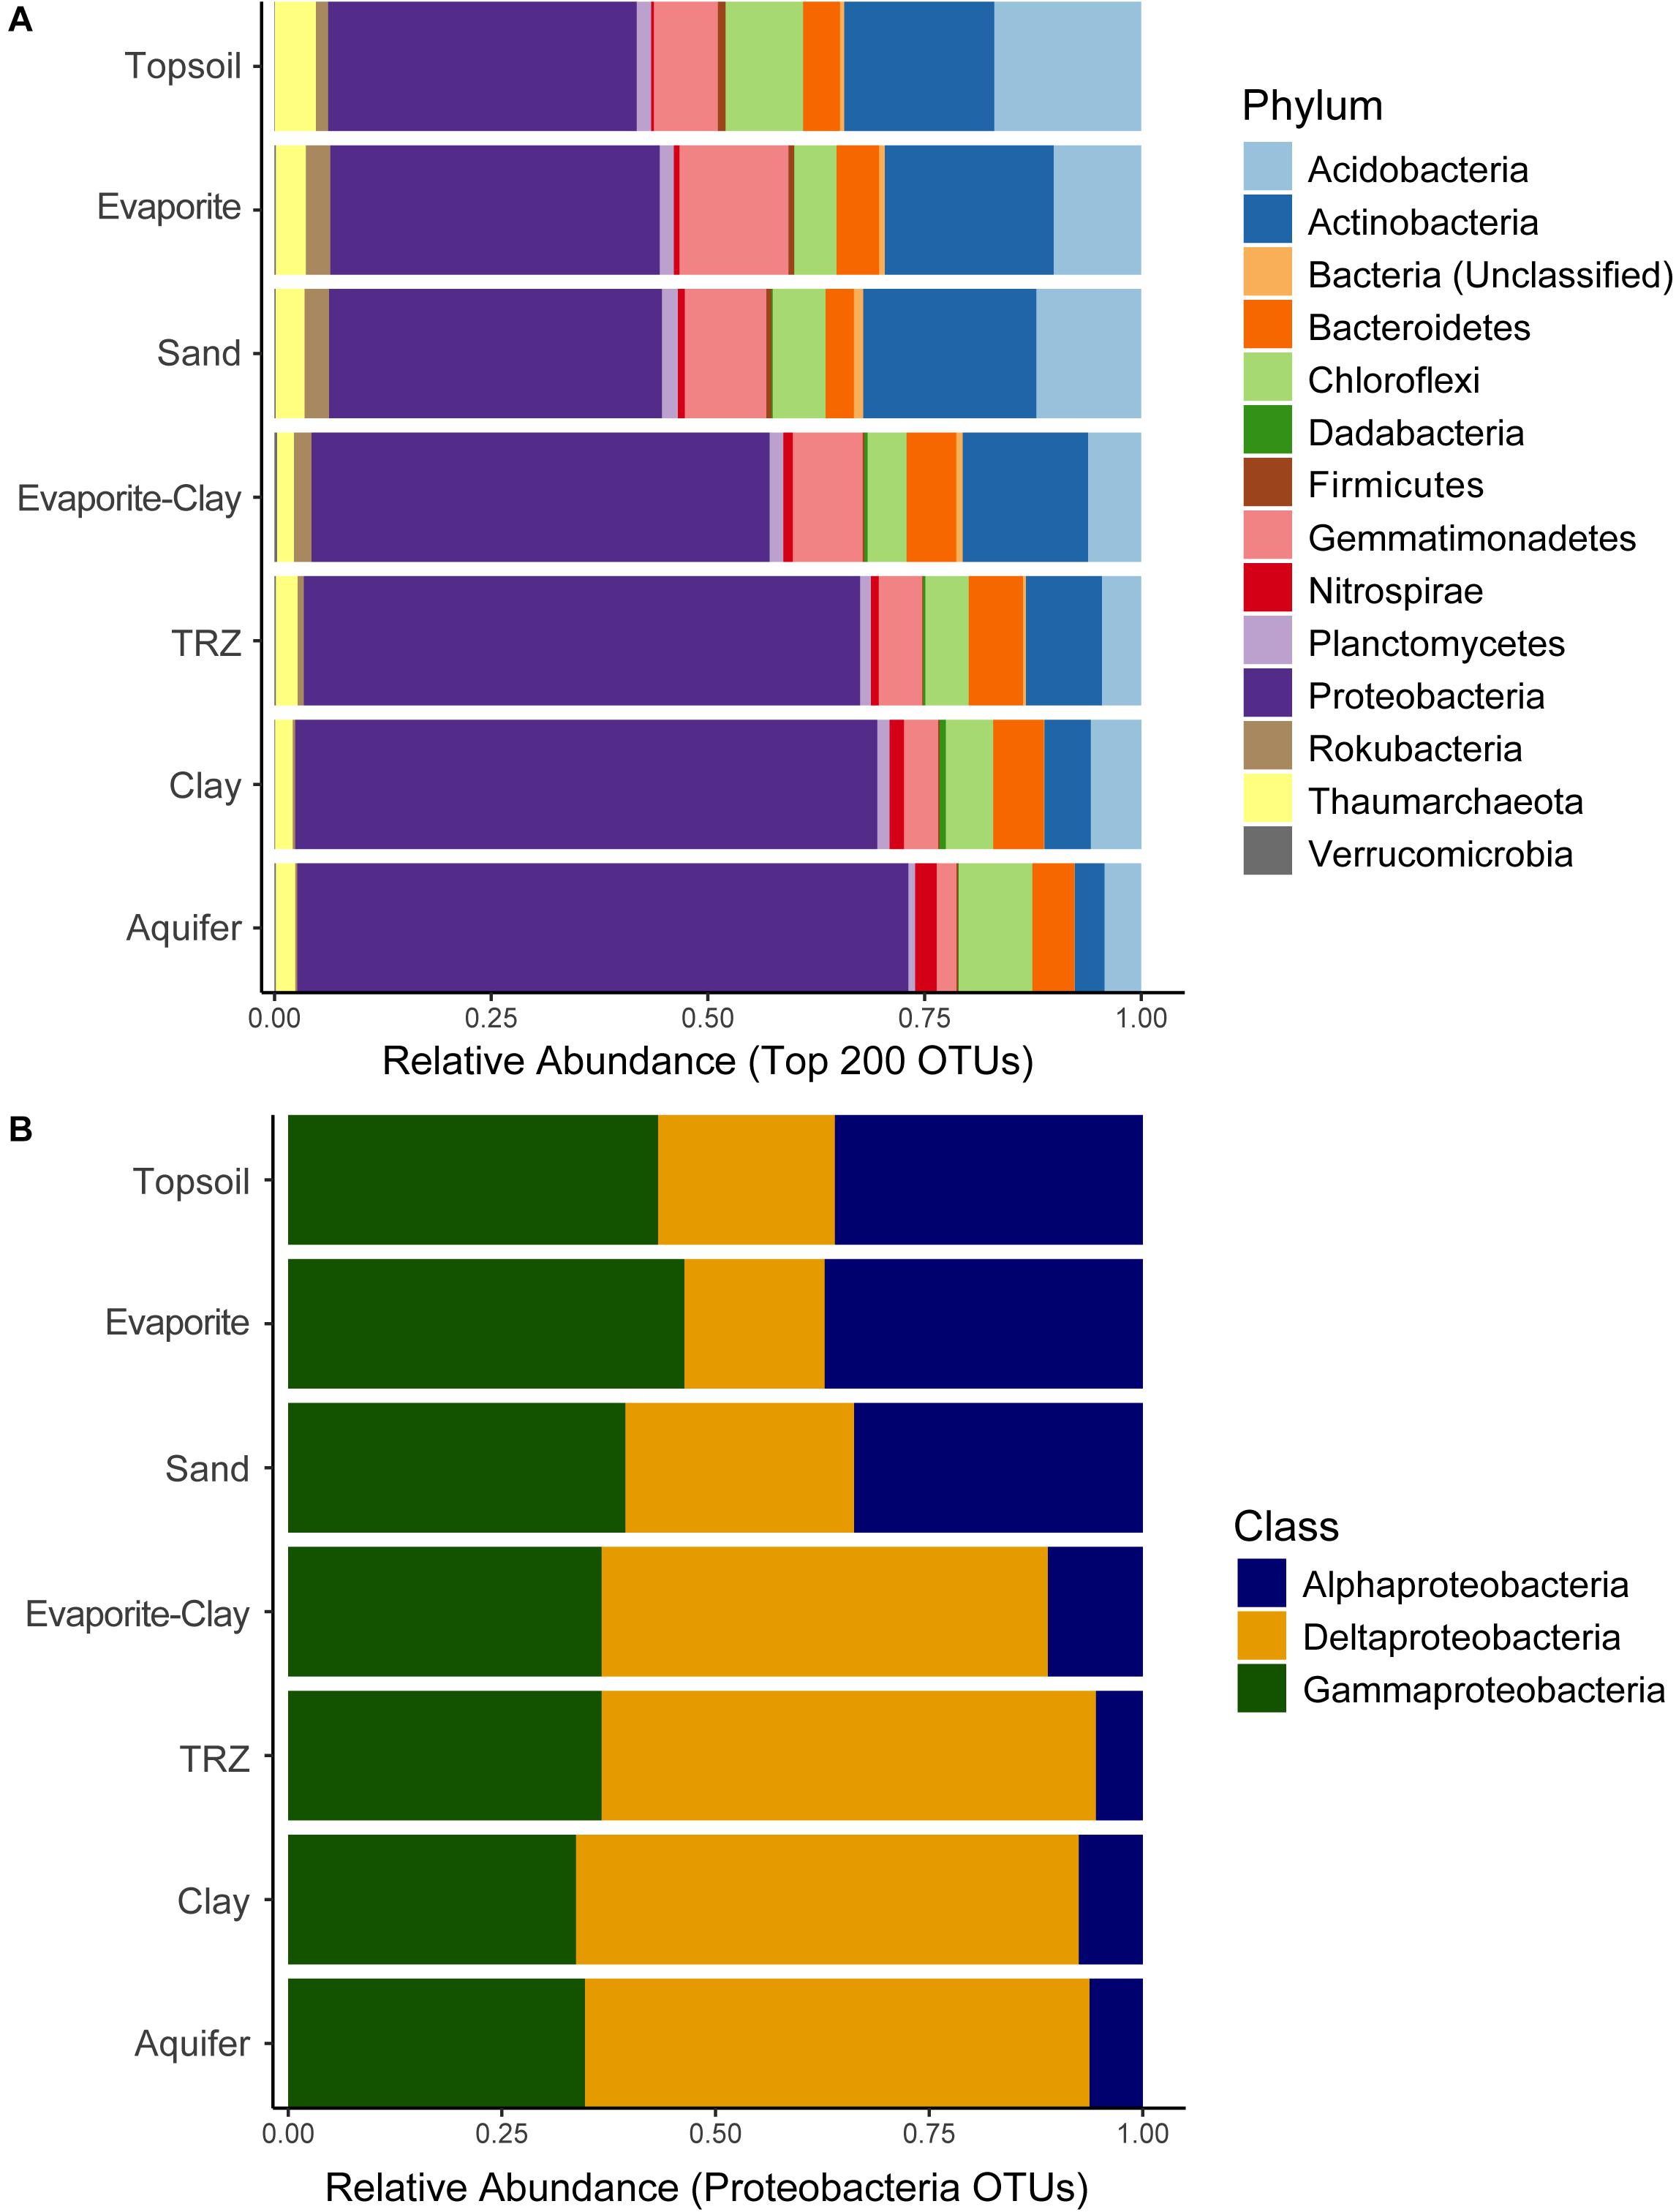
Figure 3. Distribution of sequenced (A) Phyla and (B) Proteobacteria classes recovered from soil samples, separated out by soil horizon (averaged across all months). Relative abundance calculated from all sequenced taxa (A) or proteobacterial taxa sequenced (B).
We observed distinct differences between soil layers in N-cycling microorganisms, particularly with regard to nitrification, which involves the sequential oxidation of ammonia to nitrite and then nitrate by specific groups of Archaea and Bacteria. Within the ammonia-oxidizing Thaumarchaeota – which catalyze the first and rate-limiting step of nitrification – we found typical soil lineages (Nitrososphaera and Nitrosocosmicus sp.) at surface depths (Figure 4). However, deeper soil layers (TRZ, Clay, Aquifer) included groups more often observed in marine sediment (Nitrosopumilus sp.) or the major freshwater/estuarine lineage (Nitrosarchaeum sp.), both of which belong to the family Nitrosopumilaceae (Figure 4). Although comparatively minor contributors to the nitrifying community overall, ammonia-oxidizing bacteria were observed at the surface (Nitrosospira sp.; Topsoil and Evaporite) and deepest soil layers sampled (Nitrosomonas sp.; TRZ, Clay, Aquifer). Nitrite-oxidizing bacteria, namely Nitrospira sp., were found at all depths sampled, with the highest relative abundance (>25% of nitrifying microorganisms) within the Evaporite-Clay layer (Figure 4).
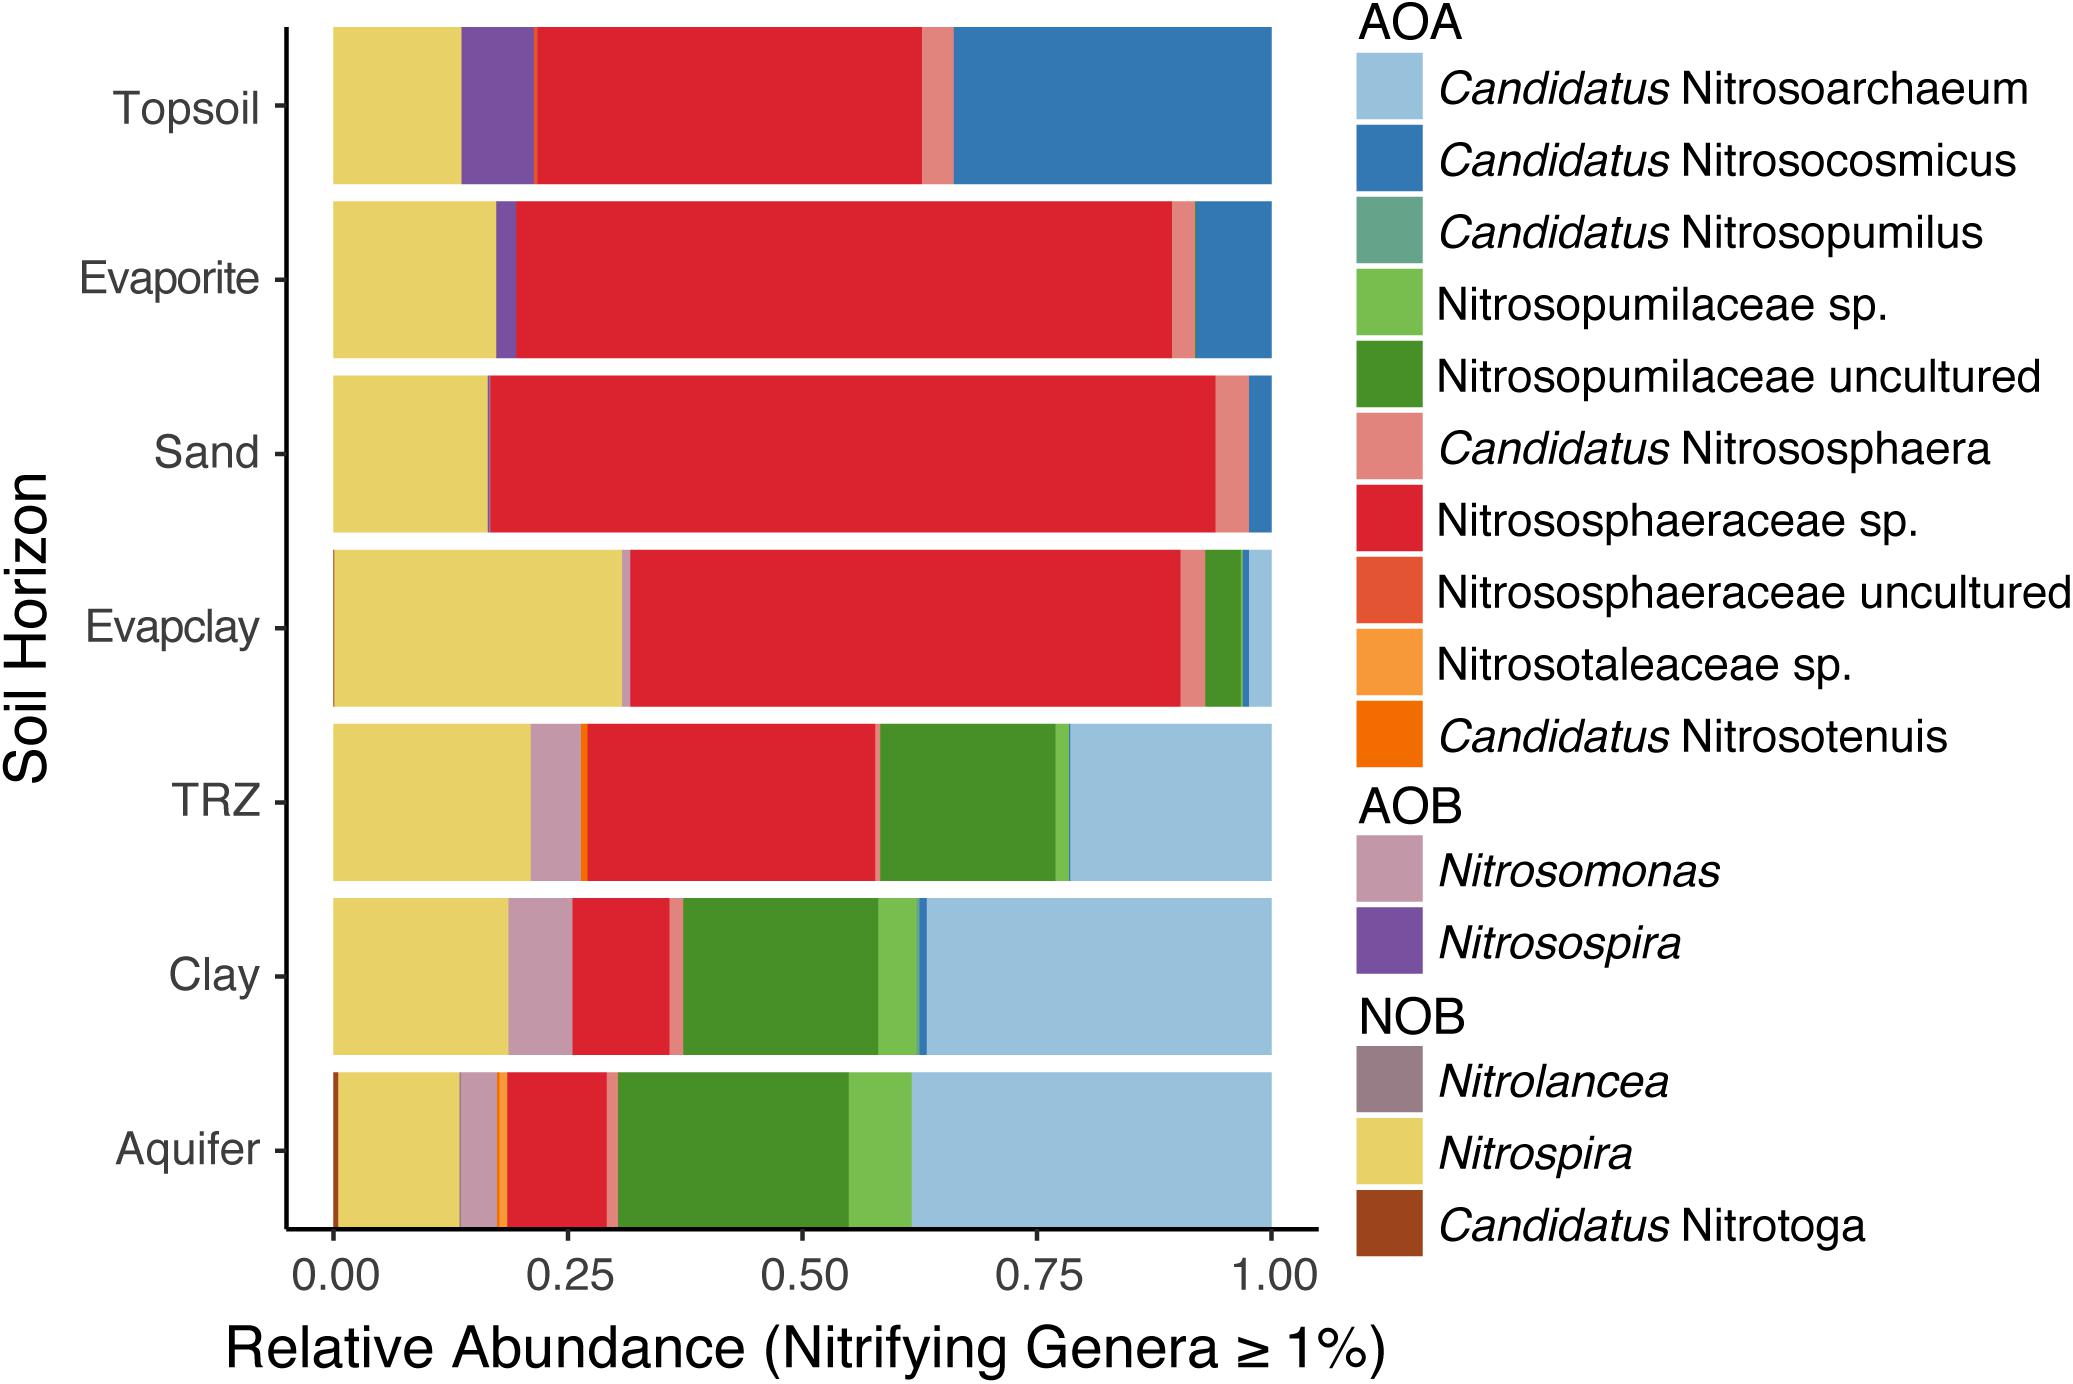
Figure 4. Depth profiles of nitrifying organisms classified to the level of genera, including ammonia-oxidizing Archaea (AOA) within the phylum Thaumarchaeota, ammonia-oxidizing bacteria (AOB), and nitrite-oxidizing bacteria (NOB).
We found that microbial community composition varied by soil horizon (Figure 3), classified according to the intervals defined above. Overall, nearly every soil horizon at the Riverton site hosted a distinct microbial community (AMOVA, p < 0.05); only the TRZ and Clay communities were statistically indistinguishable (p = 0.09). Using the LEfSe analysis (Supplementary Table S6), we determined that OTUs representing Desulfobulbaceae (#1), MND1 (#2), and Desulfurivibrio (#7) were significantly elevated in TRZ samples relative to other taxa. The key OTUs in deeper soil layers were Desulfuromonas (#3), MBNT15 (#4), Sulfurifustis (#5), and Thiobacillus (#6) in Aquifer samples, and Methyloligellaceae (#10), Pseudomonas (#12), and Marinobacterium (#14) from the Clay (Supplementary Table S6). For the surface soil layers, a group of Acidobacteria (Subgroup 6; OTU #s 16, 17, and 22) were identified as significant to Topsoil samples, while Gemmatimonadaceae (#8) was elevated in the Sand, and the significant OTUs from Evaporite samples were Woesia sp. (#8) and an uncultured Alphaproteobacteria (#15) (Supplementary Table S6).
In contrast to the variation across depth, there was no significant difference between communities by sample date alone (AMOVA, p = 0.12). Despite the myriad changes observed in geochemistry, microbial communities in Riverton soils were considerably more consistent at the Phylum level over time (Supplementary Figure S6a). We also observed this trend at finer taxonomic resolution; for example, even at the class and family level, communities within Proteobacteria separated by depth rather than sample date (Figures 3B, 5 and Supplementary Figure S6b). With LEfSe, only five OTUs were highlighted as being significantly distinct between time points (Supplementary Table S6). In the post-snowmelt pre-flood April samples, OTU #s 8 (Gemmatimonadaceae), 11 (Pelagibius, Alphaproteobacteria), and 20 (order Actinomarinales) were significant, and OTU #30 (PLTA13, Gammaproteobacteria) was significant in May samples. The last OTU was significant in August samples after the onset of drought conditions; this OTU (#10) belongs to the family Methyloligellaceae (Supplementary Table S6).
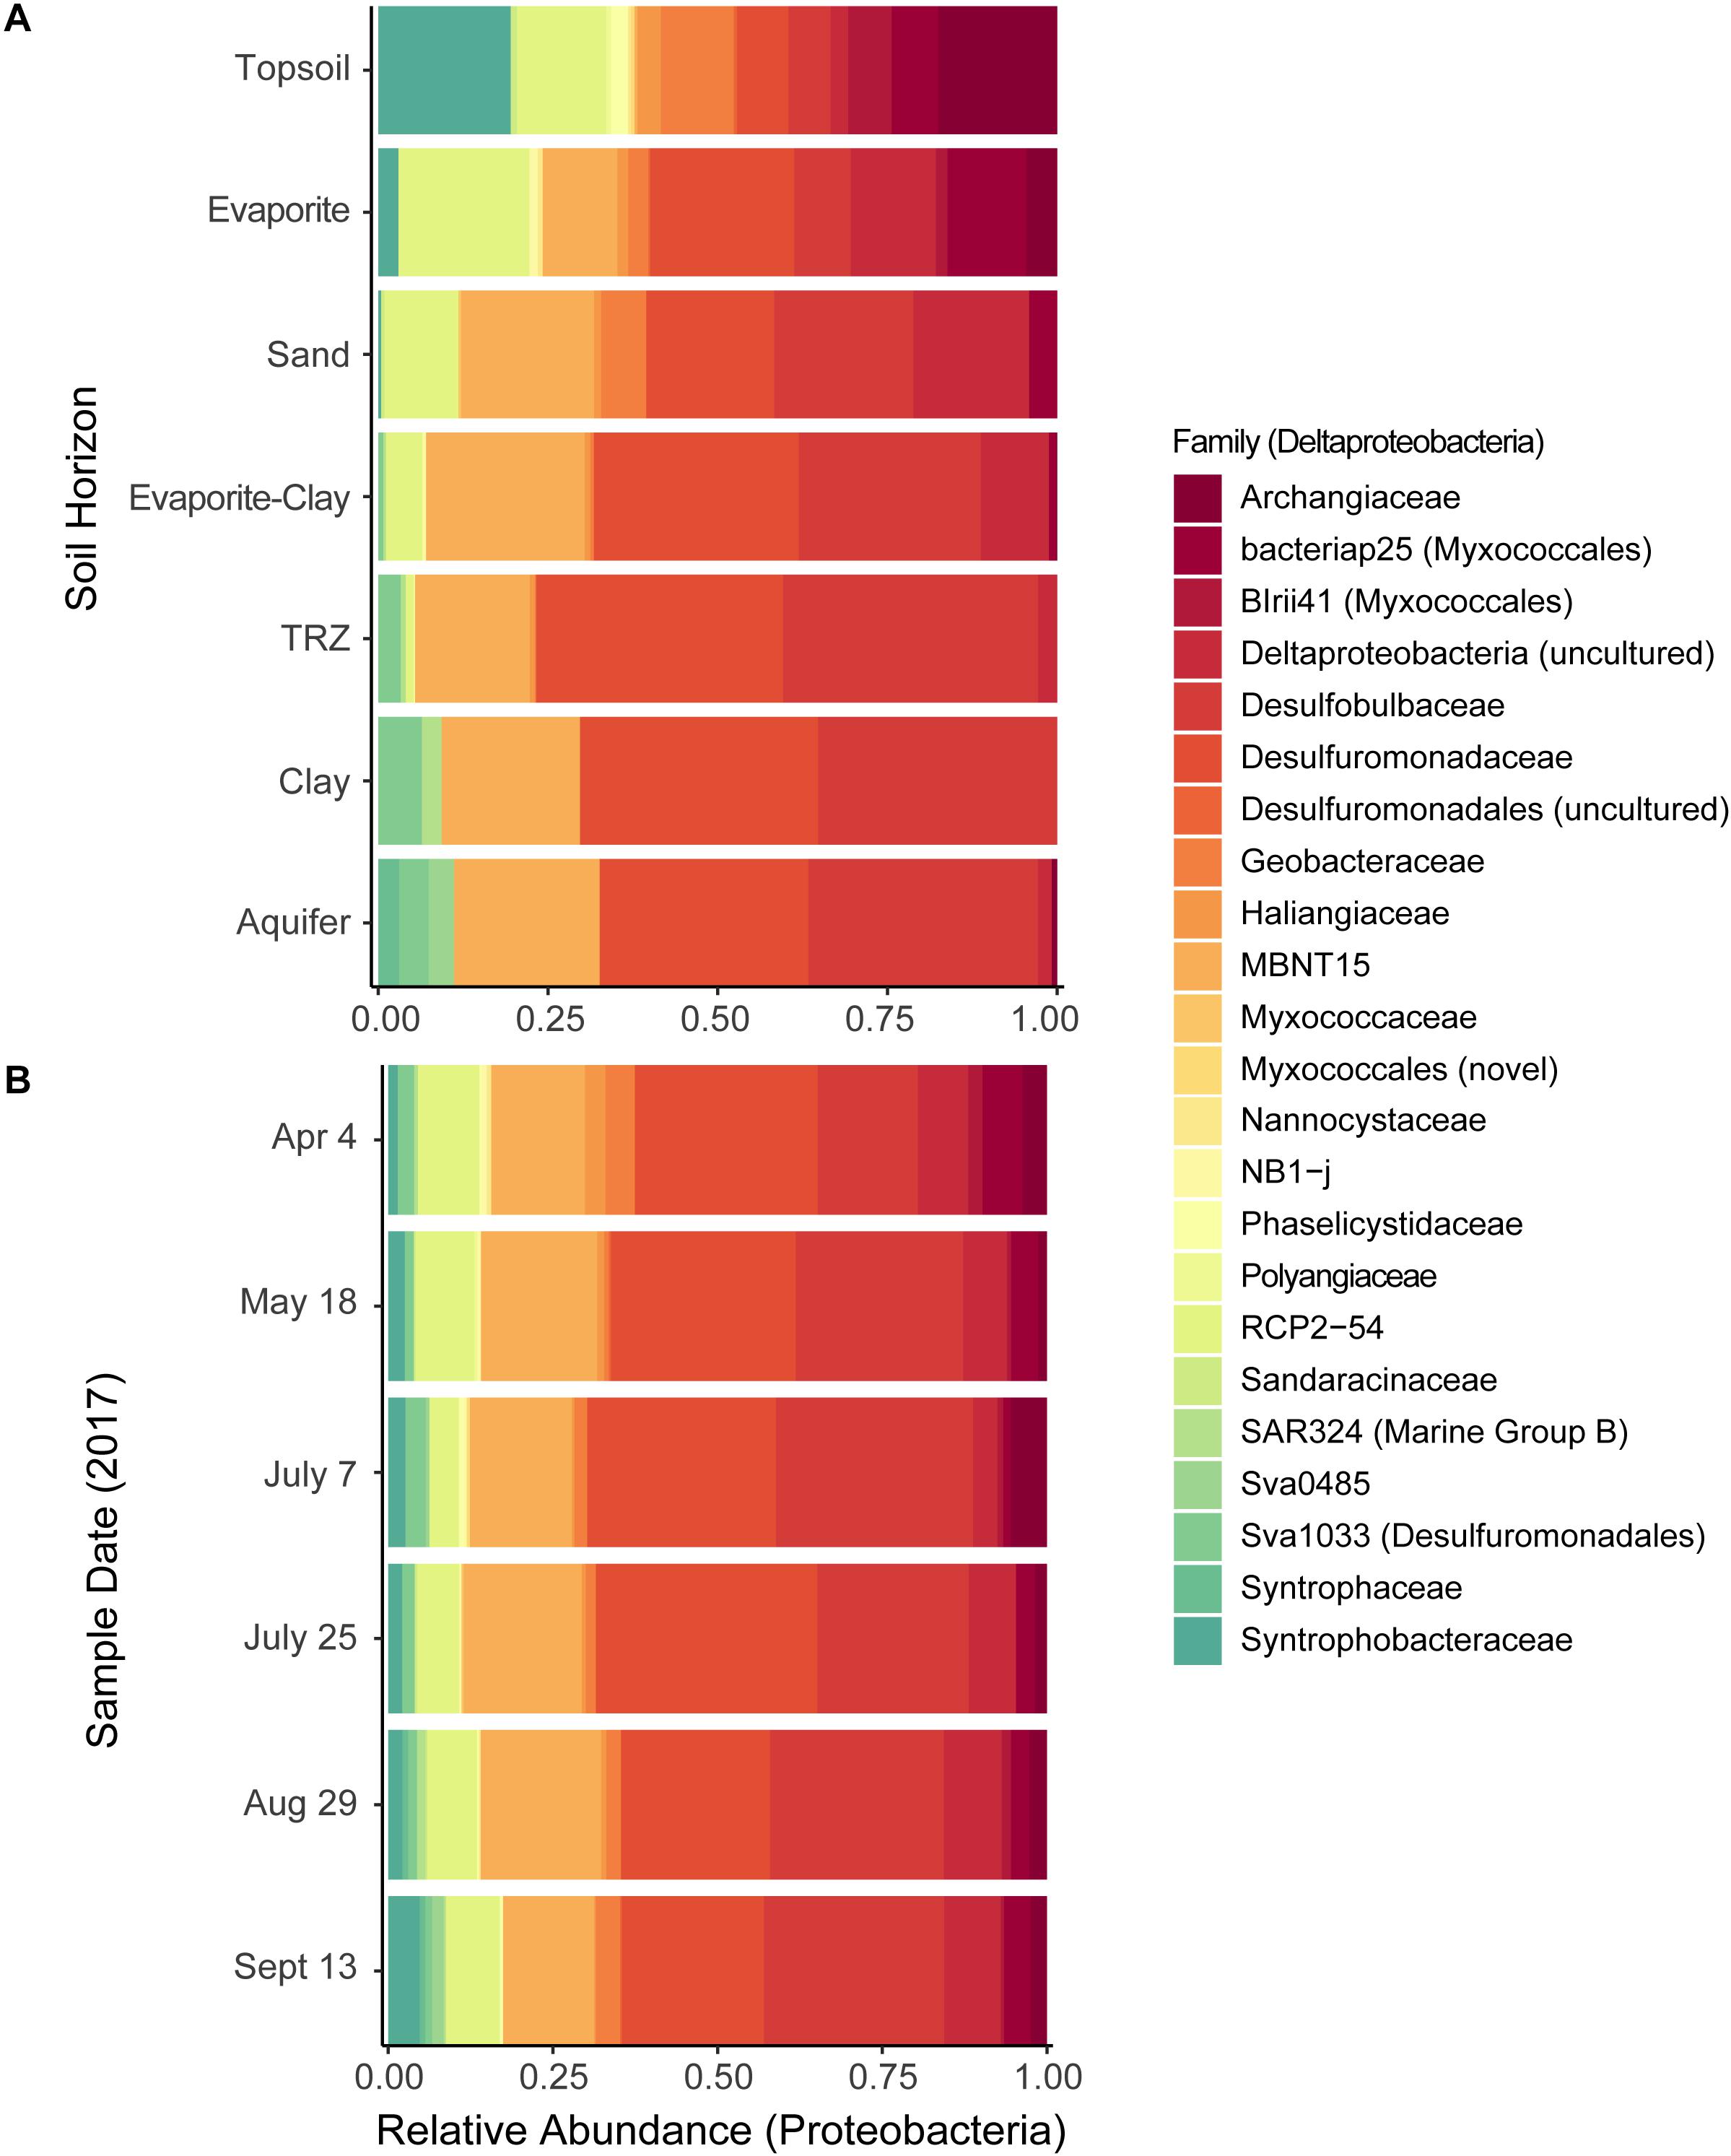
Figure 5. Distribution of Deltaproteobacteria families, grouped by (A) soil horizon or (B) sample date. Relative abundance calculated out of all deltaproteobacterial taxa sequenced.
We also analyzed samples based on a combination of soil horizon and date sampled with AMOVA; this showed that only communities from Evaporite-Clay, TRZ, and Aquifer soil samples were significantly different at the taxa level between sampling periods (Supplementary Table S3). These differences primarily occurred in April (wet) versus July (post-flood), August, and September (dry) communities. Strikingly, communities during snowmelt and the start of drying were the most distinguishable throughout the soil column (AMOVA; April and August, p < 0.05) and the TRZ community remained distinct from other layers in September (Supplementary Table S4).
Although overall separation by soil horizon showed differences in variance between communities (HOMOVA, p < 0.05), pairwise comparisons between layers showed that the center of the soil profile was not significantly different (p = 0.30–0.95) and was therefore stable. In fact, the only significant differences were found with Topsoil and Aquifer communities compared against other layers (HOMOVA, p < 0.01 for all comparisons; Table 1). Interestingly, the direct comparison between Topsoil and Aquifer communities was not significant (p = 0.15), likely caused by the overall difference in taxa between these disparate soil horizons (Figure 6).
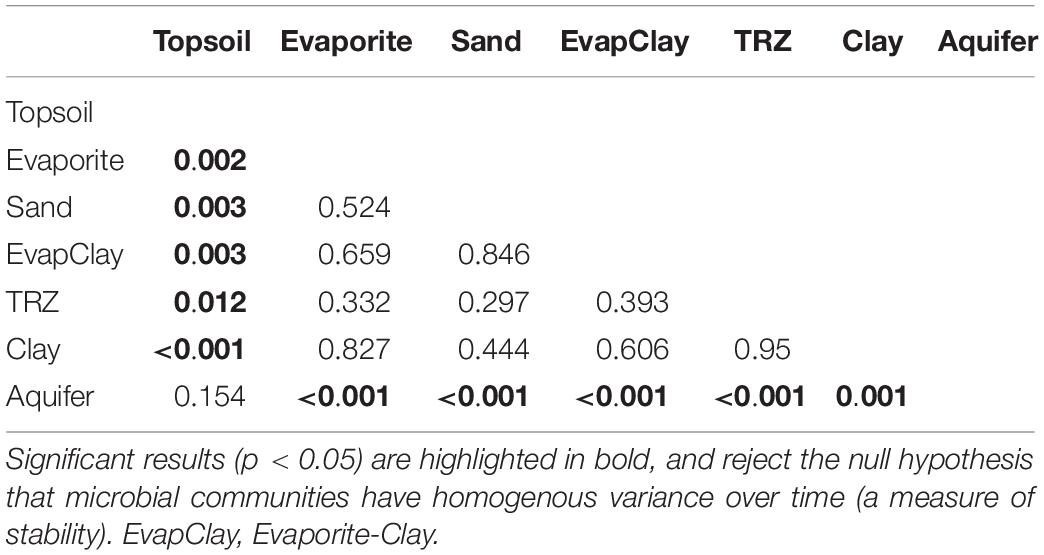
Table 1. Results of homogeneity of molecular variance (HOMOVA) tests on microbial communities classified according to soil horizon.
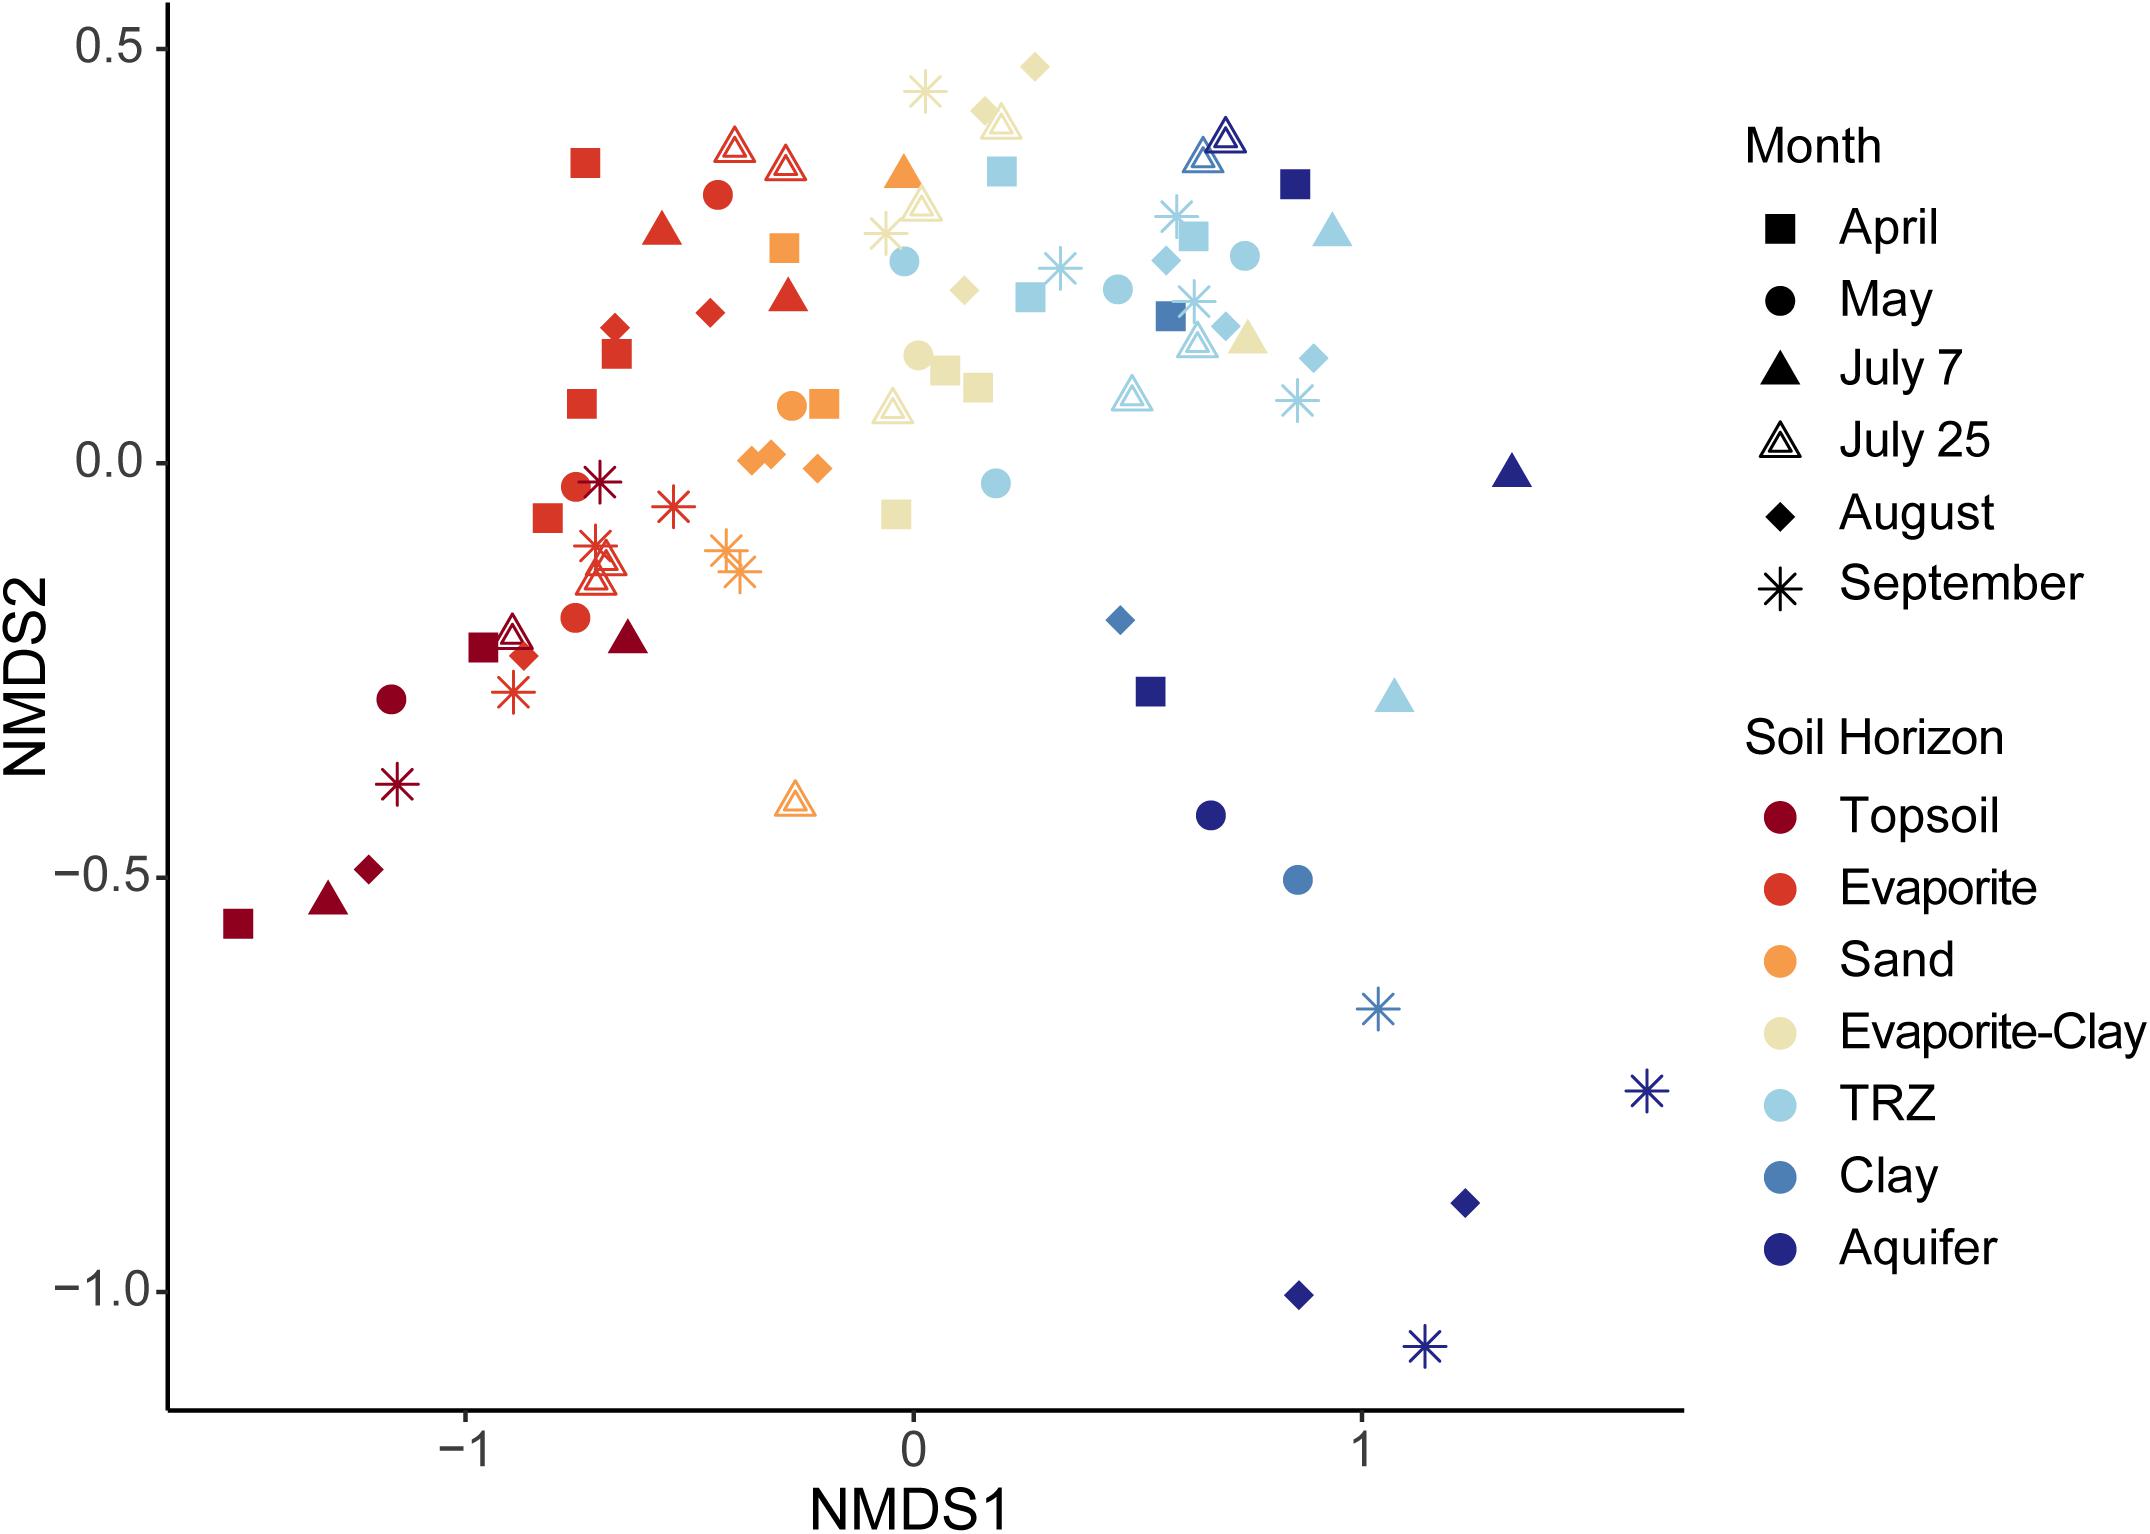
Figure 6. Non-metric multi-dimensional scaling (NMDS) analysis constructed using microbial taxa (OTUs) recovered from each sample. Samples are identified by month sampled (shape) and soil horizon (color). Stress = 0.948.
Whereas communities showed significant differences with depth, sample date could not be used to distinguish samples (HOMOVA, p = 0.20) indicating an overall stable community over time (Supplementary Figure S7). Within individual soil horizons, we were able to see differences more clearly. For example, Evaporite and TRZ communities were overall stable across each month sampled (HOMOVA, p > 0.05), and sand samples only varied from one another significantly post-flood (July; Supplementary Table S3). In contrast, the deepest soil horizons (Clay and Aquifer) as well as the Topsoil were the least stable over time (p < 0.05; Supplementary Table S3). The most stable communities overall appeared to occur in April and September (HOMOVA, p > 0.05; Supplementary Table S4), representing the end members of seasonal hydrological shifts at Riverton, before intense flooding and at the end of the dry season, respectively. We observed the appearance of Firmicutes (Bacilli) in samples from Topsoil, Evaporite, and Sand collected in May and July (flood-influenced months; Supplementary Figure S7). Interestingly, another group within Firmicutes – Clostridia – appeared under drought conditions (August, September), but then within the deepest layers (Clay and Aquifer; Supplementary Figure S7), although overall the Firmicutes exhibited relatively low abundance (1–3% of total community). We also observed increases in relative abundance of Bacteroidetes and a group of unclassified Bacteria in the upper soil layers during this period of flooding. This “unclassified Bacteria” OTU (#40; Supplementary Table S2) does not match known sequences in databases to allow further taxonomic classification, but has been recovered in metagenome sequences from a number of similar floodplain environments (IMG database, Joint Genome Institute3).
Environmental Influence on Microbial Communities
The strongest factor influencing community composition was depth or soil horizon, observed using NMDS (Figures 6, 7A). Other geochemical measurements covarying with depth at Riverton show similar separation of taxa, including soluble U (Figure 7B), soil moisture (Figure 7C), and soluble organic C (Figure 7D).
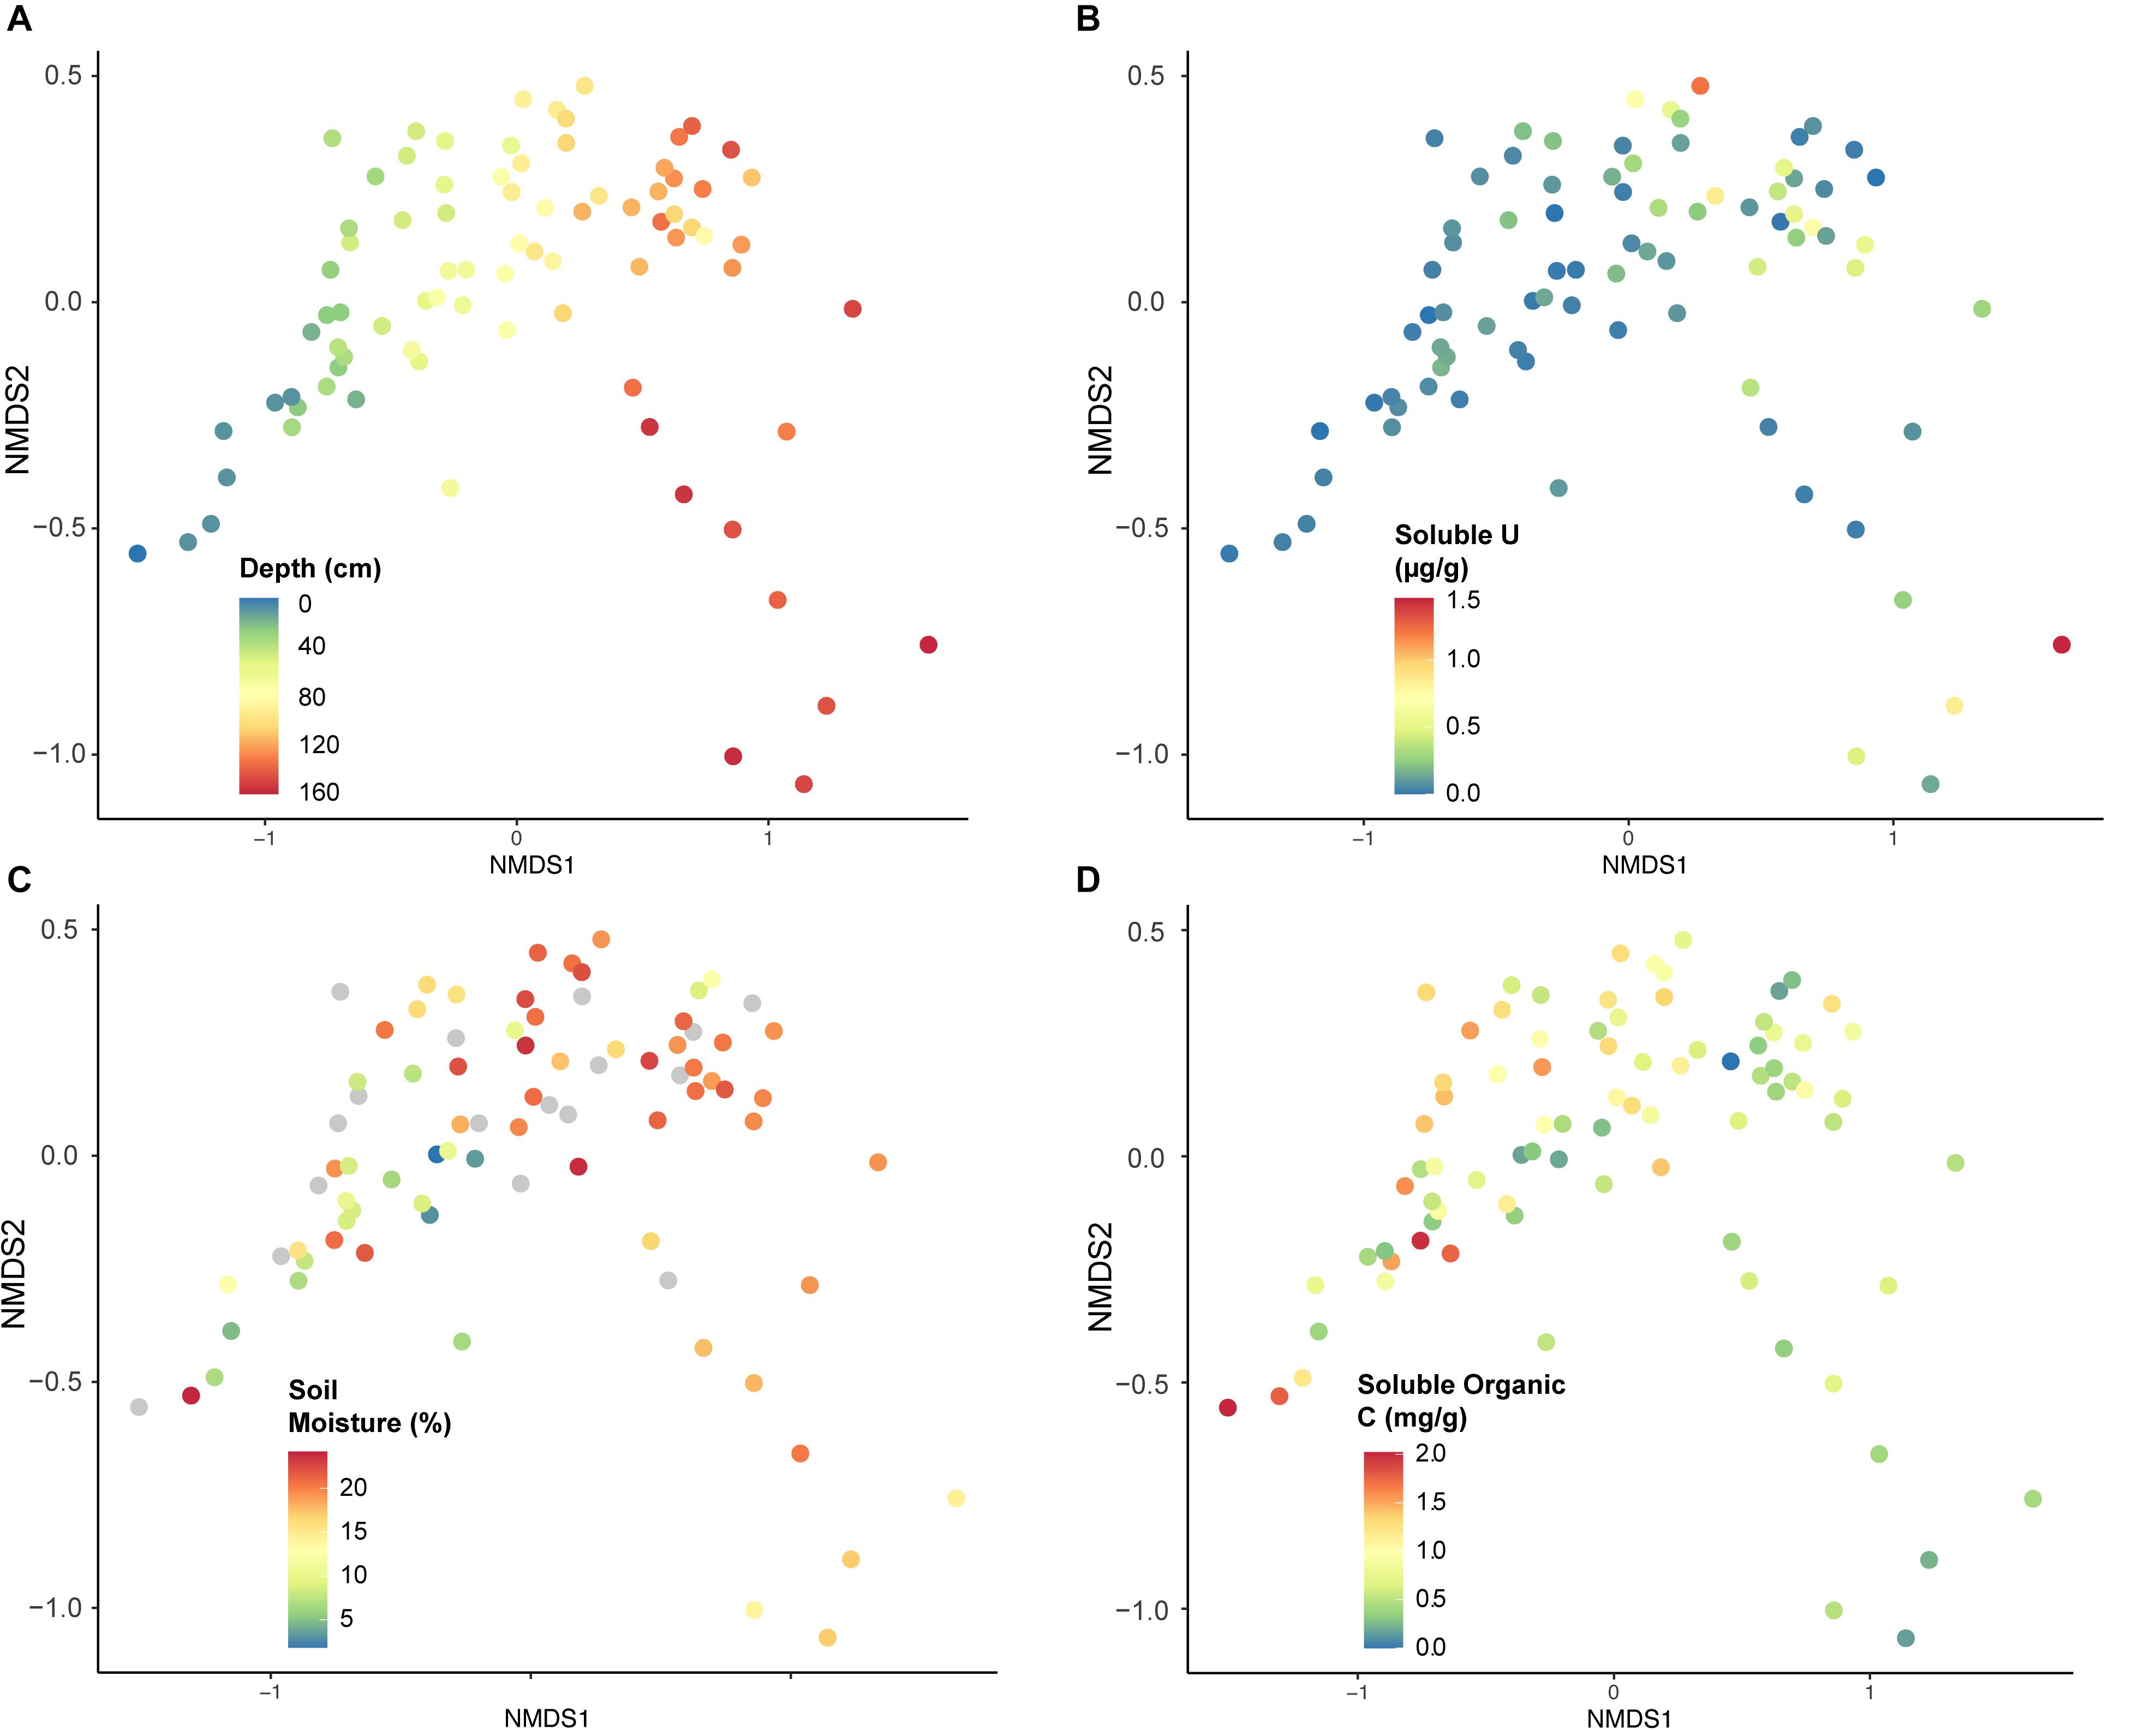
Figure 7. Non-metric multi-dimensional scaling (NMDS) analysis constructed using microbial taxa (OTUs), classified according to geochemical characteristics from each sample: (A) depth (cm), (B) soluble U (μg per g soil), (C) soil moisture (% weight soil), or (D) soluble organic C (mg per g soil). Stress = 0.948.
Using CAP analysis, we were able to investigate microbial community composition patterns overlain with geochemical changes. Depth remained the most significant source of differentiation between communities (Supplementary Figure S8a; r = 0.96); even with depth excluded, a clear separation by soil horizon is still observed across CAP1 (23.7% of variance explained; Supplementary Figure S8b). Using a reduced dataset eliminating covarying variables (Figure 8A), we found that surface layers were defined by increased total and soluble organic C (r = −0.41 for both) along CAP1. Deeper soil communities grouped with higher concentrations of total Na (r = 0.41) and metals – including total and soluble U (r = 0.31 and 0.41, respectively); other factors that covaried and increased with depth included total and soluble Mo and soluble Na. Although samples did not separate as clearly along CAP2 (7.3% variance explained), it appears to indicate samples with increased Fe and U concentrations in the negative direction [HCl-extracted Fe(II), r = −0.57; total U, r = −0.65] and total Na (r = −0.43). In the positive direction, CAP2 represents inorganic C (r = 0.63), total K (r = 0.67), and soluble S (r = 0.33). Analysis of variance (ANOVA) performed on CAP results indicate a significant difference between the separated communities (p < 0.01).
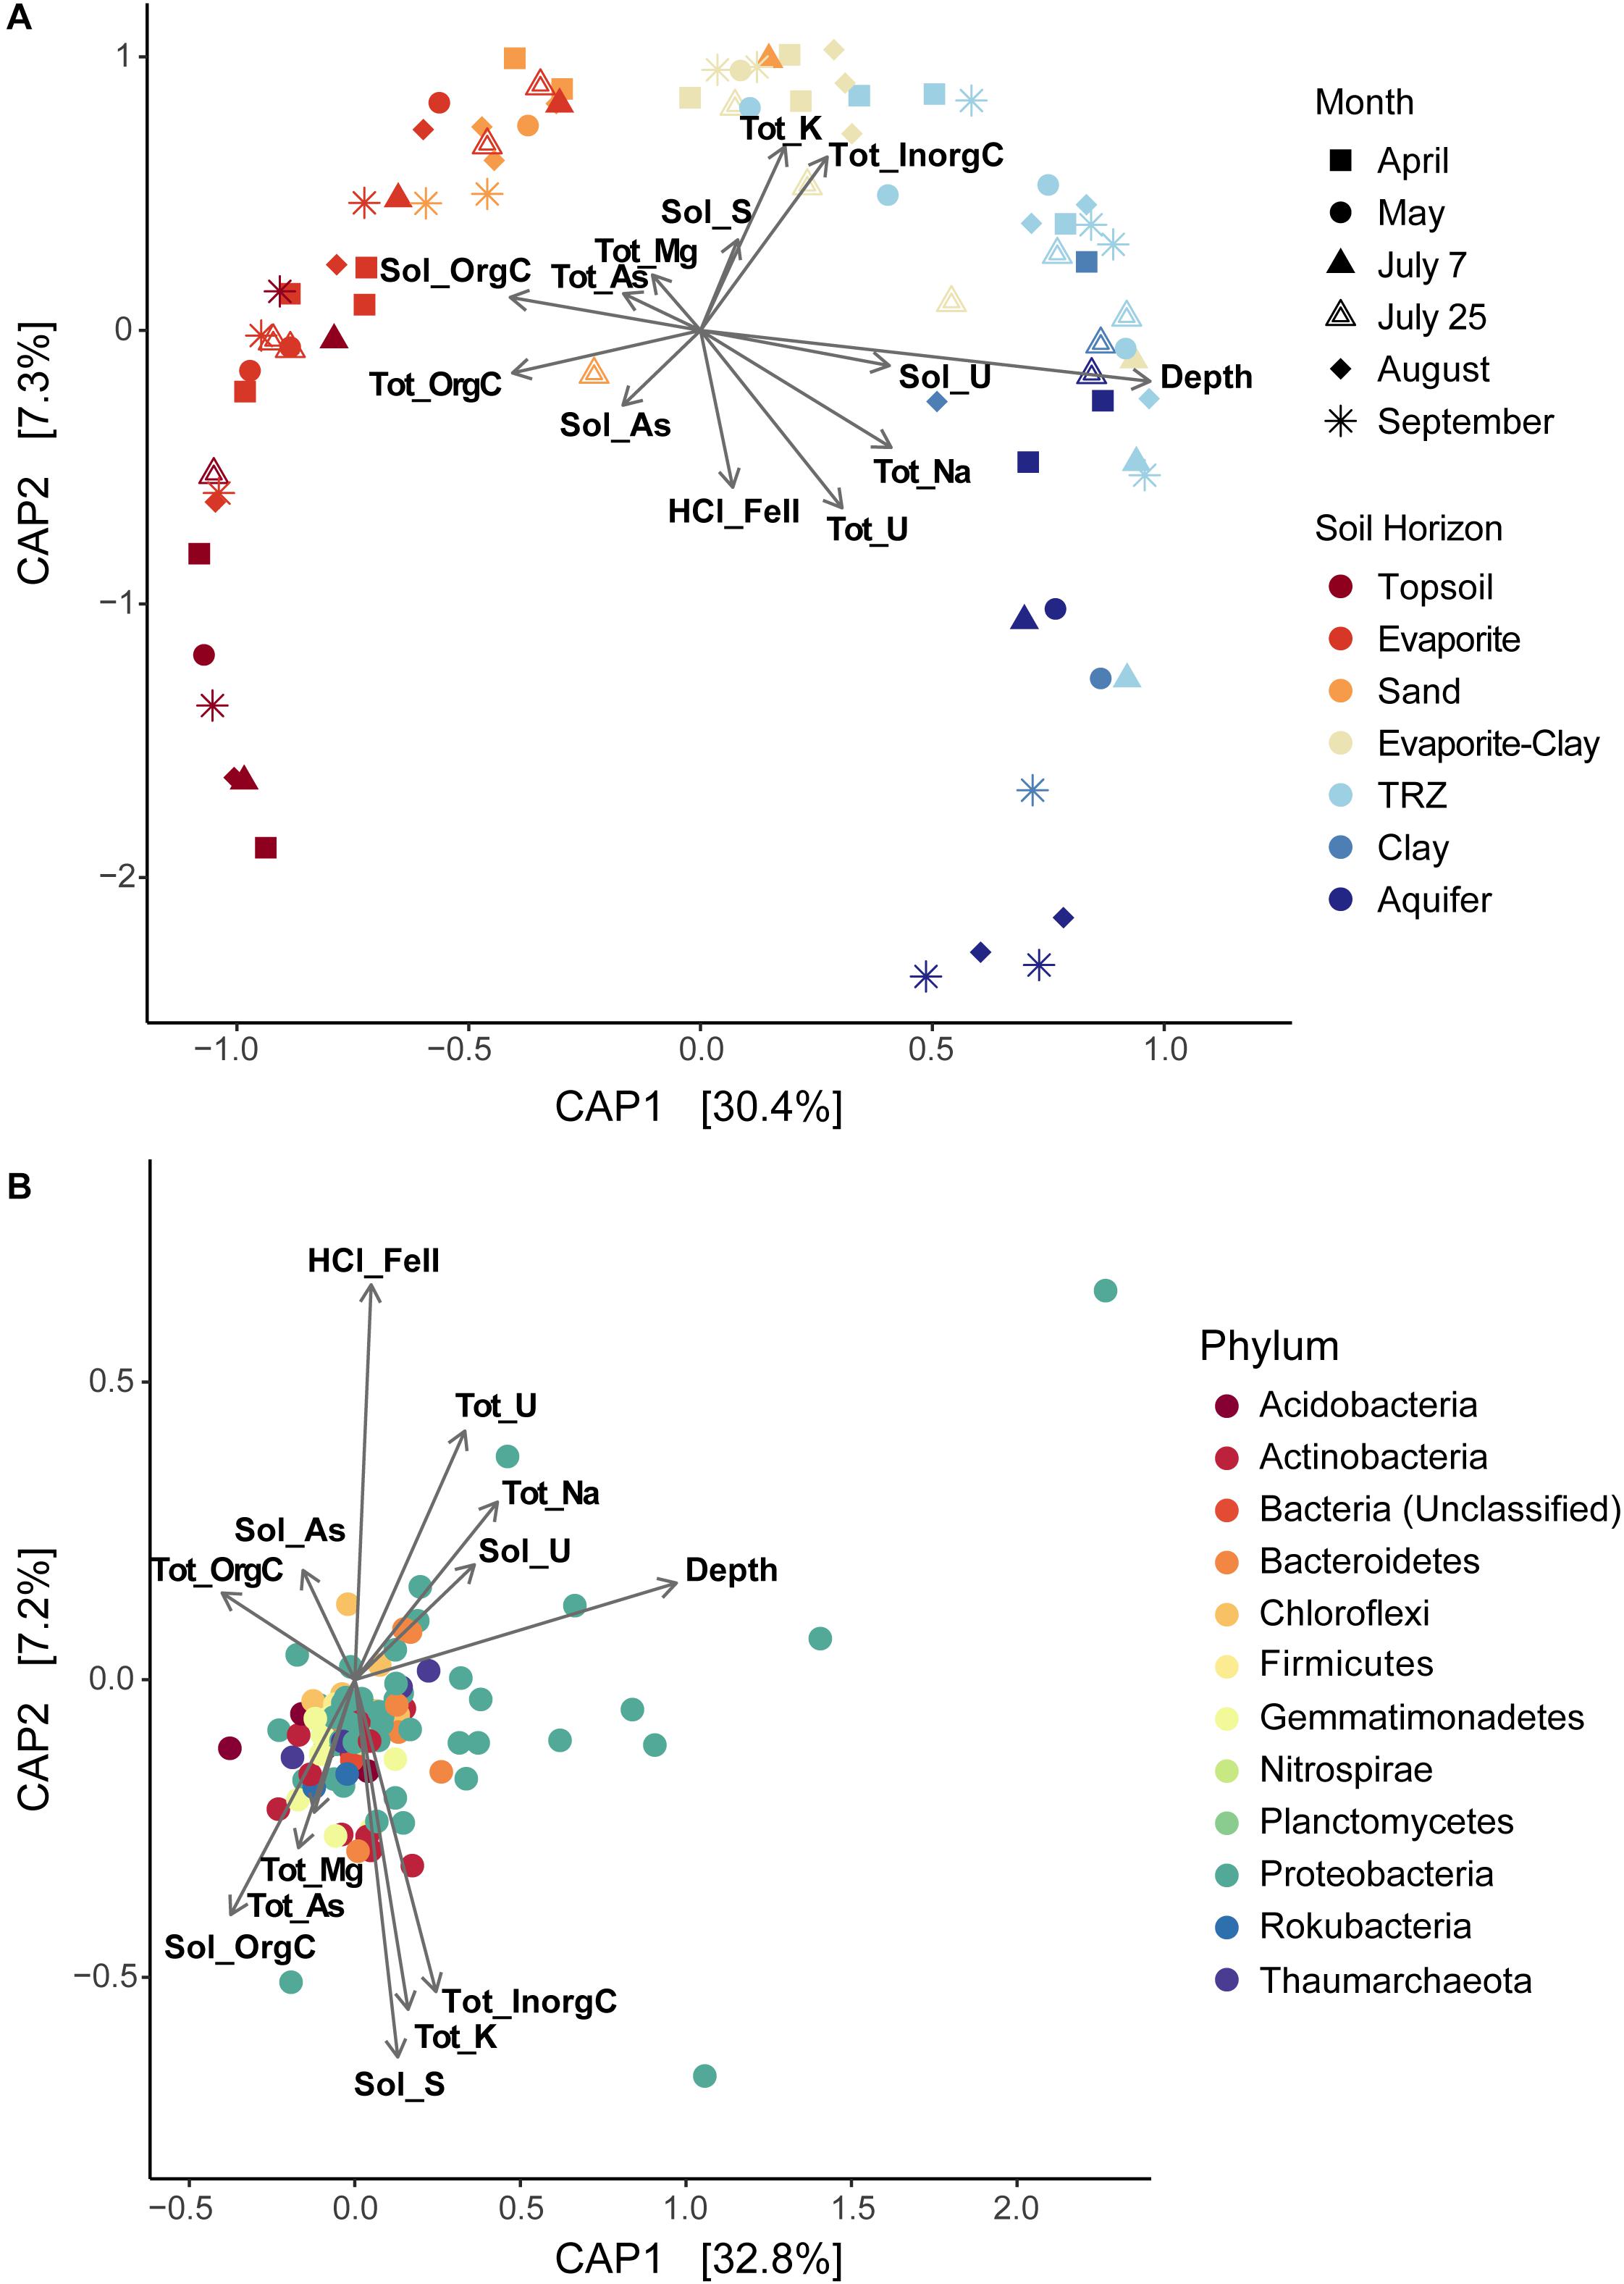
Figure 8. Constrained Analysis of Principal Coordinates (CAP) showing sample distributions based on both microbial and environmental data, plotted as (A) overall differences in diversity among samples or (B) differences between individual taxa (OTUs) from all samples together. Environmental data used in CAP analysis is overlain on each plot, displayed as vectors. Tot, total; Sol, soluble; orgC, organic carbon; inorgC, inorganic (carbonate) carbon; HCl_FeII, acid-extracted Fe(II). Covarying environmental measurements were removed for CAP analysis, including: total C (represented by total organic and inorganic C), soluble Mg and Ca (covaries with total Mg), total Ca (soluble organic C), soluble and total Mo (depth and soluble U), total Fe [HCl-extractable Fe(II)], soluble K and total N (total organic C). Total S was also removed due to low significance.
In order to investigate the impact of soil moisture on communities, we analyzed a reduced dataset that excluded April samples. CAP analysis on this dataset (Supplementary Figure S9) was very similar, and soil moisture contributed primarily to CAP1 (31.6% variance explained; soil moisture, r = 0.53), increasing with depth. Separation between communities was most distinct between the Sand and the Evaporite-Clay (Supplementary Figure S9a) – which we observed to act as a moisture boundary in the Riverton soil column. Total Fe also significantly contributed to CAP1 on the reduced moisture dataset (r = 0.26), and HCl-extracted Fe(II) again comprised a portion (r = 0.53) of CAP2 (8.8% variation explained; Supplementary Figure S9a). Overall, this analysis indicates that moisture and depth play major roles in structuring microbial communities. Samples (and thus microorganisms) from deeper, wetter soil corresponded to higher metal (Fe, Mo, U) and lower nutrient (C, N) concentrations (CAP1), with an additional separation (CAP2; which is not seasonal) driven by increased inorganic C (carbonates) and K versus increased concentrations of Fe and Na.
We also used CAP analysis to investigate the influence of geochemistry on individual taxa (OTUs); this was run with the Top 100 most abundant taxa in our samples using the same variables as the reduced datasets described above. Although most taxa cluster together toward the center – indicating a more cosmopolitan presence throughout the soil column throughout the season – eight Proteobacteria OTUs appear to have been impacted by increased moisture or metal (Fe, U) concentrations (outliers in Figure 8B and Supplementary Figure S9b). Four of these OTUs are affiliated with Deltaproteobacteria – including Desulfobulbaceae and Desulfuromonadaceae families – which we found to be most abundant in deeper layers (TRZ, Clay, Aquifer; 21–24% of total community versus 7–8% in the upper soil layers; Figures 3B, 5A). Three Gammaproteobacteria OTUs (3.8% of the microbial community) were identified as belonging to the S-cycling genera Sulfurifustis (Acidiferrobacteraceae) and Thiobacillus (Hydrogenophilaceae), and the “MND1” group (Nitrosomonadales). The last distinct OTU (#8, Gammaproteobacteria; 1.2% of sequences) aligns apart from the others (Figure 9), defined instead by increased organic C, Mg, and As, and was classified to the genus level as Woesia – a member of the globally abundant marine benthic group found in coastal and deep ocean sediments (Bienhold et al., 2016; Dyksma et al., 2016). In our dataset, this OTU (#8) is most abundant in Evaporite, TRZ, and Evaporite-Clay layers with higher concentrations of soluble organic C and S.
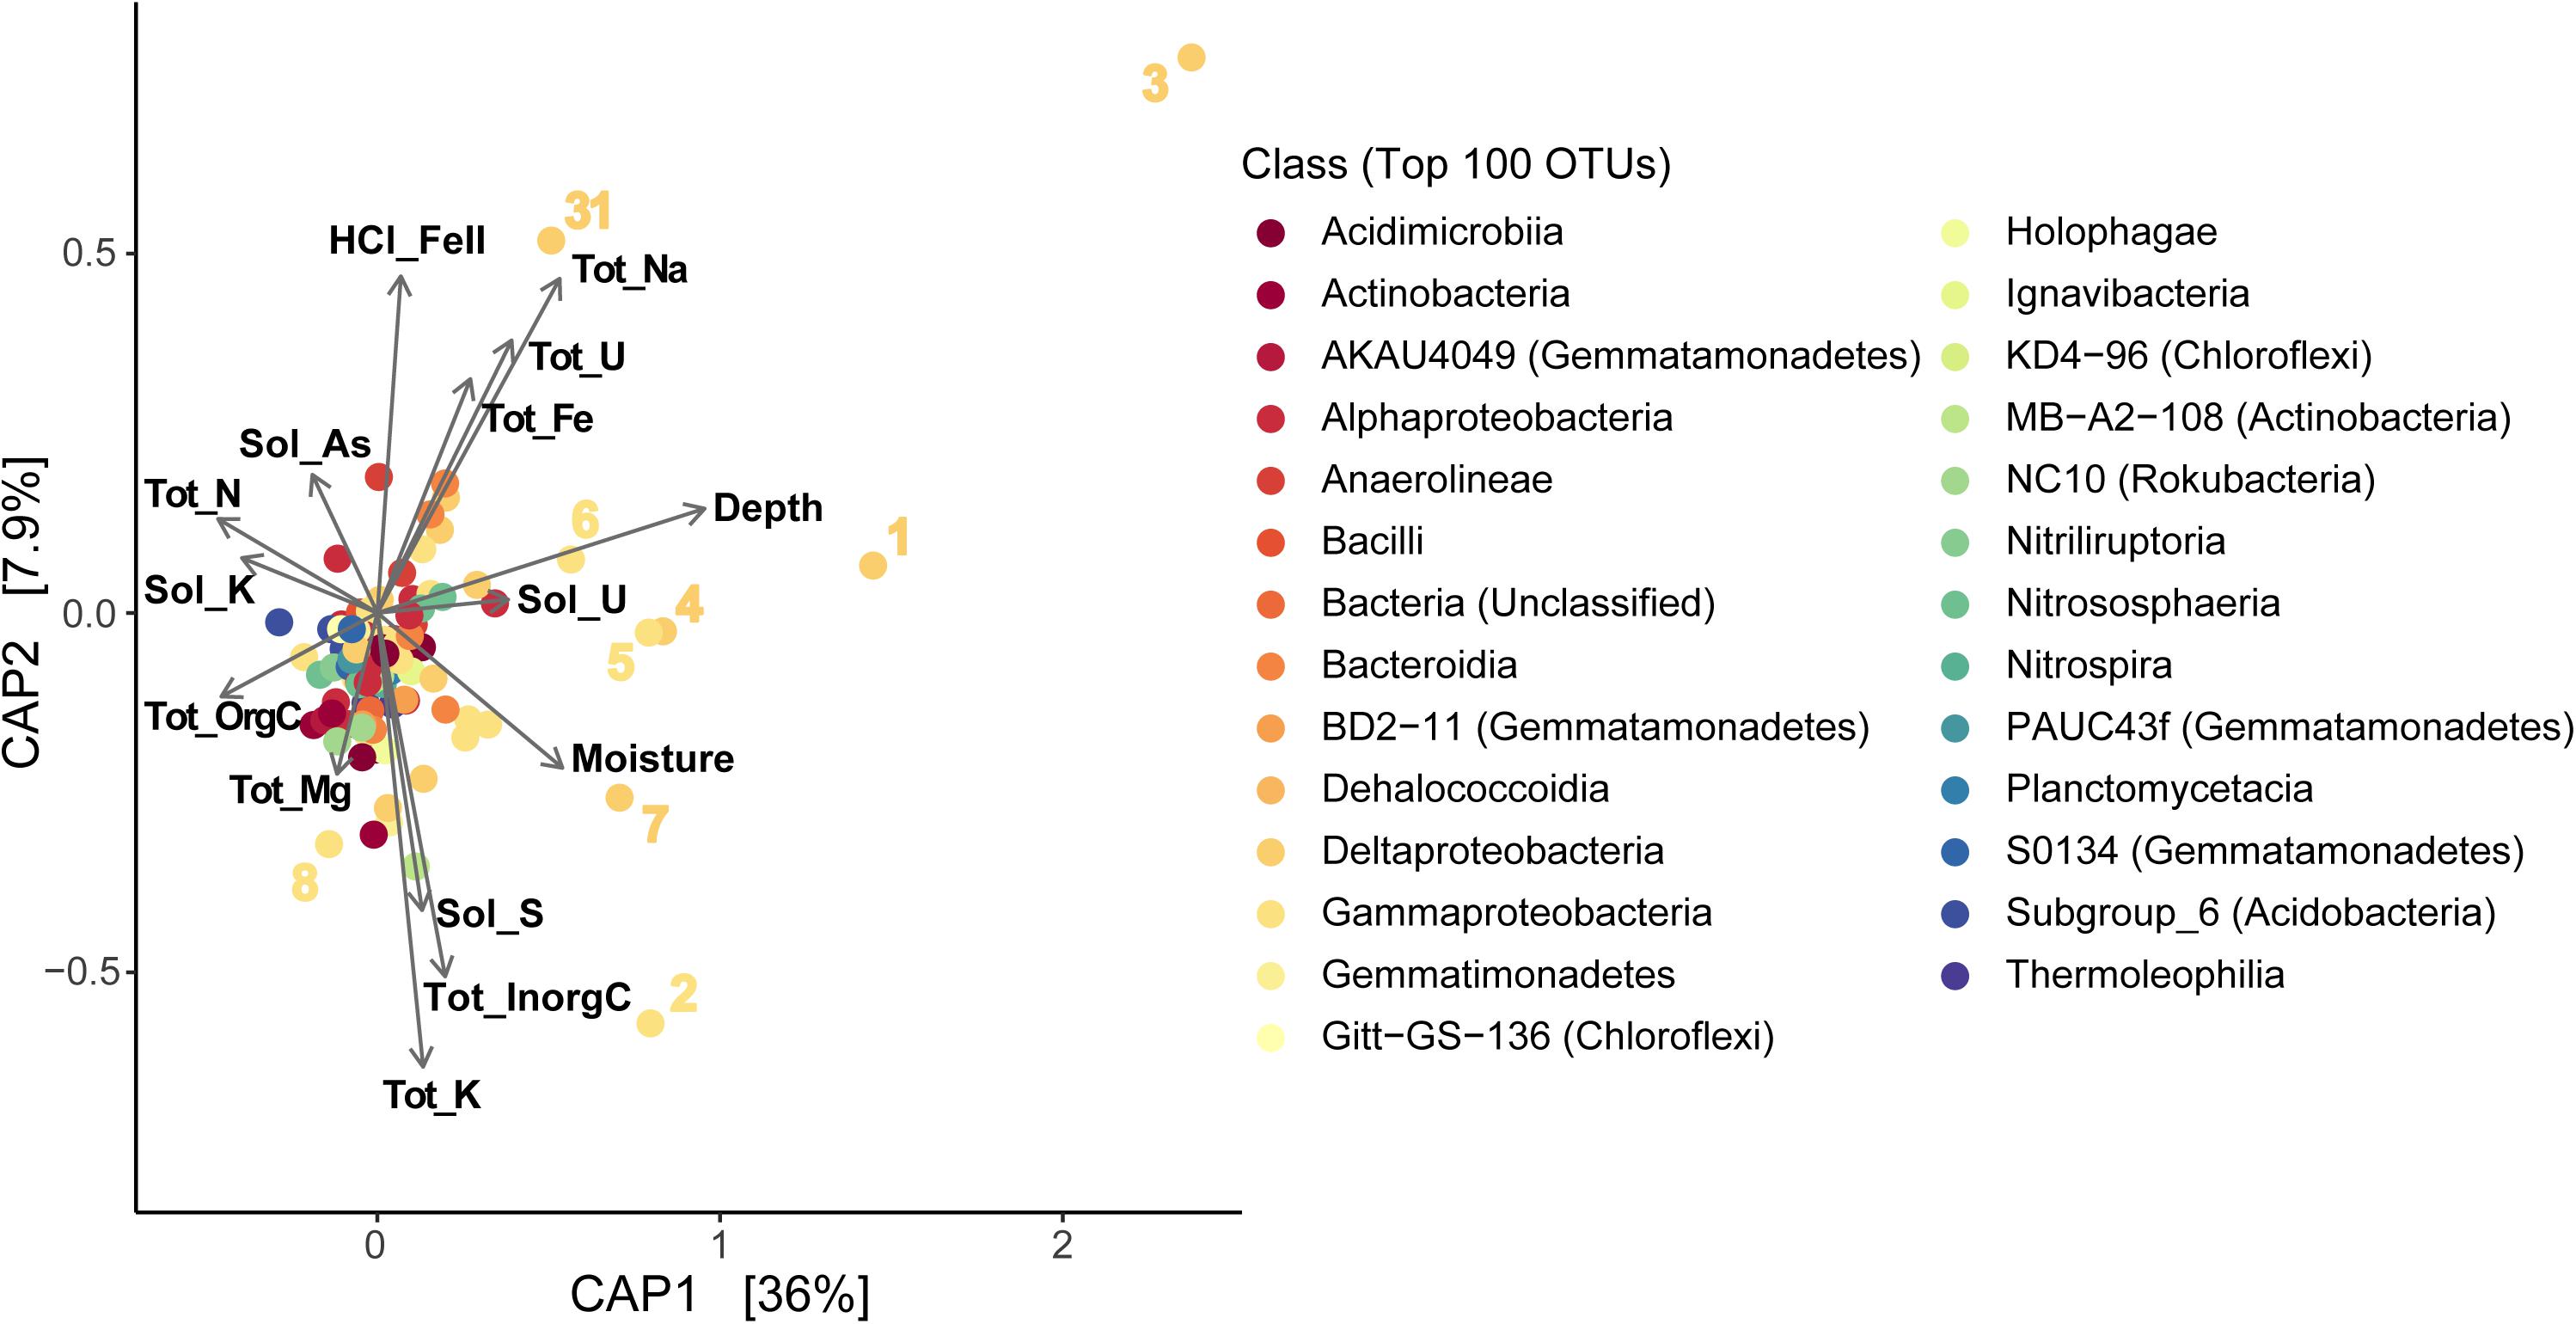
Figure 9. Constrained Analysis of Principal Coordinates (CAP) showing sample distributions based on both microbial and environmental data using a reduced dataset (excluding April samples) to include soil moisture data (as in Supplementary Figure S9b; except that OTUs here are classified at the Class level). Tot, total; Sol, soluble; orgC, organic carbon; inorgC, inorganic (carbonate) carbon; HCl_FeII, acid-extracted Fe(II). Numbers represent the eight OTUs described in more detail in sections “Results” and “Discussion.”
Discussion
Seasonal Trends
The geochemical dynamics observed in both porewater (Figure 1) and solid phase (Supplementary Figures S4, S5) concentrations of Mn, Fe, organic C, and U were clearly linked to hydrological dynamics during the 2017 season at the Riverton site (Figure 1) and likely accentuated by temperature changes and root activity. Although we do not have direct temperature measurements from the layers sampled in this study, data from a nearby in situ sensor array indicate that soil temperature in four depths (corresponding to the Evaporite-Clay, TRZ, Clay, and Aquifer layers, i.e., below ∼1 m depth) increased steadily from April to July and then remained stable in those layers until September (Supplementary Figure S10). However, these same layers also remained moist throughout the season, which would have buffered any temperature changes, whereas shallower layers above the Evaporite-Clay dried quickly and, hence, could be expected to experience a much stronger temperature gradient during the hot summer months.
From April to October 2017, we observed seasonal changes at Riverton typical of U-contaminated floodplains in the Upper Colorado River Basin and neighboring watersheds: spring snowmelt and rain caused water table rise and flooding, producing a spike in porewater (and groundwater) concentrations of U, Fe, Mn, (Figure 1) and other elements (data not shown for this study, but similar trends have previously been reported in e.g., DOE Legacy Management, 2012). This was followed by subsequent drying and a drop in aqueous Fe and Mn concentrations through the summer and fall (Figure 1) – a clear indication of re-oxidation (at least of the pore space sampled by rhizons). However, as noted above, the oxidation of soil layers occurred several weeks after the water table dropped below them, whereas the onset of reducing conditions was almost immediate upon water saturation during the spring flood (Figure 1). This hysteresis effect indicates that the TRZ is considerably more resilient to oxidation than to reduction, as has been noted at other similar sites (Noël et al., 2017a, b, 2019; Dwivedi et al., 2018; Pan et al., 2018). The buffering capacity against re-oxidation has been explained by a combination of slow diffusivity and high oxygen consumption rates driven by microbial respiration of organic C (Pan et al., 2018) and abiotic oxidation of reduced species, such as iron monosulfides, FeS (Noël et al., 2017a, b, 2019). This is likely also the case for the Riverton TRZ where the HCl-extractable Fe(II) increased after the flood (Supplementary Figure S4), indicating an accumulation of “reactive” Fe(II) minerals, such as FeS. The accumulation of Fe(II) over time suggests an increasingly pronounced reducing regime that progressed toward sulfate reduction in soil layers that remained moist throughout the season (Supplementary Figure S4). However, the geochemical data is partially contradicted by simultaneous changes in the microbial community in the top and bottom layers of the profile (Supplementary Figure S7 and Supplementary Table S3), which suggests there may be a discrepancy in terms of perceived changes in redox regimes indicated by geochemical and microbial data. This is discussed further below (see section “Microbial and Geochemical Couplings”).
Microbial Community Dynamics
In surface horizons, seasonal changes in communities were observed at the onset of reducing conditions following snowmelt with the appearance of Firmicutes in Topsoil and Clay layers (Supplementary Figure S7). This could be relevant for U cycling; a column experiment with U-contaminated soil taken from the Rifle, CO, site showed that U(VI) removal only occurred when there was an enrichment of Firmicutes relative to other taxa (Mouser et al., 2015).
Deeper, permanently saturated aquifer sediments are not subjected to the dramatic temporal shifts in soil moisture (and likely temperature) observed in surface layers or the TRZ (Supplementary Figures S4, S10). However, at Riverton the Aquifer horizon interfaces with the gravel bed (i.e., the unconsolidated basal sand, gravel, and cobble alluvium) that is the primary conduit for exchange flows from the river, and it also receives solutes from the overlying unsaturated zone. Thus, hydrological shifts still provoke changes in water composition in this horizon throughout the season. Therefore, it is perhaps not surprising that microbial communities within the Riverton Aquifer exhibited the least stability over time compared to other soil horizons (Supplementary Figure S7; HOMOVA, Supplementary Table S3), even though this is in contrast to previous studies of groundwater communities at the Rifle site (Danczak et al., 2016b). Since the Rifle study examined microorganisms residing deeper in the groundwater (and in an aquifer with less direct connection with the river and the unsaturated zone), this may indicate a difference in seasonal responses in sediment-associated versus planktonic microorganisms as previously suggested (Hug et al., 2015). Other studies from the Rifle site have clearly shown that the influx of oxygenated water and nitrate promote spatially diverse and strongly localized responses in areas of the groundwater aquifer exhibiting fine-grained and organic rich zones (Yabusaki et al., 2017; Dwivedi et al., 2018), i.e., similar to the part of the Riverton Aquifer examined in this study.
The increasing abundance of Firmicutes (Clostridia) in the deeper horizons (Aquifer and bottom Clay) at Riverton in August and/or September likely indicates the presence of anaerobic conditions under which U reduction may occur. This is consistent with the accumulation of solid-phase U in the deeper parts of the soil profile during the same period (Supplementary Figure S5). In contrast, the Nitrospirae taxon related to the nitrite-oxidizing bacterial genus Nitrospira increased during this same period. Although many Nitrospira can be found in low-oxygen (and possibly anoxic) habitats (e.g., Daims et al., 2001), they typically lack a fully anaerobic metabolism (Bock et al., 1995; Ehrich et al., 1995; Koch et al., 2014), so their presence and increased abundance plausibly indicates oxygen intrusion and a reversion from fully anaerobic conditions. Similarly, Thaumarchaeota – the primary ammonia-oxidizing group in this system (Cardarelli et al., 2020) catalyzing the critical step preceding nitrite oxidation during nitrification – having rapidly decreased in abundance post-flood in the four deepest soil layers (July 7; Supplementary Figure S7), recovered in abundance in late summer alongside the observed increase in Nitrospira sp. This suggests a return to nitrifying conditions in late summer, but further activity measurements would be needed to confirm this. In contrast to the post-flood shift in microbial taxa in the Clay and Aquifer horizons, the microbial community composition in the TRZ remained remarkably stable throughout the year (Supplementary Figure S7 and Supplementary Table S3).
We speculate that, in spite of the relatively small changes in microbial community composition, the export of solutes from the TRZ to surrounding layers (in combination with changes in soil moisture) did in fact promote expected metabolic shifts (e.g., between anaerobic/aerobic and responses to increased/decreased metal concentrations). The changes that we did observe in microbial community structure occurred during export and wet/dry transition periods (Supplementary Figure S7 and Supplementary Tables S3, S4), when solutes would be moved vertically between layers. As discussed below (see section “Microbial and Geochemical Couplings”), there are clear indications of coupled, as well as decoupled, microbial and geochemical responses. However, since this dataset focuses on extracted DNA, it cannot distinguish (expressionally) active populations from dormant ones. Thus, it is likely that the Riverton soil profile, which experiences frequent and relatively rapid transitions in soil moisture and redox states, hosts diverse microbial populations that go in and out of dormancy/activity as conditions change; however, such shifts can be difficult to detect using the microbial (and geochemical) approaches used in this study, as discussed below (see section “Microbial and Geochemical Couplings”). Further analysis with RNA transcripts or proteins should elucidate how actual microbial activity responds to seasonal changes in redox conditions resulting from solute exchange and hydrological flux.
Geochemical Dynamics
One of the key driving factors behind the rapid oxygen depletion (i.e., switch to reducing conditions) upon water saturation appears to have been the release and re-distribution of water-soluble organic C relatively evenly throughout the soil profile (July 7 samples, Supplementary Figure S4). Given that water-soluble organic C is the least stable organic matter pool and most likely to stimulate microbial activity (with ensuing oxygen consumption) (Marín-Spiotta et al., 2014; Boye et al., 2017; Fox et al., 2017), this should have promoted a switch to anaerobic respiration. Indeed, this is supported by the release of reduced Mn and Fe to the aqueous phase (Figure 1) and the build-up of reduced Fe in the solid phase (Supplementary Figure S4). However, as mentioned above, this response is not directly reflected in the microbial community composition data, which we interpret as a consequence of the different sensitivities and informational gains that the 16S rRNA sequencing and corresponding geochemical analyses employed here provide. However as discussed below (see section “Microbial and Geochemical Couplings”), these discrepancies may be utilized to advance the understanding of when, where, and to what extent different redox-controlled reactions occur.
In addition to the already discussed microbial and geochemical trends, U mobility is one of the key implications of the hydrological-biogeochemical couplings that occur at the Riverton site and at similar floodplains in the Upper Colorado River Basin and neighboring watersheds. Based on the porewater and solid phase geochemistry, it appears that the U mobilization during the rising water table phase was a matter of dissolution of oxidized U(VI)-containing phases (e.g., evaporite minerals) that had formed during the previous fall/winter/early spring. This mobilization of U resulted in increased aqueous U concentrations in the Aquifer (Figure 1), but it also redistributed solid phase U from coarser-textured layers to the clays (Evaporite-Clay and Clay layers) in addition to the Aquifer (Supplementary Figure S5). Thus, it appears that, in the post-flood period, two different mechanisms were responsible for the accumulation of U – evaporite-associated retention (Looney et al., 2014; Dam et al., 2015; Evaporite-Clay layer) and microbially mediated U(VI) reduction to organic-associated U(IV) (Bone et al., 2017; Clay and Aquifer layers).
Key Microbial Taxa Linked to Geochemical Changes
The importance of microorganisms in mediating key biogeochemical processes in soils is well-documented. Particularly in floodplain soils that host TRZs and other organic-rich layers, microorganisms have been shown to produce compounds that control redox states, and determine solubility and mobility of contaminants, including metals such as Fe and U (Davis et al., 2006; Mouser et al., 2015). Previous work has indicated that these microorganisms may be distributed based on the geochemical environment in which they reside and its respective seasonal changes (Hug et al., 2015; Danczak et al., 2016a; Nelson et al., 2019), and also that microbial metabolisms in groundwater-influenced soils are interconnected and interdependent (Wrighton et al., 2014; Anantharaman et al., 2016).
At Riverton, we observed certain taxa influenced by concentrations of U, Mo, or Fe (Figure 8B and Supplementary Figure S9b). After CAP analysis, eight Proteobacteria OTUs appeared as “outliers” relative to other taxa (Figure 9), separating out farther with increased depth and metal concentration. These include 7 of the 8 most abundant taxa in our entire dataset (over 11% of recovered 16S rRNA sequences), and all were classified as either Delta- and Gamma-proteobacteria. Four of the Deltaproteobacteria were most closely related to known sulfur-reducing families – Desulfobulbaceae (OTU #s 1, 7, 31; 3.5% of total sequences; Galushko and Kuever, 2020) and Desulfuromonaceae (OTU #3, 3.1%; Kuever et al., 2015) – commonly detected in floodplain soils (Wrighton et al., 2014; Danczak et al., 2016a, b; Lavy et al., 2019), while the fifth (OTU #4) was a less-characterized group “MBNT15” (1.6%) that has been found in sediment and bioreactors associated with S cycling and metal cycling (Repert et al., 2014; Rezadehbashi and Baldwin, 2018). Desulfuromonas sp. have also been shown to reduce Fe, in addition to S (Kim et al., 2014).
Two Gammaproteobacteria OTUs – Sulfurifustis (OTU #5) and Thiobacillus (OTU #6) – are involved in sulfur oxidation (Kojima et al., 2015; Boden et al., 2020) and are commonly observed in other aquifers and metal-contaminated soils (Liu et al., 2019; Wegener et al., 2019). A third gammaproteobacterial OTU identified as “MND1” (OTU #2) belongs to the same family as a genus of ammonia-oxidizing Bacteria (AOB; Nitrosomonas). However, it was first described in lake sediments rich in ferromanganous micronodules from Green Bay, WI (Stein et al., 2001), and was hypothesized to be involved in sulfur oxidation. Other studies since have found this group to be abundant in soils with high metal concentrations, including U (Satchanska et al., 2004; Sheik et al., 2012).
An additional OTU of interest, OTU #8 belongs to the genus Woesia and was associated with increased organic C (Figure 9). Genomic evidence from a single isolate and a small number of genomes suggest members of Woeseiaceae are facultative anaerobes with either heterotrophic or chemoautotrophic metabolisms, including partial denitrification to N2O and potentially ferric iron respiration (Du et al., 2016; Mußmann et al., 2017). Further metagenomic sequencing in floodplain soils will be necessary to determine how similar this freshwater sediment group is to its marine relatives.
Importantly, S-cycling organisms (such as those found in the Riverton soil) and their relatives have been shown to mediate redox transformations of Fe and U (Lovely et al., 1993; Fortin et al., 1996; Kwon et al., 2014; Hansel et al., 2015), further highlighting their potential biogeochemical significance within contaminated floodplain soils. Though this cannot yet be verified with 16S rRNA amplicon data alone, it appears that Riverton hosts both established and novel groups of S-, Fe-, and potentially U-cycling organisms.
Microbial and Geochemical Couplings
Depth, and therefore soil horizon/layer, was a stronger contributor than sample date with all analyses performed on this dataset (Figures 2, 6, 7A, 8A). Overall, microbial communities were not significantly different over time (AMOVA, Supplementary Table S3) – indicating the same taxa were present throughout the year but may have been more or less active (as 16S rRNA data does not provide information about activity). Changes we did observe occurred in specific layers, particularly the Topsoil, Clay, and Aquifer horizons (Supplementary Figure S7). This clearly indicates an effect by microorganisms on seasonal changes in geochemistry, especially since differences in microbial community composition were only observed post-flood (or in the case of the Aquifer, during the drought; Supplementary Table S3). Given the vertical locations of these layers (Supplementary Figure S2) relative to the water table, we postulate that the TRZ communities may have profoundly influenced the geochemistry in layers above (during water table rise, transport of microbial products out of TRZ to shallower layers) and below (during receding water table, flushing of microbial products through TRZ to deeper layers). This is supported with the most stable communities residing within TRZ horizons (HOMOVA, Supplementary Table S3). As we observed, the Clay-Evaporite layer forms a moisture boundary within the soil profile, suggesting that precipitation or solute export from the TRZ upward as the water table rises is the primary influence on microbial community composition in Topsoil and Clay horizons. Communities in Topsoil did show clear seasonal changes (Supplementary Table S3), especially with hydrological shifts observed at the site (Figure 1) and accentuated by the largest moisture and temperature fluxes, as well as the prevalence of roots.
Solute transport may also have played a role in the stability of Evaporite and Evaporite-Clay communities (Supplementary Table S3), as these layers already accumulate many of the elements (including metals like U and Fe) transported out of the TRZ with hydrological flux. Therefore, it is reasonable to assume that layers with evaporites consistently contain concentrations of these solutes above some critical threshold that enables microorganisms to maintain their activity. In contrast, communities responding to elevated concentrations of these elements in Sand or Topsoil only overcome such a threshold with intrusion of solutes from TRZ and other layers when the water table rises. This is further supported by the post-flood stability of TRZ, Evaporite, and Evaporite-Clay layers in contrast to all other samples when comparing July 7 and July 25 (Supplementary Table S5); between these sample points, the floodwaters fully receded and upper soil layers completely dried out with the onset of summer drought, indicating that solutes were transported out of the Topsoil and down into the bottom Clay and Aquifer. We know that U and S co-accumulate in reduced sediments including TRZs (Janot et al., 2016; Bone et al., 2017; Noël et al., 2017a) and are spatially coincident in contaminant plumes at Riverton (DOE Legacy Management, 2012). Given that the oxidized states of these elements – U(VI) and sulfate – are much more soluble, redox-active TRZs have the potential to control groundwater concentrations in the Aquifer. Since we did recover a number of abundant S-, Fe-, and U-associated microbial groups from these layers – including Desulfuromonadaceae, Desulfobulbaceae, Thiobacillus, and MND1 – our results suggest that geochemical changes observed were driven in part by microbial communities, in spite of the lack of seasonal signals in the microbial data for the same layers. This implies that geochemical measurements may be more sensitive to seasonal changes in the activity of TRZ microorganisms than 16S rRNA sequencing (which may detect DNA from both active and inactive cells); however, further meta-omic work examining microbial transcripts, proteins, and/or metabolites should provide better insight in temporal changes in these soils.
Importantly, the discrepancies in temporal dynamics between microbial and geochemical data observed in this study tells a story that would not be known unless both types of data had been collected. Based on our dataset, it appears that geochemical data is highly sensitive to detecting the onset of anaerobicity (as implicated by Fe and Mn dissolution, Figure 1), but may overestimate the longevity of reduction as indicated by the prolonged accumulation of HCl-extractable Fe(II) (Supplementary Figure S4) at the end of the season, in spite of the simultaneous increase in relative abundance of aerobes (e.g., Nitrospira sp.). Although 16S rRNA sequencing data is insensitive to rapid changes in microbial metabolic activity and relative abundance is not necessarily linked to activity, a distinct increase in relative abundance is a clear indication of a microbial response to a change in environmental conditions. 16S rRNA data is expected to be less responsive than geochemical data, which explains the lagging response in microbial compared to geochemical data during the onset of anaerobicity. However, we propose that the coincidental increase in abundance of reduced geochemical species and aerobic microbes during the drying period is a reflection of heterogeneous redox conditions occurring simultaneously within a distinct soil horizon that exhibits frequent oscillations between saturated/unsaturated (and relatedly anoxic/oxic) conditions. We further hypothesize that observations indicating both oxic and anoxic redox conditions at a given depth is due to heterogeneous pore size distribution; pores of different sizes within a soil horizon drain and become oxygenated at different “bulk” moisture conditions (i.e., pressures) (O’Geen, 2013; Hu et al., 2018). Hence, a single soil horizon – particularly in clayey and organic-rich soils that typically have a wide range of pore-sizes (O’Geen, 2013; Zaffar and Lu, 2015) – can exhibit co-occurrence of aerobic microbial metabolism with maintenance of anoxic conditions (e.g., protection of oxygen-sensitive FeS) in different pore spaces and between versus inside of aggregates (Renault and Sierra, 1994; Renault and Stengel, 1994; Feng et al., 2002; Keiluweit et al., 2016). Even in water-saturated conditions, the tortuosity and size variability of pores lead to uneven oxygen diffusion rates and, hence, variable oxygenation of pores within the same soil horizon (Fan et al., 2014; Neira et al., 2015; Hu et al., 2018). Finally, differences in seasonal dynamics and stability between microorganisms sampled from soil versus groundwater (Hug et al., 2015; Danczak et al., 2016b; Nelson et al., 2019) imply that a complete view of microbial controls on geochemistry may require both types of samples to be analyzed in floodplain soils, or further work is needed to determine which is more important.
Conclusion
Through this work at the U-contaminated floodplain at Riverton, we found that depth and soil type were the strongest determinants of microbial community composition in floodplain soils (Figures 3, 5A, 6, 8), rather than the time (i.e., season) of sample collection (Figure 5B and Supplementary Figure S6). As we have shown here, distinct functional guilds of microorganisms are distributed in depth-specific patterns corresponding primarily with unsaturated-saturated transitions. The least stable (over the entire sampling season) communities observed were in soil layers with the greatest hydrological and geochemical flux over time (Topsoil and Aquifer), whereas stable communities in the TRZ and Evaporite-Clay layers may have been supported by a “moisture boundary” that slowed transport of water and solutes. Surprisingly, our findings indicate remarkably resilient microbial communities in alluvial soils regardless of extreme seasonal hydrological and geochemical shifts. Thus, these microorganisms may have the capacity to oscillate between “active” and potentially “dormant” depending on the conditions present. Though our dataset investigated 16S rRNA-based microbial diversity, and therefore cannot explicitly distinguish active metabolisms, clues based on changes in abundance or community stability were uncovered. For example, we observed stable S-cycling communities in the TRZ that likely generated solutes transported to neighboring soil layers, where we observed shifts in taxa known to be involved in U- and Fe-transformations.
Biogeochemical behavior following intense hydrological transitions are thought to be governed in large part by the subsurface microbial community response, which is then responsible for ensuing impacts on groundwater quality, including contaminant release and transport. The importance of TRZs to mobility of solutes (including U) and subsequent impacts on biogeochemistry was detected throughout the soil column from April to October 2017. In addition, we observed potential impacts on microbial community composition over time from TRZ-associated discharge upward (during snowmelt and flood-associated water table rise) and downward (from subsequent drainage). This was especially interesting considering time showed no significant impact on other soil layers (Supplementary Table S4).
This study shows that complementing geochemical measurements with 16S rRNA amplicon sequencing data helps elucidate how microbial and geochemical trends are coupled (or decoupled) in space and time. With additional microbial data (e.g., metagenomic and transcriptomic sequencing) that enable characterization of the metabolic capacity and activity of these communities – and pairing with geochemical and hydrological data – we could pinpoint key transition zones and periods of time for a better understanding of these dynamic environments. Ultimately this would provide insights into which reaction mechanisms and kinetics, transport mechanisms (e.g., diffusion, advection), and mobilization mechanisms (e.g., dissolution) are triggered by hydrological events (e.g., infiltration, flooding). This is particularly important within TRZs where transient redox conditions, and fluctuating vertical transport directions combine to create highly complex hydrological-biogeochemical process networks. Our study indicates that high-throughput 16S rRNA sequencing, when combined with geochemical analyses, is an effective approach for screening which biogeochemical processes may be active under different hydrological regimes – information that is critically needed to better understand how seasonal changes impact groundwater quality and contaminant transport.
Data Availability Statement
The datasets presented in this study can be found in online repositories. The names of the repository/repositories and accession number(s) can be found below: NCBI under accession PRJNA626616, ESS DIVE under 10.15485/1631972.
Author Contributions
BT and KB analyzed the data and drafted the manuscript. KB, CB, KM, and JB planned the field campaign and facilitated the sample acquisition efforts. KB and CB collected the samples for processing and processed all geochemical samples. BT processed the molecular samples. JB, CF, and KM obtained the logistical support and acquired funding for the overall project. CF and JB supervised this project and its execution. All authors contributed to the article and approved the submitted version.
Funding
Funding for this research was provided by the Department of Energy (DOE) office of Biological and Environmental Research (BER), Climate and Environmental Sciences Division, Subsurface Biogeochemistry Activity through its support of the SLAC Groundwater Quality Science Focus Area (SFA) program (Contract No. DE-AC02-76SF00515), as well as contract DESC0019119 to CF. SSRL and SLAC are supported by the United States Department of Energy, Office of Science, Office of Basic Energy Sciences.
Conflict of Interest
The authors declare that the research was conducted in the absence of any commercial or financial relationships that could be construed as a potential conflict of interest.
Acknowledgments
We thank the Northern Arapaho Natural Resources Office for field access and support, especially R. Ortiz, S. Babits, and D. Goggles. Additional support was provided by the DOE office of Legacy Management (LM) and Navarro Research and Engineering, Inc., especially W. Frazier, S. Campbell, and R. L. Johnson. We thank L. Spielman and A. Ederer for sample processing for this project, with support from the Stanford Earth Summer Undergraduate Research (SESUR) and Stanford’s Summer Undergraduate Research in Geoscience and Engineering (SURGE) Programs. Amplicon sequencing was done through the Georgia Genomics and Bioinformatics Core, with assistance from M. Albady, M. Howard, and N. Workman.
Supplementary Material
The Supplementary Material for this article can be found online at: https://www.frontiersin.org/articles/10.3389/feart.2020.00338/full#supplementary-material
Footnotes
- ^ https://waterdata.usgs.gov/usa/nwis/uv?site_no=06235500
- ^ http://dna.uga.edu
- ^ https://img.jgi.doe.gov
References
Anantharaman, K., Brown, C. T., Hug, L. A., Sharon, I., Castelle, C. J., Probst, A. J., et al. (2016). Thousands of microbial genomes shed light on interconnected biogeochemical processes in an aquifer system. Nat. Commun. 7:13219. doi: 10.1038/ncomms13219
Baldwin, D. S., and Mitchell, A. M. (2000). The effects of drying and re-flooding on the sediment and soil nutrient dynamics of lowland river-floodplain systems: a synthesis. Regul. River 16, 457–467. doi: 10.1002/1099-1646(200009/10)16:5<457::aid-rrr597>3.0.co;2-b
Bargar, J. R., Williams, K. H., Campbell, K. M., Long, P. E., Stubbs, J. E., Suvorova, E. I., et al. (2013). Uranium redox transition pathways in acetate-amended sediments. Proc. Natl. Acad. Sci. U.S.A. 110, 4506–4511. doi: 10.1073/pnas.1219198110
Bienhold, C., Zinger, L., Boetius, A., and Ramette, A. (2016). Diversity and biogeography of bathyal and abyssal seafloor bacteria. PLoS One 11:e0148016. doi: 10.1371/journal.pone.0148016
Blazejewski, G. A., Stolt, M. H., Gold, A. J., Gurwick, N. P., and Groffman, P. M. (2009). Spatial distribution of carbon in the subsurface of riparian zones. Soil Sci. Soc. Am. J. 73, 1733–1740. doi: 10.2136/sssaj2007.0386
Boano, F., Harvey, J. W., Marion, A., Packman, A. I., Revelli, R., Ridolfi, L., et al. (2014). Hyporheic flow and transport processes: mechanisms, models, and biogeochemical implications. Rev. Geophys. 52, 603–679. doi: 10.1002/2012RG000417
Bock, E., Schmidt, I., Stüven, R., and Zart, D. (1995). Nitrogen loss caused by denitrifying Nitrosomonas cells using ammonia or hydrogen as electron donors and nitrite as electron acceptor. Arch. Microbiol. 163, 16–20. doi: 10.1007/BF00262198
Boden, R., Hutt, L. P., and Rae, A. (2020). “Thiobacillus,” in Bergey’s Manual of Systematics of Archaea and Bacteria, eds W. B. Whitman, F. Rainey, P. Kämpfer, M. Trujillo, J. Chun, P. DeVos, et al. (Chichester: John Wiley & Sons).
Bone, S. E., Dynes, J. J., Cliff, J., and Bargar, J. R. (2017). Uranium(IV) adsorption by natural organic matter in sediments. Proc. Natl. Acad. Sci. U.S.A. 114, 711–716. doi: 10.1073/pnas.1611918114
Boyanov, M. I., Fletcher, K. E., Kwon, M. J., Rui, X., O’Loughlin, E. J., Löffler, F. E., et al. (2011). Solution and microbial controls on the formation of reduced U(IV) species. Environ. Sci. Technol. 45, 8336–8344. doi: 10.1021/es2014049
Boye, K., Noël, V., Tfaily, M., Cardarelli, E. L., Bone, S. E., Williams, K. H., et al. (2017). Thermodynamically controlled preservation of organic carbon in floodplains. Nat. Geosci. 10, 415–419. doi: 10.1038/ngeo2940
Burt, T. P., Pinay, G., Matheson, F. E., Haycock, N. E., Butturini, A., Clement, J.-C., et al. (2002). Water table fluctuations in the riparian zone: comparative results from a pan-european experiment. J. Hydrol. 265, 129–148. doi: 10.1016/s0022-1694(02)00102-6
Campbell, K. M., Kukkadapu, R. K., Qafoku, N. P., Peacock, A. D., Lesher, E., Williams, K. H., et al. (2012). Geochemical, mineralogical and microbiological characteristics of sediment from a naturally reduced zone in a uranium-contaminated aquifer. Appl. Geochem. 27, 1499–1511. doi: 10.1016/j.apgeochem.2012.04.013
Cardarelli, E. L., Bargar, J. R., and Francis, C. A. (2020). Diverse Thaumarchaeota dominate subsurface ammonia-oxidizing communities in semi-arid floodplains in the Western United States. Microb. Ecol. doi: 10.1007/s00248-020-01534-5
Carlyle, G. C., and Hill, A. R. (2001). Groundwater phosphate dynamics in a river riparian zone: effects of hydrologic flowpaths, lithology, and redox chemistry. J. Hydrol. 247, 151–168. doi: 10.1016/s0022-1694(01)00375-4
Chudasma, B., Porwal, A., González-Álvarez, I., Thakur, S., Wilde, A., and Kreuzer, O. P. (2018). Calcrete-hosted surficial uranium systems in Western Australia: prospectivity modeling and quantitative estimates of resources. Part 1 – Origin of calcrete uranium deposits in surficial environments: a review. Ore Geol. Rev. 102, 906–936. doi: 10.1016/j.oregeorev.2018.04.024
Daims, H., Nielsen, J. L., Nielsen, P. H., Schleifer, K.-H., and Wagner, M. (2001). In situ characterization of nitrospira-like nitrite-oxidizing bacteria active in wastewater treatment plants. Appl. Environ. Microbiol. 67, 5273–5284. doi: 10.1128/AEM.67.11.5273-5284.2001
Dam, W. L., Campbell, S., Johnson, R. H., Looney, B. B., Denham, M. E., Eddy-Dilek, C. A., et al. (2015). Refining the site conceptual model at a former uranium mill site in Riverton, Wyoming, USA. Environ. Earth Sci. 74, 7255–7265. doi: 10.1007/s12665-015-4706-y
Dam, W. L., Gil, A., Johnson, R. H., Campbell, S., Bargar, J. R., and Picel, M. (2017). “Long-term stewardship at a former uranium mill tailings site in Riverton, Wyoming - 17090,” in Proceedings of the Conference WM2017, Phoenix, AZ.
Danczak, R. E., Sawyer, A. H., Williams, K. H., Stegen, J. C., Hobson, C., and Wilkins, M. J. (2016a). Seasonal hyporheic dynamics control coupled microbiology and geochemistry in Colorado River sediments. J. Geophys. Res. Biogeosci. 121, 2976–2987. doi: 10.1002/2016JG003527
Danczak, R. E., Yabusaki, S. B., Williams, K. H., Fang, Y., Hobson, C., and Wilkins, M. J. (2016b). Snowmelt induced hydrologic perturbations drive dynamic microbiological and geochemical behaviors across a shallow riparian aquifer. Front. Earth Sci. 4:57. doi: 10.3389/feart.2016.00057
Davis, J. A., Curtis, G. P., Wilkins, M. J., Kohler, M., Fox, P., Naftz, D. L., et al. (2006). Processes affecting transport of uranium in a suboxic aquifer. Phys. Chem. Earth 31, 548–555. doi: 10.1016/j.pce.2006.04.005
Devito, K. J., Fitzgerald, D., Hill, A. R., and Aravena, R. (2000). Nitrate dynamics in relation to lithology and hydrologic flow path in a river riparian zone. J. Environ. Qual. 29, 1075–1084. doi: 10.2134/jeq2000.00472425002900040007x
DOE Legacy Management (2012). Evaluation of Groundwater Constituents and Seasonal Variation at the Riverton, Wyoming, Processing Site. Grand Junction, CO: DOE Legacy Management.
Du, Z.-J., Wang, Z.-J., Zhao, J.-X., and Chen, G.-J. (2016). Woeseia oceani gen. nov., sp. nov., a chemoheterotrophic member of the order Chromatiales, and proposal of Woeseiaceae fam. nov. Int. J. Syst. Evol. Microbiol. 66, 107–112. doi: 10.1099/ijsem.0.000683
Dwivedi, D., Arora, B., Steefel, C. I., Dafflon, B., and Versteeg, R. (2018). Hot spots and hot moments of nitrogen in a riparian corridor. Water Resour. Res. 54, 205–222. doi: 10.1002/2017WR022346
Dyksma, S., Bischof, K., Fuchs, B. M., Hoffmann, K., Meier, D., Meyerdierks, A., et al. (2016). Ubiquitous Gammaproteobacteria dominate dark carbon fixation in coastal sediments. ISME J. 10, 1939–1953. doi: 10.1038/ismej.2015.257
Ehrich, S., Behrens, D., Lebedeva, E., Ludwig, W., and Bock, E. (1995). A new obligately chemolithoautotrophic, nitrite-oxidizing bacterium, Nitrospira moscoviensis sp. nov. and its phylogenetic relationship. Arch. Microbiol. 164, 16–23. doi: 10.1007/BF02568729
Fan, Z., Neff, J. C., Waldrop, M. P., Ballantyne, A. P., and Turetsky, M. R. (2014). Transport of oxygen in soil pore-water systems: implications for modeling emissions of carbon dioxide and methane from peatlands. Biogeochemistry 121, 455–470. doi: 10.1007/s10533-014-0012-0
Feng, G., Wu, L., and Letey, J. (2002). Evaluating aeration criteria by simultaneous measurement of oxygen diffusion rate and soil-water regime. Soil Sci. 167, 495–503. doi: 10.1097/00010694-200208000-00001
Ford, R. G., Bertsch, P. M., and Farley, K. J. (1997). Changes in transition and heavy metal partitioning during hydrous iron oxide aging. Environ. Sci. Technol. 31, 2028–2033. doi: 10.1021/es960824
Fortin, D., Davis, B., and Beveridge, T. J. (1996). Role of Thiobacillus and sulfate-reducing bacteria in iron biocycling in oxic and acidic mine tailings. FEMS Microbiol. Ecol. 21, 11–24. doi: 10.1111/j.1574-6941.1996.tb00329.x
Fox, P. M., Nico, P. S., Tfaily, M. M., Heckman, K., and Davis, J. A. (2017). Characterization of natural organic matter in low-carbon sediments: extraction and analytical approaches. Organic Geochem. 114, 12–22. doi: 10.1016/j.orggeochem.2017.08.009
Galushko, A., and Kuever, J. (2020). “Desulfobulbaceae,” in Bergey’s Manual of Systematics of Archaea and Bacteria, eds M. E. Trujillo, S. Dedysh, P. DeVos, B. Hedlund, P. Kämpfer, F. Rainey, et al. (Chichester: John Wiley & Sons).
Gurwick, N. P., Groffman, P. M., Yavitt, J. B., Gold, A. J., Blazejewski, G. A., and Stolt, M. H. (2008). Microbially available carbon in buried riparian soils in a glaciated landscape. Soil Biol. Biogeochem. 40, 85–96. doi: 10.1016/j.soilbio.2007.07.007
Hansel, C. M., Lentini, C. J., Tang, Y., Johnston, D. T., Wankel, S. D., and Jardine, P. M. (2015). Dominance of sulfur-fueled iron oxide reduction in low-sulfate freshwater sediments. ISME J. 9, 2400–2412. doi: 10.1038/ismej.2015.50
Hauer, F. R., Locke, H., Dreitz, V. J., Hebblewhite, M., Lowe, W. H., Muhlfeld, C. C., et al. (2016). Gravel-bed river floodplains are the ecological nexus of glaciated mountain landscapes. Sci. Adv. 2:e1600026. doi: 10.1126/sciadv.1600026
Hill, A. R., Devito, K. J., Campagnolo, S., and Sanmugadas, K. (2000). Subsurface denitrification in a forest riparian zone: interactions between hydrology and supplies of nitrate and organic carbon. Biogeochemistry 51, 193–223. doi: 10.1023/A:1006476514038
Hu, W., Jiang, Y., Chen, D., Lin, Y., Han, Q., and Cui, Y. (2018). Impact of pore geometry and water saturation on gas effective diffusion coefficient in soil. Appl. Sci. 8:2097. doi: 10.3390/app8112097
Hug, L. A., Thomas, B. C., Brown, C. T., Frischkorn, K. R., Williams, K. H., Tringe, K. H., et al. (2015). Aquifer environment selects for microbial species cohorts in sediment and groundwater. ISME J. 9, 1846–1856. doi: 10.1038/ismej.2015.2
Janot, N., Lezama Pacheco, J. S., Pham, D. Q., O’Brien, T. M., Hausladen, D., Noël, V., et al. (2016). Physico-chemical heterogeneity of organic-rich sediments in the Rifle aquifer, CO: impact on uranium biogeochemistry. Environ. Sci. Technol. 50, 46–53. doi: 10.1021/acs.est.5b03208
Keiluweit, M., Nico, P. S., Kleber, M., and Fendorf, S. (2016). Are oxygen limitations under recognized regulators of organic carbon turnover in upland soils? Biogeochemistry 127, 157–171. doi: 10.1007/s10533-015-0180-6
Kim, S.-J., Park, S.-J., Cha, I.-T., Min, D., Kim, J.-S., Chung, W.-H., et al. (2014). Metabolic versatility of toluene-degrading, iron-reducing bacteria in tidal flat sediment, characterized by stable isotope probing-based metagenomic analysis. Environ. Microbiol. 16, 189–204. doi: 10.1111/1462-2920.12277
Koch, H., Galushko, A., Albertsen, M., Schintlmeister, A., Gruber, D. C., Lücker, S., et al. (2014). Growth of nitrite-oxidizing bacteria by aerobic hydrogen oxidation. Science 345, 1052–1054. doi: 10.1126/science.1256985
Kojima, H., Shinohara, A., and Fukui, M. (2015). Sulfurifustis variabilis gen. nov., sp. nov., a sulfur oxidizer isolated from a lake, and proposal of Acidiferrobacteraceae fam. nov. and Acidiferrobacterales ord. nov. Int. J. Syst. Evol. Microbiol. 65, 3709–3713. doi: 10.1099/ijsem.0.000479
Kozich, J. J., Westcott, S. L., Baxter, N. T., Highlander, S. K., and Schloss, P. D. (2013). Development of a dual-index sequencing strategy and curation pipeline for analyzing amplicon sequence data on the MiSeq Illumina sequencing platform. Appl. Environ. Microbiol. 79, 5112–5120. doi: 10.1128/aem.01043-13
Kuever, J., Rainey, F. A., and Widdel, F. (2015). “Desulfuromonas,” in Bergey’s Manual of Systematics of Archaea and Bacteria, eds W. B. Whitman, F. Rainey, P. Kämpfer, M. Trujillo, J. Chun, P. DeVos, et al. (Chichester: John Wiley & Sons).
Kwon, M. J., Boyanov, M. I., Antonopoulos, D. A., Brulc, J. M., Johnston, E. R., Skinner, K. A., et al. (2014). Effects of dissimilatory sulfate reduction on FeIII (hydr)oxide reduction and microbial community development. Geochim. Cosmochim. Acta 129, 177–190. doi: 10.1016/j.gca.2013.09.037
Lair, G. J., Zehetner, F., Fiebig, M., Gerzabek, M. H., Van Gestel, C. A. M., Hein, T., et al. (2009). How do long-term development and periodical changes of river-floodplain systems affect the fate of contaminants? Results from European rivers. Environ. Pollut. 157, 3336–3346. doi: 10.1016/j.envpol.2009.06.004
Lavy, A., Geller McGrath, D., Matheus Carnevali, P. B., Wan, J., Dong, W., Tokunaga, T. K., et al. (2019). Microbial communities across a hillslope-riparian transect shaped by proximity to the stream, groundwater table, and weathered bedrock. Ecol. Evol. 9, 6869–6900. doi: 10.1002/ece3.5254
Lefebvre, P., Noël, V., Jemison, N. E., Weaver, K. L., Bargar, J. R., and Maher, K. (2019). Isotopic fingerprint of uranium bio-accumulation and redox cycling in floodplains of the Upper Colorado River Basin. Environ. Sci. Technol. 7, 3399–3409. doi: 10.1021/acs.est.8b05593
Liu, J., Yao, J., Wang, F., Min, N., Gu, J., Li, Z., et al. (2019). Bacterial diversity in typical abandoned multi-contaminated nonferrous metal(loid) tailings during natural attenuation. Environ. Pollut. 247, 98–107. doi: 10.1016/j.envpol.2018.12.045
Looney, B. B., Denham, M. E., and Eddy-Dilek, C. A. (2014). Independent Technical Evaluation and Recommendation for Contaminated Groundwater at the Department of Energy Office of Legacy Management Riverton Processing Site. Report No. STI-2014-00163 (Jackson, SC: Savannah River National Laboratory).
Lovely, D. R., and Phillips, E. J. P. (1992). Reduction of Uranium by Desulfovibrio desulfuricans. Appl. Environ. Microbiol. 58, 850–856. doi: 10.1128/aem.58.3.850-856.1992
Lovely, D. R., Phillips, E. J. P., Gorby, Y. A., and Landa, E. R. (1991). Microbial reduction of uranium. Nature 350, 413–416. doi: 10.1038/350413a0
Lovely, D. R., Roden, E. E., Phillips, E. J. P., and Woodward, J. C. (1993). Enzymatic iron and uranium reduction by sulfate-reducing bacteria. Mar. Geol. 113, 41–53. doi: 10.1016/0025-3227(93)90148-O
Lynch, S. F. L., Batty, L. C., and Byrne, P. (2014). Environmental risk of metal mining contaminated river bank sediment at redox-transitional zones. Minerals 4, 52–73. doi: 10.3390/min4010052
Majumder, E. L.-W., and Wall, J. D. (2017). Uranium bio-transformations: Chemical or biological processes? Open J. Inorg. Chem. 7, 28–60. doi: 10.4236/ojic.2017.72003
Marín-Spiotta, E., Gruley, K. E., Crawford, J., Atkinson, E. E., Miesel, J. R., Greene, S., et al. (2014). Paradigm shifts in soil organic matter research affect interpretations of aquatic carbon cycling: transcending disciplinary and ecosystem boundaries. Biogeochemistry 117, 279–297. doi: 10.1007/s10533-013-9949-7
McClain, M. E., Boyer, E. W., Dent, C. L., Gergel, S. E., Grimm, N. B., Groffman, P. M., et al. (2003). Biogeochemical hot spots and hot moments at the interface of terrestrial and aquatic ecosystems. Ecosystems 6, 301–312. doi: 10.1007/s10021-003-0161-9
McMurdie, P. J., and Holmes, S. (2013). An R package for reproducible interactive analysis and graphics of microbiome census data. PLoS One 8:e61217. doi: 10.1371/journal.pone.0061217
Miller, M., Buto, S. G., Susong, D. D., and Rumsey, C. A. (2016). The importance of base flow in sustaining surface water flow in the Upper Colorado River Basin. Water Resour. Res. 52, 3547–3562. doi: 10.1002/2015WR017963
Mouser, P. J., N’Guessan, L. A., Qafoku, N. P., Sinha, M., Williams, K. H., Dangelmayr, M., et al. (2015). Influence of carbon and microbial community priming on the attenuation of uranium in a contaminated floodplain aquifer. Groundwater 53, 600–613. doi: 10.1111/gwat.12238
Mußmann, M., Pjevac, P., Krüger, K., and Dyksma, S. (2017). Genomic repertoire of the Woeseiaceae/JTB255, cosmopolitan and abundant core members of microbial communities in marine sediments. ISME J. 11, 1276–1281. doi: 10.1038/ismej.2016.185
Neira, J., Ortiz, M., Morales, L., and Acevedo, E. (2015). Oxygen diffusion in soils: understanding the factors and processes needed for modeling. Chil. J. Agric. Res. 75, 35–44. doi: 10.4067/S0718-58392015000300005
Nelson, A. R., Sawyer, A. H., Gabor, R. S., Saup, C. M., Bryant, S. R., Harris, K. D., et al. (2019). Heterogeneity in hyporheic flow, pore water chemistry, and microbial community composition in an alpine streambed. J. Geophys. Res. Biogeosci. 124, 3465–3478. doi: 10.1029/2019JG005226
Noël, V., Boye, K., Kukkadapu, R. K., Bone, S. E., Lezama Pacheco, J. S., Cardarelli, E. L., et al. (2017a). Understanding controls on redox processes in floodplain sediments of the Upper Colorado River Basin. Sci. Total Environ. 603-604, 663–675. doi: 10.1016/j.scitotenv.2017.01.109
Noël, V., Boye, K., Kukkadapu, R. K., Li, Q., and Bargar, J. D. (2019). Uranium storage mechanisms in wet-dry redox cycled sediments. Water Res. 152, 251–263. doi: 10.1016/j.watres.2018.12.040
Noël, V., Boye, K., Lezama Pacheco, J. S., Bone, S. E., Janot, N., Cardarelli, E., et al. (2017b). Redox controls over the stability of U(IV) in floodplains of the Upper Colorado River Basin. Environ. Sci. Technol. 51, 10954–10964. doi: 10.1021/acs.est.7b02203
Nolan, J., and Weber, K. A. (2015). Natural uranium contamination in Major U.S. aquifers linked to nitrate. Environ. Sci. Technol. Lett. 2, 215–220. doi: 10.1021/acs.estlett.5b00174
None, N. (2016). Uranium-Bearing Evaporite Mineralization Influencing Plume Persistence: Literature Review and DOE-LM Site Surveys. Washington, DC: USDOE Office of Legacy Management.
Pan, D., Williams, K. H., Robbins, M. J., and Weber, K. A. (2018). Uranium retention in a bioreduced region of an alluvial aquifer induced by the influx of dissolved oxygen. Environ. Sci. Technol. 52, 8133–8145. doi: 10.1021/acs.est.8b00903
Parada, A. E., Needham, D. M., and Fuhrman, J. A. (2016). Every base matters: assessing small subunit rRNA primers for marine microbiomes with mock communities, time series and global field samples. Environ. Microbiol. 18, 1403–1414. doi: 10.1111/1462-2920.13023
Qafoku, N. P., Kukkadapu, R. K., McKinley, J. P., Arey, B. W., Kelly, S. D., Wang, C., et al. (2009). Uranium in framboidal pyrite from a naturally bioreduced alluvial sediment. Environ. Sci. Technol. 43, 8528–8534. doi: 10.1021/es9017333
Quast, C., Pruesse, E., Yilmaz, P., Gerken, J., Schweer, T., Yarza, P., et al. (2013). The SILVA ribosomal RNA gene database project: improved data processing and web-based tools. Nucleic Acids Res. 41, D590–D596. doi: 10.1093/nar/gks1219
R Core Team (2017). R: A Language and Environment for Statistical Computing. Vienna: R Foundation for Statistical Computing.
Renault, P., and Stengel, P. (1994). Modeling oxygen diffusion in aggregated soils: I. Anaerobiosis inside the Aggregates. Soil Sci. Soc. Am. J. 58, 1017–1023. doi: 10.2136/sssaj1994.03615995005800040004x
Renault, P., and Sierra, J. (1994). Modeling oxygen diffusion in aggregated soils: II. Anaerobiosis in topsoil layers. Soil Sci. Soc. Am. J. 58, 1023–1030. doi: 10.2136/sssaj1994.03615995005800040005x
Repert, D. A., Underwood, J. C., Smith, R. L., and Song, B. (2014). Nitrogen cycling processes and microbial community composition in bed sediments in the Yukon River at Pilot Station. J. Geophys. Res. Biogeosci. 119, 2328–2344. doi: 10.1002/2014JG002707
Rezadehbashi, M., and Baldwin, S. A. (2018). Core sulphate-reducing microorganisms in metal-removing semi-passive biochemical reactors and the co-occurrence of methanogens. Microorganisms 6:16. doi: 10.3390/microorganisms6010016
Robinson, P. (2004). Uranium Mill Tailings Remediation Performed by the US DOE: An overview”. Albuquerque, NM: S.R.A.I. Center.
Rumsey, C. A., Miller, M. P., Susong, D. D., Tillman, F. D., and Anning, D. W. (2015). Regional scale estimates of baseflow and factors influencing baseflow in the Upper Colorado River Basin. J. Hydrol. Reg. Stud. 4, 91–107. doi: 10.1016/j.ejrh.2015.04.008
Satchanska, C., Golovinsky, E., and Selenska-Pobell, S. (2004). Bacterial diversity in a soil sample from uranium mining waste pile as estimated via a culture-independent 16S rDNA approach. Proc. Bulg. Acad. Sci. 57:4.
Schloss, P. D. (2008). Evaluating different approaches that test whether microbial communities have the same structure. ISME J. 2, 265–275. doi: 10.1038/ismej.2008.5
Schloss, P. D., Westcott, S. L., Ryabin, T., Hall, J. R., Hartmann, M., Hollister, E. B., et al. (2009). Introducing mothur: open-source, platform-independent, community-supported software for describing and comparing microbial communities. Appl. Environ. Microbiol. 75, 7537–7541. doi: 10.1128/AEM.01541-09
Schulz-Zunkel, C., Rinklebe, J., and Bork, H.-R. (2015). Trace element release patterns from three floodplain soils under simulated oxidized–reduced cycles. Ecol. Eng. 83, 485–495. doi: 10.1016/j.ecoleng.2015.05.028
Segata, N., Izard, J., Waldron, L., Gevers, D., Miropolsky, L., Garrett, W. S., et al. (2011). Metagenomic biomarker discovery and explanation. Genome Biol. 12:R60. doi: 10.1186/gb-2011-12-6-r60
Sheik, C. S., Mitchell, T. W., Rizvi, F. Z., Rehman, Y., Faisal, M., Hasnain, S., et al. (2012). Exposure of soil microbial communities to chromium and arsenic alters their diversity and structure. PLoS One 7:e40059. doi: 10.1371/journal.pone.0040059
Shuman, L. M. (1997). Adsorption of Zn by Fe and Al hydrous oxides as influenced by aging and pH. Soil Sci. Soc. Am. J. 41, 703–706. doi: 10.2136/sssaj1977.03615995004100040016x
Stein, L. Y., La Duc, M. T., Grundl, T. J., and Nealson, K. H. (2001). Bacterial and archaeal populations associated with freshwater ferromanganous micronodules and sediments. Environ. Microbiol. 3, 10–18. doi: 10.1046/j.1462-2920.2001.00154.x
Stookey, L. L. (1970). Ferrozine-A new spectrophotometric reagent for iron. Anal. Chem. 42, 779–781. doi: 10.1021/ac60289a016
van Buuren, S., and Groothuis-Oudshoorn, K. (2011). mice: multivariate imputation by chained equations in R. J. Stat. Softw. 45, 1–67. doi: 10.18637/jss.v045.i03
Vidon, P., Allan, C., Burns, D., Duval, T. P., Gurwick, N., Inamdar, S., et al. (2010). Hot spots and hot moments in riparian zones: potential for improved water quality management. J. Am. Water Resour. Assoc. 46, 278–298. doi: 10.1111/j.1752-1688.2010.00420.x
Vidon, P., and Hill, A. R. (2004). Denitrification and patterns of electron donors and acceptors in eight riparian zones with contrasting hydrogeology. Biogeochemistry 71, 259–283. doi: 10.1007/s10533-004-9684-1
Viollier, E., Inglett, P. W., Hunter, K., Roychoudhury, A. N., and Van Cappellen, P. (2000). The Ferrozine method revisted: Fe(II)/Fe(III) determination in natural waters. Appl. Geochem. 15, 785–790. doi: 10.1016/S0883-2927(99)00097-9
Weber, F. A., Voegelin, A., Kaegi, R., and Kretzschmar, R. (2009). Contaminant mobilization by metallic copper and metal sulphide colloids in flooded soil. Nat. Geosci. 2, 267–271. doi: 10.1038/ngeo476
Wegener, C.-E., Gaspar, M., Geesink, P., Herrmann, M., Marz, M., and Küsel, K. (2019). Biogeochemical regimes in shallow aquifers reflect the metabolic coupling of the elements nitrogen, sulfur, and carbon. Appl. Environ. Microbiol. 85:e02346-18. doi: 10.1128/AEM.02346-18
Wrighton, K. C., Castelle, C. J., Wilkins, M. J., Hug, L. A., Sharon, I., Thomas, B. C., et al. (2014). Metabolic interdependencies between phylogenetically novel fermenters and respiratory organisms in an unconfined aquifer. ISME J. 8, 1452–1463. doi: 10.1038/ismej.2013.249
Yabusaki, S., Wilkins, M. J., Fang, Y., Williams, K. H., Arora, B., Bargar, J. D., et al. (2017). Water table dynamics and biogeochemical cycling in a shallow, variably-saturated floodplain. Environ. Sci. Technol. 51, 3307–3317. doi: 10.1021/acs.est.6b04873
Yilmaz, P., Parfrey, L. W., Yarza, P., Gerken, J., Pruesse, E., Quast, C., et al. (2014). The SILVA and “All-species Living Tree Project (LTP)” taxonomic frameworks. Nucleic Acids Res. 42, D643–D648. doi: 10.1093/nar/gkt1209
Keywords: alluvial soil, uranium, 16S rRNA, geochemistry, hydrology, terrestrial subsurface, riparian zone
Citation: Tolar BB, Boye K, Bobb C, Maher K, Bargar JR and Francis CA (2020) Stability of Floodplain Subsurface Microbial Communities Through Seasonal Hydrological and Geochemical Cycles. Front. Earth Sci. 8:338. doi: 10.3389/feart.2020.00338
Received: 21 April 2020; Accepted: 20 July 2020;
Published: 14 August 2020.
Edited by:
Neha Mehta, UMR 7590 Institut de Minéralogie, de Physique des Matériaux et de Cosmochimie (IMPMC), FranceReviewed by:
Bhavna Arora, Lawrence Berkeley National Laboratory, United StatesMónica Torres-Beltrán, University of British Columbia, Canada
Copyright © 2020 Tolar, Boye, Bobb, Maher, Bargar and Francis. This is an open-access article distributed under the terms of the Creative Commons Attribution License (CC BY). The use, distribution or reproduction in other forums is permitted, provided the original author(s) and the copyright owner(s) are credited and that the original publication in this journal is cited, in accordance with accepted academic practice. No use, distribution or reproduction is permitted which does not comply with these terms.
*Correspondence: John R. Bargar, YmFyZ2FyQHNsYWMuc3RhbmZvcmQuZWR1; Christopher A. Francis, Y2FmQHN0YW5mb3JkLmVkdQ==
†These authors have contributed equally to this work