 Ben Clarke1,2*Pablo Tierz1,3Eliza Calder1Gezahegn Yirgu4
- 1School of GeoSciences, University of Edinburgh, Edinburgh, United Kingdom
- 2School of Geography, Earth & Environment, University of Leicester, Leicester, United Kingdom
- 3British Geological Survey, The Lyell Centre, Edinburgh, United Kingdom
- 4School of Earth Sciences, Addis Ababa University, Addis Ababa, Ethiopia
Aluto volcano, in the Main Ethiopian Rift, is a peralkaline caldera system, which comprises conglomerations of rhyolite (obsidian) lavas and enigmatic pumice cones. Recent work at Aluto has found that pumice cone eruptions are highly unsteady, and form convective eruption plumes that frequently collapse to generate pyroclastic density currents (PDCs). We develop a methodology and present results for the first probabilistic volcanic hazard assessment (PVHA) for PDCs at a pumice cone volcano. By doing so, we estimate the conditional probability of inundation by PDCs around Aluto volcano, incorporating the aleatory uncertainty in PDC hazard. We employ a Monte Carlo energy cone modeling approach, which benefits from parameterization informed by field investigations and volcanic plume modeling. We find that despite the relatively modest eruptions that are likely to occur, the wide distribution of past vent locations (and thus the high uncertainty of where future vents might open), results in a broad area being potentially at risk of inundation by PDCs. However, the aleatory uncertainty in vent opening means that the conditional probabilities are lower (≤ 0.12), and more homogeneous, over the hazard domain compared to central-vent volcanoes (where conditional probabilities are often ≤ 1 close to the vent). Despite this, numerous settlements, amenities, and economically valuable geothermal infrastructure, lie within the most hazardous (P(PDC|eruption) ≥ 0.05) regions of Aluto caldera. The Monte Carlo energy cone modeling approach provides a quantitative, accountable and defendable background and long-term PVHA for PDCs from Aluto. These results could be combined in the future with hazard assessments relating to tephra fall and/or lava to develop a comprehensive volcanic hazard map for the caldera. Following appropriate parameterization, the approach developed here can also be used to compute a PDC PVHA at other volcanoes where vent location is uncertain.
1. Introduction
Pumice cone eruptions are some of the least studied forms of volcanic activity on Earth, yet represent the typical eruptive style at caldera volcanoes along the Main Ethiopian rift valley (Fontijn et al., 2018). They have also been documented on Mayor Island, New Zealand (Houghton and Wilson, 1989), and are characteristic of the more recent volcanism on Pantelleria, Italy (Orsi et al., 1989). Contrary to previous interpretations, the eruption of pumice cones has been found to be relatively intense, generating convective eruption plumes (Fontijn et al., 2018; McNamara et al., 2018; Clarke et al., 2019) that are liable to collapse and produce pyroclastic density currents (PDCs) (Hutchison et al., 2016c; Fontijn et al., 2018; Clarke, 2020). These eruptions are tentatively estimated to range from violent-strombolian or vulcanian, to sub-Plinian in intensity (McNamara et al., 2018; Clarke et al., 2019), but column heights, eruption volumes and eruption durations are still very poorly constrained for pumice cone eruptions (e.g., Fontijn et al., 2018). In Ethiopia, a rapidly expanding population (UNDP, 2018), in excess of 1 million people, live within 10 km of volcanoes (Aspinall et al., 2011). Many of these volcanoes have been associated with pumice cone eruptions, so in this setting, these are key eruption types to understand. Additionally, valuable economic and geothermal infrastructure is being developed near these sites (World Bank, 2016). The increasingly high exposure to volcanic hazards in Ethiopia (Vye-Brown et al., 2016), and the recent recognition of the potential hazards at these volcanoes (Fontijn et al., 2018; Clarke et al., 2019; Clarke, 2020), evokes an urgent need for quantitative, accountable, and defendable volcanic hazard assessment (e.g., Connor et al., 2001; Newhall and Hoblitt, 2002; Marzocchi et al., 2010; Calder et al., 2015).
Aluto is a peralkaline rhyolite caldera volcano in the Main Ethiopian Rift. Aluto lies 7 km SE of the town of Ziway, 5 km NE of Bulbulla town, and hosts a diffuse but significant population living on and around its edifice (Figure 1). Within the caldera itself, there is a school, and a developing geothermal power station (Teklemariam and Kebede, 2010; World Bank, 2016). To the west of the caldera, sits one of the world's largest rose farms (AfriFlora and Sher Ethiopia, 2017); which provides much of the employment in the area. There is an estimated 415,000 people living within 30 km of Aluto, but there is currently no mandated group responsible for the monitoring of volcanic activity in Ethiopia (Vye-Brown et al., 2016). Although the volcano has been the focus of some recent research activity (Biggs et al., 2011; Hutchison, 2015; Hutchison et al., 2015, 2016a,b,c; Samrock et al., 2015; Braddock et al., 2017; Gleeson et al., 2017; Iddon et al., 2017; Wilks et al., 2017; Fontijn et al., 2018; Hübert et al., 2018; McNamara et al., 2018; Clarke et al., 2019; Clarke, 2020; Iddon and Edmonds, 2020), and has recently shown signs of volcanic unrest (Biggs et al., 2011), there is currently no existing hazard assessment or hazard map for Aluto which could be used to mitigate risk during future episodes of unrest and/or eruptions. The most recent volcanism at Aluto, since at least 60 ka, is dominated by pumice cone eruptions, with the most recent known eruption at 400 ± 50 years ago (Hutchison et al., 2016c). In this work, we identify 96 vents which are visible at the surface on and around the Aluto edifice and, therefore, there is a wide area from which hazardous volcanic processes, such as PDCs or tephra fallout, could be sourced during future eruptions. These eruptions could impact proximal to medial (< ~10 km) sectors around the volcano, endangering many of the aforementioned sites. PDCs are the dominant cause of fatalities during volcanic eruptions, particularly from 5 to 15 km from the vent (Brown et al., 2017). This, and the near ubiquitous presence of [qualitatively small-volume (≪0.01 km3)] ignimbrites within pumice cone eruption deposits (Clarke, 2020), emphasizes the need for a PDC hazard assessment for Aluto volcano.
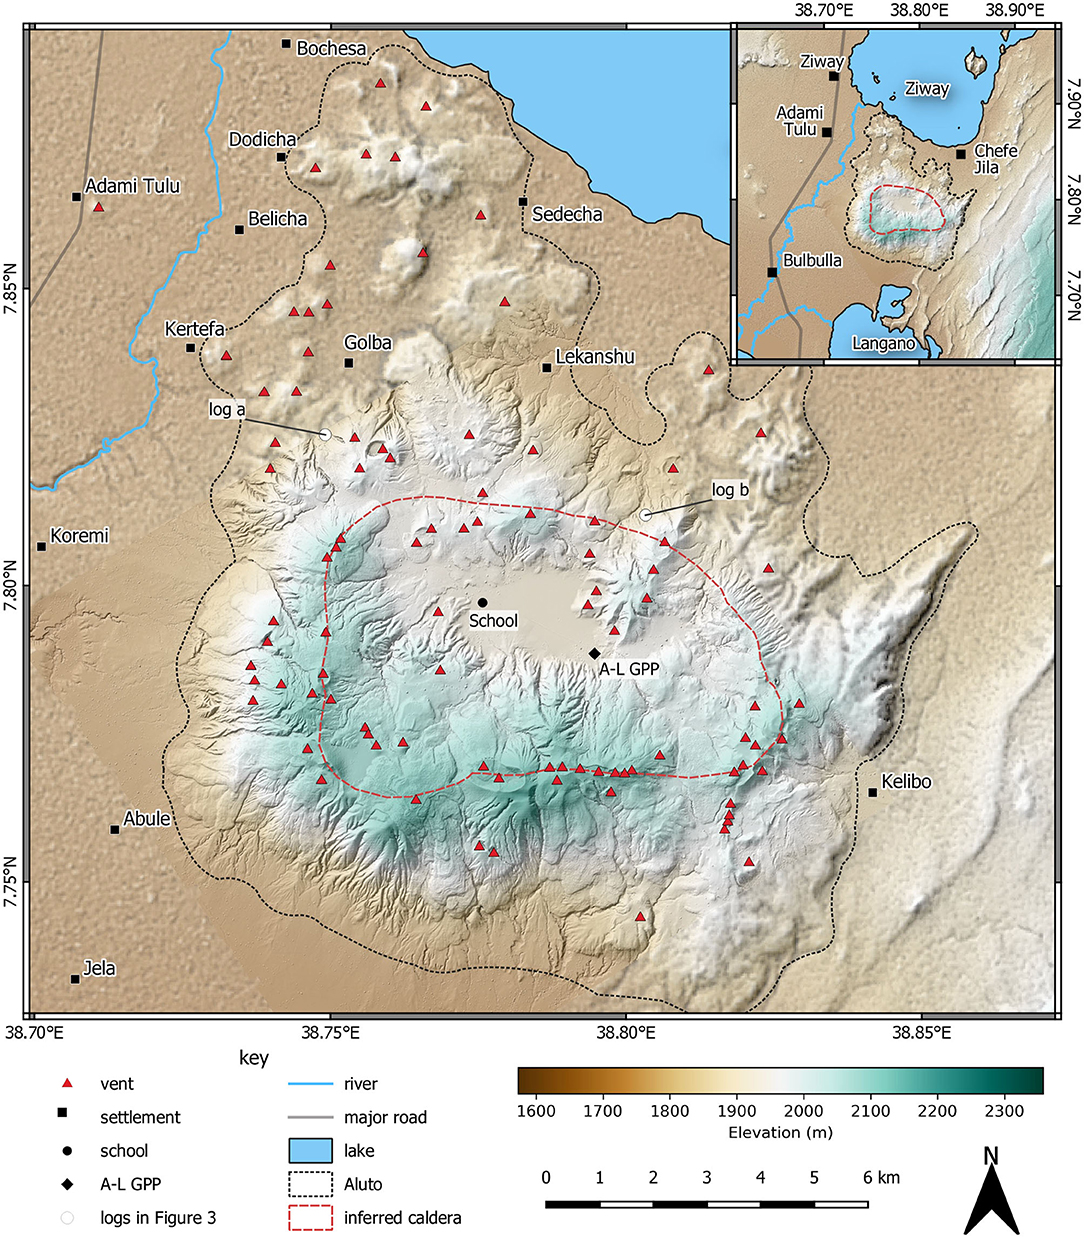
Figure 1. Topographic and regional maps of Aluto volcano showing the location of the 96 pumice cone vents visible at the surface in context. The vents are most concentrated around the inferred caldera ring fault, and cross-cutting regional faults (not shown) around Aluto (Hutchison et al., 2015). The vents were identified from the LiDAR model of Hutchison et al. (2014) and field investigations detailed in Clarke (2020). Named settlements according to regional mapping data are provided, but are by no means exhaustive. “A-L GPP” = Aluto-Langano Geothermal Power Plant. Geodetic system/projection: WGS84/UTM Zone 37N (ESPG:32637).
By their nature, PDCs are complex and dynamic processes, and the final footprint that they inundate (one potential measure of their hazard) is the product of a large number of interacting variables; both internal (collapse height, volume, granulometry, temperature etc.), and external (topography, nature of the substrate etc.) (e.g., Branney and Kokelaar, 2002; Sulpizio et al., 2014). This complexity makes hazard assessment of PDCs very challenging, and is compounded by aleatory and epistemic uncertainty (e.g., Spiller et al., 2014; Neri et al., 2015; Tierz et al., 2016b, 2018; Sandri et al., 2018). Aleatory uncertainty (the uncertainty associated with the natural variation of processes from one event to the next. For example, tossing a coin), is inherent to all volcanic systems and processes. The distributed nature of vents at Aluto, and therefore uncertainty in the location of the next eruption, contributes to this aleatory uncertainty. Epistemic uncertainty (the uncertainty associated with a lack of knowledge of how a system operates. E.g., is the coin fair?) is, to a lesser or greater extent, present in our understanding of any volcanic system. This is particularly important for pumice cone eruptions, which we know relatively little about. Pumice cone eruptions at Aluto have only recently been studied in detail (e.g., Fontijn et al., 2018; McNamara et al., 2018; Clarke et al., 2019; Clarke, 2020), and their eruption has never been observed. Consequently, there are only semi-quantitative estimates of eruption magnitude (vulcanian to sub-Plinian; Fontijn et al., 2018; McNamara et al., 2018), in addition to qualitative assessments of eruption styles and processes (unsteady eruptions that frequently generate convective eruption columns and PDCs; Fontijn et al., 2018; Clarke et al., 2019). In order to account for and quantify such uncertainties, probabilistic volcanic hazard assessment (PVHA) (e.g., Newhall and Hoblitt, 2002; Aspinall et al., 2003; Marzocchi et al., 2004, 2010; Bayarri et al., 2009; Wolpert et al., 2018) is widely used, as it provides a more complete and accurate quantification of volcanic hazard compared to single-scenario, deterministic approaches. The aim of this work is to develop a PVHA of PDCs at Aluto, by using newly collected information on the nature of its PDCs (Clarke et al., 2019; Clarke, 2020) to constrain and develop upon some established quantitative methods previously applied to other volcanic systems (e.g., Tierz et al., 2016a,b; Sandri et al., 2018). More broadly, we aim to develop a methodology, which with appropriate parameterization, may be used at similar volcanoes world wide.
2. Methodological Rationale and Overview
At Aluto, pumice cone eruptions have been found to undergo self-similar eruption sequences (Figure 2). Pumice cone eruptions at Aluto begin with an intense eruption plume-forming phase, during which the bulk of the pumice cone is deposited as tephra fall from the edge of the convective column, and from the accumulation of ballistic material around the vent (Clarke et al., 2019; Clarke, 2020). This is followed by a waning eruption intensity, and repeated column collapse, producing PDCs (Figure 3). This is shown by the frequent interbedding of PDC and fall deposits above the massive angular, clast-supported, cone-forming fall deposits. All the PDC deposits found so far at Aluto are consistent with generation by column-collapse (Clarke, 2020): PDC deposits are typically associated with underlying tephra fall deposits (Figure 3), comprise lithologically diverse lithic populations (indicating fragmentation at depth), and do not contain large dense blocks of fragmented lava-dome or plug (e.g., Fisher and Schmincke, 1984). PDC deposits at Aluto are almost exclusively massive lapilli tuffs (Clarke, 2020), indicating they were deposited from granular fluid based PDCs, where high particle density at the base suppresses turbulence and reduces the tendency to develop sedimentary structures (Branney and Kokelaar, 2002). PDC deposits are found proximally, in gullies cut into the sides of pumice cones, as well as further from the pumice cones themselves (found up to 5 km from the nearest possible source-cone). Here, PDC deposits are often present as gorge-filling deposits, and occasionally as sheet-like deposits with an areal coverage on the scale of a few km2 (Clarke, 2020). The deposits are only sporadically exposed, and outcrops often intersect the reworked shores of palaeolake Langano, meaning that maximum PDC run-out and areal coverage are often minimum values. In summary, we can conclude that the PDCs typical of this phase of pumice cone eruptions are relatively low volume, granular fluid based pyroclastic density currents generated by eruption column-collapse, that are often valley-confined but occasionally spread laterally, and that often reach at least 5 km from the vent. The deposits of PDCs are found on or around most pumice cones that have been investigated at Aluto (Hutchison et al., 2016c; Fontijn et al., 2018; Clarke, 2020), and so as a conservative approach, we assume that all pumice cone eruptions at Aluto generate at least one column-collapse derived PDC, in other words: P(PDC|eruption) = 1. The final phase of pumice cone eruptions at Aluto [and at many pumice cones world wide; (e.g., Houghton et al., 1992; Dellino and Volpe, 1995; Gioncada and Landi, 2010)] is typified by the emplacement of a silicic (obsidian) lava flow from the central pumice cone vent. The source of the lava flow can be ascertained by the convergence of surface folds (ogives) to a bulls eye like distribution around the vent, usually accompanied by a dip or bump on the scale of ≤ 20 vertical meters, and ≤ 100 m in diameter. This is likely to be a surface expression of the underlying vent geometry, caused by the final effusion of an up-heaved dome or spine (bump), or a drain-back or foam-collapse into the conduit (dip) (e.g., Fink, 1983; Griffiths and Fink, 1993). The duration of pumice cone eruptions is poorly understood (Fontijn et al., 2018). Pyroclastic deposits from a single eruption at Aluto often grade continuously into one another (with the notable exception of the transition from pyroclastics to silicic lava flows), and where sharper transitions do occur, there is little evidence for the development of a significant erosional surface. This implies relatively continuous (though unsteady) eruptions; if the eruption is continuous at a violent-strombolian to sub-Plinian intensity, it is likely to last for a matter of hours or days, rather than months or years (Pyle, 2015). Duration of these eruptive episodes is clearly important from a hazard perspective, but this level of detail has rarely been incorporated into PVHA (e.g., Wolpert et al., 2018; Bebbington and Jenkins, 2019).
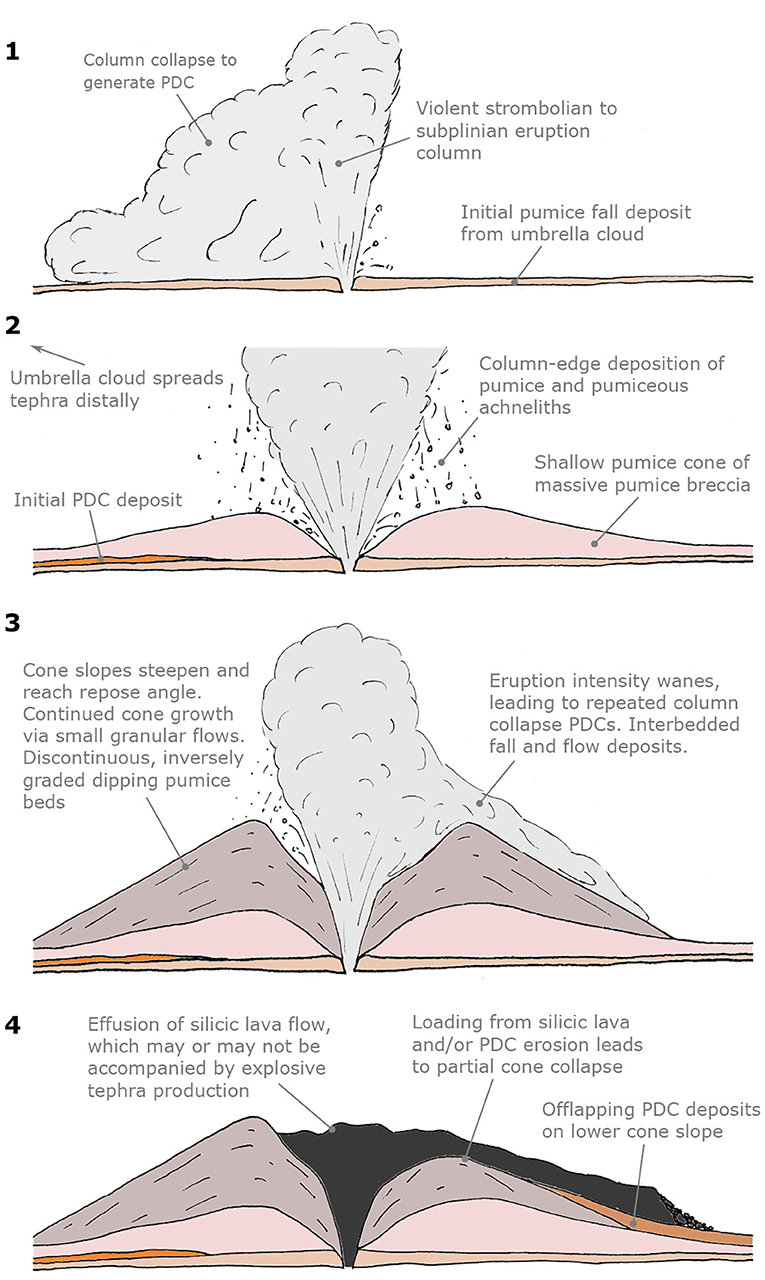
Figure 2. A generalized sequence of a pumice cone eruption at Aluto constructed from the record of nine distinct, but similar, eruptions. Some eruptions begin with the generation of a convective plume producing relatively widespread tephra fall deposits that transition into PDC deposits as the column collapses. Most pumice cone forming eruptions at Aluto begin at stage 2, where a convective eruption plume is generated, and an increasingly steep-sided pumice cone is deposited around the vent from tephra falling from the column-edge, and ballistic deposition (Clarke et al., 2019; Clarke, 2020). As the eruption wanes, the column becomes unsteady, often generating multiple intercalated tephra fall and PDC deposits. The end of the eruption is marked by the emplacement of a silicic lava flow, which may or may not be accompanied by explosive tephra production. Column collapse PDCs are likely to be generated at stages 1 and 3. After Clarke (2020).
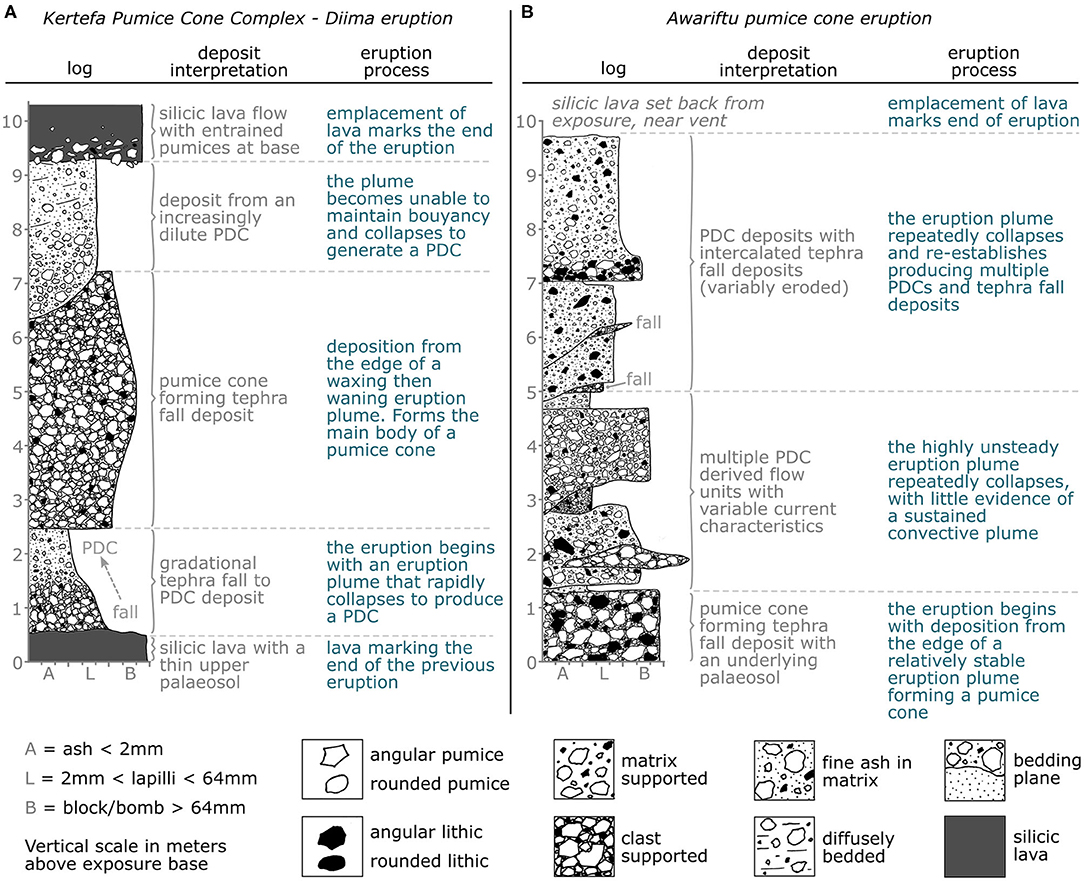
Figure 3. Pyroclastic logs and interpretations from two of the 9 Aluto pumice cones investigated in Clarke (2020). (A) The deposits of the Diima eruption, part of the Kertefa Pumice Cone Complex. (B) Deposits of the Awariftu pumice cone on the northern flank of the caldera. The PDC deposits, and their close association with tephra fall deposits, are consistent with those often produced during eruption column collapse events. Interpretations from these, and the other 7 eruption reconstructions were used to develop the generalized pumice cone eruption scenario depicted in Figure 2.
Though eruptions of pumice cones at Aluto appear to follow a similar sequence, they clearly span a range of magnitudes, producing pumice cones from 10 to 100s of meters tall (Hutchison et al., 2016c; Clarke, 2020), and depositing tephra fall to greater and lesser distances (Fontijn et al., 2018; McNamara et al., 2018). Additionally, distributed pumice cone eruption vents have been identified on and around Aluto (Figure 1) using the LiDAR digital terrain model (DTM) from Hutchison et al. (2014). Field evidence indicates that all of the 9 pumice cones investigated here are the product of single eruptions (Clarke, 2020). This means that recent silicic pumice cone eruptions at Aluto behave in a somewhat similar manner to a monogenetic field, where vent locations are expected to change from one eruption to the next and, therefore, the location of the next eruption is highly uncertain. These uncertainties (poorly constrained eruption magnitudes and intensities, and uncertain vent location) need to be robustly accounted for in the PVHA. Taking such first-order observations into account to produce a PVHA in a robust and quantitative manner is challenging, but nonetheless necessary, even for poorly studied volcanic systems. Often, hazard assessments and maps for such [and many other] volcanoes are based upon the geological foot print of prior hazardous phenomena, or the product of a modest number of deterministic numerical simulations based on a limited number of scenarios (Calder et al., 2015). Though these methods may represent a key starting point to estimate volcanic hazard, they fail to fully evaluate the aleatory and epistemic uncertainty, which are pervasive in volcanic systems (e.g., Marzocchi et al., 2010; Spiller et al., 2014; Tierz et al., 2016a,b). To generate a full PVHA of PDCs, there must be a sufficient number of PDC simulations to approximate the diversity and distribution of scenarios in nature. This presents a technical challenge, as often-used PDC simulation tools such as Titan2D (Patra et al., 2005), and VolcFlow (Kelfoun and Druitt, 2005; Kelfoun et al., 2017) are computationally expensive, allowing only a relatively limited number of runs to be performed in a reasonable time frame. Therefore, performing PVHA with such models requires the use of complex uncertainty quantification techniques such as Polynomial Chaos Quadrature (Dalbey et al., 2008; Tierz et al., 2018) or Gaussian Process emulators (Bayarri et al., 2009, 2015; Spiller et al., 2014; Wolpert et al., 2018; Rutarindwa et al., 2019). An alternative approach is to use a simple, less computationally expensive model that requires fewer assumptions to be made about the nature of the eruption. Such a model can then be applied in a Monte Carlo fashion, covering the parameter space at every potential vent location in a computationally realistic time frame. Afterwards, importance sampling can be applied, where the knowledge and assumptions we make about the systems are used to “weight” the PDC model outputs according to how their respective likelihood is considered. This has the advantage of allowing the PVHA to be updated as knowledge improves, without necessarily having to re-run the PDC models. This is an approach which is also central to the work using statistical emulators, first proposed in Bayarri et al. (2009). A useful final product can be a map of the conditional probability of PDC inundation given an eruption. If the chosen PDC model produces some continuous measure of intensity, such as flow thickness or dynamic pressure, a hazard curve could be generated for each cell in a cartesian grid (e.g., Tonini et al., 2015; Tierz et al., 2018). However, for PDCs, hazard intensity is often considered to be binary (inundation vs. no inundation); owing to their almost ubiquitously destructive and deadly nature. Such a probability map, with a binary “intensity,” is useful; as it displays the most important hazard metric for human survival from PDCs (inundation vs. no inundation). Whatever the intensity measure, such a map can be combined with exposure data, such as population distribution, or locations of interest or importance. Additionally, if the conditional probability of PDC inundation is combined with a temporal probability of eruption, and the probability of a PDC being produced given an eruption: the non-conditional probability of PDC inundation within a given time window can be calculated (e.g., Sandri et al., 2014, 2018; Bevilacqua et al., 2017; Rutarindwa et al., 2019). This, combined with the exposure data, allows the calculation of the non-conditional risk (probability of asset X being lost due to PDC inundation over time period Y).
3. Variability in Vent Location
The wide distribution of vents around Aluto is evidence that eruptions are not restricted to a single central vent, and that the location of the next eruption is highly uncertain. This uncertainty must be reflected in the PVHA. If we can estimate the probability of the next eruption occurring at each cell of a grid of potential vent locations, this can be used to incorporate such uncertainty into the Monte Carlo outputs of a PDC model, which describe the uncertainty in PDC generation and propagation (e.g., Tierz et al., 2016a,b; Sandri et al., 2018). The distribution of existing vents at Aluto is not homogeneous, and collectively the vents indicate the presence of a caldera ring fault and cross-cutting region faults (Hutchison et al., 2015, 2016c).
We take a two-dimensional kernel density estimation approach, often applied to basaltic monogenetic fields, and based on the locations of existing vents (Connor and Hill, 1995; Weller et al., 2006; Marti and Felpeto, 2010; Cappello et al., 2012; Bevilacqua et al., 2015). The method assumes that the likelihood of an eruption occurring at any location should be proportional to its proximity to vents from previous eruptions. From any past vent, the probability of a new vent opening near it can be characterized by an isotropic two-dimensional kernel function, centered on the past vent, and which needs to integrate to 1 (i.e., it is a bivariate, Easting-Northing, PDF) (e.g., Connor and Hill, 1995; Weller et al., 2006). The kernel describes how the probability “decays” at progressively greater distances from each vent, in this case equally in all directions. For any point within the hazard domain (i.e., the grid of possible vent-location points) the probability of vent-opening associated with the kernel function of each existing vent is summed and normalized by the number of vents (N). This is in order to ensure that the probability of vent opening over the entire hazard domain is a PDF itself and, thus, integrates to 1. In other words, it is assumed that the conditional probability (given eruption) of a vent opening from one of the vents within the hazard domain is equal to 1 (e.g., Weller et al., 2006; Selva et al., 2012). The probability of an eruption occurring in a particular location is known as the relative “spatial intensity” of volcanism at that point (); calculated using Equation (1):
where N is the total number of existing vents, h is the bandwidth of the kernel, and di is the distance between existing vent i and point (x, y). The key variable that characterizes any volcanic field is therefore the bandwidth of the kernel. The model assumes that there is a characteristic spacing of vents at Aluto, which can be fitted by a Gaussian kernel (Connor and Hill, 1995; Weller et al., 2006). Within reason, the choice of kernel shape is relatively inconsequential (Wand and Jones, 1994; Weller et al., 2006), but the bandwidth of the kernel is very important. Following the procedure of Weller et al. (2006), we fit a Gaussian cumulative distribution function (CDF) to an empirical CDF of the nearest neighbor distances of existing vents at Aluto. Qualitatively, the Gaussian fit is good, and provides a bandwidth of 0.716 km, which means that approximately 68% of vents are within 0.716 km of their closest vent. However, it is likely that the closer a vent is to another, the greater the probability of its burial and obscuration, meaning it is less likely to be identified. This introduces an “exposure bias,” and implies that the CDF of nearest neighbor distances presented here may under-represent the real proportion of vents at lesser distances. This is a source of epistemic uncertainty in this form of analysis.
We evaluate Equation (1) over the (x, y) locations of vents distributed in a regular 500 m cartesian grid across Aluto (1,221 vents), to calculate the probability of the next volcanic eruption occurring at each. The conditional probability of a vent opening at each point in this grid, given the next eruption at Aluto [P(venti|eruption)] is presented in Figure 4. The code used to do this is available as a fully reproducible Jupyter notebook (Zenodo/GitHub: https://doi.org/10.5281/zenodo.3778328). The sum of these probabilities is 0.995, meaning there is a 0.5% probability that the next vent will open somewhere beyond these points. This map indicates that the southern and northern rims of the caldera, as well as a diffuse region to the NW of the caldera, are the most probable regions to host the next vent at Aluto. These probabilities are only for the next eruption at Aluto, as for subsequent eruptions, analyses will also have to consider the location of the new vents. These values of probability are used directly as weighting factors in the importance sampling of the Monte Carlo PDC model outputs later. Due to Aluto's proximity to Lake Ziway, some of these vents are located within the lake. The average water depth of Lake Ziway is about 2.5 m (Hengsdijk and Jansen, 2006). This is clearly below proposed thresholds of water depth (i.e. pressure) related to the suppression of subaerial pyroclastic products (e.g., Koyaguchi and Woods, 1996; Lindsay et al., 2010; Sandri et al., 2012, 2018). Therefore, we consider that all vent locations on the lake can generate column collapse derived PDCs. Moreover, even though we acknowledge that eruption dynamics of eruptive vents opening on the lake will likely be different than those on land (Mastin and Witter, 2000; Houghton et al., 2015) for the sake of simplicity in this first approach to PVHA of PDCs at Aluto, we model the PDCs from vents on the lake using the same PDC model parameter space as for the other subaerial vents.
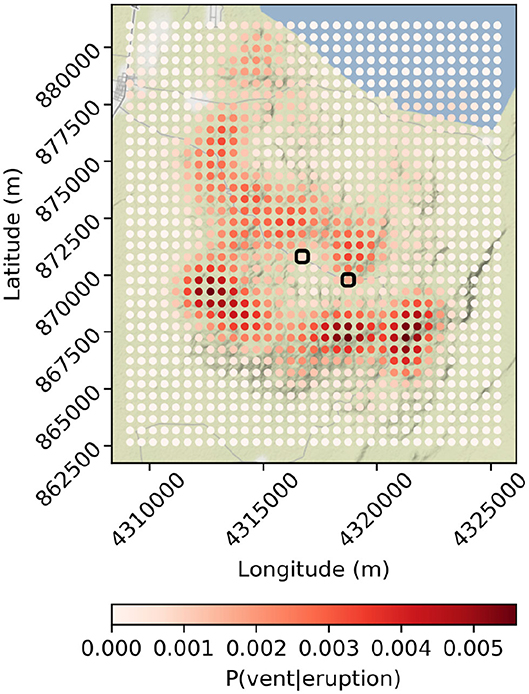
Figure 4. The conditional probability of vent opening at each of the 1,221 simulated vent locations, where color is mapped to P(vent|eruption), using the kernel density estimation method of Connor and Hill (1995). The small black boxes mark the approximate locations of the school (left) and geothermal power station (right). Coordinates are in meters, web mercator projection (ESPG: 3857).
4. Variability in PDC Inundation
4.1. The Energy Cone Model
We choose the energy cone model (Malin and Sheridan, 1982) to evaluate binary PDC inundation footprints for the range of pumice cone eruptions at Aluto. This approach is suitable as it requires few input parameters (suitable for volcanoes where there is high epistemic uncertainty), and is computationally light, meaning that the full parameter space can be thoroughly explored to account for aleatory uncertainty, at a reduced computational cost. Monte Carlo energy cone analysis has been applied to other volcanic systems to produce PVHAs of PDCs, such as Campi Flegrei and Vesuvius (Tierz et al., 2016a,b; Sandri et al., 2018). The energy cone model (Figure 5) assumes a source (vent) location, a height from which the PDC collapses (Hc), and a single mobility parameter (ϕ) which in effect describes how rapidly the potential energy from column collapse is consumed during horizontal PDC propagation. In reality, the mobility of a PDC changes in space and time and is dependent on a large number of interacting phenomena; including, for example, the density current granulometry (e.g., Roche et al., 2006), degree of flow fluidization (e.g., Wilson, 1980; Breard et al., 2018; Smith et al., 2018), the development of co-ignimbrite plumes (e.g., Calder et al., 1997; Andrews and Manga, 2011), and the development of stratified and [in-part] decoupled mechanical/flow regimes within the current (e.g., Fisher, 1995; Branney and Kokelaar, 2002; Breard and Lube, 2017). In the energy cone model, all of these phenomena are integrated into a single (empirically defined) angle (ϕ). This angle can be conceptualized as the dip of a line connecting the PDC collapse source and the most distal reach of the PDC, where a more mobile PDC will have a shallower angle. One can then imagine projecting this line from the PDC source at every degree of azimuth, forming a surface or “energy cone.” Where this line first intersects the surrounding topography marks the outer reach of potential PDC inundation, and the space within this polygon is the maximum potential PDC foot print. It essentially represents an aggregated foot print for flows in any direction, rather than a foot print for an individual flow. PDCs with a taller collapse height, and a greater mobility, have the potential to travel further. An important caveat of the energy cone model, given that is does not attempt to represent an individual flow footprint, is that it does not consider flow channelization of PDCs, which is known to be an important factor controlling the footprint of smaller volume, drainage-confined, concentrated PDCs (e.g., Calder et al., 1999; Douillet et al., 2013; Di Roberto et al., 2014; Saucedo et al., 2019). Density current channelization processes are considered in more complex models such as Titan 2D and VolcFlow, but for reasons already outlined, such models are not preferred in this situation.
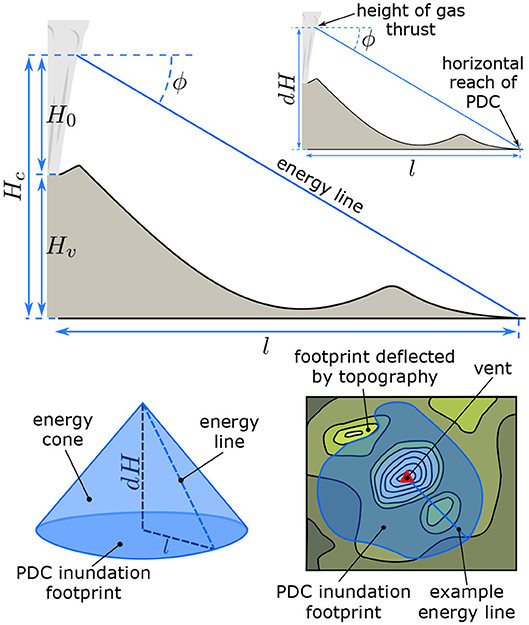
Figure 5. The energy cone model of Malin and Sheridan (1982). Each PDC possesses a particular mobility (ϕ), derived empirically from dH and l of previous PDCs, and a estimated collapse height Hc, derived from the height of the vent (Hv) and the height of the gas thrust region (H0). The point at which an energy line dipping at mobility angle ϕ intersects the ground marks the expected distal reach of the PDC at that degree of azimuth. This process is repeated at every degree of azimuth around the vent to form an energy cone and a radial PDC inundation footprint. The footprint is perfectly circular on a flat surface, but is irregular where it meets irregular topography.
The energy cone model must be suitably parameterized to capture the aleatory uncertainty of PDC collapse height and mobility at the volcano in question. This implies choosing and parameterizing probability density functions (PDFs); which describe the expected distribution of each parameter in nature (Rougier et al., 2013; Tierz et al., 2016b). A lack of real observational data from eruptions at Aluto means that these must be informed by other means. Ultimately, the suitable “target” PDFs will be used later for importance sampling, but uninformative uniform PDFs spanning the range of these PDFs will be used to sample 10,000 pairs of collapse height and mobility for energy cone simulations at each vent (NB. we assume that the aleatory uncertainty in PDC generation does not vary spatially).
4.2. Parameterizing PDC Collapse Height
The collapse height of the PDC in the case of dome forming eruptions is simple, as the PDC is sourced from the surface elevation at the source vent, which can be derived from the DTM. For column collapse events, such as those at Aluto (Clarke et al., 2019; Clarke, 2020), the collapse height (Hc) is considered to be the sum of the altitude of the vent (Hv), and the height above the vent from which collapse initiates (H0). Hv can be derived from the DTM for each vent during energy cone simulation. The maximum H0 has been commonly assumed to correspond with the top of the gas thrust region of the column (Tierz et al., 2016a,b; Sandri et al., 2018). Within the gas thrust region, a dense mixture of gas and pyroclasts is transported upwards mainly by momentum linked to explosive fragmentation. Given that the density of this mixture is higher than the surrounding atmosphere, it may collapse gravitationally upon loss of momentum, generating PDCs (e.g., Sparks, 1997; Doronzo et al., 2011; Dellino et al., 2014). If the eruption column entrains enough surrounding air as to become buoyant, a convective region of the column is developed above the top of the gas-thrust region (Sparks, 1997; Dellino et al., 2014). The top of the gas thrust region is therefore a good approximation of H0. The height of the gas thrust region for the range of volcanic plumes at Aluto was estimated using the PlumeRise model of Woodhouse et al. (2013), by a methodology detailed in Clarke (2020).
A summary of the method to determine the height of collapse from the gas thrust regions is provided here. The method is based on the premise that column collapse occurs at the point when eruption conditions are no longer capable of sustaining a convective eruption plume (Sparks, 1997). The boundary between a convective and collapsing column can be mapped out using PlumeRise, where the critical parameters controlling the fate of the column are gas mass fraction (volatile content of the magma), mass eruption rate (ṁ), and vent radius (Table 1). Clarke (2020) found that by taking the initial parameters for, and assessing the height of the top of the gas thrust region (defined by local minima in plume velocity; e.g., Trolese et al., 2019) for columns at the convective-column/collapsing-column transition: H0 at the onset of collapse can be estimated; given a vent radius and water content of the magma (Equation 2).
where H0 is the height of the gas thrust region in meters, H2O is the water content of the magma in wt% and r is the vent radius in meters. a, b and c are regression coefficients related to the location of the convecting/collapsing eruption column boundary within the parameter space. For eruption columns produced during pumice cone eruptions at Aluto, maximum-likelihood estimation yields: a = 12.78, b = −0.61 and c = 1.1. These values are appropriate within the parameter space explored using PlumeRise (Table 1). Evaluation of the PlumeRise model parameter space also allows the mass eruption rate at the point of collapse (ṁc, kg/s) to be estimated given r and H2O, by Equation (3):
where d, e, f, g, h are regression coefficients estimated through maximum likelihood of the PlumeRise simulation outputs. For Aluto: d = 809, e = −1.01, f = −50.6, g = −0.014, and h = 2.54.
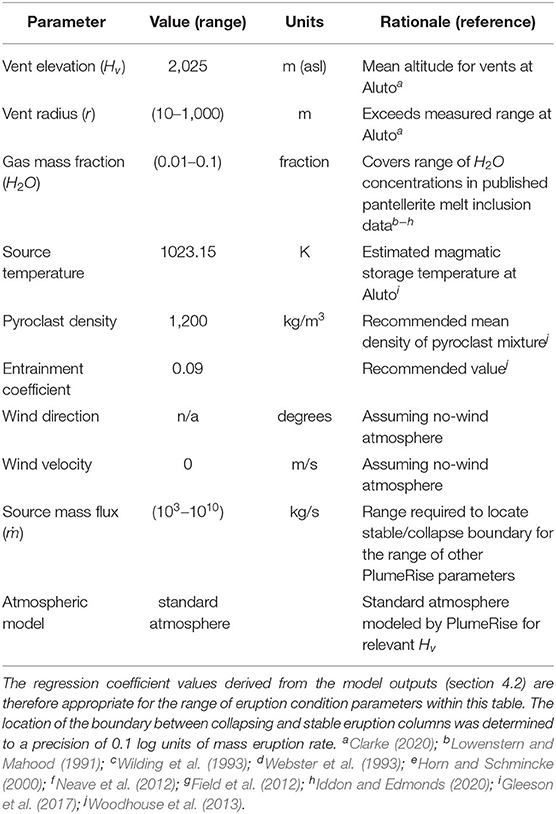
Table 1. Parameters used in the PlumeRise model to locate the stable/collapsing column boundary in mass eruption rate/vent radius/gas mass fraction parameter space.
Since we know, from field evidence, that column collapse occurs at Aluto, we know that eruption conditions pass through those at the boundary between stable and collapsing columns. If we can estimate a fixed gas mass fraction (magmatic water content) and a vent radius at the point of collapse, there is a unique value of H0 and ṁc determined by Equations (2) and (3). Equations (2) and (3) were evaluated iteratively (2 × 10⁶ times) for the expected distribution of vent radii and magmatic water contents at Aluto. Vent radii were measured from the DTM and fitted with a simple triangular distribution (between 10 and 100 m), that extends beyond the dataset to include the possibility of larger events in the future. Water contents were estimated from a review of melt inclusion data in peralkaline rhyolites globally, though because the data set is limited, and the likely distribution of these water contents is uncertain, we assume an uninformative uniform distribution between 4 and 8 wt% H2O. These values are appropriate for the typical high water contents of pantellerite melts (e.g., Lowenstern and Mahood, 1991; Webster et al., 1993; Wilding et al., 1993; Horn and Schmincke, 2000; Field et al., 2012; Neave et al., 2012), and are consistent with melt inclusion data from Aluto (Iddon and Edmonds, 2020). The product is a histogram of expected H0 for Aluto (Figure 6), which can be combined with Hv during the energy cone simulations at each vent to give Hc, where Hc = H0 + Hv.
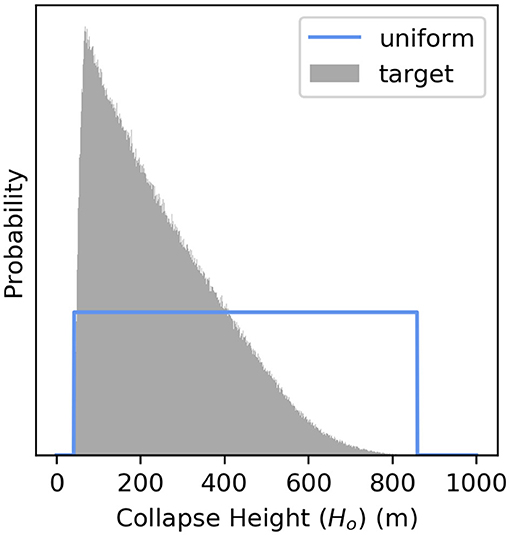
Figure 6. Normalized histogram (gray) showing the expected “target” distribution of collapse heights (Ho) above the vent, based on iterative evaluation of Equation (2) assuming the estimated distribution of vent radii and magmatic water contents at Aluto. A uniform PDF (blue) is fitted to this data and was used for sampling the H0 parameter during energy cone simulation. In importance sampling, the histogram is used as a target PDF to weight the simulation outputs.
Though not required for the energy cone model, the ṁc calculated in Equation (3) is a useful incidental parameter. We note that for the PlumeRise parameterization (Table 1), and expected distributions of r and H2O at Aluto, ṁc ranges from 104 kg/s to 5 × 10⁶ kg/s. This is consistent with violent-strombolian to sub-Plinian intensity eruptions (Pyle, 2015) tentatively estimated from tephra fall deposits (Fontijn et al., 2018; McNamara et al., 2018) and some proximal deposit constraints (Clarke et al., 2019). This provides confidence that our estimates of eruption conditions are within the correct orders of magnitude for Aluto.
An alternative approach to estimate H0 is to treat the plume at the point of column collapse as a simple turbulent fountain (e.g., Kaye and Hunt, 2006; Carazzo et al., 2010), where the height of the fountain (H0) can be estimated by the vent radius, entrainment coefficient and, in volcanic plumes, the dimensionless Richardson number (Ri). The transition between a stable plume and collapsing column occurs at a critical Ri (~0.3) (Kaminski et al., 2005; Degruyter and Bonadonna, 2013; Aubry and Jellinek, 2018), and so H0 can be approximated as ~6.4r. Though this method is less adapted to the specific volcano, it is more generalizable, and does not require estimation of the gas mass fraction of the magma. Within the range of vent radii expected at Aluto (10–100 m), this parameterization of H0 is broadly consistent with the PlumeRise-based methodology that we employ in this work, and so is a viable alternative (see Supplementary Material). If the turbulent fountain-based methodology is used, a Monte Carlo approach can be used to produce a PDF of H0, based on the expected distribution of vent radii only. For importance sampling, this H0 PDF can be used identically to that derived from the PlumeRise-based methodology.
4.3. Parameterizing PDC Mobility
In the energy cone model, PDC mobility is empirically defined from the dH/l ratio, where dH is the measured vertical height drop of the PDC (Hc minus the measured altitude of the PDC deposit toe), and l is the PDC horizontal run out (measured horizontally from the vent to the most distal reach of the deposit) (Malin and Sheridan, 1982). The mobility of the PDC, or angle of the energy line (ϕ) is then (Equation 4):
In our Monte Carlo energy cone model, ϕ is iteratively sampled from a uniform distribution, and combined with a sampled H0. Later, importance sampling can be used to adapt this sample to the expected distribution of ϕ and H0 in nature. The model is therefore contingent on a realistic distribution of ϕ. Ideally, this would be measured at the volcano in question, but at many volcanoes, including Aluto, such data are very hard to obtain, and/or has not been collected yet. We utilize the FlowDat database (Ogburn, 2012) of PDC data, which includes published dH and l values for a large number of PDCs world wide. As the values in the FlowDat dataset are sourced from numerous workers, the ways in which dH and l are measured in the field vary; from observed eruption column collapse and deposit measurement, to approximating dH as the difference between Hv and the altitude of the PDC deposit toe (thus ignoring H0, and overestimating ϕ). Because of this, values within the FlowDat dataset are each known to greater or lesser degrees of confidence and precision. This is an additional source of uncertainty, which remains unaccounted for in our assessment. Nonetheless, it has been previously observed (Pablo Tierz, unpublished data) that the impact of H0 uncertainty on the estimates of ϕ values in the FlowDat database is small. We filter the FlowDat data set, excluding PDCs not representative of Aluto, so that those remaining only include those from column collapse events, and also excluding those produced during caldera forming eruptions or by lateral blasts. Details of the analog data used can be found in the Supplementary Materials. This provides 59 values of ϕ to which we fit a truncated Gaussian distribution (μ= 15.18, σ= 6.3, lower limit = 2, upper limit = 30) (Figure 7), in accordance with the observed Gaussian distribution of PDC mobilities (Sheridan and Macías, 1995; Tierz et al., 2016a,b). The Gaussian PDF is truncated to avoid extreme and physically inconsistent mobilities (including zero and negative values) that would otherwise be sampled in the upper and lower tails of a standard Gaussian distribution (Tierz et al., 2016a,b). The locations of the truncation points are the closest integers to the highest and lowest values of ϕ in the filtered FlowDat dataset. This truncated Gaussian PDF is used for the importance sampling later, but a uniform PDF between 2 and 30 degrees is used for initially sampling the parameter pairs for simulation.
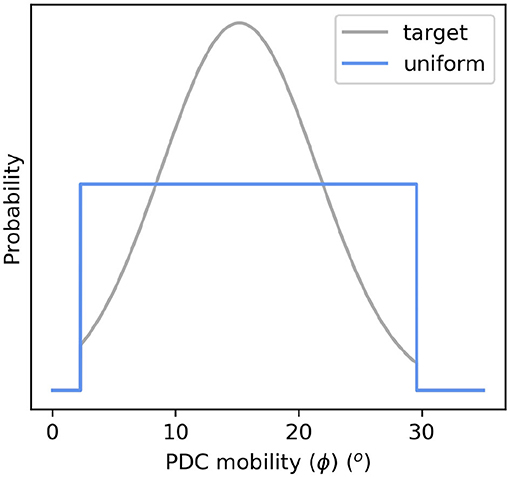
Figure 7. The truncated Gaussian “target” PDF (gray) showing the expected distribution of PDC mobilities (ϕ) at Aluto in nature. The uniform PDF (blue) was used to sample the ϕ parameter during energy cone simulation. In importance sampling, the target PDF was used to weight the simulation outputs.
5. Computing Probabilities of PDC Inundation
5.1. Energy Cone Modeling
The energy cone model was iterated across the regular grid of 1,221 potential vents, with 10,000 PDC simulations at each vent; each time sampling the same list of input parameter pairs (H0 and ϕ). H0 and ϕ pairs were randomly sampled from uniform distributions entirely independent from one another, and so we implicitly assume that these parameters are independent. We justify this as there is no clear relationship between collapse height and mobility in the FlowDat dataset (Tierz et al., 2016a). Ten thousand simulations is generally considered to be statistically representative (e.g., Tierz et al., 2016a,b; Sandri et al., 2018), and provides a precision of 0.01, or 1% (, where n is the number of iterations). The energy cone analysis was conducted using a modified version of the Matlab script developed for Somma-Vesuvius and Campi Flegrei (Tierz et al., 2016a,b), and a 30 m resolution DTM re-sampled from Hutchison et al. (2014). Each simulation produces a footprint over a grid of 30 m cells, where each inundated cell is given a value of “1,” and cells which were not inundated are given a value of “0.” Though individually each simulation is computationally light, the computational expense of the 12 × 106 necessary energy cone simulations is still high. However, as each simulation is independent, the task can be readily divided across a computing cluster, minimizing the total run time. The analysis was conducted on the EDDIE cluster at the University of Edinburgh Compute and Data Facility, producing 10,000 PDC inundation footprints from each potential vent. Collectively, the results represent uniformly distributed input parameters of vent location, collapse height, and mobility across the range of expected values for each.
5.2. Importance Sampling
In the next phase of the assessment, each grid of results from an energy cone simulation is multiplied by a “weight factor,” in a process known as “importance sampling”; placing greater importance on the results of simulations we consider more likely, and less importance on those we consider less likely. Once this is done, the weighted results of all simulations are summed. Grid cells with the highest values are those which are the most prone to inundation by the type and source location of PDCs we expect to see at Aluto. This value is the conditional inundation probability [P(PDC|eruption)]; our PVHA.
Firstly, the importance, or “weight factor” (W), associated with the H0 and ϕ used for each simulation (k) must be calculated (Equation 5). This is done by taking the product of the probability of H0 and ϕ from their expected, or “target,” PDFs calculated earlier [f(Hk) and f(ϕk)]. This is then divided by the product of the sampled probabilities of Ho and ϕ, taken from the uniform PDFs [g(Hk) and g(ϕk)]. A graphical representation of this process, with a worked example, is provided in Figure 8. The weight associated with each simulation parameter pair is shown in Figure 9.
The probability of PDC inundation in grid cell j, given an eruption of vent i [P(PDCj|venti)], can then be calculated as Equation (6):
where S is the total number of simulations from vent i (in this case, 10,000), k is the identity of each simulation, and s is a binary 1 or 0 within each grid cell noting inundation vs. no inundation. Effectively, this counts the proportion of weighted simulations in which a PDC inundated cell j from vent i. The final step is to also consider the probability of the PDCs being sourced from each vent; this gives the probability of inundation in grid cell j given an eruption [P(PDCj)], by Equation (7).
where P(venti) is the probability of vent i being the source of the next eruption; calculated in Equation (1). Equation (7) is applied to every grid cell, producing a map of P(PDC|eruption). Importance sampling was conducted using Python, and a fully reproducible exemplar Jupyter notebook with sample energy-cone model data can be found in the via Zenodo/Github (https://doi.org/10.5281/zenodo.3778328).
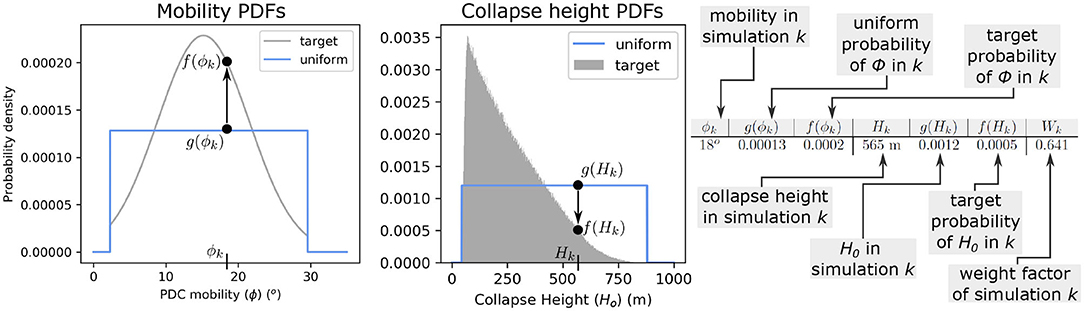
Figure 8. Graphical explanation of the methodology to calculate the weight factor (W) for simulation k. The values for the probability of the collapse height (Ho), and PDC mobility (ϕ), from the target (f) and uniform (g) probability density functions (PDFs) are evaluated at the value of ϕ and Ho used in simulation k. Wk can then be calculated by Equation (5). In this example, Wk = 0.641, meaning that grid cells in the output of this simulation will be multiplied by 0.641, lowering their relative importance.
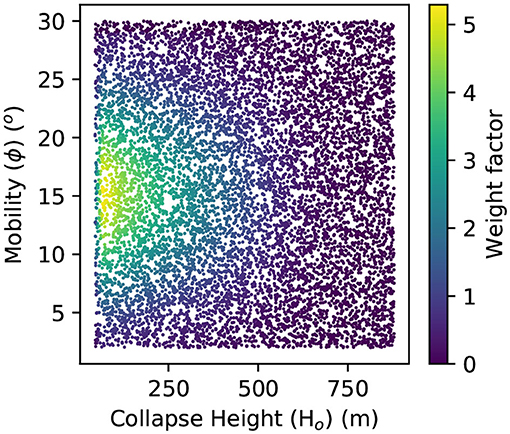
Figure 9. Weighting factors associated with each of the 10,000 collapse height-mobility parameter pairs for energy cone simulations at Aluto. Uniformly distributed parameter pairs are simulated in the energy cone model at each vent, and then the desired weighting can be applied retrospectively. This allows updated collapse height and mobility distributions to be included in future PVHAs without having to re-run the time consuming energy cone model.
6. A PVHA of PDCs at Aluto Volcano
The main result of the Monte Carlo energy cone PVHA is presented as a map (Figure 10), showing the contoured conditional probability of PDC indundation given an eruption from Aluto [P(PDC|eruption)] at a 30 m resolution (this probability map is available as a georeferenced “.Tiff” in the Supplementary Material). The 0.01 (1%) probability contour circles the volcano at a 5 km distance from the break in slope at the edge of the edifice, though is somewhat closer on the Eastern flank where it meets steeper topography nearing the edge of the Main Ethiopian Rift. In general, the probability increases toward the edifice, but is particularly high on the outer flanks of the volcano in the SE (between O'Itu Woshe and Kelibo), and the W and NW (between Abule and Sedecha). The caldera floor has the highest probability of PDC inundation with a maximum conditional probability just exceeding 0.12 (12%). This maximum probability is in the eastern region of the caldera floor, which happens to be the location of the geothermal power station. Despite being the most probable location of the next vent (Figure 4), the highest topography on the volcano (just beyond the southern edge of the caldera floor) represents the lowest probability of PDC inundation on the edifice.
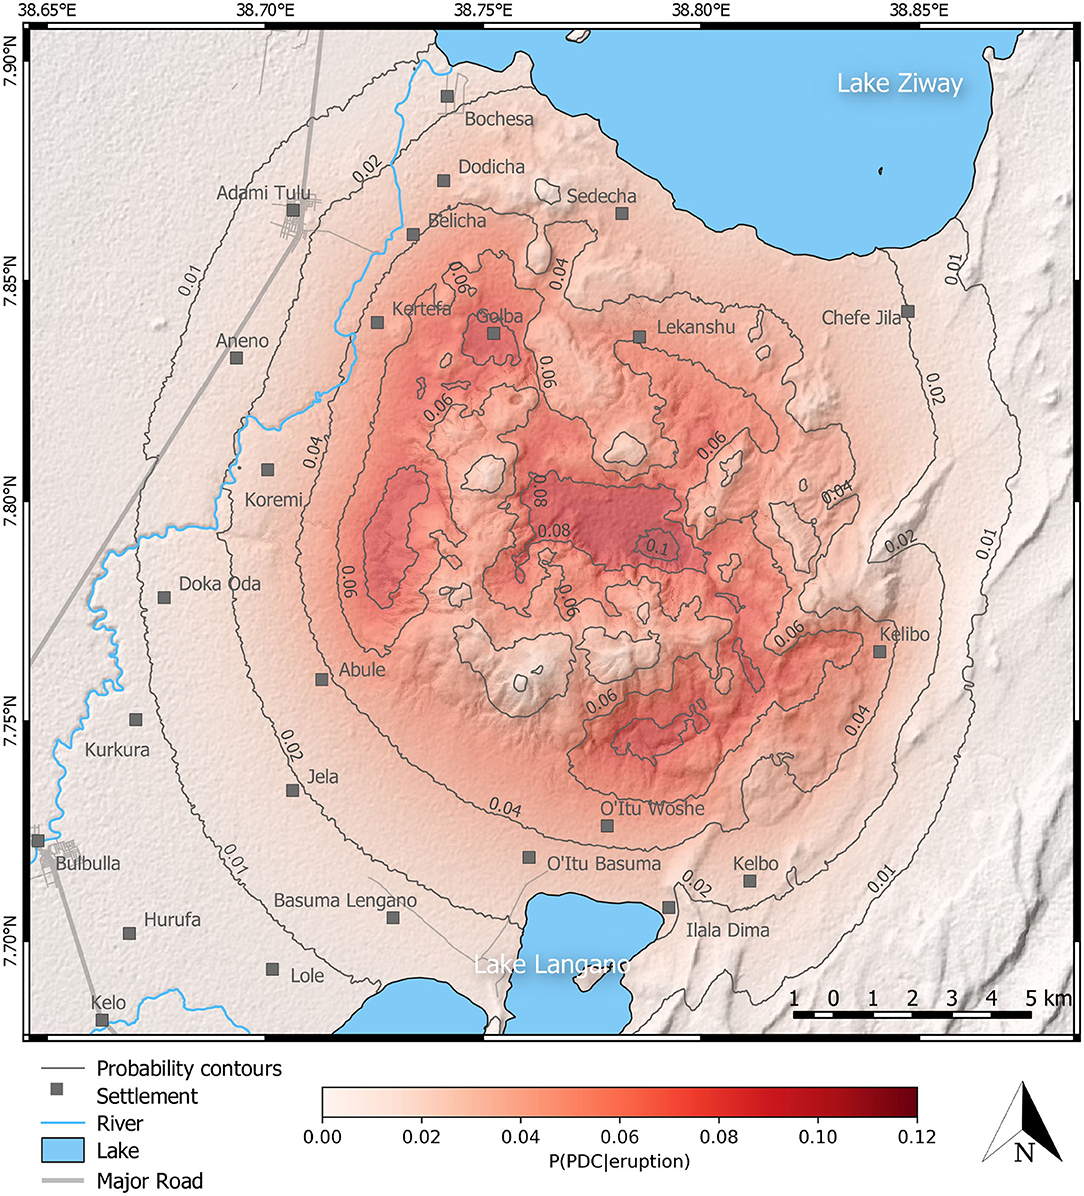
Figure 10. Result of the energy cone modeling showing the conditional probability of PDC inundation around Aluto given an eruption P(PDC|eruption). Probability is provided at a 30 m resolution and has a precision of 0.01 (1%). Apart from the bounding 0.01 (1%) contour, contours of probability are in increments of 0.02 (2%). Settlements names and locations are sourced from the Ethiopian mapping agency. Roads are sourced from OpenStreetMap. High resolution (2 m) LiDAR DTM of Aluto is from Hutchison et al. (2014). Lower resolution (1 arc second) STRM DTM of surrounding regions is from NASA (2014).
7. Discussion
7.1. PDC Hazard Around Aluto
The map presented in Figure 10 indicates the areas that are most likely to be inundated during the next pumice cone eruption at Aluto volcano. The highest probabilities are in low lying regions close to, and on, the edifice. The wide area of possible vent locations around Aluto means that the probability of PDC inundation is spread broadly around the edifice. This means that a wider region may potentially be affected by any given PDC, but that probability of inundation is more homogeneous across the hazard domain. This “dissipating effect” has been observed at other caldera systems (e.g., Campi Flegrei, Italy; Neri et al., 2015; Sandri et al., 2018), although the computed probability map of PDC inundation may still strongly depend on the vent-opening model used (e.g., Long Valley caldera, USA; Rutarindwa et al., 2019). By Comparison, at “central-vent” volcanoes, conditional (or even absolute temporal) PDC inundation probabilities approach 1 close to the vent [e.g., Somma-Vesuvius, Italy; (Tierz et al., 2016a,b); Soufrière Hills, Montserrat; (Dalbey, 2009)]. In any case, Aluto is more geomorphologically complex than the two cases just illustrated; with many connected prominences, a central caldera depression, and a diversity of eruptive centers. This means that topographically high regions on the edifice itself, despite being the most probable source location of PDCs, are amongst the least likely to be inundated. This is because their high elevation renders them accessible only to PDCs that originate locally, as opposed to basins around the volcano which are susceptible to inundation by PDCs from a far wider range of potential vents. The caldera is therefore the most likely region to be inundated, as it represents a basin surrounded on all sides by regions with a high vent opening probability. This result is particularly relevant from a risk perspective, as the caldera hosts a school, small settlements, and a geothermal power station. Away from the volcano, flat lying plains to the NE, S, and W provide little impedance to PDCs, whereas topographically complex regions to the E provide barriers that shelter regions comparatively closer to the edifice. It is also important to consider that the maximum area inundated during simulations also strongly depends on the choice of widest vent radius and minimum gas mass fraction (thus tallest H0), and the most mobile PDC (smallest ϕ); so that the results are a direct consequence of decisions made in the model parameterization.
Despite Ziway's (the main town in the region) proximity to a region of high vent opening probability (the hills between Sedecha and Dodicha), the conditional probability of PDC inundation given an eruption there is relatively low. This is because Ziway sits on the NW edge of the hazard domain, and so is only susceptible to inundation by locally generated PDCs; mostly those from the Sedecha-Dodicha hills, which represent a small subset of those simulated in the entire analysis. However, if the vent opening probability was conditioned so that the vent opened in the region of these hills, the probability of PDC inundation in Ziway would be higher. With the results of the Monte carlo energy cone model at Aluto, it is possible to conduct the importance sampling such that particular scenarios (such as an eruption from somewhere in the region of the Sedicha-Dodicha hills) can be assessed. These scenarios could be useful during a volcanic crisis, where monitoring information (seismic swarms, ground deformation etc.) may indicate the probable location of the vent (e.g., Sandri et al., 2012; Sigmundsson et al., 2015).
7.2. The Use of Field Data to Parameterize Energy Cone Models
To generate a robust PVHA, the model parameterization must reflect the range and distribution of processes that occur at the particular volcano in question (e.g., Connor et al., 2001; Newhall and Hoblitt, 2002; Marzocchi et al., 2004; Bebbington, 2014). This presents a significant challenge for volcanoes which are poorly studied, or behave in a manner distinct to other volcanoes. As far as the authors are aware, this work represents the first PVHA for PDCs at any African volcano, and is certainly the first for pumice-cone style eruptions globally. For any volcano, it is essential to understand the behavior of the system in order to tailor the methodology for PVHA to (1) minimize epistemic uncertainty; gaining the most precise picture possible; and (2) to evaluate aleatory uncertainty, to present a result that reflects an inherently uncertain volcanic system. This understanding is gained through field, laboratory and remote sensing investigations (e.g., Tierz, 2020). In the case of this work, such investigations played a central role, they:
1. Indicated that pumice cone eruptions frequently generate PDCs, and suggested that they were generated by a column collapse mechanism.
2. Showed that at Aluto pumice cone eruptions occur in distinct locations, and that individual vents tend only to be active during one eruption. Which was essential information to quantify the vent-opening probability.
3. Provided evidence to quantify the mass flux, gas mass fraction and vent radius just prior to column collapse, and in turn estimate the height of the gas thrust region (therefore the collapse height of PDCs) (Clarke, 2020).
4. Provided criteria for filtering the FlowDat PDC dataset.
However, there are problems inherent in the use of such data. The first is that they only represent events that have occurred in the past, and so do not necessarily represent the range of events that could occur in the future (e.g., Marzocchi et al., 2012). In order to consider such eventualities, it may be appropriate to extend model parameter distributions. At Aluto, we did this for the vent radius, extending beyond the measured range taking a precautionary, or conservative, approach to consider the possibility of more intense events in the future.
Characterizing a particular eruption style for a volcano is also problematic, as volcanoes often change their behavior over time, and current activity unavoidably represents a “snap-shot” in the geological history of the volcano. Aluto, for example, first existed as a trachytic shield volcano, dominated by trachyte lava flows and tuffs (Hutchison et al., 2016c). Later it generated a caldera during one or two large-magnitude eruptions generating ignimbrite sheets (Hutchison et al., 2016c). Most recently, eruptions are dominated by the relatively modest magnitude peralkaline rhyolite pumice cones modeled here (Fontijn et al., 2018; Clarke et al., 2019; Clarke, 2020). We assume that the most recent pumice cone eruptions at Aluto are the most likely to be representative of the next eruption at Aluto, and so our PVHA does not consider the possibility of a different eruption style. Such caveats need to be clearly communicated to ensure that decisions made upon the PVHA are well informed.
Sampling issues must also be considered when using field data. The field investigations of pumice cones at Aluto focused on 9 pumice cone eruptions, out of 96 vents visible at the surface, and doubtless many more buried vents (Clarke, 2020). It is therefore important to question how much confidence should be placed on eruption scenarios based on these data. Field investigations are also limited by both exposure and preservation. Small events, or events that produce deposits which are more susceptible to erosion, for example, are likely to be under-represented in the geological record (e.g., Brown et al., 2014; McNamara et al., 2018). It is therefore possible that the larger, perhaps more hazardous, events are over represented in the energy cone models. The fact that new deposits cover older ones also presents a bias in the data set, where more recent events are the most likely to be exposed and therefore excessively influence the conceptual model of eruptions. However, if we assume stationarity of post-caldera volcanism (i.e., future eruptions will behave similarly to the post-caldera eruptions that were investigated), this bias is not necessarily problematic, and is implicit in the stationarity assumption. These issues are not unique to Aluto, and are important caveats to PVHA. Because of these limitations, careful and transparent extrapolation from the existing data set is required. Without extrapolation, there is a risk that the modeled parameter range is insufficient to truly reflect the natural variability. However, excessive extrapolation risks an overly-cautious and pessimistic PVHA, which might unduly influence decision making. Ultimately, decisions surrounding extrapolation are subjective, and so it is essential that a PVHA clearly and transparently communicates the scope, limitations and caveats of the assessment.
7.3. Scope, Limitations, and Caveats of Our Assessment
1. The PVHA presented here provides a conditional probability of PDC inundation around Aluto during its next eruption, assuming that the next eruption is similar to previous dry (not phreatomagmatic) post caldera eruptions at Aluto.
2. The intensity of eruptions (mass eruption rate: ultimately relating to H0; Clarke, 2020) modeled here exceeds the range of intensities based purely on measured vent radii and assumed water contents of the magma. To be cautious, we assume potential vent radii (<100 m) are capable of reaching roughly twice the largest measured vent radii. This increases the top-end of H0 to reflect the potential for more intense eruptions in the future.
3. The energy cone model does not consider eruption magnitude (total erupted mass), or the volume of any resulting PDCs. PDC volume is positively correlated to mobility (e.g., Hayashi and Self, 1992; Ogburn, 2012), and so volume remains an uncontrolled variable that may influence ϕ at Aluto. Considering the relatively low magnitudes of post-caldera eruptions at Aluto in the past (Fontijn et al., 2018; Clarke et al., 2019; Clarke, 2020), it is possible that some of the higher mobilities sampled here exceed those likely to occur naturally at Aluto.
4. The energy cone model does not consider PDC channelization, and so an increase in effective mobility within drainages is not considered.
5. The energy cone model assumes a radial PDC footprint around the vent, this can be unrealistic for PDCs with a strong directionality (e.g., Charbonnier and Gertisser, 2012; Tierz et al., 2016a,b; Ogburn and Calder, 2017). However, it does provide a cautious estimation of areas that could be inundated by a given PDC. It is also important to note that directionality of PDCs can be related to transient controlling mechanisms (Wolpert et al., 2018), and so assuming a radial footprint removes this bias (though admittedly does not address the uncertainty in directionality).
6. The PDC inundation footprint from the energy cone model is contingent on an accurate digital terrain model, even though it has been shown that uncertainty linked to DTM resolution is the lowest contribution to total epistemic uncertainty at other volcanoes (Somma-Vesuvius; Tierz et al., 2016b). However, terrain changes over time, particularly in dynamic volcanic-tectonic systems. For example, the generation of fault scarps, volcanic edifice collapses, or channel/basin-filling during eruptions may all influence the final PDC inundation footprint. Such potential changes are not considered in this assessment. The DTM acquisition dates are 2014 on the edifice, and for the wider region (Hutchison et al., 2014, NASA STRM, 2014).
7. The behavior of PDCs when they enter water is complex, and poorly understood (e.g., Branney and Kokelaar, 2002; Dufek et al., 2009; Sulpizio et al., 2014). The energy cone model does not consider the influence of the substrate on flow mobility, and therefore the footprint over water is highly uncertain (Sandri et al., 2018). For this reason, the PDC inundation probability map is clipped to exclude Lake Ziway in the north, and Lake Langano in the south.
8. As the understanding of Aluto's physical volcanology is in its early stages, and there has not been an observed eruption of the volcano, this model relies heavily on proxy and modeled data. This situation is quite common for many volcanoes around the world (e.g., Loughlin et al., 2015), but obviously introduces epistemic uncertainty into the PVHA results (e.g., Marzocchi et al., 2004). This epistemic uncertainty can be in part reduced using the recently developed VOLCANS methodology to more objectively select the most appropriate volcano analogs based on relatively first-order characteristics of the target volcano (Tierz et al., 2019).
8. Conclusions
By informing a Monte Carlo energy cone model with field constraints, volcanic plume modeling and global proxy data sets, we have developed the first PVHA for a pumice cone volcano. We find that at Aluto volcano (Ethiopia), the wide spread of potential vent locations means that despite the modest eruption columns that are likely to occur during pumice cone eruptions (Fontijn et al., 2018; McNamara et al., 2018; Clarke et al., 2019; Clarke, 2020), there is a wide area with a probability of PDC inundation equal or >5%, in the event of a pumice cone eruption. Given the aleatory uncertainty in vent opening, the probabilities tend to be more homogeneous and lower than those typically computed at “central-vent” stratovolcanoes (e.g., Bayarri et al., 2009; Tierz et al., 2016a,b, 2018). The highest conditional probability of PDC inundation is 12% within the caldera floor. Other relatively hazardous regions are the western and the south eastern flanks. This probability decays to 1% at around 5 km from the break in slope surrounding the edifice. This area encompasses numerous settlements, and the highest risk region, the caldera floor, hosts a school and geothermal infrastructure. Though the Monte Carlo energy cone modeling method comes with important caveats, this work now provides a robust background on which further PVHA (for PDCs and other volcanic hazards) at Aluto volcano can be developed. The work also provides a transferable methodology which could be applied to quantify PDC hazards at other caldera systems worldwide; particularly at peralkaline caldera systems, where volcanism is often dominated by pumice cone eruptions.
Data Availability Statement
All datasets generated for this study are included in the article/Supplementary Material. The code and files used to generate the energy cone model outputs for this study are available from the authors by request. A series of explanatory Jupyter notebooks and supporting files are available, which provide step-by-step explanations and examples of: (1) calculating the weights associated with input parameters, (2) calculating the vent opening probabilities across a grid of points based on the locations of existing vents, and (3) using this data to conduct importance sampling on a subset of the energy cone model outputs from Aluto, and export the results to a GIS-compatible file. These, including an example data set from Aluto, can be found in via Zenodo/Github at: https://doi.org/10.5281/zenodo.3778328.
Author Contributions
BC and PT authored the manuscript. BC conducted fieldwork and carried out all analyses under supervision of PT and EC, who also conducted fieldwork, helped to develop methodologies, and edited the manuscript. GY edited the manuscript, facilitated the research in Ethiopia, and was instrumental in developing the RiftVolc project. All authors contributed to the article and approved the submitted version.
Funding
This work is a contribution to the Natural Environment Research Council (NERC) funded RiftVolc project (NE/L013932/1, Rift volcanism: past, present and future) through which PT, EC, and GY are supported. In addition, BC was funded by a NERC doctoral training partnership grant (NE/L002558/1), and PT was also supported by Global Geological Risk Platform of the 350 British Geological Survey NC-ODA grant NE/R000069/1: Geoscience for Sustainable Futures.
Conflict of Interest
The authors declare that the research was conducted in the absence of any commercial or financial relationships that could be construed as a potential conflict of interest.
Acknowledgments
We thank Karen Fontijn, Firawalin Dessalegn, Vicki Smith, Sam Engwell, and Amdemichael Zafu for their help and discussions in the field. Particular thanks go to our drivers in the field: Solomon and Zelalem, who helped immensely to make the field expeditions run smoothly and enjoyably. We thank the numerous residents of Aluto who provided assistance, company and passage around Aluto. We also thank Elaine Spiller, Sue Loughlin, and Charlotte Vye-Brown for fruitful conversations about some aspects of this manuscript, and Ashley Smith for his assistance to improve the efficiency of the importance sampling code. Laura Sandri and Lucia Zaccarelli are greatly thanked for the development of the initial version of the Matlab code used to run the energy cone model. We thank Domenico Doronzo, and Guillaume Carazzo for their in-depth and constructive reviews, which greatly improved the manuscript. We also thank Derek Keir and Valerio Acocella for their editorial handling, and additional suggestions which further improved the manuscript. Published with permission of the Executive Director of British Geological Survey (NERC-UKRI).
Supplementary Material
The Supplementary Material for this article can be found online at: https://www.frontiersin.org/articles/10.3389/feart.2020.00348/full#supplementary-material
The analog PDC mobility data is provided as “Data Sheet 1,” and the georeferenced PDC inundation probability map is provided as “Supplementary Figure” (EPSG:32637). A Supplementary Figure “Presentation 1,” that compares the collapse heights calculated by the alternative PlumeRise and turbulent fountain-based methodologies, is also provided.
References
Andrews, B. J., and Manga, M. (2011). Effects of topography on pyroclastic density current runout and formation of coignimbrites. Geology 39, 1099–1102. doi: 10.1130/G32226.1
Aspinall, W., Auker, M., Crosweller, S., Hincks, T. K., Mahony, S., Nadim, F., et al. (2011). Volcano Hazard and Exposure in Track II Countries and Risk Mitigation Measures - GFDRR Volcano Risk Study. Bristol University Cabot Institute and NGI Norway for the World Bank: NGI Report 20100806; 309pp.
Aspinall, W. P., Woo, G., Voight, B., and Baxter, P. J. (2003). Evidence-based volcanology: application to eruption crises. J. Volcanol. Geotherm. Res. 128, 273–285. doi: 10.1016/S0377-0273(03)00260-9
Aubry, T. J., and Jellinek, A. M. (2018). New insights on entrainment and condensation in volcanic plumes: constraints from independent observations of explosive eruptions and implications for assessing their impacts. Earth Planet. Sci. Lett. 490, 132–142. doi: 10.1016/j.epsl.2018.03.028
Bayarri, M. J., Berger, J. O., Calder, E. S., Dalbey, K., Lunagomez, S., Patra, A. K., et al. (2009). Using statistical and computer models to quantify volcanic hazards. Technometrics 51, 402–413. doi: 10.1198/TECH.2009.08018
Bayarri, M. J., Berger, J. O., Calder, E. S., Patra, A. K., Pitman, E. B., Spiller, E. T., et al. (2015). Probabilistic quantification of hazards: a methodology using small ensembles of physics-based simulations and statistical surrogates. Int. J. Uncertain. Quantif. 5, 297–325. doi: 10.1615/Int.J.UncertaintyQuantification.2015011451
Bebbington, M. S. (2014). Long-term forecasting of volcanic explosivity. Geophys. J. Int. 197, 1500–1515. doi: 10.1093/gji/ggu078
Bebbington, M. S., and Jenkins, S. F. (2019). Intra-eruption forecasting. Bull. Volcanol. 81:34. doi: 10.1007/s00445-019-1294-9
Bevilacqua, A., Isaia, R., Neri, A., Vitale, S., Aspinall, W. P., Bisson, M., et al. (2015). Quantifying volcanic hazard at Campi Flegrei caldera (Italy) with uncertainty assessment: 1. Vent opening maps. J. Geophys. Res. 120, 2309–2329. doi: 10.1002/2014JB011775
Bevilacqua, A., Neri, A., Bisson, M., Ongaro, T. E., Flandoli, F., Isaia, R., et al. (2017). The effects of vent location, event scale, and time forecasts on pyroclastic density current hazard maps at campi flegrei caldera (Italy). Front. Earth Sci. 5:72. doi: 10.3389/feart.2017.00072
Biggs, J., Bastow, I. D., Keir, D., and Lewi, E. (2011). Pulses of deformation reveal frequently recurring shallow magmatic activity beneath the Main Ethiopian Rift. Geochem. Geophys. Geosyst. 12, 1–11. doi: 10.1029/2011GC003662
Braddock, M., Biggs, J., Watson, I. M., Hutchison, W., Pyle, D. M., and Mather, T. A. (2017). Satellite observations of fumarole activity at Aluto volcano, Ethiopia: implications for geothermal monitoring and volcanic hazard. J. Volcanol. Geotherm. Res. 341, 70–83. doi: 10.1016/j.jvolgeores.2017.05.006
Branney, M. J., and Kokelaar, P. (2002). Pyroclastic Density Currents and the Sedimentation of Ignimbrites, Vol. 27. Bath: Geological Society of London Special Publications.
Breard, E. C., Dufek, J., and Lube, G. (2018). Enhanced mobility in concentrated pyroclastic density currents: an examination of a self-fluidization mechanism. Geophys. Res. Lett. 45, 654–664. doi: 10.1002/2017GL075759
Breard, E. C., and Lube, G. (2017). Inside pyroclastic density currents-uncovering the enigmatic flow structure and transport behaviour in large-scale experiments. Earth Planet. Sci. Lett. 458, 22–36. doi: 10.1016/j.epsl.2016.10.016
Brown, S. K., Crosweller, H. S., Sparks, R. S. J., Cottrell, E., Deligne, N. I., Guerrero, N. O., et al. (2014). Characterisation of the Quaternary eruption record: analysis of the Large Magnitude Explosive Volcanic Eruptions (LaMEVE) database. J. Appl. Volcanol. 3, 1–22. doi: 10.1186/2191-5040-3-5
Brown, S. K., Jenkins, S. F., Sparks, R. S. J., Odbert, H., and Auker, M. R. (2017). Volcanic fatalities database: analysis of volcanic threat with distance and victim classification. J. Appl. Volcanol. 6, 1–20. doi: 10.1186/s13617-017-0067-4
Calder, E. S., Cole, P. D., Dade, W. B., Druitt, T. H., Hoblitt, R. P., Huppert, H. E., et al. (1999). Mobility of pyroclastic flows and surges at the Soufriere Hills volcano, Montserrat. Geophys. Res. Lett. 26, 537–540. doi: 10.1029/1999GL900051
Calder, E. S., Sparks, R. S., and Woods, A. W. (1997). Dynamics of co-ignimbrite plumes generated from pyroclastic flows of Mount St. Helens (7 August 1980). Bull. Volcanol. 58, 432–440. doi: 10.1007/s004450050151
Calder, E. S., Wagner, K., and Ogburn, S. E. (2015). “Chapter 20: Volcanic hazard maps,” in Global Volcanic Hazards and Risk, 1st Edn eds S. Loughlin, S. Sparks, S. K. Brown, S. F. Jenkins, C. Vye-Brown (Cambridge: Cambridge University Press), 335–341. doi: 10.1017/CBO9781316276273.022
Cappello, A., Neri, M., Acocella, V., Gallo, G., Vicari, A., and Del Negro, C. (2012). Spatial vent opening probability map of Etna volcano (Sicily, Italy). Bull. Volcanol. 74, 2083–2094. doi: 10.1007/s00445-012-0647-4
Carazzo, G., Kaminski, E., and Tait, S. (2010). The rise and fall of turbulent fountains: a new model for improved quantitative predictions. J. Fluid Mech. 657, 265–284. doi: 10.1017/S002211201000145X
Charbonnier, S. J., and Gertisser, R. (2012). Evaluation of geophysical mass flow models using the 2006 block-and-ash flows of Merapi Volcano, Java, Indonesia: towards a short-term hazard assessment tool. J. Volcanol. Geotherm. Res. 231–232, 87–108. doi: 10.1016/j.jvolgeores.2012.02.015
Clarke, B., Calder, E. S., Dessalegn, F., Fontijn, K., Cortés, J. A., Naylor, M., et al. (2019). Fluidal pyroclasts reveal the intensity of peralkaline rhyolite pumice cone eruptions. Nat. Commun. 10, 1–10. doi: 10.1038/s41467-019-09947-8
Clarke, B. A. (2020). Post-caldera eruptions and pyroclastic density current hazard in the Main Ethiopian Rift (Ph.D.). University of Edinburgh, Edinburgh, Scotland.
Connor, B., and Hill, E. (1995). Three nonhomogeneous Poisson models for the probability of basaltic volcanism: application to the Yucca Mountain region, Nevada. J. Geophys. Res. 100, 107–117. doi: 10.1029/95JB01055
Connor, B. C. B., Hill, B. E., Winfrey, B., Franklin, N. M., and Femina, P. C. L. (2001). Estimation of volcanic hazards from tephra fallout. Nat. Hazards Rev. 2, 33–42. doi: 10.1061/(ASCE)1527-6988(2001)2:1(33)
Dalbey, K. (2009). Predictive simulation and model based hazard maps of geophysical mass flows (Ph.D. thesis). University at Buffalo, Buffalo, NY, United States.
Dalbey, K., Patra, A. K., Pitman, E. B., Bursik, M. I., and Sheridan, M. F. (2008). Input uncertainty propagation methods and hazard mapping of geophysical mass flows. J. Geophys. Res. 113:B05203. doi: 10.1029/2006JB004471
Degruyter, W., and Bonadonna, C. (2013). Impact of wind on the condition for column collapse of volcanic plumes. Earth Planet. Sci. Lett. 377–378, 218–226. doi: 10.1016/j.epsl.2013.06.041
Dellino, P., Dioguardi, F., Mele, D., D'Addabbo, M., Zimanowski, B., Büttner, R., et al. (2014). Volcanic jets, plumes, and collapsing fountains: evidence from large-scale experiments, with particular emphasis on the entrainment rate. Bull. Volcanol. 76, 1–18. doi: 10.1007/s00445-014-0834-6
Dellino, P., and Volpe, L. L. (1995). Fragmentation versus transportation mechanisms in the pyroclastic sequence of Monte Pilato-Rocche Rosse (Lipari, Italy). J. Volcanol. Geotherm. Res. 64, 211–231. doi: 10.1016/0377-0273(94)00084-T
Di Roberto, A., Bertagnini, A., Pompilio, M., and Bisson, M. (2014). Pyroclastic density currents at Stromboli volcano (Aeolian Islands, Italy): a case study of the 1930 eruption. Bull. Volcanol. 76, 1–14. doi: 10.1007/s00445-014-0827-5
Doronzo, D. M., de Tullio, M. D., Dellino, P., and Pascazio, G. (2011). Numerical simulation of pyroclastic density currents using locally refined Cartesian grids. Comput. Fluids 44, 56–67. doi: 10.1016/j.compfluid.2010.12.006
Douillet, G. A., Pacheco, D. A., Kueppers, U., Letort, J., Tsang-Hin-Sun, E., Bustillos, J., et al. (2013). Dune bedforms produced by dilute pyroclastic density currents from the August 2006 eruption of Tungurahua volcano, Ecuador. Bull. Volcanol. 75, 1–20. doi: 10.1007/s00445-013-0762-x
Dufek, J., Wexler, J., and Manga, M. (2009). Transport capacity of pyroclastic density currents: experiments and models of substrate-flow interaction. J. Geophys. Res. 114, 1–13. doi: 10.1029/2008JB006216
Field, L., Blundy, J., Brooker, R. A., Wright, T., and Yirgu, G. (2012). Magma storage conditions beneath Dabbahu Volcano (Ethiopia) constrained by petrology, seismicity and satellite geodesy. Bull. Volcanol. 74, 981–1004. doi: 10.1007/s00445-012-0580-6
Fink, J. H. (1983). Structure and emplacement of a rhyolitic obsidian flow, Little Glass Mountain, North California. Geol. Soc. Am. Bull. 94, 362–380. doi: 10.1130/0016-7606(1983)94<362:SAEOAR>2.0.CO;2
Fisher, R. V. (1995). Decoupling of pyroclastic currents: hazards assessments. J. Volcanol. Geotherm. Res. 66, 257–263. doi: 10.1016/0377-0273(94)00075-R
Fisher, R. V., and Schmincke, H.-U. (1984). Pyroclastic Rocks, 1st Edn. Berlin: Springer-Verlag. doi: 10.1007/978-3-642-74864-6
Fontijn, K., McNamara, K., Zafu Tadesse, A., Pyle, D. M., Dessalegn, F., Hutchison, W., et al. (2018). Contrasting styles of post-caldera volcanism along the Main Ethiopian Rift: implications for contemporary volcanic hazards. J. Volcanol. Geotherm. Res. 356, 90–113. doi: 10.1016/j.jvolgeores.2018.02.001
Gioncada, A., and Landi, P. (2010). The pre-eruptive volatile contents of recent basaltic and pantelleritic magmas at Pantelleria (Italy). J. Volcanol. Geotherm. Res. 189, 191–201. doi: 10.1016/j.jvolgeores.2009.11.006
Gleeson, M., Stock, M., Pyle, D. M., Mather, T. A., Hutchison, W., Yirgu, G., et al. (2017). Constraining magma storage conditions at a restless volcano in the Main Ethiopian Rift using phase equilibria models. J. Volcanol. Geotherm. Res. 337, 44–61. doi: 10.1016/j.jvolgeores.2017.02.026
Griffiths, R. W., and Fink, J. H. (1993). Effects of surface cooling on the spreading of lava flows and domes. J. Fluid Mech. 252, 667–702. doi: 10.1017/S0022112093003933
Hayashi, J., and Self, S. (1992). A comparison of pyroclastic flow and debris avalanche mobility. J. Geophys. Res. 97, 9063–9071. doi: 10.1029/92JB00173
Hengsdijk, H., and Jansen, H. (2006). Agricultural Development in the Central Ethiopian Rift Valley: A Desk-Study on Water-Related Issues and Knowledge to Supporta Policy Dialogue. Wagningen University & Research.
Horn, S., and Schmincke, H.-U. (2000). Volatile emission during the eruption of Baitoushan Volcano (China/North Korea) ca. 969 AD. Bull. Volcanol. 61, 537–555. doi: 10.1007/s004450050004
Houghton, B. F., Weaver, S. D., Wilson, C. J., and Lanphere, M. A. (1992). Evolution of a Quaternary peralkaline volcano: Mayor Island, New Zealand. J. Volcanol. Geotherm. Res. 51, 217–236. doi: 10.1016/0377-0273(92)90124-V
Houghton, B. F., White, J. D., and Van Eaton, A. R. (2015). “Chapter 30: Phreatomagmatic and related eruption styles,” in Encyclopedia of Volcanoes 2, eds H. Sigurdsson, B. Houghton, S. R. McNutt, H. Rymer, J. Stix (London: Springer), 538–552. doi: 10.1016/B978-0-12-385938-9.00030-4
Houghton, B. F., and Wilson, C. J. (1989). A vesicularity index for pyroclastic deposits. Bull. Volcanol. 51, 451–462. doi: 10.1007/BF01078811
Hübert, J., Whaler, K., and Fisseha, S. (2018). The electrical structure of the central main ethiopian rift as imaged by magnetotellurics: implications for magma storage and pathways. J. Geophys. Res. 123, 6019–6032. doi: 10.1029/2017JB015160
Hutchison, W. (2015). Past, present and future volcanic activity at restless calderas in the Main Ethiopian Rift (Ph.D. thesis). University of Oxford, Oxford, United Kingdom.
Hutchison, W., Biggs, J., Mather, T. A., Pyle, D. M., Lewi, E., Yirgu, G., et al. (2016a). Causes of unrest at silicic calderas in the East African Rift: new constraints from InSAR and soil-gas chemistry at Aluto volcano, Ethiopia. Geochem. Geophys. Geosyst. 17, 2825–2834. doi: 10.1002/2016GC006395
Hutchison, W., Fusillo, R., Pyle, D. M., Mather, T. A., Blundy, J. D., Biggs, J., et al. (2016b). A pulse of mid-Pleistocene rift volcanism in Ethiopia at the dawn of modern humans. Nat. Commun. 7, 1–12. doi: 10.1038/ncomms13192
Hutchison, W., Mather, T. A., Pyle, D. M., Biggs, J., and Yirgu, G. (2015). Structural controls on fluid pathways in an active rift system: a case study of the Aluto volcanic complex. Geosphere 11, 542–562. doi: 10.1130/GES01119.1
Hutchison, W., Pyle, D. M., Mather, T. A., Biggs, J., and Yirgu, G. (2014). 2012 Aluto LiDAR data. Figshare, Dataset. doi: 10.6084/m9.figshare.1261646.v2
Hutchison, W., Pyle, D. M., Mather, T. A., Yirgu, G., Biggs, J., Cohen, B. E., et al. (2016c). The eruptive history and magmatic evolution of Aluto volcano: new insights into silicic peralkaline volcanism in the Ethiopian rift. J. Volcanol. Geotherm. Res. 328, 9-33. doi: 10.1016/j.jvolgeores.2016.09.010
Iddon, F., and Edmonds, M. (2020). Volatile-rich magmas distributed through the upper crust in the Main Ethiopian Rift. Geochem. Geophys. Geosyst. 21, 1–24. doi: 10.1029/2019GC008904
Iddon, F., Edmonds, M., Jackson, C., Hutchison, W., Mather, T. A., Pyle, D. M., et al. (2017). “Reservoir architecture beneath peralkaline volcanoes, Main Ethiopian Rift,” in Volcanic and Magmatic Studies Group Conference (Liverpool), 118.
Kaminski, E., Tait, S., and Carazzo, G. (2005). Turbulent entrainment in jets with arbitrary buoyancy. J. Fluid Mech. 526, 361–376. doi: 10.1017/S0022112004003209
Kaye, N. B., and Hunt, G. R. (2006). Weak fountains. J. Fluid Mech. 558, 319–328. doi: 10.1017/S0022112006000383
Kelfoun, K., and Druitt, T. H. (2005). Numerical modeling of the emplacement of Socompa rock avalanche, Chile. J. Geophys. Res. 110, 1–13. doi: 10.1029/2005JB003758
Kelfoun, K., Gueugneau, V., Komorowski, J. C., Aisyah, N., Cholik, N., and Merciecca, C. (2017). Simulation of block-and-ash flows and ash-cloud surges of the 2010 eruption of Merapi volcano with a two-layer model. J. Geophys. Res. 122, 4277–4292. doi: 10.1002/2017JB013981
Koyaguchi, T., and Woods, A. W. (1996). On the formation of eruption columns following explosive mixing of magma and surface-water. J. Geophys. Res. 101, 5561–5574. doi: 10.1029/95JB01687
Lindsay, J., Marzocchi, W., Jolly, G., Constantinescu, R., Selva, J., and Sandri, L. (2010). Towards real-time eruption forecasting in the Auckland Volcanic Field: Application of BET_EF during the New Zealand National Disaster Exercise 'Ruaumoko'. Bull. Volcanol. 72, 185–204. doi: 10.1007/s00445-009-0311-9
Loughlin, S. C., Vye-brown, C., Sparks, R., Brown, S., Barclay, J., Calder, E. S., et al. (2015). Global Volcanic Hazards and Risk, Summary Background Paper for the UN-ISDR Global Assessment Report on Disaster Risk Reduction 2015. Technical report, Global Volcano Model and International Association of Volcanology and Chemistry of the Earth's Interior.
Lowenstern, J. B., and Mahood, G. (1991). New data on magmatic H2O contents of pantellerites, with implications for petrogenesis and eruptive dynamics at Pantelleria. Bull. Volcanol. 54, 78–83. doi: 10.1007/BF00278208
Malin, M. C., and Sheridan, M. F. (1982). Computer-assisted mapping of pyroclastic surges. Science 217, 637–640. doi: 10.1126/science.217.4560.637
Marti, J., and Felpeto, A. (2010). Methodology for the computation of volcanic susceptibility. An example for mafic and felsic eruptions on Tenerife (Canary Islands). J. Volcanol. Geotherm. Res. 195, 69–77. doi: 10.1016/j.jvolgeores.2010.06.008
Marzocchi, W., Garcia-Aristizabal, A., Gasparini, P., Mastellone, M. L., and Ruocco, A. D. (2012). Basic principles of multi-risk assessment: a case study in Italy. Nat. Hazards 62, 551–573. doi: 10.1007/s11069-012-0092-x
Marzocchi, W., Sandri, L., Gasparini, P., Newhall, C., and Boschi, E. (2004). Quantifying probabilities of volcanic events: the example of volcanic hazard at Mount Vesuvius. J. Geophys. Res. 109, 1–18. doi: 10.1029/2004JB003155
Marzocchi, W., Sandri, L., and Selva, J. (2010). BET_VH: a probabilistic tool for long-term volcanic hazard assessment. Bull. Volcanol. 72, 705–716. doi: 10.1007/s00445-010-0357-8
Mastin, L. G., and Witter, J. B. (2000). The hazards of eruptions through lakes and seawater. J. Volcanol. Geotherm. Res. 97, 195–214. doi: 10.1016/S0377-0273(99)00174-2
McNamara, K., Cashman, K. V., Rust, A. C., Fontijn, K., Chalié, F., Tomlinson, E. L., et al. (2018). Using lake sediment cores to improve records of volcanism at aluto volcano in the main ethiopian rift. Geochem. Geophys. Geosyst. 19, 3164–3188. doi: 10.1029/2018GC007686
Neave, D. A., Fabbro, G., Herd, R. A., Petrone, C. M., and Edmonds, M. (2012). Melting, differentiation and degassing at the pantelleria volcano, Italy. J. Petrol. 53, 637–663. doi: 10.1093/petrology/egr074
Neri, A., Bevilacqua, A., Ongaro, T. E., Isaia, R., Aspinall, W. P., Bisson, M., et al. (2015). Quantifying volcanic hazard at Campi Flegrei caldera (Italy) with uncertainty assessment: 2. Pyroclastic density current invasion maps. J. Geophys. Res. 120, 1605–1622. doi: 10.1002/2014JB011776
Newhall, C., and Hoblitt, R. (2002). Constructing event trees for volcanic crises. Bull. Volcanol. 64, 3–20. doi: 10.1007/s004450100173
Ogburn, S. (2012). FlowDat: Mass Flow Database v2.2. Available online at: https://vhub.org/groups/massflowdatabase.
Ogburn, S. E., and Calder, E. S. (2017). The relative effectiveness of empirical and physical models for simulating the dense undercurrent of pyroclastic flows under different emplacement conditions. Front. Earth Sci. 5:83. doi: 10.3389/feart.2017.00083
Orsi, G., Ruvo, L., and Scarpati, C. (1989). The Serra della Fastuca Tephra at Pantelleria: physical parameters for an explosive eruption of peralkaline magma. J. Volcanol. Geotherm. Res. 39, 55–60. doi: 10.1016/0377-0273(89)90020-6
Patra, A. K., Bauer, A. C., Nichita, C. C., Pitman, E. B., Sheridan, M. F., Bursik, M., et al. (2005). Parallel adaptive numerical simulation of dry avalanches over natural terrain. J. Volcanol. Geotherm. Res. 139, 1–21. doi: 10.1016/j.jvolgeores.2004.06.014
Pyle, D. M. (2015). “Chapter 13: Sizes of volcanic eruptions,” in Encyclopedia of Volcanoes 2, eds H. Sigurdsson, B. Houghton, S. R. McNutt, H. Rymer, J. Stix (Springer), 257-264. doi: 10.1016/B978-0-12-385938-9.00013-4
Roche, O., Gilbertson, M. A., Phillips, J. C., and Sparks, R. S. (2006). The influence of particle size on the flow of initially fluidised powders. Powder Technol. 166, 167–174. doi: 10.1016/j.powtec.2006.05.010
Rougier, J., Sparks, S., and Hill, L. J. (2013). Risk and Uncertainty Assessment for Natural Hazards, 1st Edn. Cambridge: Cambridge University Press. doi: 10.1017/CBO9781139047562
Rutarindwa, R., Spiller, E. T., Bevilacqua, A., Bursik, M. I., and Patra, A. K. (2019). Dynamic probabilistic hazard mapping in the long valley volcanic region ca: integrating vent opening maps and statistical surrogates of physical models of pyroclastic density currents. J. Geophys. Res. 124, 9600–9621. doi: 10.1029/2019JB017352
Samrock, F., Kuvshinov, A., Bakker, J., Jackson, A., and Fisseha, S. (2015). 3-D analysis and interpretation of magnetotelluric data from the Aluto-Langano geothermal field, Ethiopia. Geophys. J. Int. 202, 1923–1948. doi: 10.1093/gji/ggv270
Sandri, L., Jolly, G., Lindsay, J., Howe, T., and Marzocchi, W. (2012). Combining long- and short-term probabilistic volcanic hazard assessment with cost-benefit analysis to support decision making in a volcanic crisis from the Auckland Volcanic Field, New Zealand. Bull. Volcanol. 74, 705–723. doi: 10.1007/s00445-011-0556-y
Sandri, L., Thouret, J. C., Constantinescu, R., Biass, S., and Tonini, R. (2014). Long-term multi-hazard assessment for El Misti volcano (Peru). Bull. Volcanol. 76, 1–26. doi: 10.1007/s00445-013-0771-9
Sandri, L., Tierz, P., Costa, A., and Marzocchi, W. (2018). Probabilistic hazard from pyroclastic density currents in the Neapolitan Area (Southern Italy). J. Geophys. Res. 123, 3474–3500. doi: 10.1002/2017JB014890
Saucedo, R., Macías, J. L., Gavilanes-Ruiz, J. C., Bursik, M. I., and Vargas-Gutiérrez, V. (2019). “Pyroclastic density currents at volcán de Colima,” in Volcan de Colima, eds N. Varley, C. B. Connor (Springer), 111–139. doi: 10.1007/978-3-642-25911-1_11
Selva, J., Orsi, G., Di Vito, M. A., Marzocchi, W., and Sandri, L. (2012). Probability hazard map for future vent opening at the Campi Flegrei caldera, Italy. Bull. Volcanol. 74, 497–510. doi: 10.1007/s00445-011-0528-2
Sheridan, M. F., and Macías, J. (1995). Estimation of risk probability for gravity-driven pyroclastic flows at Volcan Colima, Mexico. J. Volcanol. Geotherm. Res. 66, 251–256. doi: 10.1016/0377-0273(94)00058-O
Sigmundsson, F., Hooper, A., Hreinsdóttir, S., Vogfjörd, K. S., Ófeigsson, B. G., Heimisson, E. R., et al. (2015). Segmented lateral dyke growth in a rifting event at Bárdarbunga volcanic system, Iceland. Nature 517, 191–195. doi: 10.1038/nature14111
Smith, G. M., Williams, R., Rowley, P. J., and Parsons, D. R. (2018). Investigation of variable aeration of monodisperse mixtures: implications for pyroclastic density currents. Bull. Volcanol. 80, 1–12. doi: 10.1007/s00445-018-1241-1
Spiller, E. T., Bayarri, M. J., Berger, J. O., Calder, E. S., Patra, A. K., Pitman, E. B., et al. (2014). Automating emulator construction for geophysical hazard maps. SIAM/ASA J. Uncertain. Quantif. 2, 126–152. doi: 10.1137/120899285
Sulpizio, R., Dellino, P., Doronzo, D. M., and Sarocchi, D. (2014). Pyroclastic density currents: state of the art and perspectives. J. Volcanol. Geotherm. Res. 283, 36–65. doi: 10.1016/j.jvolgeores.2014.06.014
Teklemariam, M., and Kebede, S. (2010). “Strategy for geothermal resource exploration and development in Ethiopia,” in Proceedings: World Geothermal Congress (Bali).
Tierz, P. (2020). Long-term probabilistic volcanic hazard assessment using open and non-open data: observations and current issues. Front. Earth Sci. 8:257. doi: 10.3389/feart.2020.00257
Tierz, P., Loughlin, S. C., and Calder, E. S. (2019). VOLCANS: an objective, structured and reproducible method for identifying sets of analogue volcanoes. Bull. Volcanol. 81, 1–22. doi: 10.1007/s00445-019-1336-3
Tierz, P., Sandri, L., Costa, A., Sulpizio, R., Zaccarelli, L., Vito, M. A. D., et al. (2016a). “Uncertainty assessment of pyroclastic density currents at Mount Vesuvius (Italy) simulated through the energy cone model,” in Natural Hazard Uncertainty Assessment: Modeling and Decision Support, 1st Edn, eds K. Riley, P. Webley, and M. Thompson (Hoboken, NJ: John Wiley & Sons, Inc.), 125–145. doi: 10.1002/9781119028116.ch9
Tierz, P., Sandri, L., Costa, A., Zaccarelli, L., Di Vito, M. A., Sulpizio, R., et al. (2016b). Suitability of energy cone for probabilistic volcanic hazard assessment: validation tests at Somma-Vesuvius and Campi Flegrei (Italy). Bull. Volcanol. 78:79. doi: 10.1007/s00445-016-1073-9
Tierz, P., Stefanescu, E. R., Sandri, L., Sulpizio, R., Valentine, G. A., Marzocchi, W., et al. (2018). Towards quantitative volcanic risk of pyroclastic density currents: probabilistic hazard curves and maps around somma-vesuvius (Italy). J. Geophys. Res. 123, 6299–6317. doi: 10.1029/2017JB015383
Tonini, R., Sandri, L., and Anne Thompson, M. (2015). PyBetVH: A Python tool for probabilistic volcanic hazard assessment and for generation of Bayesian hazard curves and maps. Comput. Geosci. 79, 38–46. doi: 10.1016/j.cageo.2015.02.017
Trolese, M., Cerminara, M., Esposti Ongaro, T., and Giordano, G. (2019). The footprint of column collapse regimes on pyroclastic flow temperatures and plume heights. Nat. Commun. 10, 1–10. doi: 10.1038/s41467-019-10337-3
Vye-Brown, C., Sparks, R. S. J., Lewi, E., Mewa, G., Asrat, A., Loughlin, S. C., et al. (2016). Ethiopian volcanic hazards: a changing research landscape. Geol. Soc. Lond. Spec. Publ. 420, 355–365. doi: 10.1144/SP420.16
Wand, M. P., and Jones, M. C. (1994). Kernel Smoothing, 1st Edn. London: Champan & Hall. doi: 10.1201/b14876
Webster, J. D., Taylor, R. P., and Bean, C. (1993). Pre-eruptive melt composition and constraints on degassing of a water-rich pantellerite magma, Fantale volcano, Ethiopia. Contrib. Mineral. Petrol. 114, 53–62. doi: 10.1007/BF00307865
Weller, J. N., Martin, A. J., Connor, C. B., Connor, L. J., and Karakhanian, A. (2006). “Chapter 7: Modelling the spatial distribution of volcanoes: an example from Armenia,” in Statistics in Volcanology, 1st Edn, eds H. M. Mader, S. G. Coles, C. B. Connor, and L. J. Connor (London: Geological Society of London Special Publications), 77–87. doi: 10.1144/IAVCEI001.7
Wilding, M. C., Macdonald, R., Davies, J. E., and Fallick, A. E. (1993). Volatile characteristics of peralkaline rhyolites from Kenya: an ion microprobe, infrared spectroscopic and hydrogen isotope study. Contrib. Mineral. Petrol. 114, 264–275. doi: 10.1007/BF00307761
Wilks, M., Kendall, J. M., Nowacki, A., Biggs, J., Wookey, J., Birhanu, Y., et al. (2017). Seismicity associated with magmatism, faulting and hydrothermal circulation at Aluto Volcano, Main Ethiopian Rift. J. Volcanol. Geotherm. Res. 340, 52–67. doi: 10.1016/j.jvolgeores.2017.04.003
Wilson, C. J. N. (1980). The rolde of fluidization in the emplacement of pyroclastic flows: an experimental approach. J. Volcanol. Geotherm. Res. 8, 231–249. doi: 10.1016/0377-0273(80)90106-7
Wolpert, R. L., Spiller, E. T., and Calder, E. S. (2018). Dynamic statistical models for pyroclastic density current generation at Soufriére Hills Volcano. Front. Earth Sci. 6:55. doi: 10.3389/feart.2018.00055
Woodhouse, M. J., Hogg, A. J., Phillips, J. C., and Sparks, R. S. (2013). Interaction between volcanic plumes and wind during the 2010 Eyjafjallajökull eruption, Iceland. J. Geophys. Res. 118, 92–109. doi: 10.1029/2012JB009592
Keywords: PVHA, pyroclastic density current, hazard, energy cone, Monte Carlo, Ethiopia
Citation: Clarke B, Tierz P, Calder E and Yirgu G (2020) Probabilistic Volcanic Hazard Assessment for Pyroclastic Density Currents From Pumice Cone Eruptions at Aluto Volcano, Ethiopia. Front. Earth Sci. 8:348. doi: 10.3389/feart.2020.00348
Received: 30 April 2020; Accepted: 27 July 2020;
Published: 31 August 2020.
Edited by:
Derek Keir, University of Southampton, United KingdomReviewed by:
Domenico M. Doronzo, Istituto Nazionale di Geofisica e Vulcanologia (INGV), ItalyGuillaume Carazzo, UMR7154 Institut de physique du globe de Paris (IPGP), France
Copyright © 2020 Clarke, Tierz, Calder and Yirgu. This is an open-access article distributed under the terms of the Creative Commons Attribution License (CC BY). The use, distribution or reproduction in other forums is permitted, provided the original author(s) and the copyright owner(s) are credited and that the original publication in this journal is cited, in accordance with accepted academic practice. No use, distribution or reproduction is permitted which does not comply with these terms.
*Correspondence: Ben Clarke, YmFjMTNAbGVpY2VzdGVyLmFjLnVr