 Helena V. Pryer1,2*
 Jade E. Hatton2
 Jemma L. Wadham1
 Jon R. Hawkings3,4
 Laura F. Robinson2Anne M. Kellerman3
 Matthew G. Marshall1
 Alejandra Urra1,5Anna Covey1
 Giovanni Daneri6,7
 Vreni Häussermann8
 Katharine R. Hendry2
- 1Department of Geographical Sciences, Bristol Glaciology Centre, University of Bristol, Bristol, United Kingdom
- 2Department of Earth Sciences, University of Bristol, Bristol, United Kingdom
- 3Department of Earth, Ocean and Atmospheric Sciences, Florida State University, Tallahassee, FL, United States
- 4German Research Centre for Geosciences GFZ, Potsdam, Germany
- 5Centro de Estudios Científicos, Valdivia, Chile
- 6Centro de Investigación en Ecosistemas de la Patagonia, Coyhaique, Chile
- 7COPAS Sur-Austral, Universidad de Concepción, Concepción, Chile
- 8Huinay Scientific Field Station, Pontificia Universidad Católica de Valparaíso, Valparaíso, Chile
Proglacial rivers have been shown to have distinctive silicon (Si) isotope compositions, providing new insights into the mechanisms controlling Si cycling in the subglacial environment and suggesting terrestrial Si isotope exports may have varied between glacial and interglacial periods. However, Si isotope data are currently limited to a small number of glacial systems in the northern hemisphere, and it is unclear how compositions might vary across a spectrum of glacial influence. Using Chilean Patagonia as a unique natural laboratory, we present Si isotope compositions of 0.45 μm filtered (fSi), 0.02 μm filtered (DSi), and reactive amorphous (ASi) fractions from 40 river catchments with variable glacial cover and explore the key controls on Si cycling. The 0.45 μm filtered glacier-fed river samples displayed isotopically light compositions and a positive linear correlation with upstream glacial cover. This relationship was controlled by the inclusion of an isotopically light colloidal-nanoparticulate (0.02–0.45 μm) silicate phase that was only present in glacier-fed rivers and dominated Si budgets in these catchments. This phase was predominately composed of feldspars and its lability in seawater is uncertain, representing a significant unknown in resolving glacial Si isotope exports from this region. When the colloidal-nanoparticulates were removed from solution by ultra-filtration, the resultant DSi isotope compositions of glacier-fed catchments were not isotopically distinct from some non-glacial rivers and exhibited no clear relationship with glacial cover. The colloidal-nanoparticulate concentration of other weathering-sensitive elements (Li, Mg, Ba, Sr) also showed a linear relationship with glacial cover, suggesting that their isotopic compositions could be affected in a similar manner. These findings highlight the benefit of size-fractionated sampling and the need for more research to understand the lability of colloidal-nanoparticulate species, especially in glacier-fed rivers. Finally, we explore the controls on river ASi isotope compositions and show how including these reactive particulate phases is critical to quantifying terrestrial Si isotope budgets, both in Patagonia and other global regions.
1. Introduction
The silicon (Si) cycle is intricately linked to the carbon cycle, with climatic controls on silicate weathering regulating the drawdown of atmospheric CO2 on geological timescales (Urey, 1952; Berner et al., 1983; Berner and Caldeira, 1997). Additionally, Si is an essential nutrient for many photosynthetic organisms including diatoms, which account for up to 70% of primary productivity in the ocean, form the base of food-chains and maintain the efficiency of the biological carbon pump (Nelson et al., 1995; Treguer and De La Rocha, 2013). Rivers deliver roughly 80% of the terrestrial Si flux to the oceans, acting as the critical link between continental and marine sub-cycles and affecting the rate of siliceous primary productivity in the ocean (Tréguer et al., 1995; Treguer and De La Rocha, 2013). As such, understanding the controls on riverine Si exports is critical for our understanding of climate feedback mechanisms, both during the past and with future change. Si isotope compositions are increasingly used to understand the Si cycle (Frings et al., 2016; Sutton et al., 2018) and as a valuable palaeo-oceanographic proxy (De La Rocha et al., 1998; Hendry and Robinson, 2012; Hendry and Brzezinski, 2014). However, there are still gaps in our knowledge, particularly relating to how changing glacial cover could impact the Si cycle and global Si isotope budgets (Hawkings et al., 2018; Sutton et al., 2018).
Until recently, glaciers and ice sheets were not considered to be active components of the Si cycle. The dissolved Si (DSi) concentrations of glacier-fed rivers tend to be much lower than non-glacial rivers, which is generally interpreted to reflect suppressed chemical weathering of silicate minerals in near-freezing subglacial environments (Tranter et al., 2002; Anderson, 2007). However, research from the Greenland Ice Sheet has shown that glacial meltwaters also contain high concentrations of a labile amorphous Si phase (ASi) bound to riverine suspended sediments (Hawkings et al., 2017; Hatton et al., 2019a). Concentrations of ASi from Leverett Glacier were roughly 40 times higher than the DSi phase, suggesting that glacial meltwaters could represent a significant missing component of terrestrial Si exports to the ocean (Hawkings et al., 2017). These ASi phases have been shown to readily dissolve in seawater to form bioavailable DSi, which could fuel siliceous primary productivity in downstream ecosystems (Frings, 2017; Hawkings et al., 2017). Similar ASi components have also been reported from other proglacial rivers in the Arctic and sub-Arctic (Hatton et al., 2019b), although the controls on concentrations and glacial ASi formation mechanisms are still the subject of active debate (Blackburn et al., 2019; Hatton et al., 2019b).
Biogeochemical reactions involving Si can cause subtle but measurable shifts away from the natural abundance ratios of the three stable isotopes of Si (28Si, 29Si, and 30Si; Ding et al., 2005). Variations in these ratios function as a tracer for processes operating within the Si cycle. Riverine Si isotope compositions integrate basin-wide signals and reflect a dynamic balance between upstream catchment characteristics, silicate weathering processes, variable primary productivity by diatoms and other siliceous organisms, and inputs from Si-rich plant phytoliths (Frings et al., 2016; Sutton et al., 2018). During the formation of secondary weathering products (e.g., clays) and biogenic Si, solid phase material preferentially incorporates the lighter 28Si isotope, leaving the residual river water enriched in the heavier 30Si isotope relative to the parent rock (Ziegler et al., 2005; Georg et al., 2006; Frings et al., 2016). Conversely, incongruent dissolution of solid Si phases leads to the preferential release of the lighter isotope back into the river water (Cardinal et al., 2010). Si isotope compositions have been measured for many of the world's largest rivers, where signals have been used to infer the rates and congruency of silicate weathering (Georg et al., 2006; Cardinal et al., 2010; Opfergelt and Delmelle, 2012; Opfergelt et al., 2013), the degree of biological uptake (Hughes et al., 2011; Panizzo et al., 2017; Sun et al., 2018), anthropogenic impacts on the Si cycle (Hughes et al., 2012; Cockerton et al., 2013; Delvaux et al., 2013), and the terrestrial Si isotope composition exported to the ocean (Opfergelt et al., 2013; Frings et al., 2016; Hawkings et al., 2018; Sun et al., 2018).
Glacial processes also appear to affect the Si isotope composition of downstream river waters. Proglacial rivers in Iceland and Greenland have been shown to have distinct, isotopically light DSi compared to non-glacial river systems (Georg et al., 2007; Opfergelt et al., 2013; Hawkings et al., 2018; Hatton et al., 2019a). Such light DSi isotope compositions are interpreted to reflect extensive dissolution of ASi and other secondary weathering products in undersaturated, high pH meltwaters at the base of glaciers (Hawkings et al., 2018; Hatton et al., 2019a). These findings have brought into question the long-held assumption that terrestrial Si isotope exports to the ocean have remained stable over glacial-interglacial cycles, with implications for interpreting Si isotope paleoclimate proxies (Opfergelt et al., 2013; Hawkings et al., 2018). However, compiled Si isotope data from proglacial rivers across the Arctic and sub-Arctic show complex variability in Si isotope compositions exported from different glacial systems (Hatton et al., 2019b). At present, glacial Si isotope data are limited to glacier-fed rivers in high-latitude environments of the northern hemisphere, and it is unknown how compositions could vary in other regions and across a spectrum of glacial cover.
Furthermore, the Si isotope composition of ASi phases is generally overlooked when quantifying riverine Si isotope budgets. Estimates of riverine Si isotope compositions are usually based on 0.45 or 0.22 μm filtered Si and do not include reactive ASi associated with the suspended particulate material (SPM; > 0.45 μm) load. Since ASi phases are estimated to account for between ~23 and 58% of reactive riverine Si exports (Conley, 1997; Dürr et al., 2011; Frings et al., 2014), excluding these phases likely represents an incomplete picture of the labile flux of Si isotopes and could hinder our understanding of the terrestrial Si cycle. In proglacial river systems, ASi phases have been shown to have isotopically light Si compositions, although the controls and potential variability are not fully understood (Hatton et al., 2019b). In particular, measurements of the isotopic composition of riverine ASi are currently only available for a handful of high-latitude glacier-fed rivers (Hawkings et al., 2018; Hatton et al., 2019a,b) and have never been reported from non-glacial river systems.
Chilean Patagonia is a unique and under-studied natural laboratory to investigate Si cycling processes for several reasons. First, this region has a wide spectrum of glacial cover, with rivers spanning completely deglaciated land, catchments with small mountain top glaciers and rivers draining from the large glacial systems of the Northern and Southern Patagonian Ice Fields. Second, it is a near-pristine environment with very low population density and minimal agriculture. As such, Si cycling processes are not overprinted or affected by anthropogenic signals, and we can observe the natural controls on riverine isotopic compositions. Finally, Patagonia is rapidly deglaciating and experiencing dramatic landscape change, with evidence that the Patagonian Ice Fields shrank by roughly 30 km2 per year between 1986 and 2011 (Davies and Glasser, 2012) and 1,226 new glacial lakes formed between 1986 and 2016 (Wilson et al., 2018). Therefore, our data acts as a valuable baseline to understand future change to Si cycling processes across this region.
Here, we present data from 40 rivers in Chilean Patagonia and explore the key controls on the isotopic composition of dissolved (<0.02 μm), colloidal-nanoparticulate (0.02–0.45 μm) and amorphous (>0.45 μm) Si phases. We discuss the relative lability of each component and highlight how size-fractionated analyses are needed to understand the controls on riverine isotope signals. We also explore the dissolved and colloidal-nanoparticulate concentrations of several additional weathering-sensitive elements (Li, Sr, Ba, Mg) to infer if similar controls are likely to influence their size-partitioning and isotopic compositions. Finally, by combining the relative proportions, isotopic composition and potential lability of each Si phase, we test the hypothesis that glacier-fed rivers in Patagonia have distinct Si isotope compositions compared to non-glacial rivers.
2. Methods and Materials
2.1. Sampling Campaign
River water samples were collected from 40 rivers located between 42 and 48° S in Chilean Patagonia during the austral summer in January 2017 (Figure 1). The pH, electrical conductivity and water temperature were measured using handheld sensors. Water samples were collected from fast-flowing sections of the river and upstream of settlements. Aliquots for major ions, DSi and Si isotope analysis were filtered immediately through 0.45 μm pore-size Whatman GD/XP polypropylene (PP) syringe filters and stored in acid-cleaned high-density polyethene (HDPE) bottles. Trace metal samples were collected by sequentially filtering river water through 0.45 μm Whatman GD/XP (PP) and 0.02 μm Whatman Anotop 25 syringe filters. These pore sizes were chosen to investigate differences between operationally defined filterable (<0.45 μm), colloidal-nanoparticulate (0.02–0.45 μm) and truly dissolved (<0.02 μm) concentrations, following protocols defined by Shiller (2003) and used in multiple glacial river studies (Schroth et al., 2011; Hawkings et al., 2014; Raiswell et al., 2018). Samples for Si isotope analysis were subsequently refiltered through 0.02 μm Whatman Anotop 25 syringe filters to investigate differences between dissolved and colloidal-nanoparticulate Si isotope signatures. SPM samples for determination of ASi concentrations and isotopic composition were collected by filtering 1–5 L of river water through pre-weighed 47 mm diameter Millipore 0.45 μm polyethersulfone (PES) membrane filters using an acid-washed Nalgene filter tower. The exact volume of water that passed through the membrane was recorded to calculate SPM concentrations, and the filter papers were stored in the dark at 4°C until analysis. The Si, iron (Fe), and SPM concentration data from these samples are also reported in Pryer et al. (2020).
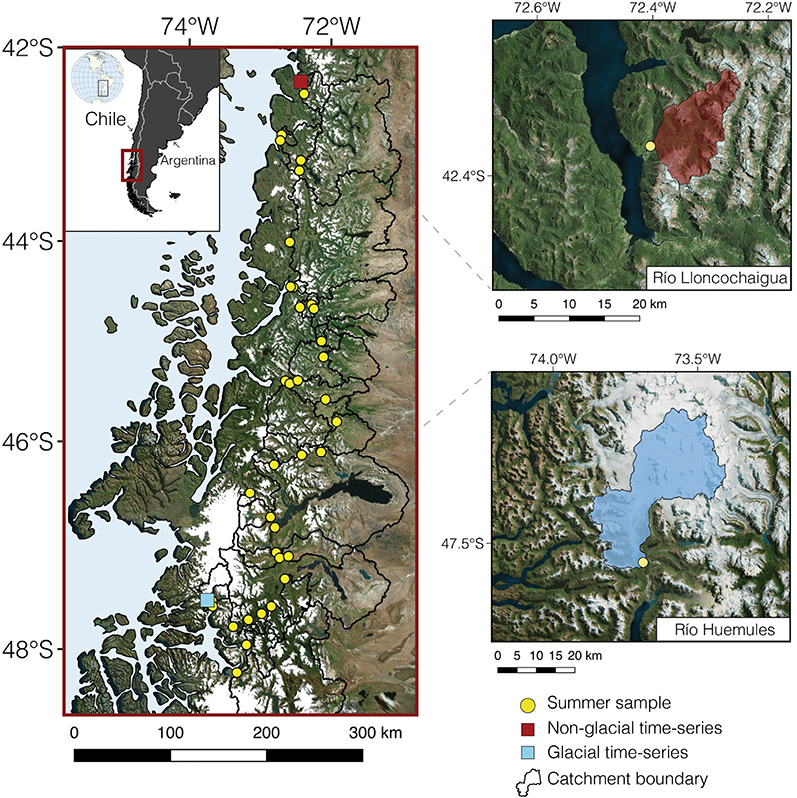
Figure 1. Map showing river sampling locations in Patagonia. Yellow dots show river sampling locations collected in January 2017. The red square and top inset show the location and catchment area of the non-glacial time-series location (PTR01-R4, Río Lloncochaigua) and the blue square and bottom inset show the location and catchment area of the proglacial time-series location (PFC01-SA, Río Huemules-Steffen Glacier). Upstream catchment areas are outlined in black and were modeled using Q-GIS and Whitebox GAT (Lindsay, 2016).
To constrain temporal and seasonal variability in riverine Si isotope composition, a glacial and non-glacial end-member catchment were sampled repeatedly over multiple periods of 2 weeks to 5 months from January 2017 until November 2018, covering both the austral summer and winter at each location. The glacial site was the Río Huemules, draining from Steffen Glacier at the southern edge of the Northern Patagonian Icefield (NPI). The non-glacial site was the Río Lloncochaigua, located on the eastern edge of the Comau Fjord (Figure 1).
2.2. Geospatial Analysis
Geospatial analysis of this region was conducted using a combination of Q-GIS and Whitebox-GAT (Lindsay, 2016). Upstream catchment areas were calculated using the NASA Shuttle Radar Topography Mission (SRTM) 3 arc-second digital elevation model (DEM). The glacial cover was calculated as a percentage of each catchment area using the Randolph Glaciers Inventory (RGI Consortium, 2017) and is used as a proxy to understand the influence of variable glaciation across this region. We define glacier-fed systems as all catchments with >20% glacial cover, where the main tributary is a proglacial river. The significance of differences between catchments grouped by glacial cover was analyzed using unpaired, two-tail t-tests assuming unequal variance. Catchment lithology and lake area were calculated using datasets from Hartmann and Moosdorf (2012) and Messager et al. (2016), respectively.
2.3. Silicon and Major Ion Concentration Analysis
Truly dissolved Si concentrations (DSi, as silicic acid) were measured colorimetrically using a LaChat 8500 Series 2 flow injection analyser (FIA) (QuikChem Method 31-114-27-1-D) using an external calibration curve that spanned the range of sample concentrations, gravimetrically diluted from a 1,000 ppm Si ISO 17034-certified stock standard (TraceCERTⓇ). Mean accuracy for DSi measurements was 2.6% and mean precision was ±1.2%. Colloidal-nanoparticulate Si (0.02–0.45 μm; CNSi) concentrations were calculated as the difference between 0.02 and 0.45 μm filtered concentrations measured by multi-collector inductively coupled plasma mass spectrometry (MC-ICP-MS), with errors of ±5.0%. Concentrations of ASi associated with SPM were measured using the 0.1 M Na2CO3 extraction method adapted from DeMaster (1981). Aliquots of the extraction solutions were analyzed using the same method as for DSi to obtain ASi concentrations in μM, with propagated errors of ±7.5%. Major cation and anion concentrations were measured using a Thermo ScientificTM DionexTM capillary ICS-5000 ion chromatograph. Mean accuracy was 0.2 ± 2.5% and precision for all ions was better than ±2.5%. Bicarbonate (HCO3-) concentrations were estimated using the mass charge deficit (Tranter et al., 2002; Hawkings et al., 2015), with a propagated error of ±3.3%. Major ion concentrations were seasalt-corrected, using values from Millero et al. (2008). Total dissolved solid (TDS) concentrations were calculated as the sum of all major ions and DSi, with a propagated error of ±6.0%.
2.4. Trace Metal Concentration Analysis
Dissolved (<0.02 μm) and filterable (<0.45 μm) trace metal concentrations were analyzed using a Thermo Scientific X-SERIES 2 quadrupole ICP-MS with a collision-reaction cell at the National Oceanography Centre, Southampton. Berylium, indium and rhenium were used as internal standards to correct for drift and matrix effects, and external calibration solutions (n = 7) matched the concentration range observed in samples. For trace metals presented in this study, precision and accuracy were always within ± 10% of a multi-element standard, prepared from a gravimetrically weighed mix of NIST-traceable SPEX CertiPrep standards. Colloidal-nanoparticulate (0.02–0.45 μm) concentrations were calculated as the difference between 0.45 μm filterable and dissolved size-fractions (Shiller, 2003).
2.5. Silicon Isotope Analysis
Si isotope analyses were carried out at the University of Bristol Isotope Group clean laboratories and mass spectrometer facility. River water samples filtered through 0.02 μm filters were measured for DSi isotope analyses (δ30SiDSi) and samples filtered through 0.45 μm filters were measured for filterable Si compositions (δ30SifSi). Sample volumes ranged from 0.9 to 20 mL, to target 7.2 μg of Si. Aliquots of filtered river water with Si concentrations <150 μM were pre-concentrated by evaporating to ~2 mL volume at 90°C in acid-cleaned Teflon vials, whereas other samples were added directly to the column. To measure the ASi isotopic composition (δ30SiASi), 10–30 mg of dry SPM was weighed into Teflon vials, before adding 1 mL of 0.2 M NaOH for every 0.1 mg of ASi, using concentrations previously measured using the DeMaster (1981) method described in section 2.3. Samples were refluxed at 100°C for an hour to extract the reactive ASi phase, neutralized with trace-metal grade 8M HNO3, diluted with Milli-Q and passed through 0.22 μm pore-size PES syringe filters to remove sediment particles from the solution. This extraction method compares well with the more established Na2CO3 method, extracting equal or slightly lower concentrations of ASi and giving assurance that more refractory phases of Si were not incorporated into solution (Hawkings et al., 2018). Isotopic analysis of ASi could only be measured for a subset of samples (n = 11), as insufficient particulate material was collected from rivers with low SPM loads.
All samples were added to pre-cleaned BioRad exchange resin columns (AG50W-X12 200-400 mesh) using a method adapted from Georg et al. (2006) and eluted with Milli-Q to give a solution with a concentration of 2 ppm Si. A 1 mL aliquot of each sample was taken for each analysis, doped with 100 μL of 10 ppm magnesium (Mg) standard to correct for mass bias (Cardinal et al., 2003; Hendry and Robinson, 2012) and 100 μL of 0.1 M sulphuric acid to balance matrix differences between samples and standards (Hughes et al., 2011). Si and Mg isotope ratios were measured on a Thermo Scientific Neptune PlusTM MC-ICP-MS using a standard-sample bracketing protocol. International reference standard NBS-28 (RM8546) was used as the bracketing standard, and all isotope results were calculated using δ30Si notation (Equation 1), as the deviation of the 30Si/28Si ratio of each sample from NBS-28 in parts per mille (‰).
Instrument blanks of 0.1 M distilled HCl were always <1% of the intensity of the 28Si signal of samples, and procedural blanks were always below the limit of detection. Long-term reproducibility was quantified by repeat measurement of two reference standards; LMG08 and Diatomite. The mean measured δ30Si value for LMG08 was −3.45‰ (n = 70, σ = 0.04; δ29Si = −1.76‰) and the mean δ30Si value for Diatomite was +1.23‰ (n = 25, σ = 0.04; δ29Si = +0.66‰). The values of these standards are within error of published values that have been calibrated between multiple labs (Reynolds et al., 2007; Hendry et al., 2011). A three-isotope plot of all standards and samples measured during this study fit along a straight line with a gradient of 0.517 ± 0.04 (r2 = 1.0, p < 0.01, n = 526; Supplementary Figure 1), showing mass-dependant fractionation (Reynolds et al., 2007). All samples were measured at least in duplicate and a conservative error of ± 0.08‰was assigned to all δ30Si values, equalling ± 2σ variability of δ30Si values from repeat measurements of internal standards and replicate samples.
The isotopic composition of the colloidal-nanoparticulate Si phase (δ30SiCNSi, 0.02–0.45 μm) was calculated using a mass balance approach to account for the relative proportions and isotopic composition of 0.02 and 0.45 μm filtered Si fractions. Total riverine Si isotope budgets were calculated using a mass balance accounting for the relative proportions and isotope ratios of the DSi and ASi components (δ30SiDSi+ASi), and the DSi and fSi components (δ30SifSi+ASi). The mean measured δ30SiASi was used as an estimate for river systems where no data were available. Using the mean value had little impact on the total budget compared to analytical uncertainty, since most rivers where δ30SiASi was not measured had very low SPM loads.
3. Results
3.1. Riverine Silicon Concentrations
Dissolved Si (DSi) concentrations ranged from 15.5 to 259.6 μM (mean = 89.3 ± 64.2 μM (1σ), n = 40) and showed an inverse logarithmic relationship with glacial cover (r2 = 0.58; Figure 2A). Glacier-fed rivers (i.e., >20% glacial cover) had relatively low and invariant DSi concentrations ranging from 15.5 to 43.8 μM (mean = 32.0 ± 8.6 μM, n = 8). The concentrations of 0.45 μm filterable Si (fSi) ranged from 27.7 to 259.6 μM (mean = 101.0 ± 58.1 μM, n = 29) and were within analytical error of DSi concentrations for most rivers. However, for all glacier-fed river systems, fSi concentrations were significantly higher than the DSi component, with concentrations ranging from 53.5 to 114.3 μM (mean = 78.1 ± 24.5 μM, t9 = 5.02, p < 0.01). These differences between DSi and fSi concentrations in glacier-fed river systems show the presence of a colloidal-nanoparticulate Si phase (0.02–0.45 μm; CNSi). Where detected, CNSi concentrations ranged from 15.2 to 98.9 μM (mean = 42.7 ± 25.5 μM, n = 11; Figure 2B). All catchments with >20% glacial cover had a significant CNSi and concentrations showed a positive linear relationship with increasing glacial cover (r2 = 0.85, p < 0.01, n = 8). CNSi was only detected in three rivers with <20% glacial cover, which were all large catchments (>15,000 km2) that had significant inputs from the Northern or Southern Patagonian Ice Fields. No CNSi was found in any other river systems, with DSi and fSi concentrations within analytical error. Amorphous Si (ASi) phases, associated with the SPM, were found in all rivers where particulate samples were available for extraction. ASi concentrations varied from 0.3 to 56.8 μM (mean = 7.2 ± 9.7 μM, n = 36; Figure 2B).
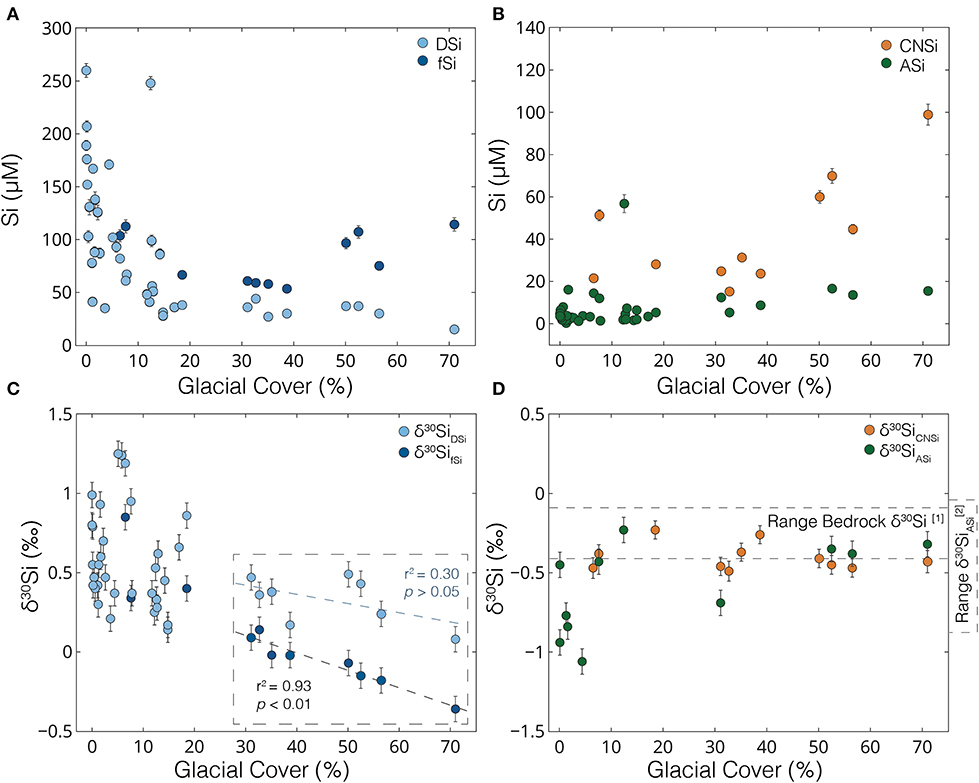
Figure 2. Riverine silicon concentration and silicon isotope data. (A) Dissolved Si (DSi; light blue) and <0.45 μm filterable Si (fSi; dark blue) concentrations (μM) vs. glacial cover (%); (B) Colloidal-nanoparticulate Si (CNSi; orange) and amorphous Si (ASi; green) concentrations (μM) vs. glacial cover (%); (C) Si isotope values of 0.45 μm filtered river water (δ30SifSi; dark blue) and 0.02 μm filtered river water (δ30SiDSi; light blue) (‰) vs. glacial cover (%); (D) Colloidal-nanoparticulate (0.02–0.45 μm) Si isotope values (δ30SiCNSi; orange) and amorphous silicon isotope values (δ30SiASi; green) (‰) vs. glacial cover (%). Dotted lines show the range of bedrock δ30Si values [1] (Savage et al., 2013) (mean = −0.25 ± 0.16‰) and the previous range of δ30SiASi [2] (Hatton et al., 2019b) measured in proglacial rivers (range = −0.05 to −0.86‰). Error bars for DSi, fSi, CNSi, and ASi concentrations show ±2.5, 5.5, 5.0, and 7.5%, respectively. Error bars for δ30Si show ±0.08‰.
3.2. Filterable and Dissolved Silicon Isotope Compositions
The silicon isotope composition of fSi (δ30SifSi) ranged from −0.36 to +1.25‰ (mean = +0.42 ± 0.36‰, n = 40; Figure 2C). Where glacial cover exceeded 20% of the total catchment area, there was a strong linear correlation between glacial cover and δ30SifSi values, whereby the isotopic composition of the river water became increasingly enriched in the light 28Si isotope with increasing glacial cover (r2 = 0.93, p < 0.01). All glacier-fed river samples in this region had isotopically light δ30SifSi values compared to catchments with <20% glacial cover, with compositions varying from −0.36 to +0.14‰ (mean = −0.07 ± 0.16‰, n = 8; Table 1). Rivers with less or no glacial cover had a wide range of δ30SifSi values, varying from +0.14 to +1.25‰ (mean = +0.54 ± 0.28‰, n = 32). No significant differences in δ30SifSi compositions were observed between catchments with 5–20% or <5% glacial cover (t26 = 0.5, p > 0.5; Table 1).
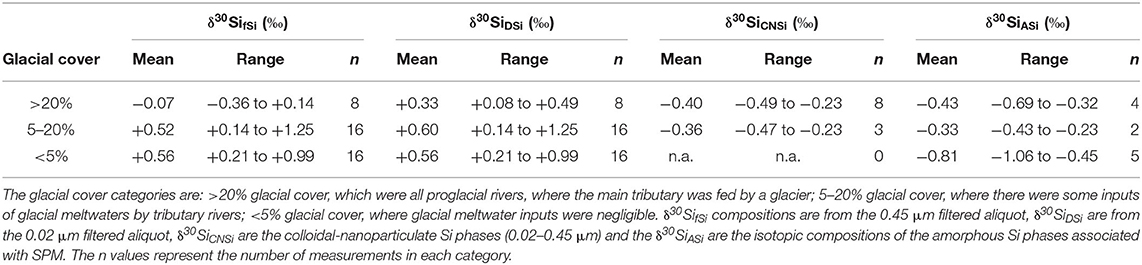
Table 1. Mean and range of δ30Si (‰) values categorized by glacial cover.
For all rivers where CNSi was detected, the δ30SiDSi values were significantly higher than respective δ30SifSi values with offsets (Δ30SiDSi−−fSi) ranging from +0.19 to +0.61‰ (mean = +0.42 ± 0.13‰, n = 11; Figure 2C). Glacier-fed river δ30SiDSi values ranged from +0.08 to +0.49‰ (mean = +0.33 ± 0.15‰, n = 8) and showed no significant relationship with glacial cover (r2 = 0.30, p > 0.05). For all rivers where no CNSi was detected, δ30SifSi and δ30SiDSi values were within analytical uncertainty. The δ30SiDSi values showed a positive linear relationship with DSi concentrations when rivers were categorized by the dominant lithology in the upstream catchment area (r2 = 0.54–0.74, p < 0.01, n = 40; Figure 3A), which is either composed of Patagonian batholith granite and basic volcanic rocks or metamorphosed sediments and pyroclastic rocks within the Magallanes foreland basin (Weaver et al., 1990; Hartmann and Moosdorf, 2012). The δ30SiDSi values also showed a positive linear relationship with total dissolved solid concentrations (mg L-1) (r2 = 0.48, p < 0.01, n = 39; Figure 3B). No correlation was observed between δ30SiDSi and divalent:monovalent major cation ratios (r2 = 0.00, p > 0.05, n = 39; Figure 3C) and a weak negative correlation was observed with DSi concentrations normalized to sodium (Na+) and potassium (K+) (r2 = 0.26, p < 0.01, n = 37; Figure 3D). Correlations between δ30SiDSi values and other chemical parameters and catchment properties are shown in Supplementary Figure 2. Principle component analysis (PCA) of geochemical and environmental parameters are shown in Supplementary Figure 3, with the two largest components explaining 58.2% of the data variance.
Figure 3. Relationships between δ30SiDSi and other chemical species. (A) δ30SiDSi (‰) vs. DSi concentrations (μM) colored relative to the dominant lithology as categorized by Hartmann and Moosdorf (2012)—pa, acid plutonic; vb, basic volcanic; mt, metamorphic; py, pyroclastic (Supplementary Table 1); (B) δ30SiDSi (‰) vs. total dissolved solid concentrations (mg L−1) calculated as the sum of all major ions and DSi; (C) δ30SiDSi (‰) vs. divalent:monovalent cations (μM) colored relative to the dominant lithology; (D) δ30SiDSi (‰) vs. DSi normalized to sodium (Na) and potassium (K) ion concentrations (μM). Error bars for δ30SiDSi show ±0.08‰. Error bars for DSi and TDS show ± 2.5 and 6.0%, respectively. Error bars for divalent:monovalent and DSi/Na+K ratios show ± 3.0%.
The isotopic composition of the colloidal-nanoparticulate phase (δ30SiCNSi) ranged from −0.49 to −0.23‰ (mean = −0.40 ± 0.09‰, n = 11; Figure 2D). Relative proportions of the CNSi phase, reported as a percentage of 0.45 μm filterable Si (CNSi/fSi (%)), showed a positive linear correlation with glacial cover for catchments with >20% glacial cover (r2 = 0.82, p < 0.01, n = 8; Figure 4A). The relative CNSi concentrations also showed a strong linear correlation with the δ30SifSi values (r2 = 0.91, p < 0.01, n = 8; Figure 4B). For the three catchments with <20% glacial cover where CNSi phases were detected, CNSi varied from 21 to 46% of the fSi concentration but did not fit along the linear regression with glacial cover or δ30SifSi values defined by catchments with >20% glacial cover.
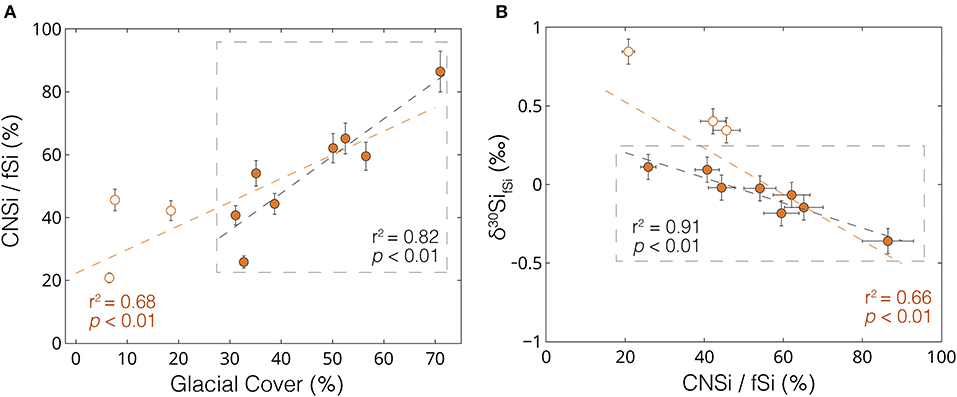
Figure 4. Colloidal-nanoparticulate size silicon in all glacier-fed rivers in Patagonia. (A) Concentrations of colloidal-nanoparticulate Si (CNSi) as a percentage of the total filterable Si (fSi; DSi + CNSi) vs. glacial cover (%) for all rivers where CNSi phases were detected; (B) CNSi/fSi (%) plotted against respective δ30SifSi (‰). Filled orange dots and regression analyses are for all catchments with >20% glacial cover. Unfilled orange dots are from three catchments with <20% glacial cover where CNSi phases were present. These catchments all receive glacial meltwater inputs from tributary rivers draining from the Patagonian Icefields, but where glacial cover values are disproportionately low due to very large catchment areas. Error bars for δ30Si (‰) values show ± 0.08‰and errors for CNSi proportions show propagated errors of ± 7.5%.
3.3. Amorphous Silicon Isotope Composition
The isotopic composition of the ASi phases (δ30SiASi) ranged from −1.06 to −0.23‰ (mean = −0.59 ± 0.28‰, n = 11; Figure 2D), with values overlapping or significantly lower than the range reported for the upper continental crust (mean = −0.25 ± 0.16‰; Savage et al., 2013). Rivers with significant glacial meltwater inputs or that drained from volcanoes had substantially higher δ30SiASi values compared to other river systems with mean values of −0.41 ± 0.14‰ (n = 7) and −0.90 ± 0.13‰ (n = 4), respectively (t7 = 5.88, p < 0.01).
3.4. Size-Partitioning of Other Elements
The relative proportions of colloidal-nanoparticulate and dissolved phases were also investigated for other weathering-sensitive elements, including lithium (Li), magnesium (Mg), strontium (Sr), and barium (Ba). Similar to Si, all of these elements showed a significant positive relationship, with higher relative proportions of the colloidal-nanoparticulate phases with increasing glacial cover (r2 = 0.78–0.86, p < 0.01, n = 26; Figures 5A–D). In the rivers with the highest glacial cover, over 70% of 0.45 μm filterable Li (fLi), 55% of filterable Mg (fMg), 35% of filterable Sr (fSr), and 80% of filterable Ba (fBa) was in the colloidal-nanoparticulate size-fraction.
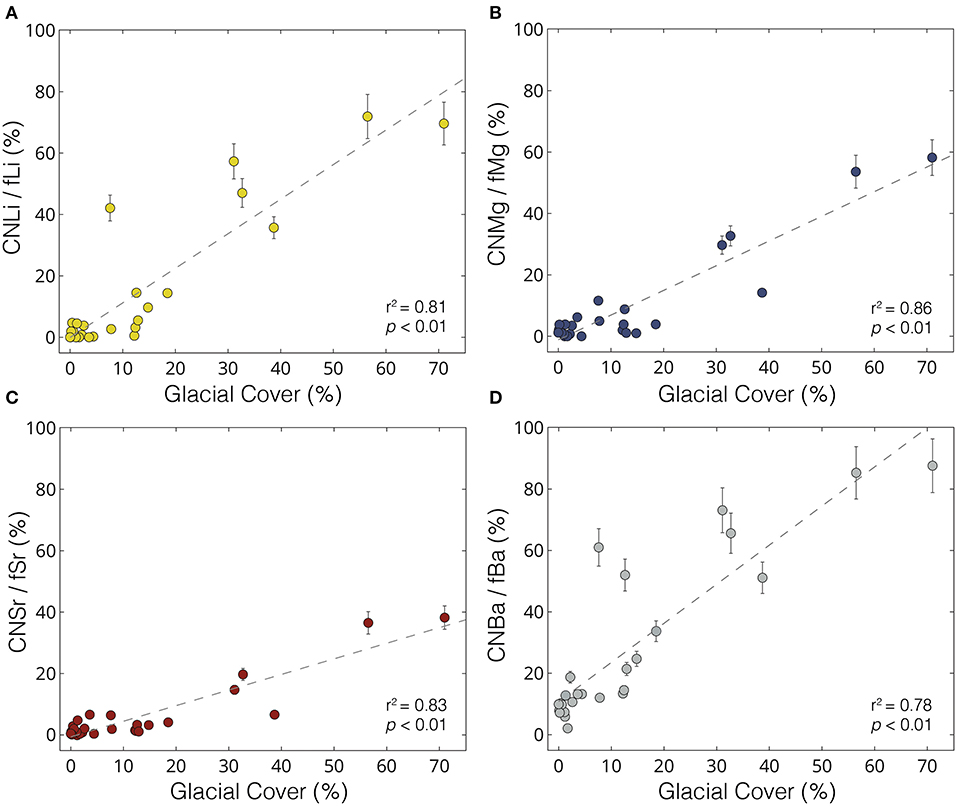
Figure 5. Colloidal-nanoparticulate element concentrations in Patagonian rivers. (A) Concentrations of colloidal-nanoparticulate Li (CNLi) plotted as a percentage of 0.45 μm filterable Li (fLi) vs. glacial cover (%); (B) Concentrations of colloidal-nanoparticulate Mg (CNMg) plotted as a percentage of total filterable Mg (fMg) vs. glacial cover (%); (C) Concentrations of colloidal-nanoparticulate Sr (CNSr) plotted as a percentage of filterable Sr (fSr) vs. glacial cover (%); (D) Concentrations of colloidal-nanoparticulate Ba (CNBa) plotted as a percentage of filterable Ba (fBa) vs. glacial cover (%). Error bars for all elements show ±10%.
3.5. Seasonal Variability
The DSi concentrations of the glacial time-series river (Río Huemules; PFC01-SA) ranged from 13.2 to 18.6 μM (mean = 15.5 ± 1.3 μM, n = 60) in summer and 16.2 to 19.1 μM (mean = 17.0 ± 0.7 μM, n = 16) in winter (Figure 6C). The δ30Si values of the river water were also invariant (Figure 6D), with δ30SifSi values varying from −0.42 to −0.28‰ (mean = −0.35 ± 0.05‰, n = 9) in summer and −0.32 to −0.20‰ (mean = −0.27 ± 0.06‰, n = 3) in winter. The δ30SiDSi values were always significantly higher than δ30SifSi, but were also invariant with time (+0.08 to +0.10‰, n = 3). The measurements of δ30SiASi values of the Río Huemules were also stable across the sampling period, with values ranging from −0.28 to −0.36‰ (mean = −0.32 ± 0.04‰, n = 4).
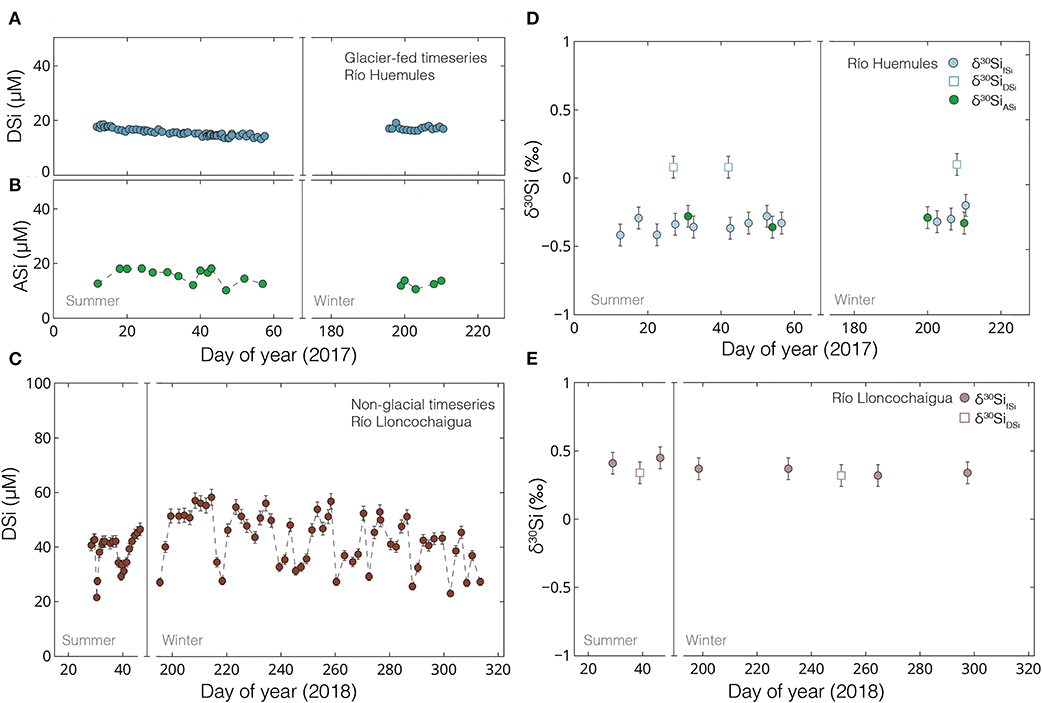
Figure 6. Temporal and seasonal variability of DSi and δ30Si. (A) DSi concentrations vs. decimal day of the year for river samples collected from the Río Huemules draining Steffen Glacier (PFC01-SA; 70% glacial cover) in 2017; (B) ASi concentrations vs. decimal day of the year for river samples collected from the Río Huemules draining Steffen Glacier (PFC01-SA) in 2017; (C) δ30SifSi and δ30SiDSi values and δ30SiASi values for Río Huemules vs. decimal day of the year; (D) DSi concentrations vs. decimal day of the year for river samples collected from the Río Lloncochaigua (PTR01-R4; 1% glacial cover) in 2018; (E) δ30SifSi and δ30SiDSi values from Río Lloncochaigua vs. decimal day of the year. The locations of these samples are shown in Figure 1 and Supplementary Figure 1.
The time-series data collected from the non-glacial river (Río Lloncochaigua; PTR01-R4) showed more variability of DSi concentrations than the glacial site, with values ranging from 21.5 to 58.3 μM (mean = 41.6 ± 9.2 μM, n = 78; Figure 6A), although with no obvious seasonal trends between summer and winter. Despite variable DSi concentrations, the δ30Si values of the river water were always within analytical error, with δ30SifSi values ranging from +0.32 to +0.45‰ (mean = +0.37 ± 0.04‰, n = 6; Figure 6B). No differences were observed between δ30SifSi and δ30SiDSi of the Río Lloncochaigua, with all values within analytical error.
3.6. Silicon Isotope Budgets in Patagonian Rivers
The δ30SiDSi+ASi values of rivers sampled in Patagonia ranged from −0.12 to +1.17‰ (mean = +0.43 ± 0.29‰, n = 36; Figure 7A). For glacier-fed rivers, δ30SiDSi+ASi ranged from −0.12 to +0.26‰ (mean = +0.09 ± 0.14‰, n = 6) and were lower than mean δ30SiDSi+ASi of non-glacial rivers (mean = +0.50 ± 0.26‰, t13 = 5.43, p < 0.01). When the CNSi was also included in riverine Si isotope budget, (δ30SifSi+ASi), values shifted to significantly lighter values compared to δ30SiDSi+ASi for all rivers where CNSi was detected (Figure 7A). The δ30SifSi+ASi values ranged from −0.35 to +1.17 (mean = +0.36 ± 0.32‰, n = 36). The offset between δ30SiDSi and δ30SiDSi+ASi (Δ30SiDSi−−(DSi+ASi) ranged from +0.01 to +0.30‰and showed a positive linear relationship with the proportions of ASi (r2 = 0.64, p < 0.01; Figure 7B). For all rivers where ASi concentrations accounted for >10% of the Si budget (n = 14), δ30SiDSi+ASi values were outside analytical error of δ30SiDSi values (Figure 7B).
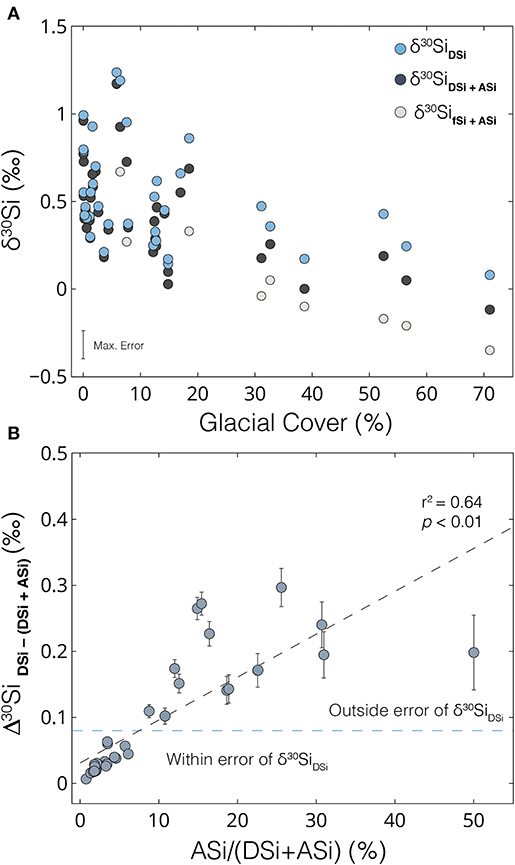
Figure 7. Silicon isotope budgets in Patagonian Rivers. (A) Estimates of the Si isotope budgets of different Si components in Patagonian rivers relative to glacial cover. Blue dots show just the 0.02 μm filtered Si (i.e., DSi). Black dots show the Si isotope value of DSi + ASi components (δ30SiDSi+ASi), assuming that all ASi phases will dissolve in downstream ecosystems. Gray dots show the Si isotope value of fSi + ASi components (δ30SifSi+ASi), assuming that all CNSi and ASi phases will dissolve in downstream ecosystems. Error bars for δ30Si show a maximum error of ±0.08‰; (B) Isotopic offset between δ30SiDSi and δ30SiDSi+ASi components [△30SifSi−(DSi+ASi)] relative to the ASi concentrations as a proportion of ASi + DSi concentrations (%). The blue dashed line shows values above which δ30SiDSi+ASi values are outside analytical uncertainty of δ30SiDSi. Error bars for δ30SiDSi−(DSi+ASi) show propagated uncertainties from 0.00 to 0.06‰.
4. Discussion
4.1. Colloidal-Nanoparticulate Phases Control Filterable Silicon Isotope Compositions in Glacier-Fed Rivers
A key observation in our dataset was that glacier-fed rivers in Patagonia had low 0.45 μm filtered Si isotope compositions (δ30SifSi), with values that varied as a linear function of upstream glacial cover (Figure 2C). Similar light Si isotope compositions have been reported from proglacial rivers in Greenland, where signals were interpreted to reflect leaching of mineral surfaces and dissolution of secondary weathering products such as clays and ASi in undersaturated subglacial meltwaters (Hawkings et al., 2018; Hatton et al., 2019a). However, in Patagonia we found significant differences in the Si concentrations and isotopic compositions of the 0.45 and 0.02 μm samples from glacier-fed rivers, which highlighted the presence of an isotopically light colloidal-nanoparticulate silicate phase (CNSi). This phase was present in all rivers with >20% glacial cover, and relative proportions increased linearly with increasing glacial cover (Figure 4A). As the CNSi dominated the 0.45 μm Si budget in many glacial rivers, this phase effectively controlled the δ30SifSi and shifted values to isotopically light compositions (Figure 4B). As such, the low δ30SifSi observed in glacial rivers in Patagonia reflect variable amounts of CNSi, rather than the release of isotopically light DSi due to subglacial secondary weathering product dissolution as inferred in Greenland (Hawkings et al., 2018; Hatton et al., 2019a).
CNSi was also detected in three rivers with <20% glacial cover (Figure 4A). These rivers all had very large catchment areas (>15,000 km2) and significant glacial meltwater inputs from tributaries draining from the Patagonian Ice Fields, implying that glacial cover was not a good proxy for meltwater inputs in these systems. The Si isotope composition of these rivers also fell above the linear regression between δ30SifSi and the proportions of CNSi defined by glacier-fed rivers with <20% glacial cover (Figure 4B). The higher δ30SifSi values of these three rivers were likely caused by the presence of large non-glacial lakes in their upstream catchment area, as lake waters typically have higher δ30Si values due to enhanced uptake of the light 28Si isotope by diatoms, which leaves the water enriched in 30Si (De La Rocha et al., 1997; Opfergelt et al., 2011). The fact that no CNSi was detected in any other river systems sampled across the region gives inference that these phases were formed as a glacial weathering product (Pryer et al., 2020).
The relatively narrow range of isotope values of the CNSi (δ30SiCNSi; −0.49 to −0.23‰; Figure 2D) suggests that compositions were similar across the sampling region, despite differences in glacial size and catchment properties. The majority of δ30SiCNSi values were within error of δ30Si values reported for the upper continental crust (mean = −0.25 ± 0.16‰; Savage et al., 2013), indicating that the CNSi phase is a lithogenic weathering product. The range of values for δ30SiCNSi were most similar to the isotopic values reported for low temperature smectites (−0.52 to −0.16‰; Georg et al., 2009) and ASi from Greenland (−0.44 to −0.21‰; Hawkings et al., 2018; Hatton et al., 2019a). However, previous investigation of these CNSi phases indicated that they were predominately composed of alkali feldspars, without a significant ASi component, and were formed by glacial comminution of silicate bedrock (Pryer et al., 2020). The δ30SiCNSi values we observed in this region were significantly lower than the isotopic compositions reported for unweathered feldspar (mean = −0.15 ± 0.04‰ (2σ); Georg et al., 2009), likely due to variability in feldspar composition, the fine-grained particle size, the incorporation of minor amounts of other mineral phases, and/or the possibility of isotopically light Si adsorbed to the iron-oxyhydroxide phases present in this size-fraction (Delstanche et al., 2009; Opfergelt et al., 2009; Pryer et al., 2020).
The potential lability of CNSi phases is currently unknown and represents a significant uncertainty in resolving bioavailable Si fluxes and Si isotope exports from glacier-fed rivers in Chilean Patagonia (Pryer et al., 2020). Traditionally feldspars and other aluminosilicate minerals are not considered to be reactive in seawater, and potential contributions to oceanic elemental cycles and isotope budgets are therefore overlooked. Assuming that the CNSi feldspars are unreactive in seawater, their inclusion could lead to significant misinterpretation of glacial river isotope compositions if δ30SifSi values are interpreted to represent truly dissolved signatures. However, recent research has suggested that dissolution of feldspars in seawater may be more significant than previously appreciated, with dissolution rates an order of magnitude higher than in freshwater (Gruber et al., 2019). Indeed, dissolution of the CNSi from glacier-fed rivers in Patagonia may be even more pronounced given the sub-micron particle size, associated large surface area and the potential for distal transport away from the coast. Furthermore, rock-crushing experiments have demonstrated how submicron size feldspar particles are formed due to physical grinding and that these phases are highly unstable in solution and rapidly dissolve to form DSi (Holdren and Berner, 1979). As such, we speculate that CNSi phases could potentially contribute to the labile Si concentrations and isotope compositions exported from glacial rivers, with implications for resolving marine elemental budgets and understanding how variable glaciation could impact the Si cycle. However, more research about the solubility, transformations and fate of these phases is needed to fully resolve their potential impact on downstream ecosystems.
4.2. Implications of Riverine Colloidal-Nanoparticulate Phases
At present, it is unclear whether CNSi phases are ubiquitous in proglacial rivers in other glaciated regions, or how environmental or geochemical processes control their formation and abundance. Samples for DSi analysis are typically filtered through either 0.45 or 0.22 μm filter membranes and concentrations are commonly measured using colorimetric techniques, which only measure truly dissolved Si in the form of silicic acid. As such, CNSi phases can go undetected unless using samples that have been size-fractionated (e.g., 0.45 and 0.02 μm filtered; Shiller, 2003) and measured by mass spectrometry techniques that ionize all Si present in the solution (e.g., ICP-MS). CNSi was only detected in Patagonian rivers because both colorimetric and ICP methods were used, giving Si concentrations that differed by almost an order of magnitude (Pryer et al., 2020). These large differences between methods were not reported from proglacial rivers in Greenland (Hawkings et al., 2018; Hatton et al., 2019a), indicating that CNSi phases were negligible or absent in these river systems. We speculate that the presence of CNSi phases could be affected by a combination of factors including variable filtering techniques, transport through proglacial lakes, the surrounding geology or riverine pH conditions, which could influence the concentrations of fine-grained species in the filtrate (Horowitz et al., 1992, 1996), the grain-size distribution of eroded bedrock (Crompton and Flowers, 2016) or the solubility of finely-ground feldspars (Yuan et al., 2019). High concentrations of CNSi have been reported in glacier-fed rivers in Alaska (mean = 61.1 ± 67.6 μM; Schroth et al., 2011), showing that these phases are present in other glaciated regions. We emphasize that CNSi may have been overlooked in other glacier-fed rivers and should be considered when interpreting Si isotope compositions.
The size-partitioning of several other weathering-sensitive elements including Li, Sr, Mg, and Ba (Figures 5A–D) indicate that these size-fractionated trends may not be unique to Si isotopes. All of these elements had a significant colloidal-nanoparticulate component in glacier-fed rivers, and relative proportions varied as a linear function of glacial cover, suggesting associations with the CNSi or similar glaciogenic controls. For all of these elements, primary mineral phases and secondary weathering products are generally isotopically different from the composition of dissolved species (Peucker-Ehrenbrink et al., 2010; Wimpenny et al., 2010, 2011; Pogge von Strandmann et al., 2019; Gou et al., 2020). As such, it is likely that isotopic trends would show similar offsets between 0.45 μm filtered and dissolved (0.02 μm) compositions as observed for Si. This could potentially obscure the true controls on riverine isotope values and affect terrestrial isotope budgets. These results highlight that size-fractionated filtering is needed to quantify colloidal-nanoparticulate concentrations and isotopic compositions, especially in glacier-fed river systems where these phases may dominate.
Furthermore, there are currently no standardized sampling protocols for analysing “dissolved” stable isotopic composition in rivers, with 0.45 μm or 0.2/0.22 μm pore-sizes and a wide variety of filter membrane types commonly used. We postulate that filtering protocols may dramatically affect filterable concentrations and isotopic composition when a significant colloidal-nanoparticulate fraction is present. These filtering artifacts have been shown to affect the concentration of colloidal-nanoparticulate species by up to an order of magnitude in non-glacial rivers (Horowitz et al., 1992), but the implications for glacier-fed riverine concentrations or for isotope signatures have not been tested before. Quantifying these filtering artifacts and the size-partitioning of different chemical species in glacier-fed rivers may provide valuable insight and help to disentangle the controls on riverine isotope signatures.
4.3. Controls on the Isotopic Composition of Dissolved Silicon in Patagonian Rivers
The dissolved Si isotope composition (δ30SiDSi) of all rivers with a CNSi component shifted to significantly heavier values compared to corresponding δ30SifSi. These offsets were well outside analytical error, reinforcing the importance of accounting for contributions from colloidal-nanoparticulate species. Glacier-fed river δ30SiDSi values were still lower than the mean for non-glacial rivers in this region, likely due to suppressed diatom primary productivity, limited secondary mineral formation and enhanced dissolution of isotopically light ASi phases in turbid, low temperature and undersaturated glacial meltwaters (Hawkings et al., 2018; Hatton et al., 2019b). However, the mean δ30SiDSi composition from glacier-fed rivers in Patagonia (+0.33 ± 0.15‰) was higher than the mean for glacial rivers in Iceland (+0.17 ± 0.18‰, n = 9; Opfergelt et al., 2013), and much higher than mean values from Leverett Glacier in Greenland (−0.25 ± 0.12‰, n = 16; Hawkings et al., 2018) or Qeqertarsuaq (Disko Island) (−0.01 ± 0.29‰, n = 4; Hatton et al., 2019b). These differences in δ30SiDSi are potentially due to the sampling of Patagonian rivers downstream of glacial outlets and after transport through large proglacial lakes, with variable non-glacial inputs, secondary weathering processes, and/or because samples from other regions were not ultra-filtered through 0.02 μm and could potentially contain CNSi phases. Recent research has found that riverine δ30SiDSi values can also be highly variable within glacial regions, with δ30SiDSi values in Icelandic proglacial rivers ranging from −0.58 to +0.78‰ (Hatton et al., 2019b). The controls on the variability of glacial meltwater δ30SiDSi signatures are not fully understood at present, with values likely to be influenced by the geology, catchment size, hydrology, and water residence times in subglacial environments, as well as physical and chemical weathering conditions controlling the dissolution and precipitation of primary and secondary weathering products (Hawkings et al., 2018; Hatton et al., 2019a,b).
Non-glacial river samples showed a wide range of δ30SiDSi values, reflecting the heterogeneity of Si cycling processes across the region. The δ30SifSi and δ30SiDSi values were always within error as there was no detectable CNSi present in rivers without glacial meltwater inputs. The highest δ30SiDSi values (+0.95 to +1.25‰) were from non-glacial rivers fed by large lake systems, likely due to enhanced diatom productivity (De La Rocha et al., 1997; Opfergelt et al., 2011). However, the lake-related high δ30SiDSi values were similar to the global mean riverine δ30SiDSi of +1.25‰ (Frings et al., 2016) and significantly lower than other large lake values such as Lake Baikal in Russia (mean = +2.30 ± 0.38‰; Panizzo et al., 2017). As lakes in Patagonia are generally oligotrophic and primary production is limited by inputs of nitrogen and phosphorus (Baigún et al., 2006), unrestricted diatom growth and further 30Si enrichment of DSi may be curtailed by nutrient availability in this region. The lightest non-glacial δ30SiDSi values were found in tea-colored, organic-rich rivers, which drained from catchments with wetlands and peat-bogs. All rivers of this type had a very narrow range of δ30SiDSi values from +0.14 to +0.21‰and relatively low DSi concentrations of 31 to 40 μM. Such low δ30SiDSi and low DSi concentrations are similar to findings from “blackwater” tributaries of the Congo and Amazon rivers and are interpreted to reflect enhanced dissolution of isotopically light clays by organic acids (Cardinal et al., 2010; Hughes et al., 2013).
The relationships observed between δ30SiDSi and other geochemical variables highlight how chemical weathering plays a key role in driving riverine Si isotope compositions. The positive linear correlations between δ30SiDSi and concentrations of DSi (Figure 3A), total dissolved solids (TDS) (Figure 3B) and other ions such as bicarbonate (Supplementary Figure 2) indicate that progressive chemical weathering of the bedrock creates high δ30SiDSi values, similar to trends reported from other global regions such as the Congo (Cardinal et al., 2010), the Himalaya (Fontorbe et al., 2013), and Iceland (Opfergelt et al., 2013). The weak negative correlation observed between δ30SiDSi values and DSi/Na+K ratios (Figure 3D) demonstrates how the removal of DSi relative to Na and K causes preferential loss of the 28Si isotope, indicating that secondary clay and biogenic Si formation may explain some of the variability in riverine Si isotope compositions (Cardinal et al., 2010; Cockerton et al., 2013; Sun et al., 2018). No relationship was observed between δ30SiDSi and indicators of silicate and carbonate weathering such as divalent:monovalent cation ratios (Tranter et al., 2002; Wadham et al., 2010; Figure 3C) or end-member mixing plots (Gaillardet et al., 2014; Supplementary Figure 4), which have been inferred to influence temporal trends in Si isotope compositions in single catchment systems (Hatton et al., 2019a). The lack of significant trends is likely due to the diverse environmental controls on Si cycling and weathering in Patagonia, combined with mixed catchment lithologies complicating signals.
4.4. Isotopic Composition of Amorphous Silicon Phases
Amorphous silicon (ASi) phases associated with suspended particulate material (SPM) have been shown to readily dissolve in seawater and represent an important component of reactive riverine Si exports (Conley, 1997; Treguer and De La Rocha, 2013; Frings et al., 2014; Hawkings et al., 2017). However, measurements of ASi isotope compositions are currently limited to high-latitude proglacial rivers (Hawkings et al., 2018; Hatton et al., 2019a,b), potentially representing a significant gap in resolving terrestrial Si isotope budgets. ASi was present in all rivers where particulate samples were available for extraction, with concentrations that varied primarily as a function of the SPM load (Pryer et al., 2020) and equalled 1–100% of the respective DSi concentration (Figure 2B). All δ30SiASi values from Patagonian rivers were far lower than corresponding riverine δ30SiDSi showing that the lighter 28Si isotope is preferentially incorporated into ASi phases (Figure 2D) with mean Δ30SiASi−−DSi values of −1.06 ± 0.42‰. These offsets are similar but more variable than empirically derived values for abiogenic ASi formation in freshwater (−0.98 ± 0.12‰; Zheng et al., 2019), likely due to the presence of biogenic ASi phases such as diatoms, which can have a variable Δ30SiASi−−DSi of −1 to −2‰ (Frings et al., 2016). Coupled to this, the dissolution of ASi phases can impart Δ30SiASi−−DSi of +0.25 to −2.5‰, depending on the initial isotopic composition of the ASi phase and the congruency of weathering (Frings et al., 2016). The range of ASi isotopic compositions in Patagonian rivers therefore likely reflects a dynamic balance between the composition of ASi material from biogenic and abiogenic sources, combined with variable dissolution of these phases controlled by factors such as temperature, pH and the saturation state of the river water (Ziegler et al., 2005; Stamm et al., 2019; Zheng et al., 2019).
The δ30SiASi compositions in some non-glacial rivers in Patagonia were lower than the range of values reported for proglacial rivers (−0.86 to −0.05‰; Figure 2D; Hatton et al., 2019b). Such low δ30SiASi values from non-glacial river systems are likely due to the presence of phytoliths, diatoms and other biogenic ASi phases, which have large fractionation factors and are consequently highly enriched in 28Si (Opfergelt et al., 2008; Frings et al., 2016; Sutton et al., 2018). The δ30SiASi values from glacier and volcano-fed rivers were notably higher than δ30SiASi compositions in other river systems, likely due to the reduction or absence of biogenic ASi phases in turbid, light-limited waters (Figure 2D). Additionally, dissolution of ASi phases in subglacial environments and glacier-fed rivers, where rates of physical erosion are high and DSi concentrations are low, may cause preferential loss of 28Si from the ASi (Hawkings et al., 2018; Hatton et al., 2019a), and drive residual ASi phases to heavier isotopic compositions. The δ30SiASi values observed for glacier-fed rivers in Patagonia are similar to data from two glacial systems in Greenland (−0.21 ± 0.06‰and −0.47 ± 0.06‰; Hawkings et al., 2018; Hatton et al., 2019a), suggesting broad similarities in the formation mechanisms and composition of glacial ASi between regions.
4.5. Seasonal Variability in Riverine Si Isotope Compositions
For the two catchments where time-series and seasonal data were collected, both δ30SifSi and δ30SiDSi values showed no significant variability (Figure 6). For the glacier-fed site (Río Huemules, 70% glacial cover), the consistent DSi concentrations, δ30SifSi and δ30SiDSi compositions were likely due to the presence of a large proglacial lake homogenizing and modulating temporal variability (Figures 6A–C). This lack of variability was also observed in the ASi concentrations and δ30SiASi values, suggesting no seasonal change in ASi composition. We also observed no large discharge events, such as glacial lake outburst floods, or obvious seasonal shifts in the hydrological regime of the glacier (i.e., channelized vs. distributed drainage pathways), which are the primary drivers of variability in δ30SiDSi values in proglacial rivers in Greenland (Hawkings et al., 2018; Hatton et al., 2019a). As all glacier-fed rivers sampled in Patagonia drain through large proglacial lakes, we speculate that other glacial catchments will also show negligible temporal variability and our Si isotope compositions are likely to be broadly representative of mean annual values from these catchments.
At the non-glacial time-series site (Río Lloncochaigua, 1.2% glacial cover), consistent riverine Si isotopic compositions were observed, despite variability in DSi concentrations (Figures 6D,E). This lack of isotopic variability indicates that Si sources and biogeochemical cycling within this river catchment were stable across the sampling period. However, other non-glacial rivers in Patagonia may show greater temporal variability in δ30SiDSi values, especially in catchments with non-glacial lakes that likely experience seasonal shifts in siliceous productivity (Alleman et al., 2005; Hughes et al., 2011; Opfergelt et al., 2011). Seasonal variability in δ30SiDSi on the order of ± 1‰has been reported from other global river systems, driven by factors such as snow-melt influencing groundwater flow, shifts in weathering intensity, variable inputs and dissolution of phytoliths from plants, and changes in water temperature that can affect the precipitation or solubility of secondary weathering products (Ding et al., 2004; Pokrovsky et al., 2013; Sun et al., 2018). As such, investigating seasonal controls on riverine Si cycling should be accounted for in future sampling campaigns to fully resolve the Si isotope composition of freshwater flowing into the coastal region of Chilean Patagonia.
4.6. Importance of Including ASi Phases in Labile Riverine δ30Si Export Budgets
We calculated a mass balance accounting for the relative proportions and isotopic compositions of the DSi and ASi components in Patagonian rivers to investigate whether including ASi is important for resolving the “labile” Si isotope composition (δ30SiDSi+ASi) of rivers in this region. The potential contributions from CNSi were excluded in the following discussion, as their solubility and fate in seawater are currently uncertain (Pryer et al., 2020). All rivers with >20% glacial cover had significantly lower δ30SiDSi+ASi compared to δ30SiDSi, with differences that ranged from −0.10 to −0.30‰ (mean = −0.20 ± 0.07‰; Figure 7A). These values were well outside analytical error and show how including ASi components can significantly change estimates of the riverine Si isotope flux to downstream fjords. However, it is not only glacial rivers where the labile Si isotope composition was affected by including ASi. Other rivers with high SPM loads, such as those draining from active volcanoes (e.g., Río Ibanez) or with unconsolidated sediments (e.g., Río Chacabuco), also exhibited large offsets between δ30SiDSi+ASi and δ30SiDSi values, with differences ranging from −0.27 to −0.14‰. Conversely, including the ASi phase did not influence the labile Si isotope budget for non-glacial rivers with low SPM concentrations, where δ30SiDSi+ASi and δ30SiDSi compositions were within analytical uncertainty. Overall, we find that in all river systems where the ASi phases exceed 10% of the labile Si budget (i.e., DSi + ASi), the δ30SiDSi+ASi values were significantly different to δ30SiDSi compositions (Figure 7B). Although there is variability around this trend caused by independent factors that can influence the relative proportions and isotopic compositions of ASi and DSi, this relationship provides a useful indication of river systems where ASi phases are likely to significantly affect estimates of Si isotope exports.
We extend our analysis to investigate whether including ASi phases could change the Si isotope exports from other global watersheds. An example is the Lena River, which has one of the world's largest catchment areas and provides ~20% of the freshwater flux to the Arctic Ocean (Walker, 1998; Holmes et al., 2012). Previous research explored the δ30SiDSi values of the Lena river to quantify the Si isotope composition exported to the Arctic Ocean but did not discuss contributions from reactive ASi phases (Sun et al., 2018). Assuming that ASi concentrations are similar to rivers in Patagonia (mean = 1.12 wt. %; Pryer et al., 2020) and scaling by the mean SPM concentrations of the Lena River (40.5 mg L-1; Fedorova et al., 2015), we approximate that ASi could deliver an additional ~16 μM of reactive Si from this catchment to downstream ecosystems. These assumptions are likely broadly valid due to the relatively narrow range of ASi (wt. %) values reported from global rivers (Frings et al., 2014; Hatton et al., 2019b; Pryer et al., 2020) and the strong linear relationship between SPM and ASi (μM) concentrations (Frings et al., 2014; Pryer et al., 2020). As such, ASi phases in the Lena River could represent ~20% of the total labile Si flux from this catchment, relative to mean annual DSi values of 69.7 μM (Sun et al., 2018). Using the mean δ30SiASi of −0.59‰from this study, we calculate that including ASi in the Si isotope budget for the Lena river could shift δ30Si values by −0.27‰, from δ30SiDSi values of +0.86‰ (Sun et al., 2018) to δ30SiDSi+ASi of +0.59‰. We speculate that including ASi components will significantly change the terrestrial Si isotope flux to the ocean from many other rivers and should be considered in future work.
4.7. Do Glacier-Fed Rivers in Patagonia Have Distinct Si Isotope Compositions?
A key hypothesis of this research was that glacier-fed rivers in Patagonia have distinct Si isotope compositions compared to non-glacial rivers. This has been shown to be true in other regions such as Iceland (Georg et al., 2007; Opfergelt et al., 2013) and Greenland (Hawkings et al., 2018), and suggests that glacial meltwater inputs could influence the oceanic Si isotope inventory over glacial—interglacial periods, with implications for understanding Si isotope paleoclimate records (Hawkings et al., 2018). Initially, the δ30SifSi data showed that glacier-fed rivers in Patagonia were isotopically light compared to non-glacial rivers and compositions varied as a linear function of upstream glacial cover (Figure 2C). However, more detailed analyses showed that this trend was mainly controlled by variable proportions of an isotopically light CNSi phase, which shifted δ30SifSi to lower values. Once the CNSi were removed by ultra-filtration, the δ30SiDSi values of glacier-fed rivers were still very low (mean = +0.33‰; Figure 2C) relative to the global riverine mean (+1.25‰; Frings et al., 2016), and were statistically different to the mean composition of rivers with <20% glacial cover (+0.54‰, t24 = 3.3, p <0.01). However, the δ30SiDSi values of glacier-fed rivers were no longer isotopically distinct from some non-glacial rivers in Patagonia and were often isotopically heavier than organic-rich rivers (mean = +0.17‰).
When ASi phases were included to give δ30SiDSi+ASi as estimates of the labile Si isotope budget, glacier-fed rivers still did not have significantly lower isotope compositions than some non-glacial river systems (Figure 7A). Although all glacier-fed rivers in this region had low δ30SiDSi+ASi (range = −0.12 to +0.26‰), there was overlap with rivers with <20% glacial cover (range = +0.03 to +1.17‰). These results demonstrate that low δ30Si values are not necessarily indicative of glacial meltwater inputs into the Patagonian fjords. Ultimately, the reactivity of CNSi is a key uncertainty in quantifying riverine Si isotope exports from glacier-fed rivers in Patagonia. If the CNSi dissolves in seawater, the reactive Si isotope composition of all rivers with >50% glacial cover would be isotopically distinct compared to non-glacial river systems in this region. Additional research is therefore needed to understand the lability and fate of CNSi within downstream fjords to fully resolve reactive Si isotope exports from glacial rivers in Patagonia. Overall, these data show that glacier-fed rivers have light Si isotope compositions, similar to findings from other glaciated regions. However, glacial river signatures were not isotopically distinct from some non-glacial river systems, highlighting the complex controls on riverine Si isotope exports in Chilean Patagonia.
5. Conclusions
This study provides new insights into how variable glacial cover can affect Si cycling processes and riverine Si isotope compositions using a latitudinal transect of rivers in Chilean Patagonia. A negative linear trend between glacial cover and δ30SifSi in glacier-fed rivers initially indicated that glacial meltwaters could have a distinctive, light Si isotope composition and that the relationship could represent broadly proportional mixing with non-glacial water. However, significant differences between 0.45 and 0.02 μm filtered Si concentrations and Si isotopic compositions of all glacier-fed rivers indicated that an isotopically light colloidal-nanoparticulate Si phase was present and often dominated Si budgets. This CNSi was primarily composed of feldspars and its lability in seawater is currently uncertain, representing a significant gap in resolving glacial Si exports from this region. Similar linear relationships between glacial cover and the colloidal-nanoparticulate concentrations of other weathering sensitive elements, such as Li, Sr, Mg, and Ba, highlight that this issue is not unique to Si and that the isotopic compositions of these elements could also show size-dependent trends in glacial rivers. Once the CNSi phases were removed by ultra-filtration, glacier-fed rivers still had light Si isotope compositions relative to the non-glacial mean, but did not show a significant trend with glacial cover and were no longer isotopically distinct from non-glacial rivers with the lowest δ30SiDSi values. The variability observed in δ30SiDSi compositions reflects the diverse landscape and biogeochemical weathering pathways, with productivity in lakes, interactions with organic-rich waters and chemical weathering intensity exerting important controls. These data give new insights into the factors influencing riverine Si cycling and isotope compositions, providing a baseline to understand future change in Chilean Patagonia.
ASi isotope data from a range of non-glacial and glacial rivers showed that ASi phases were isotopically lighter than DSi and provided preliminary evidence that riverine turbidity affects ASi isotope compositions. Currently, the contribution of ASi phases to Si fluxes and corresponding Si isotope compositions are not routinely measured, and interpretations of riverine Si exports are based on DSi alone. Since ASi was found in all rivers sampled in Patagonia and can equal the flux of DSi, excluding this reactive component potentially gives an incomplete picture, with implications for quantifying terrestrial Si exports, understanding Si cycling and interpreting Si-based paleoclimate records. We postulate that including ASi phases is critical for resolving riverine Si export and isotope budgets both in Chilean Patagonia and other global rivers. Future research on glacial isotope compositions should account for the size-partitioning and potential reactivity of different phases to fully disentangle how terrestrial exports may have varied in the past and are likely to change in our warming world.
Data Availability Statement
The raw data supporting the conclusions of this article will be made available by the authors, without undue reservation. All data used in this study are freely available to download (https://zenodo.org/record/4114629#.X5AjjC2ZMkg).
Author Contributions
The PISCES project was devised by JW, LR, and KH. Data analysis was conducted by HP, with assistance from JHat and JHaw. HP, JHaw, JW, LR, AK, MM, AU, AC, GD, and VH were involved with fieldwork in Patagonia. The manuscript was written by HP, with comments provided by all coauthors. All authors contributed to the article and approved the submitted version.
Funding
This work was funded as part of the NERC-CONICYT project PISCES (NE/P003133/1—PII20150106). HP was supported by the NERC GW4+ DTP and the Natural Environment Research Council (NE/L002434/1). KH and JHat were funded by the European Research Council ERC-ICY-LAB (#678371) and Royal Society grant (RGF-EA-181036). JW was supported by a Royal Society Wolfson Merit Award. JHaw was supported by a European Commission Horizon 2020 Marie Skłodowska-Curie Actions fellowship ICICLES (#793962). This is publication #182 of Huinay Scientific Field Station.
Conflict of Interest
The authors declare that the research was conducted in the absence of any commercial or financial relationships that could be construed as a potential conflict of interest.
Acknowledgments
We thank the editor, Zhilei Sun, and two reviewers for their time and constructive comments, which helped to improve this manuscript. We also thank everyone who assisted with fieldwork in Patagonia and sample analysis in LOWTEX and the Bristol Isotope Research labs.
Supplementary Material
The Supplementary Material for this article can be found online at: https://www.frontiersin.org/articles/10.3389/feart.2020.00368/full#supplementary-material
References
Alleman, L. Y., Cardinal, D., Cocquyt, C., Plisnier, P.-D., Descy, J.-P., Kimirei, I., et al. (2005). Silicon isotopic fractionation in Lake Tanganyika and its main tributaries. J. Great Lakes Res. 31, 509–519. doi: 10.1016/S0380-1330(05)70280-X
Anderson, S. P. (2007). Biogeochemistry of glacial landscape systems. Annu. Rev. Earth Planet. Sci. 35, 375–399. doi: 10.1146/annurev.earth.35.031306.140033
Baigún, C., Mugni, H., and Bonetto, C. (2006). Nutrient concentrations and trophic state of small Patagonian Andean lakes. J. Freshw. Ecol. 21, 449–456. doi: 10.1080/02705060.2006.9665022
Berner, R. A., and Caldeira, K. (1997). The need for mass balance and feedback in the geochemical carbon cycle. Geology 25, 955–956. doi: 10.1130/0091-7613(1997)025<0955:TNFMBA>2.3.CO;2
Berner, R. A., Lasaga, A. C., and Garrels, R. M. (1983). The carbonate-silicate geochemical cycle and its effect on atmospheric carbon-dioxide over the past 100 million years. Am. J. Sci. 283, 641–683. doi: 10.2475/ajs.283.7.641
Blackburn, T., Siman-Tov, S., Coble, M. A., Stock, G. M., Brodsky, E. E., and Hallet, B. (2019). Composition and formation age of amorphous silica coating glacially polished surfaces. Geology 47, 347–350. doi: 10.1130/G45737.1
Cardinal, D., Alleman, L. Y., de Jong, J., Ziegler, K., and Andre, L. (2003). Isotopic composition of silicon measured by multicollector plasma source mass spectrometry in dry plasma mode. J. Anal. Atom. Spectrom. 18, 213–218. doi: 10.1039/b210109b
Cardinal, D., Gaillardet, J., Hughes, H. J., Opfergelt, S., and Andre, L. (2010). Contrasting silicon isotope signatures in rivers from the Congo Basin and the specific behaviour of organic-rich waters. Geophys. Res. Lett. 37, 1–6. doi: 10.1029/2010GL043413
Cockerton, H., Street-Perrott, F., Leng, M., Barker, P., Horstwood, M., and Pashley, V. (2013). Stable-isotope (H, O, and Si) evidence for seasonal variations in hydrology and Si cycling from modern waters in the Nile Basin: implications for interpreting the Quaternary record. Quater. Sci. Rev. 66, 4–21. doi: 10.1016/j.quascirev.2012.12.005
Conley, D. J. (1997). Riverine contribution of biogenic silica to the oceanic silica budget. Limnol. Oceanogr. 42, 774–777. doi: 10.4319/lo.1997.42.4.0774
Crompton, J. W., and Flowers, G. E. (2016). Correlations of suspended sediment size with bedrock lithology and glacier dynamics. Ann. Glaciol. 57, 142–150. doi: 10.1017/aog.2016.6
Davies, B. J., and Glasser, N. F. (2012). Accelerating shrinkage of Patagonian glaciers from the Little Ice Age (similar to AD 1870) to 2011. J. Glaciol. 58, 1063–1084. doi: 10.3189/2012JoG12J026
De La Rocha, C. L., Brzezinski, M. A., and DeNiro, M. J. (1997). Fractionation of silicon isotopes by marine diatoms during biogenic silica formation. Geochim. Cosmochim. Acta 61, 5051–5056. doi: 10.1016/S0016-7037(97)00300-1
De La Rocha, C. L., Brzezinski, M. A., DeNiro, M. J., and Shemesh, A. (1998). Silicon-isotope composition of diatoms as an indicator of past oceanic change. Nature 395, 680–683. doi: 10.1038/27174
Delstanche, S., Opfergelt, S., Cardinal, D., Elsass, F., André, L., and Delvaux, B. (2009). Silicon isotopic fractionation during adsorption of aqueous monosilicic acid onto iron oxide. Geochim. Cosmochim. Acta 73, 923–934. doi: 10.1016/j.gca.2008.11.014
Delvaux, C., Cardinal, D., Carbonnel, V., Chou, L., Hughes, H., and André, L. (2013). Controls on riverine δ30Si signatures in a temperate watershed under high anthropogenic pressure (Scheldt–Belgium). J. Mar. Syst. 128, 40–51. doi: 10.1016/j.jmarsys.2013.01.004
DeMaster, D. J. (1981). The supply and accumulation of silica in the marine environment. Geochim. Cosmochim. Acta 45, 1715–1732. doi: 10.1016/0016-7037(81)90006-5
Ding, T., Wan, D., Bai, R., Zhang, Z., Shen, Y., and Meng, R. (2005). Silicon isotope abundance ratios and atomic weights of NBS-28 and other reference materials. Geochim. Cosmochim. Acta 69, 5487–5494. doi: 10.1016/j.gca.2005.06.015
Ding, T., Wan, D., Wang, C., and Zhang, F. (2004). Silicon isotope compositions of dissolved silicon and suspended matter in the Yangtze River, China. Geochim. Cosmochim. Acta 68, 205–216. doi: 10.1016/S0016-7037(03)00264-3
Dürr, H., M, M., Hartmann, J., Laruelle, G., and Roubeix, V. (2011). Global spatial distribution of natural river silica inputs to the coastal zone. Biogeosciences 8, 597–620. doi: 10.5194/bg-8-597-2011
Fedorova, I., Chetverova, A., Bolshiyanov, D., Makarov, A., Boike, J., Heim, B., et al. (2015). Lena Delta hydrology and geochemistry: long-term hydrological data and recent field observations. Biogeosciences 12, 345–363. doi: 10.5194/bg-12-345-2015
Fontorbe, G., De La Rocha, C. L., Chapman, H. J., and Bickle, M. J. (2013). The silicon isotopic composition of the Ganges and its tributaries. Earth Planet. Sci. Lett. 381, 21–30. doi: 10.1016/j.epsl.2013.08.026
Frings, P. J. (2017). Revisiting the dissolution of biogenic Si in marine sediments: a key term in the ocean Si budget. Acta Geochim. 36, 429–432. doi: 10.1007/s11631-017-0183-1
Frings, P. J., Clymans, W., and Conley, D. (2014). Amorphous silica transport in the Ganges basin: implications for Si delivery to the oceans. Proc. Earth Planet. Sci. 10, 271–274. doi: 10.1016/j.proeps.2014.08.059
Frings, P. J., Clymans, W., Fontorbe, G., De La Rocha, C. L., and Conley, D. J. (2016). The continental Si cycle and its impact on the ocean Si isotope budget. Chem. Geol. 425, 12–36. doi: 10.1016/j.chemgeo.2016.01.020
Gaillardet, J., Viers, J., and Dupré, B. (2014). Trace elements in river waters, in Treatise on Geochemistry, 2nd Edn, eds H. D. Holland and K. K. Turekian (Oxford: Elsevier), 195–235. doi: 10.1016/B978-0-08-095975-7.00507-6
Georg, R. B., Reynolds, B. C., Frank, M., and Halliday, A. N. (2006). New sample preparation techniques for the determination of Si isotopic compositions using MC-ICPMS. Chem. Geol. 235, 95–104. doi: 10.1016/j.chemgeo.2006.06.006
Georg, R. B., Reynolds, B. C., West, A. J., Burton, K. W., and Halliday, A. N. (2007). Silicon isotope variations accompanying basalt weathering in Iceland. Earth Planet. Sci. Lett. 261, 476–490. doi: 10.1016/j.epsl.2007.07.004
Georg, R. B., Zhu, C., Reynolds, B. C., and Halliday, A. N. (2009). Stable silicon isotopes of groundwater, feldspars, and clay coatings in the Navajo Sandstone aquifer, Black Mesa, Arizona, USA. Geochim. Cosmochim. Acta 73, 2229–2241. doi: 10.1016/j.gca.2009.02.005
Gou, L.-F., Jin, Z., Galy, A., Gong, Y.-Z., Nan, X.-Y., Jin, C., et al. (2020). Seasonal riverine barium isotopic variation in the middle Yellow River: sources and fractionation. Earth Planet. Sci. Lett. 531, 1–12. doi: 10.1016/j.epsl.2019.115990
Gruber, C., Harlavan, Y., Pousty, D., Winkler, D., and Ganor, J. (2019). Enhanced chemical weathering of albite under seawater conditions and its potential effect on the Sr ocean budget. Geochim. Cosmochim. Acta 261, 20–34. doi: 10.1016/j.gca.2019.06.049
Hartmann, J., and Moosdorf, N. (2012). The new global lithological map database GLiM: a representation of rock properties at the Earth surface. Geochem. Geophys. Geosyst. 13:119. doi: 10.1029/2012GC004370
Hatton, J. E., Hendry, K. R., Hawkings, J. R., Wadham, J. L., Kohler, T. J., Stibal, M., et al. (2019a). Investigation of subglacial weathering under the Greenland Ice Sheet using silicon isotopes. Geochim. Cosmochim. Acta 247, 191–206. doi: 10.1016/j.gca.2018.12.033
Hatton, J. E., Hendry, K. R., Hawkings, J. R., Wadham, J. L., Opfergelt, S., Kohler, T. J., et al. (2019b). Silicon isotopes in Arctic and sub-Arctic glacial meltwaters: the role of subglacial weathering in the silicon cycle. Proc. R. Soc. A 475:2228. doi: 10.1098/rspa.2019.0098
Hawkings, J. R., Hatton, J., Hendry, K., Souza, G., Wadham, J., Ivanovic, R., et al. (2018). The silicon cycle impacted by past ice sheets. Nat. Commun. 9:3210. doi: 10.1038/s41467-018-05689-1
Hawkings, J. R., Wadham, J., Tranter, M., O'Donnell, E., Sole, A., Cowton, T., et al. (2015). The effect of warming climate on nutrient and solute export from the Greenland Ice Sheet. Geochem. Perspect. Lett. 1, 94–104. doi: 10.7185/geochemlet.1510
Hawkings, J. R., Wadham, J. L., Benning, L. G., Hendry, K. R., Tranter, M., Tedstone, A., et al. (2017). Ice sheets as a missing source of silica to the polar oceans. Nat. Commun. 8:14198. doi: 10.1038/ncomms14198
Hawkings, J. R., Wadham, J. L., Tranter, M., Raiswell, R., Benning, L. G., Statham, P. J., et al. (2014). Ice sheets as a significant source of highly reactive nanoparticulate iron to the oceans. Nat. Commun. 5:3929. doi: 10.1038/ncomms4929
Hendry, K. R., and Brzezinski, M. A. (2014). Using silicon isotopes to understand the role of the Southern Ocean in modern and ancient biogeochemistry and climate. Quatern. Sci. Rev. 89, 13–26. doi: 10.1016/j.quascirev.2014.01.019
Hendry, K. R., Leng, M. J., Robinson, L. F., Sloane, H. J., Blusztjan, J., Rickaby, R. E. M., et al. (2011). Silicon isotopes in Antarctic sponges: an interlaboratory comparison. Antarct. Sci. 23, 34–42. doi: 10.1017/S0954102010000593
Hendry, K. R., and Robinson, L. F. (2012). The relationship between silicon isotope fractionation in sponges and silicic acid concentration: modern and core-top studies of biogenic opal. Geochim. Cosmochim. Acta 81, 1–12. doi: 10.1016/j.gca.2011.12.010
Holdren, G. R., and Berner, R. A. (1979). Mechanism of feldspar weathering-I. experimental studies. Geochim. Cosmochim. Acta 43, 1161–1171. doi: 10.1016/0016-7037(79)90109-1
Holmes, R., McClelland, J., Peterson, B., Tank, S., Bulygina, E., Eglinton, T., et al. (2012). Seasonal and annual fluxes of nutrients and organic matter from large rivers to the arctic ocean and surrounding seas. Estuar. Coasts 35, 369–382. doi: 10.1007/s12237-011-9386-6
Horowitz, A. J., Elrick, K. A., and Colberg, M. R. (1992). The effect of membrane filtration artifacts on dissolved trace element concentrations. Water Res. 26, 753–763. doi: 10.1016/0043-1354(92)90006-P
Horowitz, A. J., Lum, K. R., Garbarino, J. R., Hall, G. E. M., Lemieux, C., and Demas, C. R. (1996). Problems associated with using filtration to define dissolved trace element concentrations in natural water samples. Environ. Sci. Technol. 30, 954–963. doi: 10.1021/es950407h
Hughes, H., Bouillon, S., André, L., and Cardinal, D. (2012). The effects of weathering variability and anthropogenic pressures upon silicon cycling in an intertropical watershed (Tana River, Kenya). Chem. Geol. 308, 18–25. doi: 10.1016/j.chemgeo.2012.03.016
Hughes, H. J., Sondag, F., Cocquyt, C., Laraque, A., Pandi, A., André, L., et al. (2011). Effect of seasonal biogenic silica variations on dissolved silicon fluxes and isotopic signatures in the Congo River. Limnol. Oceanogr. 56, 551–561. doi: 10.4319/lo.2011.56.2.0551
Hughes, H. J., Sondag, F., Santos, R. V., Andre, L., and Cardinal, D. (2013). The riverine silicon isotope composition of the Amazon Basin. Geochim. Cosmochim. Acta 121, 637–651. doi: 10.1016/j.gca.2013.07.040
Lindsay, J. B. (2016). Whitebox GAT: A case study in geomorphometric analysis. Comput. Geosci. 95, 75–84. doi: 10.1016/j.cageo.2016.07.003
Messager, M. L., Lehner, B., Grill, G., Nedeva, I., and Schmitt, O. (2016). Estimating the volume and age of water stored in global lakes using a geo-statistical approach. Nat. Commun. 7:13603. doi: 10.1038/ncomms13603
Millero, F. J., Feistel, R., Wright, D. G., and McDougall, T. J. (2008). The composition of standard seawater and the definition of the reference-composition salinity scale. Deep Sea Res. Part I 55, 50–72. doi: 10.1016/j.dsr.2007.10.001
Nelson, D. M., Tréguer, P., Brzezinski, M. A., Leynaert, A., and Quéguiner, B. (1995). Production and dissolution of biogenic silica in the ocean: revised global estimates, comparison with regional data and relationship to biogenic sedimentation. Glob. Biogeochem. Cycles 9, 359–372. doi: 10.1029/95GB01070
Opfergelt, S., Burton, K. W., Pogge von Strandmann, P. A. E., Gislason, S. R., and Halliday, A. N. (2013). Riverine silicon isotope variations in glaciated basaltic terrains: implications for the Si delivery to the ocean over glacial–interglacial intervals. Earth Planet. Sci. Lett. 369, 211–219. doi: 10.1016/j.epsl.2013.03.025
Opfergelt, S., de Bournonville, G., Cardinal, D., André, L., Delstanche, S., and Delvaux, B. (2009). Impact of soil weathering degree on silicon isotopic fractionation during adsorption onto iron oxides in basaltic ash soils, Cameroon. Geochim. Cosmochim. Acta 73, 7226–7240. doi: 10.1016/j.gca.2009.09.003
Opfergelt, S., and Delmelle, P. (2012). Silicon isotopes and continental weathering processes: assessing controls on Si transfer to the ocean. Comptes Rendus Geosci. 344, 723–738. doi: 10.1016/j.crte.2012.09.006
Opfergelt, S., Delvaux, B., André, L., and Cardinal, D. (2008). Plant silicon isotopic signature might reflect soil weathering degree. Biogeochemistry 91, 163–175. doi: 10.1007/s10533-008-9278-4
Opfergelt, S., Eiriksdottir, E. S., Burton, K. W., Einarsson, A., Siebert, C., Gislason, S. R., et al. (2011). Quantifying the impact of freshwater diatom productivity on silicon isotopes and silicon fluxes: Lake Myvatn, Iceland. Earth Planet. Sci. Lett. 305, 73–82. doi: 10.1016/j.epsl.2011.02.043
Panizzo, V. N., Swann, G. E. A., Mackay, A. W., Vologina, E., Alleman, L., André, L., et al. (2017). Constraining modern-day silicon cycling in Lake Baikal. Glob. Biogeochem. Cycles 31, 556–574. doi: 10.1002/2016GB005518
Peucker-Ehrenbrink, B., Miller, M. W., Arsouze, T., and Jeandel, C. (2010). Continental bedrock and riverine fluxes of strontium and neodymium isotopes to the oceans. Geochem. Geophys. Geosyst. 11, 1–22. doi: 10.1029/2009GC002869
Pogge von Strandmann, P. A. E., Hendry, K. R., Hatton, J. E., and Robinson, L. F. (2019). The response of magnesium, silicon, and calcium isotopes to rapidly uplifting and weathering terrains: South Island, New Zealand. Front. Earth Sci. 7:240. doi: 10.3389/feart.2019.00240
Pokrovsky, O. S., Reynolds, B. C., Prokushkin, A. S., Schott, J., and Viers, J. (2013). Silicon isotope variations in Central Siberian rivers during basalt weathering in permafrost-dominated larch forests. Chem. Geol. 355, 103–116. doi: 10.1016/j.chemgeo.2013.07.016
Pryer, H. V., Hawkings, J. R., Wadham, J. L., Robinson, L. F., Hendry, K. R., Hatton, J. E., et al. (2020). The influence of glacial cover on riverine silicon and iron export in Chilean Patagonia. Glob. Biogeochem. Cycles. 34:e2020GB006611. doi: 10.1029/2020GB006611
Raiswell, R., Hawkings, J., Eisenousy, A., Death, R., Tranter, M., and Wadham, J. (2018). Iron in glacial systems: speciation, reactivity, freezing behavior, and alteration during transport. Front. Earth Sci. 6:222. doi: 10.3389/feart.2018.00222
Reynolds, B. C., Aggarwal, J., André, L., Baxter, D., Beucher, C., Brzezinski, M. A., et al. (2007). An inter-laboratory comparison of Si isotope reference materials. J. Anal. Atom. Spectrom. 22, 561–568. doi: 10.1039/B616755A
RGI Consortium (2017). Randolph Glacier Inventory-A Dataset of Global Glacier Outlines: Version 6.0. Technical Report, Global Land Ice Measurements from Space, Colorado, USA, 3, 1–11.
Savage, P., Georg, B., Williams, H., and Halliday, A. (2013). The silicon isotope composition of the upper continental crust. Geochim. Cosmochim. Acta 109, 384–399. doi: 10.1016/j.gca.2013.02.004
Schroth, A., Crusius, J., Chever, F., Bostick, B. C., and Rouxel, O. J. (2011). Glacial influence on the geochemistry of riverine iron fluxes to the Gulf of Alaska and effects of deglaciation. Geophys. Res. Lett. 38, 1–6. doi: 10.1029/2011GL048367
Shiller, A. M. (2003). Syringe filtration methods for examining dissolved and colloidal trace element distributions in remote field locations. Environ. Sci. Technol. 37, 3953–3957. doi: 10.1021/es0341182
Stamm, F., Zambardi, T., Chmeleff, J., Schott, J., Blanckenburg, F., and Oelkers, E. (2019). The Experimental determination of equilibrium Si isotope fractionation factors among H4SiO4°, H3SiO4- and amorphous Silica (SiO2·0.32 H2O) at 25 and 75°C using the three-isotope method. Geochim. Cosmochim. Acta 255, 49–68. doi: 10.1016/j.gca.2019.03.035
Sun, X., Mörth, C.-M., Porcelli, D., Kutscher, L., Hirst, C., Murphy, M. J., et al. (2018). Stable silicon isotopic compositions of the Lena River and its tributaries: Implications for silicon delivery to the Arctic Ocean. Geochim. Cosmochim. Acta 241, 120–133. doi: 10.1016/j.gca.2018.08.044
Sutton, J. N., André, L., Cardinal, D., Conley, D. J., de Souza, G. F., Dean, J., et al. (2018). A review of the stable isotope bio-geochemistry of the global silicon cycle and its associated trace elements. Front. Earth Sci. 5:112. doi: 10.3389/feart.2017.00112
Tranter, M., Sharp, M. J., Lamb, H. R., Brown, G. H., Hubbard, B. P., and Willis, I. C. (2002). Geochemical weathering at the bed of Haut Glacier d'Arolla, Switzerland - a new model. Hydrol. Process. 16, 959–993. doi: 10.1002/hyp.309
Tréguer, P., Nelson, D. M., Van Bennekom, A. J., DeMaster, D. J., Leynaert, A., and Quéguiner, B. (1995). The silica balance in the world ocean: a reestimate. Science 268, 375–379. doi: 10.1126/science.268.5209.375
Treguer, P. J., and De La Rocha, C. L. (2013). The world ocean silica cycle. Annu. Rev. Mar. Sci. 5, 477–501. doi: 10.1146/annurev-marine-121211-172346
Urey, H. C. (1952). On the early chemical history of the earth and the origin of life. Proc. Natl. Acad. Sci. U.S.A. 38, 351–363. doi: 10.1073/pnas.38.4.351
Wadham, J. L., Tranter, M., Skidmore, M., Hodson, A. J., Priscu, J., Lyons, W. B., et al. (2010). Biogeochemical weathering under ice: size matters. Glob. Biogeochem. Cycles 24, 1–11. doi: 10.1029/2009GB003688
Weaver, S. G., Bruce, R., Nelson, E. P., Brueckner, H. K., and Le-Huray, A. P. (1990). The Patagonian batholith at 48° S latitude, Chile; Geochemical and isotopic variations. Spec. Pap. Geol. Soc. Am. 241, 33–50. doi: 10.1130/SPE241-p33
Wilson, R., Glasser, N. F., Reynolds, J. M., Harrison, S., Anacona, P. I., Schaefer, M., et al. (2018). Glacial lakes of the Central and Patagonian Andes. Glob. Planet. Change 162, 275–291. doi: 10.1016/j.gloplacha.2018.01.004
Wimpenny, J., Burton, K. W., James, R. H., Gannoun, A., Mokadem, F., and Gíslason, S. R. (2011). The behaviour of magnesium and its isotopes during glacial weathering in an ancient shield terrain in West Greenland. Earth Planet. Sci. Lett. 304, 260–269. doi: 10.1016/j.epsl.2011.02.008
Wimpenny, J., Gíslason, S. R., James, R. H., Gannoun, A., Strandmann, P. A. P. V., and Burton, K. W. (2010). The behaviour of Li and Mg isotopes during primary phase dissolution and secondary mineral formation in basalt. Geochim. Cosmochim. Acta 74, 5259–5279. doi: 10.1016/j.gca.2010.06.028
Yuan, G., Cao, Y., Schulz, H.-M., Hao, F., Gluyas, J., Liu, K., et al. (2019). A review of feldspar alteration and its geological significance in sedimentary basins: from shallow aquifers to deep hydrocarbon reservoirs. Earth-Sci. Rev. 191, 114–140. doi: 10.1016/j.earscirev.2019.02.004
Zheng, X.-Y., Beard, B. L., and Johnson, C. M. (2019). Constraining silicon isotope exchange kinetics and fractionation between aqueous and amorphous Si at room temperature. Geochim. Cosmochim. Acta 253, 267–289. doi: 10.1016/j.gca.2019.03.031
Keywords: silicon isotopes, Patagonia, glaciers, amorphous silicon, colloidal silicon, dissolved silicon, rivers
Citation: Pryer HV, Hatton JE, Wadham JL, Hawkings JR, Robinson LF, Kellerman AM, Marshall MG, Urra A, Covey A, Daneri G, Häussermann V and Hendry KR (2020) The Effects of Glacial Cover on Riverine Silicon Isotope Compositions in Chilean Patagonia. Front. Earth Sci. 8:368. doi: 10.3389/feart.2020.00368
Received: 10 May 2020; Accepted: 07 August 2020;
Published: 30 November 2020.
Edited by:
Zhilei Sun, Qingdao Institute of Marine Geology (QIMG), ChinaReviewed by:
Aiguo Dong, China University of Geosciences, ChinaLuke Bridgestock, University of Oxford, United Kingdom
Copyright © 2020 Pryer, Hatton, Wadham, Hawkings, Robinson, Kellerman, Marshall, Urra, Covey, Daneri, Häussermann and Hendry. This is an open-access article distributed under the terms of the Creative Commons Attribution License (CC BY). The use, distribution or reproduction in other forums is permitted, provided the original author(s) and the copyright owner(s) are credited and that the original publication in this journal is cited, in accordance with accepted academic practice. No use, distribution or reproduction is permitted which does not comply with these terms.
*Correspondence: Helena V. Pryer, aGVsZW5hLnByeWVyQGJyaXN0b2wuYWMudWs=