 Antoine Dille
 Sam Poppe
 Sophie Mossoux
 Hamid Soulé3
- 1Department of Geography, Earth System Science, Vrije Universiteit Brussel, Brussels, Belgium
- 2Department of Earth Sciences, Royal Museum for Central Africa, Tervuren, Belgium
- 3Centre National de Documentation et de Recherche Scientifique, Observatoire Volcanologique du Karthala, Moroni, Comoros
Lahars impose significant secondary hazards on highly populated volcanic islands by remobilizing volcanic ash deposits. Karthala, on Grande Comore Island, is a relatively young and poorly eroded basaltic shield volcano with sporadic occurrence of ash-forming phreatic eruptions. In 2005, two mildly explosive episodes emplaced tephra blankets on the summit area. Heavy precipitation subsequently triggered the repetitive occurrence of small-volume secondary lahars up to 2012. These lahars damaged roads and hundreds of houses, affecting thousands of inhabitants at the foot of Karthala volcano, but were poorly documented at the time of their occurrence. Their future hazard remains unclear as well. This study aims at gaining insights into the main characteristics of these lahars, as well as testing and comparing the effectiveness of two numerical tools to simulate the extent of these small-volume lahars. To understand the physical characteristics of the lahars, we first documented the spatial extent and characteristics of the debris deposits at the foot of Karthala volcano and in the ravines that guided the flows. Our observations suggest that the debris were emplaced by small-scale (volumes ≤ 105 m3), rain-triggered and predominantly low sediment concentration lahars. The spatial extent of the deposits served to calibrate and compare numerical lahar simulations from the widely used volume-limited LaharZ model with simulations from Q-LavHA, a probabilistic flow model originally developed for lava flows. Q-LavHA mitigates some limitations of LaharZ, such as its ability to simulate flow bifurcations and the transition from constrained to unconstrained flow but comparison demonstrates that Q-LavHA typically yielded lower simulation accuracies compared to LaharZ simulations. The obtained accuracy values represent a rather poor performance for both models compared to existing studies on larger-volume lahars on stratovolcanoes, and are inferred to result mostly from difficulties in delineating lahar flow paths on the smooth, poorly eroded topography of the volcanic edifice. We therefore also evaluated the potential to increase simulation accuracy by updating a 10 m resolution Digital Elevation Model (DEM) with channel topography measurements. By using such updated DEMs, the correctly delineated area improved for both models. This approach, however, did not prevent simulations to sometimes miss the hazard-prone position of settlements which were actually affected by the hazard in the past. Our study shows the limitations of numerical volcanic flow simulation strategies on young and poorly eroded volcanic edifices, such as active basaltic shields. The results indicate that accurate topographic representations and detailed documentation of spatial extent of the impacted area and lahar deposit thickness are needed to produce accurate lahar simulations, as well as the further adaptation of existing numerical simulation tools to better suit these particular environmental settings.
Introduction
Lahars are sudden and highly mobile mixtures of water, sediment and rock debris originating from volcano slopes (Smith and Lowe, 1991). Since lahars are fundamentally unsteady flows and experience temporal and spatial transformation while flowing downstream (Pierson and Scott, 1985), the term has commonly a genetic connotation rather than referring to a particular flow behavior or sediment concentration (Vallance, 2005; Manville et al., 2009; Vallance and Iverson, 2015). Lahars are defined as primary when syn-eruptive and secondary when occurring after the volcanic activity. Secondary lahars can notably be triggered by heavy precipitation events. They represent a significant and persistent volcanic hazard, capable of impacting downstream infrastructures and settlements years to decades after an eruption (Vallance, 2005; Mothes and Vallance, 2015; Jones et al., 2017). A critical requirement for the formation of a lahar is the availability of erodible material in the rainwater accumulation zone or along the flow path, allowing an increase of both the initial lahar volume and a multiplication of the discharge by several times while flowing downstream (Scott et al., 2005; Doyle et al., 2011; Vallance and Iverson, 2015). This volume increase process is known as bulking and can lead to intensive channel and bank erosion upstream and incremental infilling of channels downstream of break-in-slope. By reducing the channel conveyance capacity, the infilling can induce overflows during, but also after the event(s) if no action is undertaken to improve the channel conveyance capacity (Pierson, 2005).
Lahars are major volcanic hazards, particularly in tropical and warm temperate volcanic regions where high-intensity rainstorms are common (Mothes and Vallance, 2015). The reduction of the risks related to lahar hazards and the determination of proper mitigation measures require delimiting potential lahar runout and extent as well as understanding the triggering factors (Rodolfo, 2000; Huggel et al., 2008; Darnell et al., 2012). Delineation of lahar hazard zones has traditionally been based on field identification of the inundation limit and the review of past records (Scott, 1988; Lavigne et al., 2000; Perrotta et al., 2006), but now computer models are used as part of lahar hazard assessment to overcome the absence of, or complement historic and geologic records of past lahars (e.g., Canuti et al., 2002; Macías et al., 2008; Darnell et al., 2012; Pistolesi et al., 2014; Castruccio and Clavero, 2015). These models commonly fall into different categories, ranging from empirical models lacking explicit flow physics (e.g., MSF, Huggel et al., 2003; LaharZ, Iverson et al., 1998) to complex models based on computational fluid dynamics (e.g., FLO-2D, O’Brien et al., 2007 or Titan2D, Pitman and Le, 2005; Manville et al., 2012; Mead et al., 2016; Córdoba et al., 2018).
Accurate numerical simulation of topography-driven mass flows requires adequate representation of topography (e.g., Wechsler, 2007; Huggel et al., 2008; Boreggio et al., 2018). However, virtual representations of the topography in a Digital Elevation Model (DEM) are not exempt of errors and uncertainties, for example associated to data acquisition method, local environmental condition, spatial resolution or simply time since their acquisition. Those uncertainties can propagate into the output of volcanic flow simulations, reducing overall model accuracies (Stevens et al., 2003; Hubbard et al., 2007; Darnell et al., 2010; Deng et al., 2019). To increase the performance of flow models, some authors use enhanced versions of the original DEM in which field measurements of the channel morphology are implemented (Muñoz-Salinas et al., 2008, 2009; Darnell et al., 2012; Deng et al., 2019). Such updates to a DEM commonly allow for more realistic simulations and extraction of topographic information, but were mainly tested on steep stratovolcanoes with deeply incised ravines (Muñoz-Salinas et al., 2008, 2009; Darnell et al., 2012; Deng et al., 2019).
This work focuses on a series of lahars which affected Grande Comore Island for nearly a decade after the occurrence of two mildly explosive eruptive phases of Karthala volcano in 2005. These flows affected thousands of inhabitants living in settlements situated at the foot of Karthala, becoming one of the main hazards linked to the volcano (IFRC, 2013; Morin et al., 2016). Despite the relatively extensive impact of these lahars, only the impact of these flows on the surrounding population was investigated (Morin et al., 2009, 2016; Morin, 2012), the characteristics of the lahars, as well as the future hazard they represent remaining largely overlooked. Hence, we first describe the physical characteristics and map the spatial extent of the debris deposited by the flows that affected Grande Comore Island. While the repetitive occurrence of these lahars over populated terrain favored important impacts, these events were relatively small-scale compared to the ones commonly occurring on stratovolcanoes (e.g., Vallance, 2005; Mothes and Vallance, 2015). The smooth surface topography of the basaltic shield volcano contributes to further challenge the numerical simulation of the lahar inundation susceptibility, because the narrow ravines that guided the flows are poorly incised in the surroundings and barely represented in the existing digital topographic data. Therefore, we aimed at testing the ability of a recent probabilistic flow model (Q-LavHA; Mossoux et al., 2016) to reproduce these lahars numerically, compared to a standard volume-limited lahar model (LaharZ; Iverson et al., 1998; Schilling, 2014). The mapped lahar deposits served to calibrate and compare numerical lahar simulations through the use of fitness indices. Uncertainties in the original DEM associated with the limited erosion of the volcanic edifice yielded to an unclear modeled drainage pattern, and ultimately introduced important errors in the estimation of the lahar-prone areas. Therefore, we also evaluated the simulation accuracy by updating the digital topography with ravine geometries measured in the field.
Study Area: Karthala Volcano, Grande Comore
Grande Comore Island or Ngazidja is part of the Comoros archipelago, located in the northern part of the Mozambique Channel, between East-Africa and Madagascar (Figure 1). The archipelago is under the influence of a tropical humid climate composed of two seasons: a hot and wet season from October to April during which most of the lahars occurred, and a relatively cool and dry season from May to September. The highest precipitations on a yearly basis, 6000–9000 mm, occur close to the summit of Karthala volcano, compared to 2700 mm per year on average at sea level (Morin, 2012). Despite the high amounts of rainfall, the runoff experienced on the island is generally limited to an estimated 5% of rainfall annually. This is due to important infiltration in the permeable lava and scoria that make up the bulk of the volcano (Bourhane et al., 2016) and the dense tropical vegetation cover on the flanks of the volcano. As a result, there is no permanent river on the island.
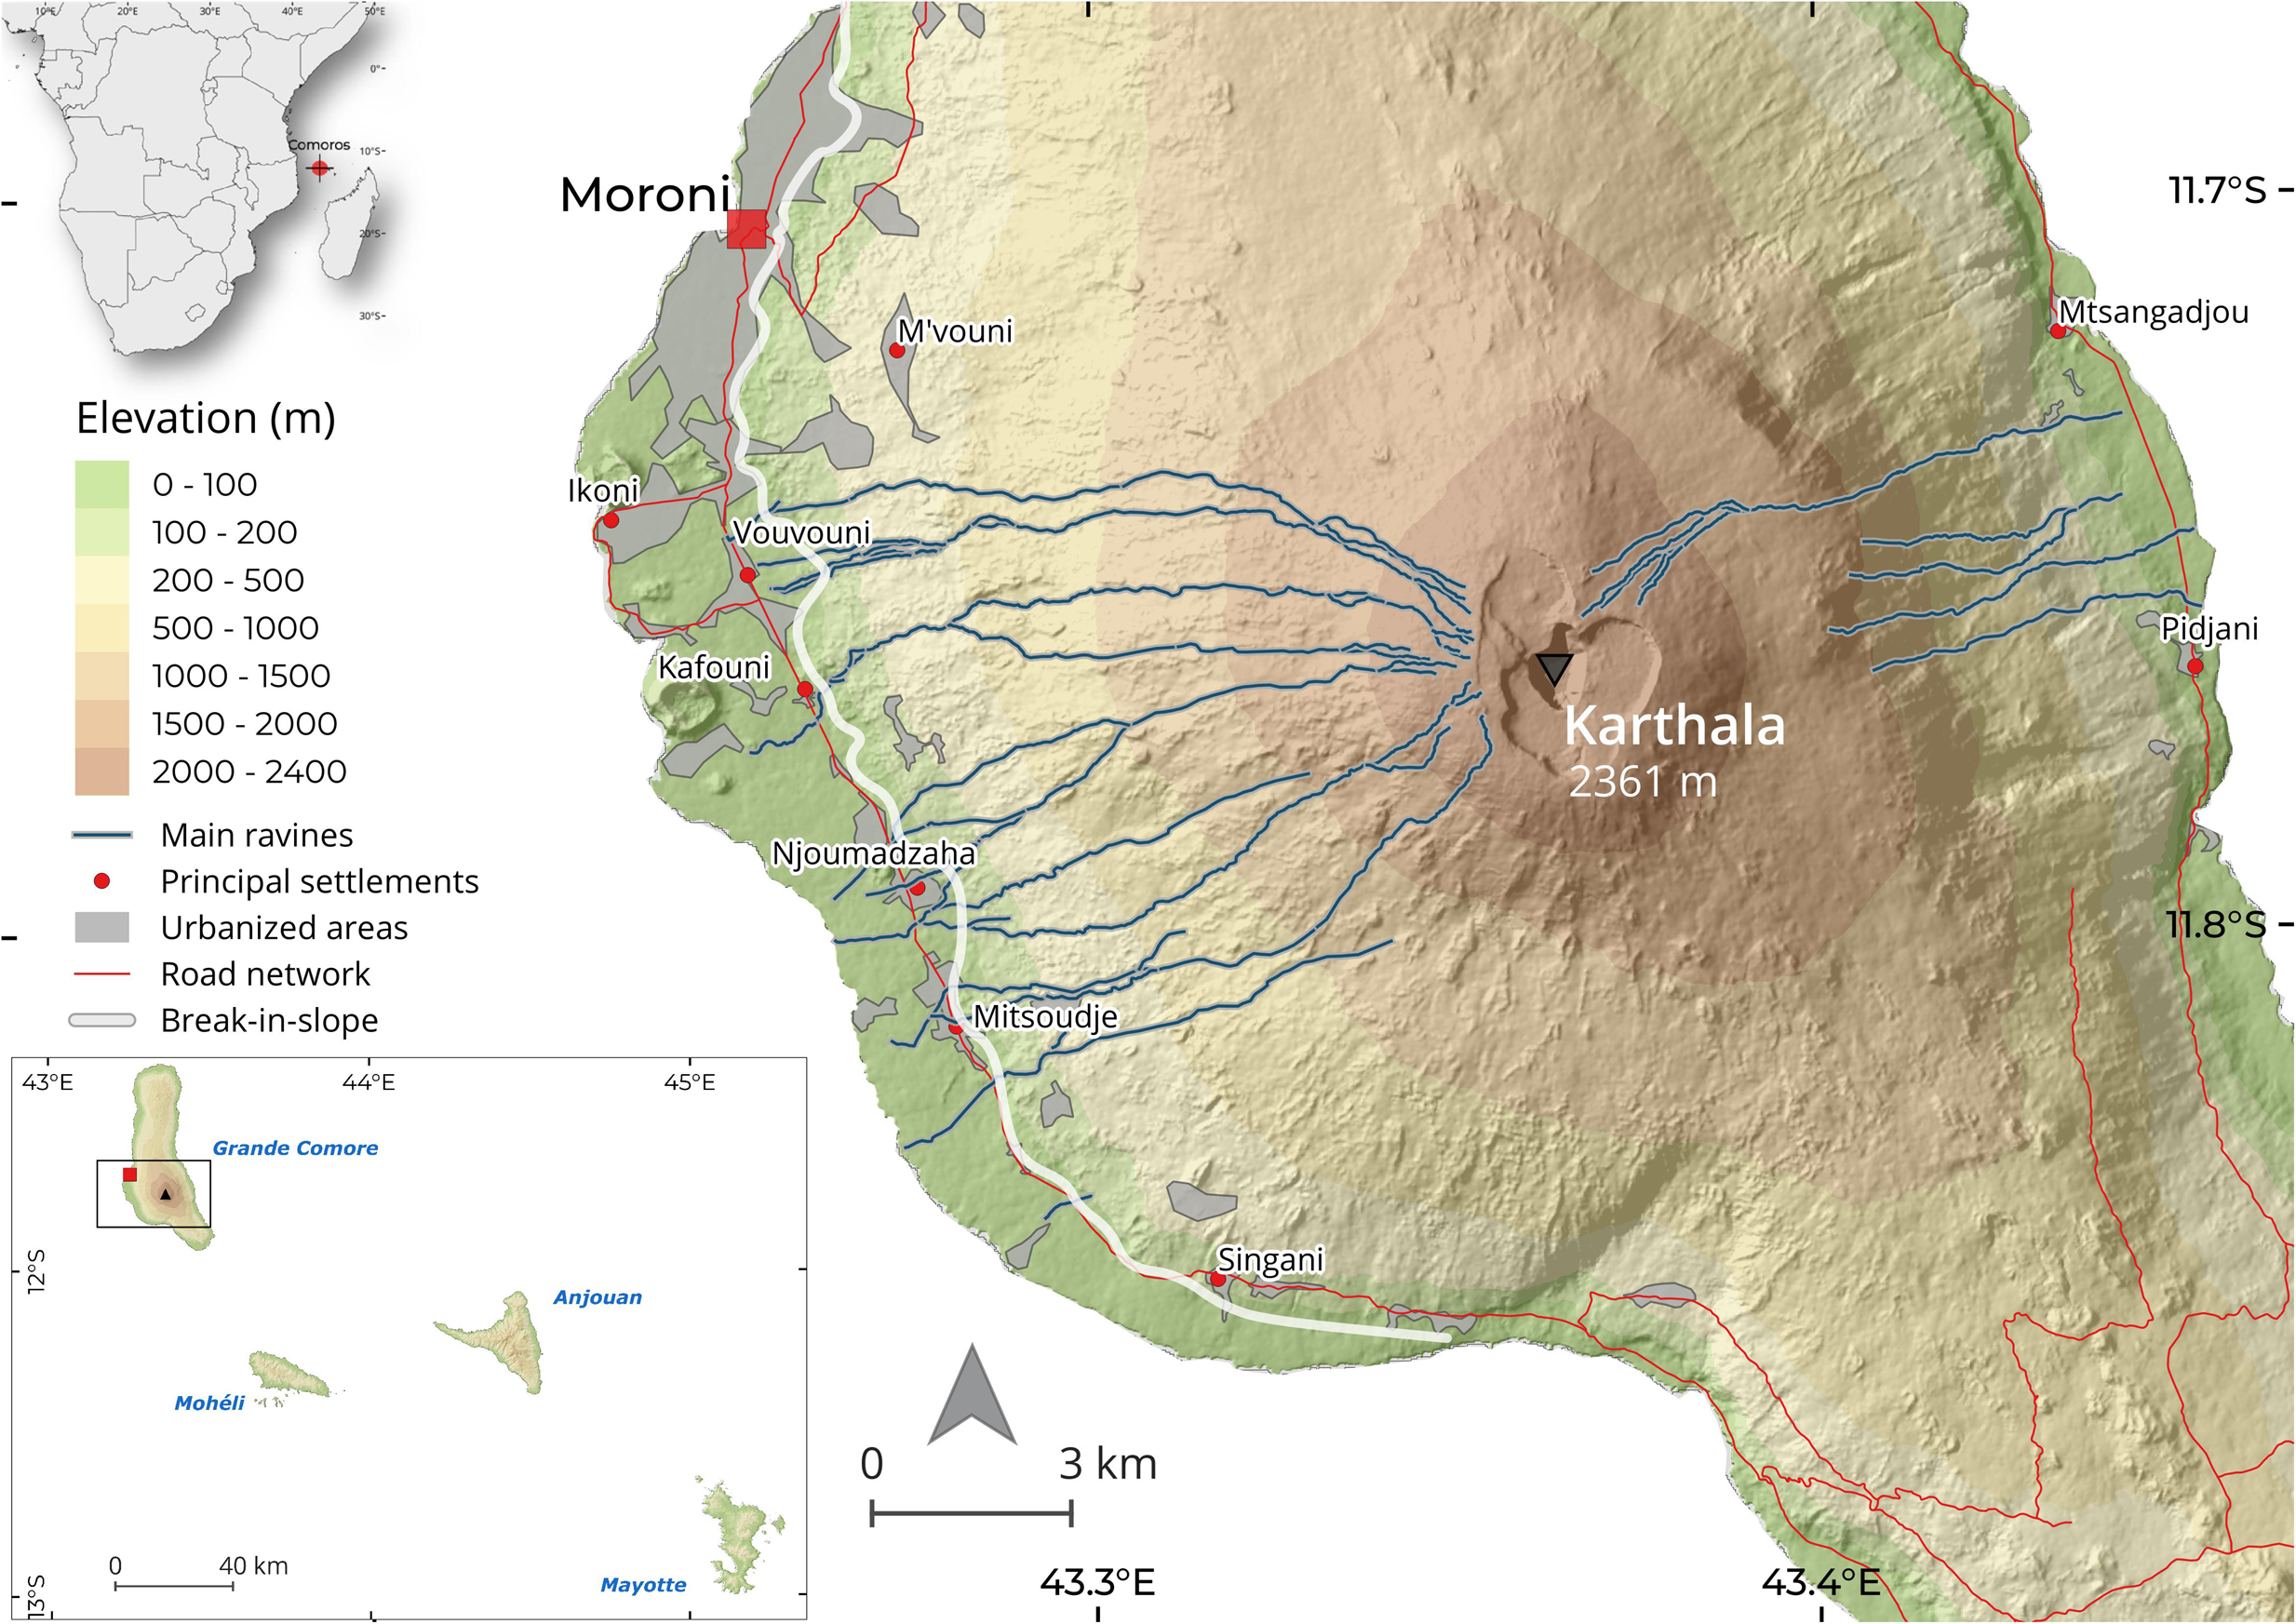
Figure 1. Grande Comore Island and the Comoros Archipelago (insert). The location of the main ravines present on the flanks of Karthala Volcano (southern half of Grande Comore Island) as well as the location of the main settlements are indicated. Note that most of the settlements are sited at the foot of the volcano and their limits often intersect the path of one or multiple ravine(s). Eight ravines on the western flank and one on the eastern flank source from the summit of Karthala where important tephra fallouts were deposited during the 2005 explosive eruptive phases.
Karthala volcano (11.75°S, 43.35°E; 2361 m a.s.l.) forms the southern two-thirds of Grande Comore Island (Figure 1). It is a typical, relatively young (formations of the western flank date 0.1 ± 0.1 Ma) basaltic shield volcano constructed primarily by successive lava flows and therefore erosion is limited (Bachelery and Coudray, 1993). Karthala’s eruptive style is primarily effusive, but sporadic ash-forming phreatic eruptions also occurred from the summit crater at times when a permanent crater lake was present (Bachèlery et al., 2016). Two, mildly explosive, eruptions occurred in 2005 and each emplaced more than 50 × 106 m3 of loose volcanic material on Grande Comore Island (Morin et al., 2009). Centimeter-deep tephra fall deposits have affected between two-thirds (April 2005) and half (November–December 2005) of the island, with meter-deep deposits being measured at the summit of Karthala volcano (Smietana et al., 2007; Morin et al., 2009). Following these eruptions and until 2012, the recurrent formation of lahars from the summit area of the volcano was observed. These lahars were guided alongside the flanks of the volcanic edifice by small-scale ravines. The decrease in slope gradient and loss of confinement at the foot of the volcano favored overflow and the emplacement of large quantities of sediments within the narrow coastal zone. The majority of the events were documented on the western flank of the volcano. This zone coincides with the most densely populated area on the island, that for a large part concentrates over the coastal zone at the foot of the western flank of Karthala (Mossoux et al., 2018, 2019). At present, the central summit crater holds no permanent lake.
Materials and Methods
Survey of Lahar Deposits
A field survey of the lahar deposits was completed in September 2015 to assess the nature of lahars on Karthala volcano. We delineated the extent of the deposits in the area downstream of the break-in-slope (i.e., the aggradation area within the coastal zones, Figure 1) by using participative mapping with local communities and extensive field survey. The impacts of the different lahars in each village were discussed with inhabitants and the affected area was collectively delineated on printed satellite views (Google Earth images from 2012). In addition, areas affected by lahars in the villages and their surroundings were visited with local inhabitants. A systematic characterization of deposit thickness and granulometry could not be obtained any longer due to erosion and commercial excavation during the lag time between the event occurrence and the field observations. Instead, a general picture of the characteristics of the deposits (e.g., overall grain size, sorting, thickness, etc.) at different sites over the aggradation area was obtained in man-made trenches where lahar deposits are commercially excavated. The lahar deposits were mapped in September 2015 and therefore integrate material from several events. Yet, they best represent the 2012 lahars which were the last and largest-scale events.
Update of the DEM With Field Measurements of Ravine Morphology
Many of our preliminary lahar simulations at Karthala volcano poorly simulated the hazard-prone position of infrastructures and settlements actually affected by lahar events (see “Results” section). Adequate representation of the topography in a DEM being a fundamental parameter for numerical simulation of mass flows such as lahars (Wechsler, 2007; Huggel et al., 2008; Darnell et al., 2010), we suspected that poor simulation results were caused by lack of representation of small-scale ravines in the DEM. Those ravines guiding the flows over the otherwise smooth topography of the flanks of Karthala, their inaccurate representation resulted in errors in flow path calculations. In an effort to increase simulation accuracies, we updated the available high-resolution DEM [a 10 m TanDEM-X (from 2011 TDX images)] by using field measurements of ravine morphology (Figure 2). This DEM was produced by EADS-ASTRIUM with expected absolute horizontal and vertical accuracies < 10 m and relative vertical accuracies < 4 m (Wessel, 2018).
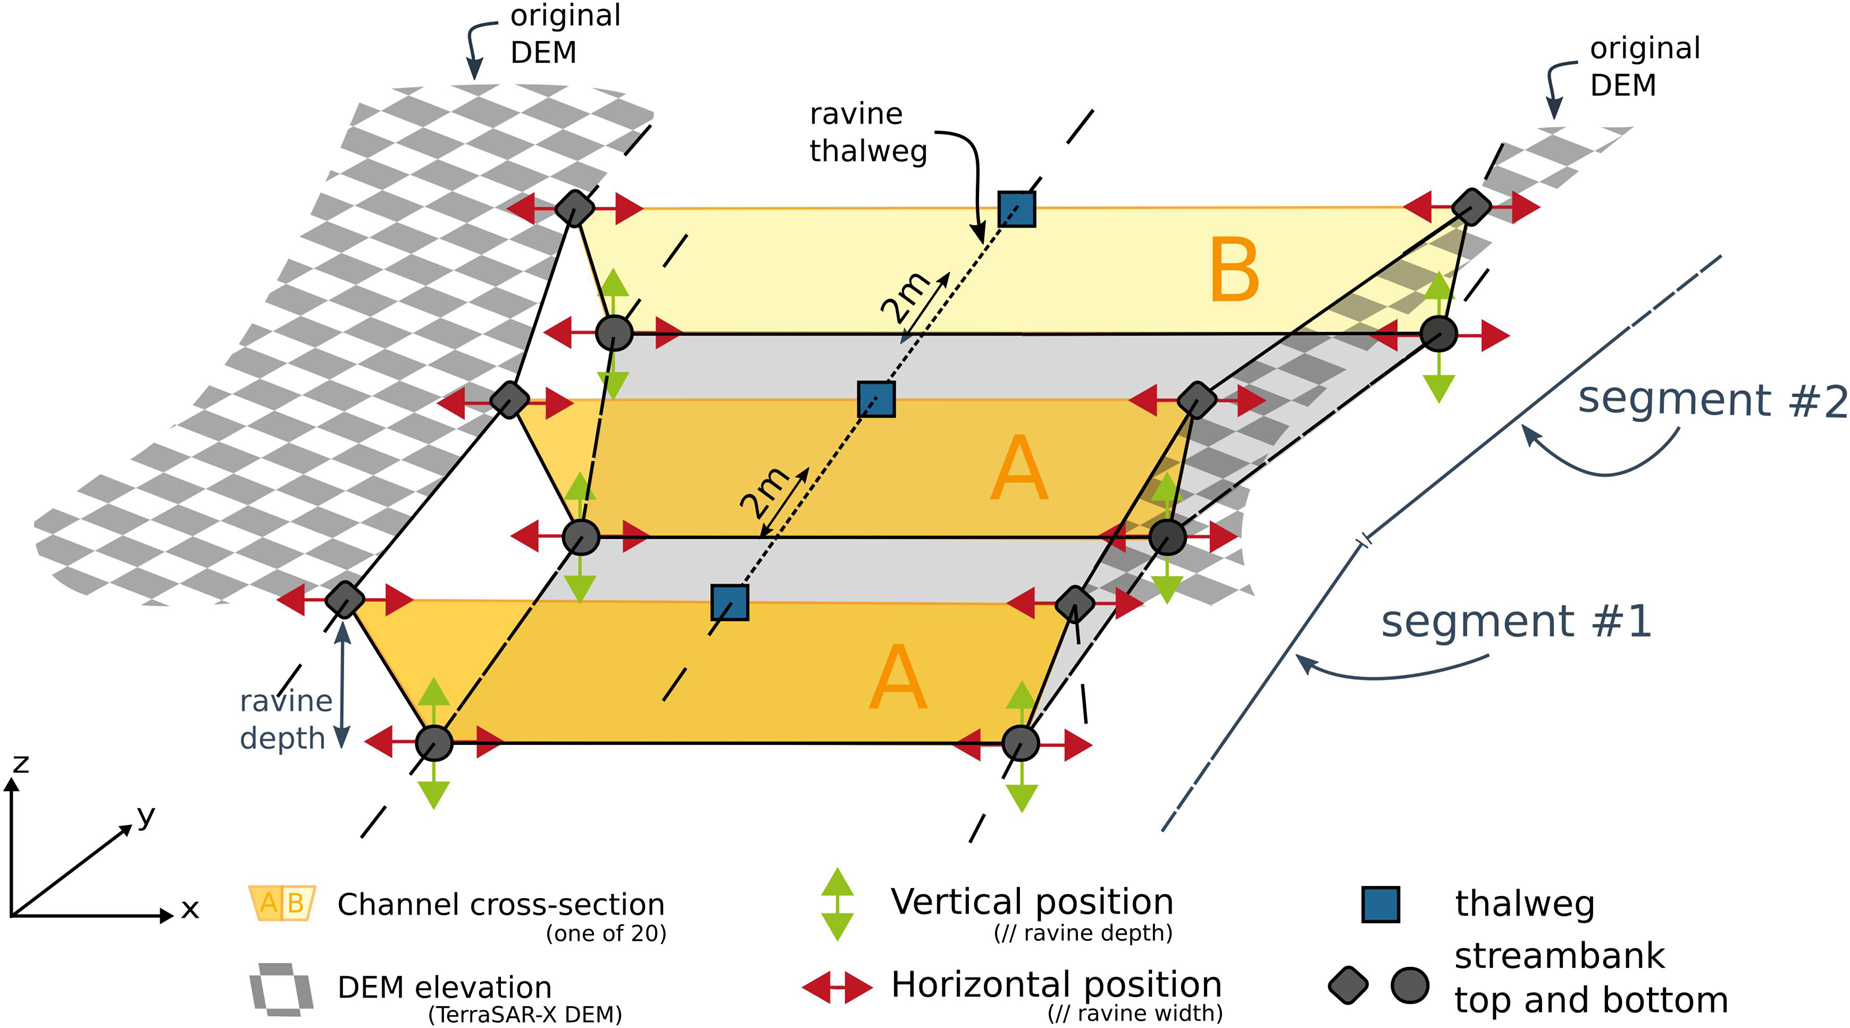
Figure 2. Schematic representation of the method used to implement channel cross-sections in the DEM. Two different channel cross-section geometries (A and B) are presented, corresponding to two different ravine representative segments (#1 and #2). Their characteristics (width, depth, and steepness of streambanks) are derived from field observations for each segment of the ravine.
The method used for the survey of ravine morphologies was adapted from Muñoz-Salinas et al. (2008) and Maerker et al. (2015). It aimed at a rapid and accurate survey of many ravines in a limited amount of time. For each ravine, we recorded the position (x-, y- coordinates) of the thalwegs using a hand-held GPS device with a 2–5 m precision. Measurements of the channel geometry (width and depth) were collected using a measuring tape each time a change in the morphology of the ravine’s cross-section was encountered. Not all ravines located on the flanks of Karthala were surveyed and none on its entire length due to access difficulties (e.g., dense vegetation, high cliffs, steep slopes, etc.). A priority was given to ravines which are most important by their size, the quantity of material transported to the coastal area and/or by their probability to affect a village.
The collected information concerning ravine geometry then served as basis to update the DEM, adapting the methods developed by Muñoz-Salinas et al. (2008). To limit the overall complexity of implementing a very large number of different channel cross-sections, we first grouped all different ravine segments into 20 groups (later called representative segments) based on their observed channel geometry (width and depth; Supplementary Figure 1). For segments where no field measurements could be collected (about 50% of the combined ravine length on Karthala western flank), the position of the thalweg was deduced from high-resolution Pléiades images (2013) and the channel characteristics were assigned based on known segments having similar elevation, distance from summit and/or slope characteristics.
The implementation of the ravine channel in the DEM was started by creating points along the thalweg (i.e., the middle of the ravine channel) at 2 m intervals (Figure 2). At the position of each of these points, we schematically drew a ravine channel cross-section (perpendicular to the thalweg line) by defining four points representing the top and the bottom of each stream bank (see Muñoz-Salinas et al., 2008; Figure 2). Both width and depth of the cross-sections were defined based on the values of the representative segment derived from field observations. The elevation of the top the streambanks is simply determined from the original elevation at this location (derived from the DEM). The elevation of the bottom of the streambanks corresponds to the depth of the ravine, therefore subtracted from the original elevation at this location (Figure 2). To allow the implementation of these 4 points representing the cross-section along the ravines, the TDX DEM was fully converted into a point feature, where we replaced the points located in the ravine with these newly created cross section points. Because the 10 m resolution of the DEM is not adequate to represent the small ravine dimensions, the initial elevation points were resampled to 5 m resolution using a bilinear interpolation resampling technique in a GIS environment. The final DEM was then interpolated using the ANUDEM method developed by Hutchinson (1989) and Hutchinson et al. (2011). The result is a raster DEM at 5 m resolution where the ravine channels, previously imperceptible to both the eye and flow models, are now present in the DEM representation of the surface topography.
Models for Lahar Flow Simulations
Two simple models were used to reproduce the lahars documented on the flanks of Karthala volcano. Both models are topography driven and do not require the input of hydraulic parameters.
LaharZ (Iverson et al., 1998; Schilling, 2014) is one of the most widely applied models for lahar hazard zonation (Manville et al., 2012; Castruccio and Clavero, 2015). This semi-empirical model is based on relationships derived from the compilation of data from ∼30 lahars worldwide, which provides a correlation between the lahar volume V (m3), the channel cross-sectional area filled by the flow A (m2), and planimetric inundation area B (m2):
where C and K are constants commonly set at 0.05 and 200 for lahars, respectively (Schilling, 2014). These values may not be accurate for all environments (Carranza and Castro, 2006), and some authors (e.g., Worni et al., 2012; Castruccio and Clavero, 2015) have modified those to fit more closely to the characteristics of the flows studied. Given the relatively small scale of the lahars generated on Karthala compared to those included in the dataset of Iverson et al. (1998), we recalibrated the constants using our estimates for the lahars of Karthala (Table 1) and data for events of similar scale in the dataset of Iverson et al. (i.e., lahars with volumes less than or equal to 1.5 × 10⁶ m3). From this set combining 16 small-scale lahars, we obtained values for C and K coefficients of 0.04 and 100. We evaluated the potential increase in accuracy provided by the recalibrated constants by comparing to simulation outputs obtained with the values commonly used for lahars (C = 0.05 and K = 200; Schilling, 2014). Simulations were performed for flows with four volumes ranging from 0.5 × 10⁶ m3 (average estimated volume from the study of the lahar deposits (section “Description of Flow Deposits”) to 5 × 10⁶ m3, that is ca. 3 times the largest estimated volume for a lahar at Karthala volcano.
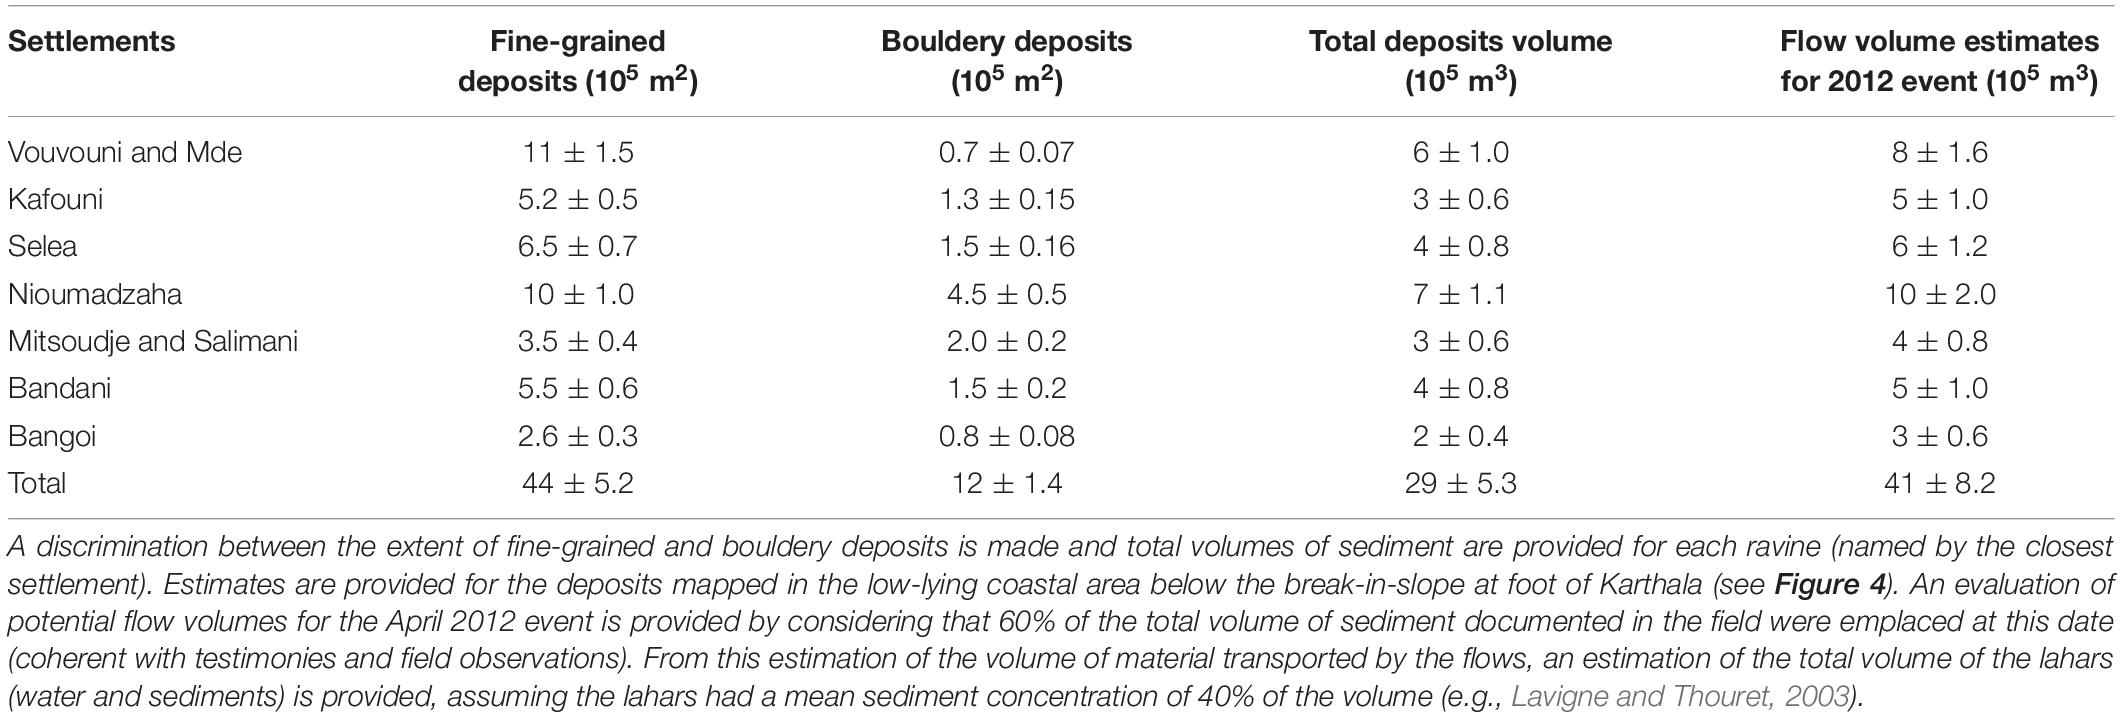
Table 1. Extent and estimation of volume of lahar deposits mapped in the field in September 2015 for the ravines draining the western flank of Karthala volcano.
In LaharZ the onset of the inundation area is usually defined by the intersection of a theoretical cone and the real topography. This so-called H/L cone is known as the proximal hazard zone boundary (PHZB). Owing to the convex shape of Karthala’s volcanic edifice (shield volcano), the automatic location of the PHZB was found unrealistic. Similar limitations have already been encountered on other edifices (e.g., Canuti et al., 2002; Pistolesi et al., 2014). Hence, the location of simulation onsets was here manually defined based on the reconnaissance fieldwork, with onsets located between 600 and 800 m a.s.l. on the flank of Karthala. This position is located directly downslope of the lowermost flank section steeper than 20° (hereafter called Onset-L), where ravines are less incised and overflows (i.e., deposition of material outside the ravine channel) were documented. This position might best represent the point where the lahars reached their maximum volume through runoff accumulation and bulking. To assess the capability of LaharZ to also simulate propagation of lahars on steep, erosive section of the ravines such as performed by Q-LavHA, simulations were also performed from the summit of the volcano (>2200 m) where the lahars were initiated (Onset-H).
Q-LavHA is an open-source plugin that combines existing probabilistic and deterministic models to simulate flow invasion probability based on a DEM (Mossoux et al., 2016). Although the complete plugin was initially designed to model lava flows, the probabilistic approach proposed – because simply constrained by the steepest slope – is relevant to model any other topographically controlled gravity-driven mass flow. Its utilization for modeling lahars is evaluated in this study. With this approach, flow path simulations are iterated from a predefined source point to calculate the probability of inundation of every pixel of the area, with iterations allowing to mimic lateral spread and flow bifurcations. To define where the flow will propagate, the model analyses at each step the elevation of the eights surrounding pixels, allocating to each the following probability to host the flow (Mossoux et al., 2016):
where Δhi is the difference in altitude between the pixel where the flow is located (central pixel) and each of the eight surrounding pixels. The probability of each pixel to be inundated by the flow is then calculated by computing several random paths by means of a Monte Carlo algorithm and calculating which proportion of these paths passes through any given pixel. The use of the second power increases the probability of the selection of the steepest flow path and reduces the flow width (Mossoux et al., 2016). This parameter is certainly important for lahars which are more constrained by gravity and more confined in the channel because of their lower overall viscosity with respect to lava flows. To the elevation of the central pixel, the user may decide to add two topographic correction factors (Hc and Hp) that allow the flow to overcome small obstacles and split in several branches. Hc is always added to the elevation of the central pixel before calculating Δhi and represents the average thickness of the flow (in meters). Hp factor is designed to represent the maximum flow thickness (in meters). By filling small cavities and allowing to overcome small topographical obstacles when Hc is not sufficient, it also influences the degree of lateral spread of the flow. We tested a conservative range of values for Hc (mean flow thickness; 0–4 m) and Hp (maximal flow thickness; 0–6 m). These values seem appropriate in light of the maximum inundation depth reported by eyewitnesses in the villages affected by the lahars, and relationships from the literature stating that lahar flow thickness can be 4–5 times the deposit thickness (Thouret et al., 2020). For each ravine are defined two simulation onsets: Onset-H located over the summit of Karthala where the lahars were initiated (>2200 m a.s.l.) and Onset-L, defined for LaharZ simulations and located where the lahars reached their maximum volume through runoff accumulation and bulking (∼600–800 m a.s.l.). While LaharZ simulations are volume limited, in Q-LavHA, the length of the simulated lahar is simply limited to a maximum length defined by the user. We here provided input lengths (∼30–120 km) that preliminary tests showed sufficient for the simulated lahars to reach the coastal area at the foot of the volcano but that are actually largely exceeding the actual (∼10–14 km) distance between Karthala summit and the coastal area. Accuracies of simulations using four different runout length values were compared. The set-up of the Q-LavHA model, including interdependencies between simulated flow length and DEM resolution, is described in detail in Mossoux et al. (2016).
Three different DEMs were used in the simulations: the original TDX 10 m DEM, an original TDX DEM resampled to 5 m resolution and an updated version of the 5 m resolution DEM that considers the detailed ravine geometry (see section “Update of the DEM With Field Measurements of Ravine Morphology”). The use of these different DEMs allow discrimination of the effect of resampling and of the implementation of the ravine morphology on the simulation outputs.
Different inundation scenarios were tested, to allow parameter calibration and therefore compare the outputs of the most accurate LaharZ and Q-LavHA simulations. For both models, we ran a range of simulation scenarios with the different combination of input parameters that can be tuned in the models (i.e., C, K coefficients and volumes for LaharZ and Hc, Hp and flow length values for Q-LavHA). This was done for simulations over the three ravines draining the western flank of Karthala that experienced the largest documented lahar flows. In addition, those simulation scenarios were replicated for the two different simulation onsets (Onset-L and Onset-H) and the three different DEMs. The accuracy of each simulation scenario is assessed by use of fitness indices (FI), where the simulated flow is compared to the spatial extent of the deposits mapped in the field (e.g., Favalli et al., 2009; Mossoux et al., 2016). For each ravine, we selected based on the fitness indices the simulations with the highest accuracies for comparison with the best simulations from the other model (best-fit scenario). Detailed fitness indices are provided for the simulations with the highest accuracy for each model, ravine, onset and DEM in Supplementary Table 2.
Three different fitness indices are calculated. The true positive (TP) assesses the fit between the simulated inundation area (Asim) and the area mapped in the field (Afield). Also referred to as the Jaccard similarity coefficient (Levandowsky and Winter, 1971), it is calculated by dividing the overlapping area between the simulated flow and the actual flow by the net total area covered by the simulated and actual event (Eq. 4).
The false positive (FP) measures overestimation of the actual inundated area. It therefore represents the fraction of the simulated inundation area that was not mapped as inundated in field (Eq. 5).
Finally, the false negative (FN), measures the underestimation of the actual inundated area, representing the fraction of the inundation area mapped in the field that is not simulated by the model (Eq. 6).
The three indices being divided by the total area covered by the two flows, their sum equals one (see Mossoux et al., 2016). Note that we consider that high accuracy simulation must both have high true positive values (area correctly delineated) and very low false negative values (area underestimated), both indices being crucial for effective use in risk management (Mossoux et al., 2016). Since Q-LavHA outputs provide probability-related values indicating areas more or less likely to be inundated, a probability value of 0.01% was chosen to classify Q-LavHA simulation pixels into the same two categories as the binary outputs of LaharZ (inundated or not inundated) to allow comparison with the latter. Finally, note that the fitness indices are calculated only over the area downstream of the concave break-in-slope found at the foot of the volcano (Figure 1). This allows comparing the two models despite their different strategies in the positioning of the simulation onset.
Characteristics of Lahars
Karthala Ravines
The majority of the ravines on the Karthala edifice have their origin close to the volcano summit (Figure 1), where important tephra fall deposits (up to 2 m thick) were emplaced during the 2005 eruptions (Smietana et al., 2007; see Figure 3a). Ravines’ width ranges from 5 to 20 m and depth from 1 to 20 m. These values vary greatly, both among ravines and within a single ravine as a function of elevation along the volcano flank. As expected, while most are narrow and shallow close to the fairly flat Karthala summit, they deepen with increase in slope gradient. On the steep flanks, these ravines cross a series of resistant lava flows separated by weaker layers of scoriaceous rubble, sporadic ash or soil. We observed many collapsed streambanks probably formed by undercutting of the weaker layers by intense flows (Figure 3b).
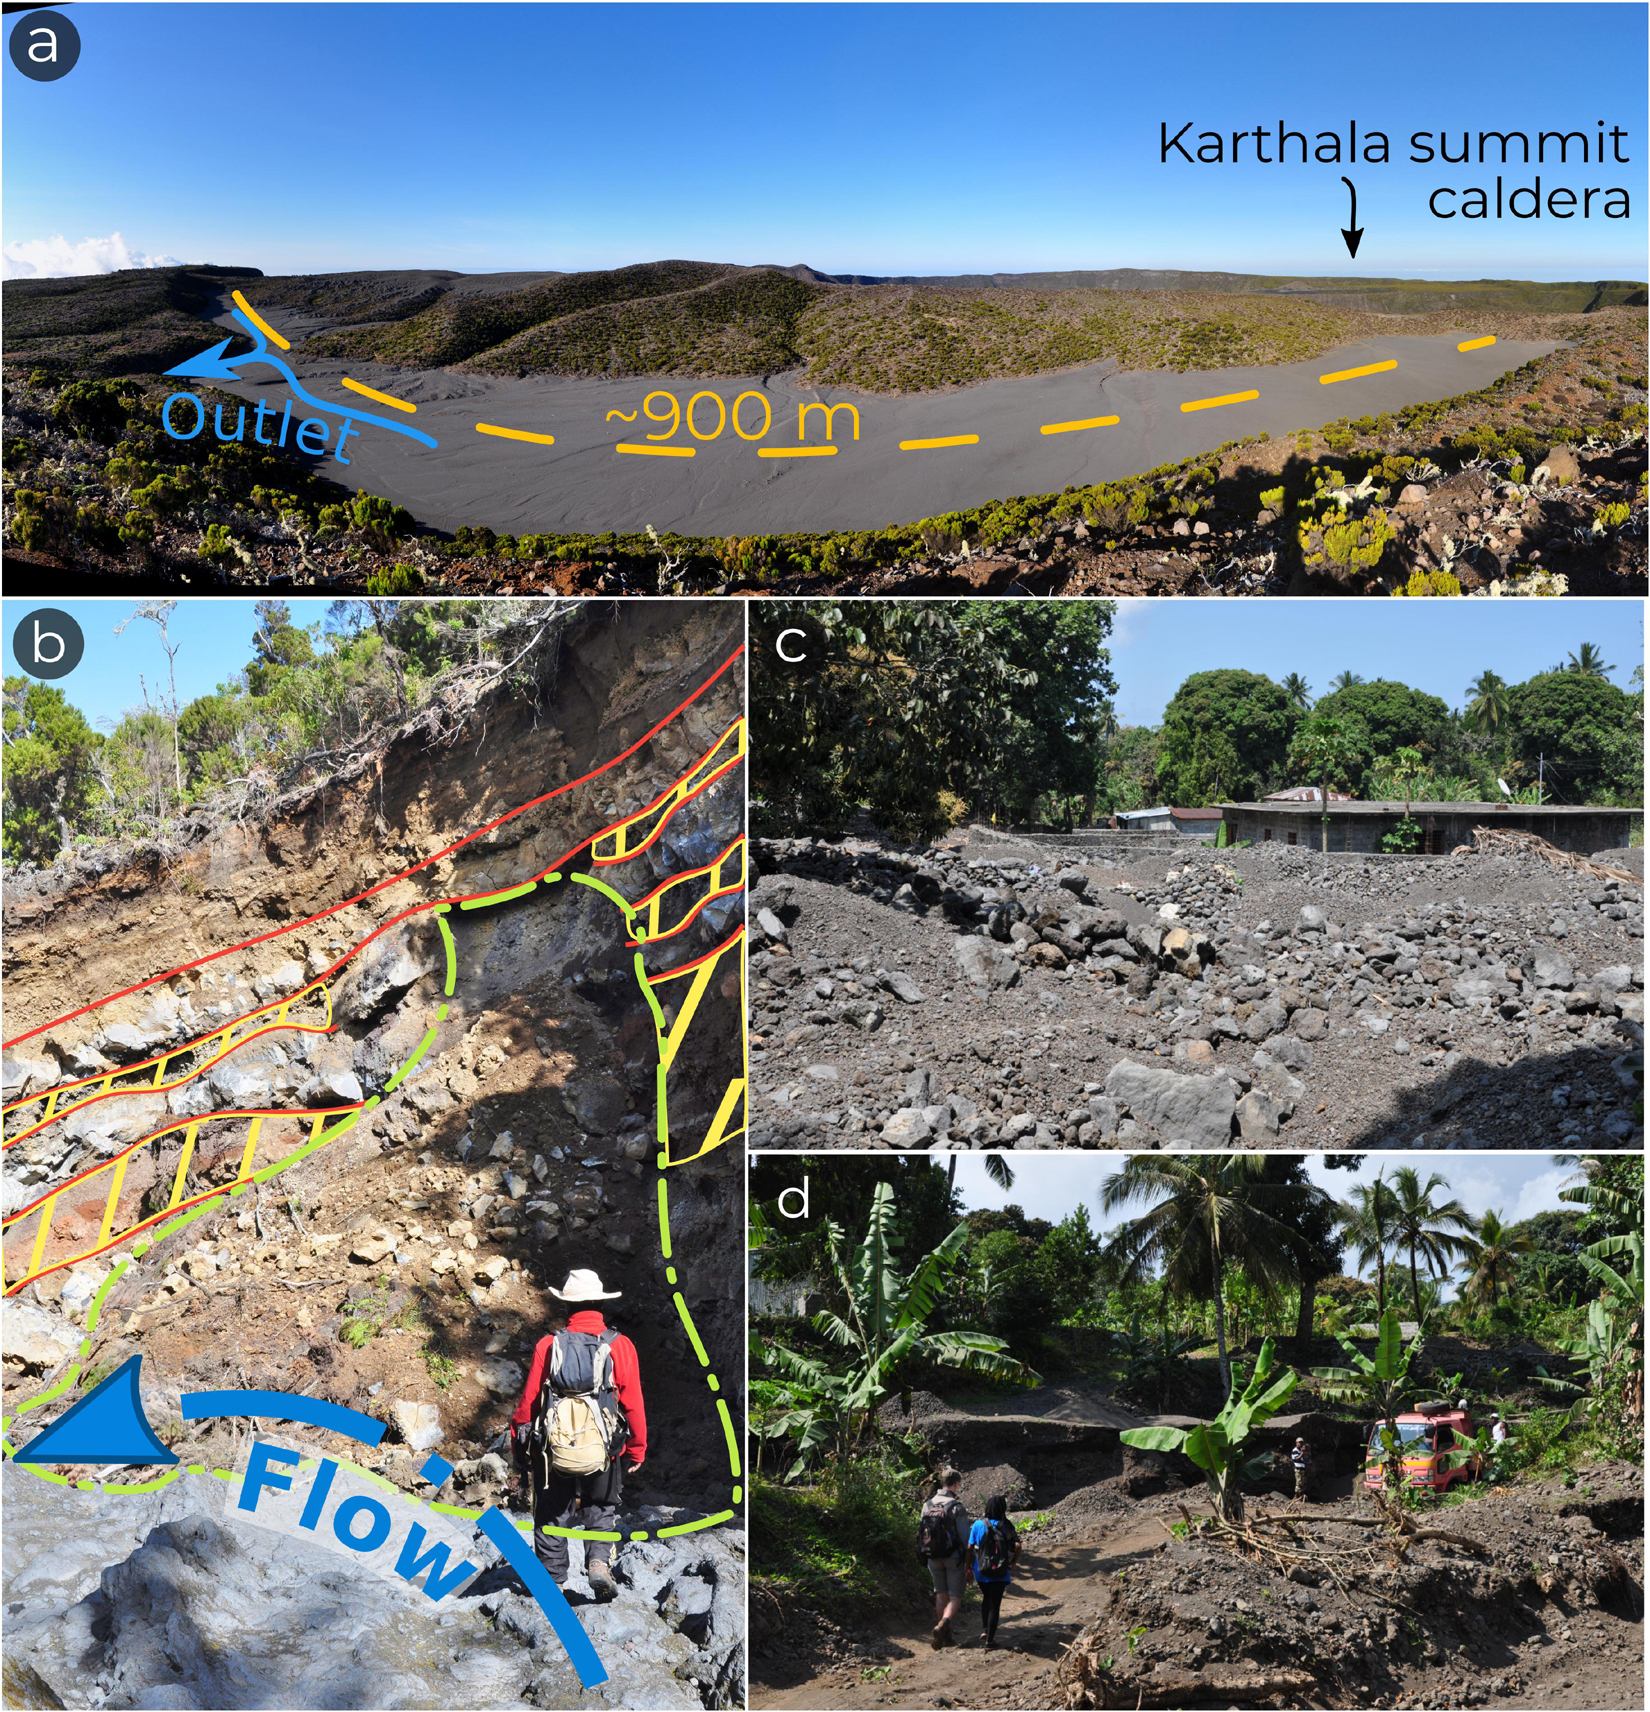
Figure 3. (a) Tephra accumulation zone at the edge of the caldera rim of Karthala (September 2015). The blue arrow represents the outlet of a ravine located on Karthala’ western flank. (b) Example of streambank collapse. Massive lava flow cores (outlined in red) are separated by weaker layers of scoriaceous rubble (yellow hatching). Once competent lava layers are damaged, the weaker underlying layers are easily undercut. Streambank may then collapse during large water discharge and produce debris with various sizes (up to 5 m), mainly made up from the more competent lava cores. Erosion processes can also take place in the ravine bed. Example of (c) boulder-supported and (d) fine-grained lahar deposits found at the foot of Karthala volcano. Notice the proximity of housing (built after the 2012 lahar events) and the use of the deposits as construction material.
Not all ravines reach the shoreline. Many exhibit significant reduction in depth or even total disappearance in the low-lying area after the concave break-in-slope at the foot of Karthala volcano (Figure 1). There, debris-fans represent most of the lahar deposits (Figures 3c,d). Most of these debris fans are occupied by settlements.
Description of the Flow Events
Ash fallouts associated with the two 2005 explosive eruptions damaged or killed Karthala summit vegetation (depending on the distance from the summit crater). Locally up to meters-thick, a fine ash blanket greatly modified the infiltration capacity of the soil through the formation of an impermeable crust. The combined effect of poor vegetation and decreased permeability increased runoff on the upper slopes of Karthala during heavy precipitation episodes. Surface runoff was able to erode the surface crust, conveying large quantities of loose volcanic material from the summit area by converging into the pre-existing ravines. The first lahars occurred in April 2005 and were described as relatively cohesive hyperconcentrated flows composed of 20–60% of fine to very fine ash (Morin, 2012). Following the limited reestablishment of the vegetation and the relative depletion of unconsolidated volcanic material over the summit area, the sediment concentration of the flows tended to decrease, particularly after 2008 when most of the flows could be considered as normal streamflow (Morin, 2012). However, the two largest and most destructive series of lahar events were experienced in April 2009 and April 2012. This last sequence was of unprecedented volume and debris content and led to significant damages over the densely inhabited south-west part of the island, disrupting the ecology and human activity in the area for months while destroying kilometers of roads and hundreds of houses (Direction Générale de la Sécurité Civile [DGSC], 2012; IFRC, 2013). The complete series of events (2005–2012) is not known due to the scarcity in archive sources, but at least ten sequences were documented (Supplementary Table 1).
Rainfall data could aid understanding of the formation processes of the observed lahar events. The quality of in situ precipitation measurements available (Agence nationale de l’Aviation Civile de la Métérologie [ANACM], 2015) is nevertheless inconsistent for the period of interest (2005–2012). Considering the quality of new global satellite precipitation measurements (e.g., Dezfuli et al., 2017; Skofronick-Jackson et al., 2017), we processed data from version 6 of the Integrated Multi-satellite Retrievals for Global Precipitation Measurement (IMERG; Huffman et al., 2019) to retrieve rainfall estimates (Supplementary Figure 2). We investigated the period 2001–2018 for two IMERG pixels located over the center and the western coastal area of Grande Comore Island. These measurements highlight the exceptional rainfall during the lahars of April 2009 and 2012. Respectively 145 and 290 mm of rain were recorded over the center of the island (i.e., Karthala volcano) on 6 and 7 April 2009. Surprisingly, the lahars were reported to have occurred on 15 and 16 April (Supplementary Table 1), nearly 10 days after this major rainfall event but coeval with a second, lower magnitude rainfall episode (150 mm in 2 days). The complete series of 10-day cumulative rain measured between 7 and 16 April 2009 shows values that are, by far, ranked as the highest for the 2001–2018 period. Precipitation was less concentrated in April 2012, with measured daily maxima up to 70 mm/day over the coastal area, and 50 mm/day over the center of the island. However, the 10-day cumulative precipitation series for the coastal area (up to 450 mm) is ranked as the highest for the period 2001–2018. During the 2012 event, lahars were reported to occur between 20 and 25 April. This suggests that the lahars occurred after 10 days of nearly continuous moderate to heavy rainfall.
Description of Flow Deposits
Most of the lahar deposits mapped over the two flanks were observed in the low-lying areas below the concave break-in-slope found at the foot of the volcano (Figure 4). There, a decrease in slope gradient and loss of confinement favored incremental infilling of the ravine channels by repetitive deposition from sediment-laden flows. The deposits mapped in September 2015 therefore integrate material from the recurrent sequences of small-scale secondary lahars that followed the 2005 eruptive phases. Yet, their outline probably best represents the April 2012 sequence, which was the last and largest recorded over the island. The mapped deposits cover an area of about 4.4 ± 0.5 km2 over the western flank of Karthala (Table 1) and 0.8 ± 0.1 km2 over the eastern flank.
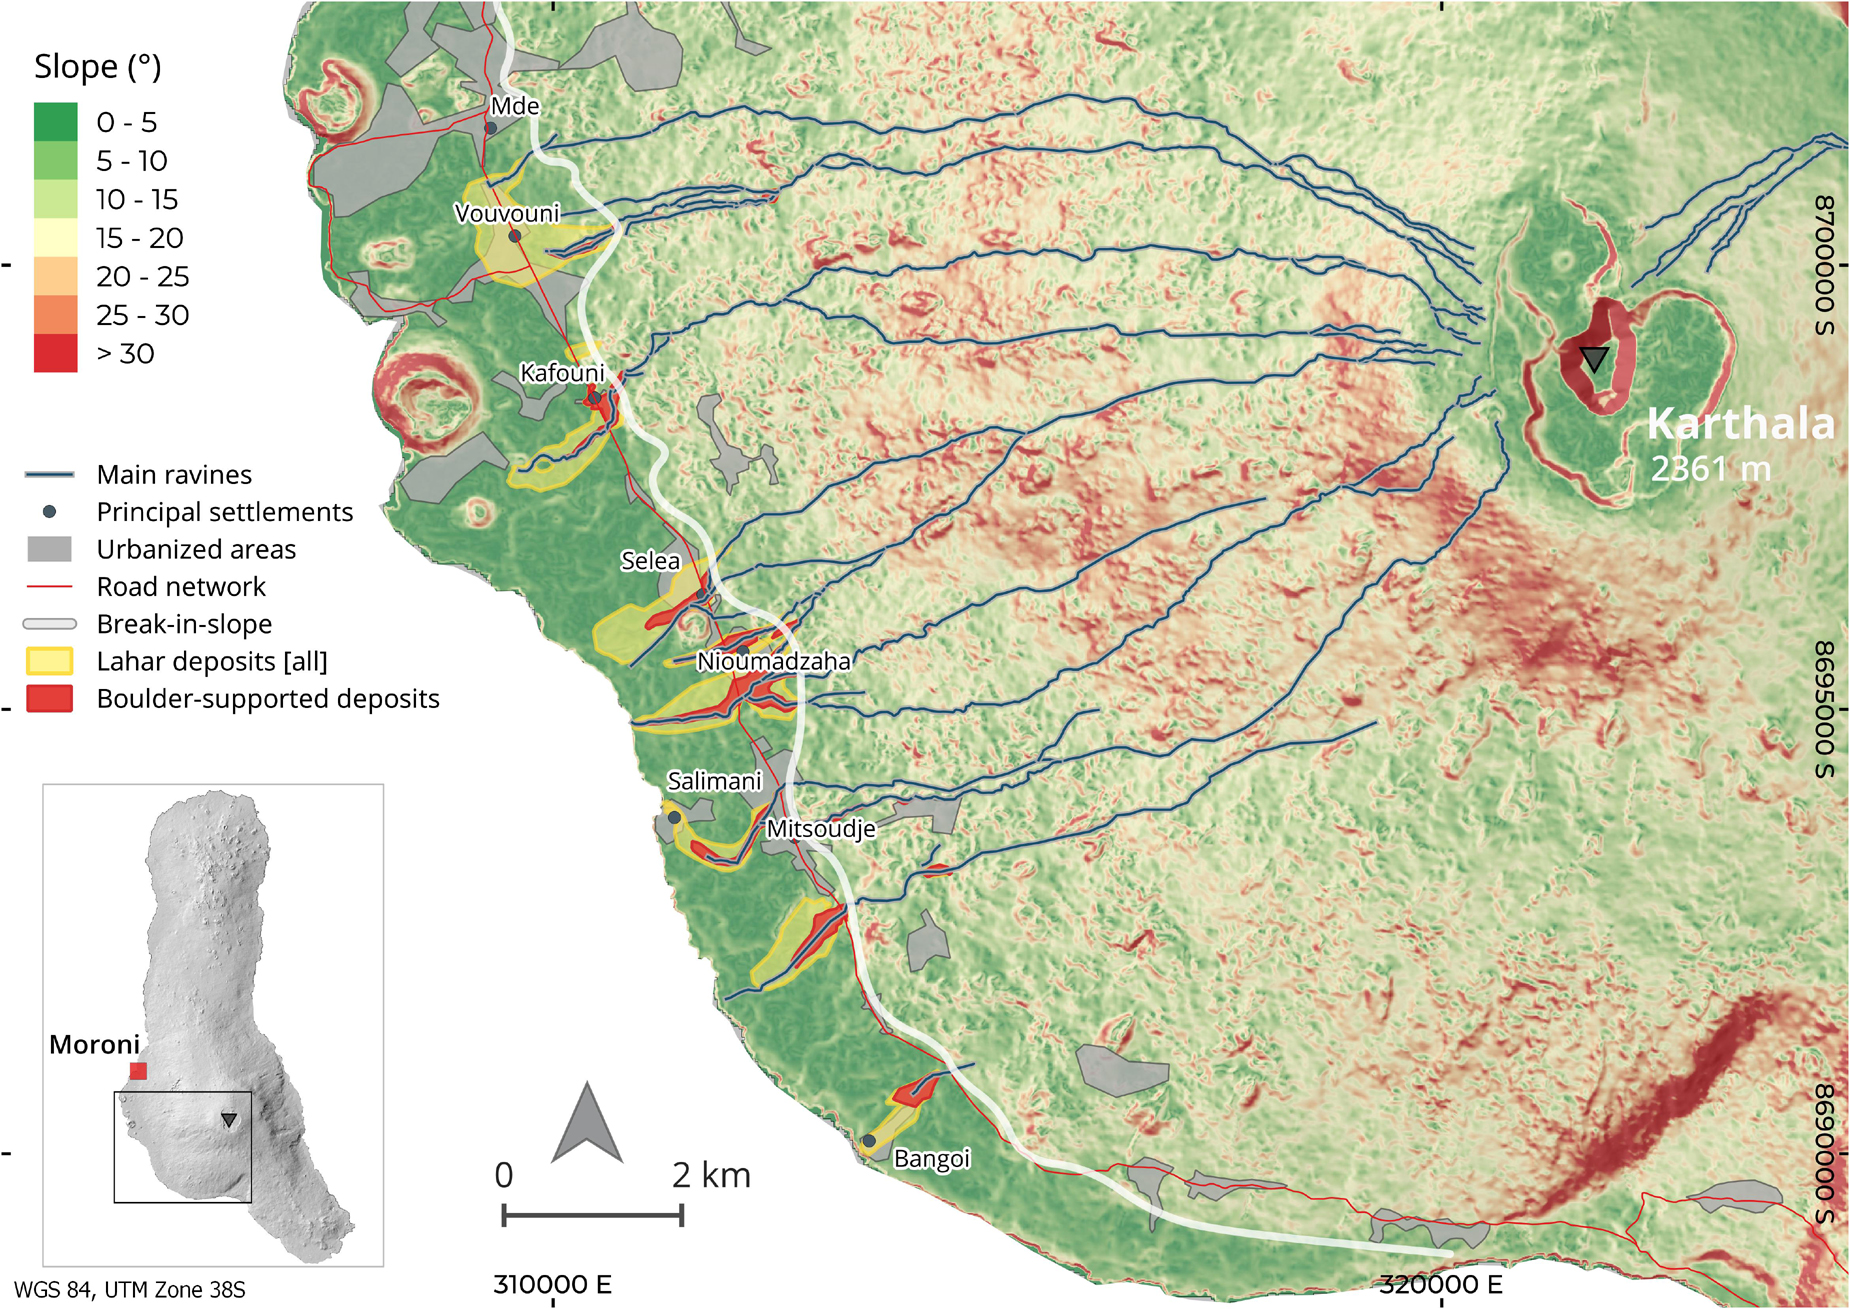
Figure 4. Extent of lahar deposits on the western flank of Karthala Volcano as mapped in the field in September 2015. The extent of zones characterized by boulder-supported deposits is highlighted in red. Notice the frequent overlaps between the settlements and the lahar deposits. The background slope map highlights the position of the break-in-slope. Sectors characterized by large boulder-supported deposits are observed at the foot of ravines crossing the steepest slopes.
As expected, lateral and distal thinning of deposit thicknesses and diminishing grain sizes are observed with increasing distance from the break-in-slope. Deposits found near the foot of Karthala are mostly composed of coarse clasts [angular to rounded boulders (0.25–2.0 m diameter) and large gravels] and poorly sorted sediment, sandy (and smaller) sediments being present in relatively low quantity (estimated < ∼30%, Figure 3c). Similar coarse clasts were found at all altitudes during the survey of the ravines suggesting that these clasts originate from scouring and undercutting of the ravine beds and streambanks. In total, about a quarter (1.2 ± 0.2 km2) of the area mapped over the western flank of Karthala is dominated by such bouldery deposits (Table 1). Farther downstream, the presence of large clasts decreases, and an overall more fine-grained matrix composed of coarse sand, sand and silt, is prevalent. These deposits were likely emplaced by low-concentration streamflow resulting from the dilution of hyperconcentrated flows (Lavigne and Thouret, 2003). Layering is observed, sometimes with an important change in the average clast size suggesting the occurrence of multiple deposition events. The composition of these sandy deposits is similar to that found on the summit area of Karthala and therefore probably represent eroded tephra-fall material associated to the 2005 eruptions.
From these observations, rough estimates of volcanic material volumes remobilized by the lahars can be estimated for each ravine. Assuming a typical thickness of 1 m for the zones dominated by boulders and 0.5 m for the remainder, debris volumes range from 3 ± 0.6 105 m3 to 7 ± 1.1 105 m3 for each individual ravine. By summing up, a total remobilized volume of 2.9 ± 0.5 106 m3 is estimated for all the ravines of the western flank of Karthala. This estimation yields a mean deposit depth of 0.6 m, which is coherent with field observations. Testimonies and our study of the deposits support that a large fraction of this total volume is associated with the April 2012 flows. Investigation of the lahar deposits also showed that the pattern and scale of lahars varied from catchment to catchment. Bouldery deposits are for instance mostly absent (Figure 3d) in the northern ravines that originate from the less steep catchments (Figure 4).
Numerical Modeling
Lahar Simulations
Figure 5 displays LaharZ and Q-LavHA simulations with the highest accuracies on the western flank of Karthala. Significant differences are observed in the general spatial pattern of the inundation areas provided by the two models. LaharZ exhibits a single flow unit for each ravine with ragged lateral limits offering binary discrimination between “affected” and “non-affected” zones. Q-LavHA, on the other hand, highlights the probability of inundation of every pixel of the area (DEM). It simulates bifurcations in the flow path and provides a relatively smoother (less ragged) edge of the extent of inundation compared to LaharZ. Comparison of the simulation outputs also shows discrepancies in the lateral extent of the upstream inundation area (before the break-in-slope). While it is kept within a few tens of meters with Q-LavHA, LaharZ simulates widths up to hundreds of meters. Field observations have shown that the actual flows were confined within the ravines over most of the channels’ lengths, with lateral overflows limited to a few dozens of meters width (<25 m) over the flatter slope sections. In the low-lying area following the break-in-slope, both codes capture the increase in the lateral extent of the inundation area expected from the loss of confinement and the general decrease of the slope, predicting inundation areas that roughly fit field observations.
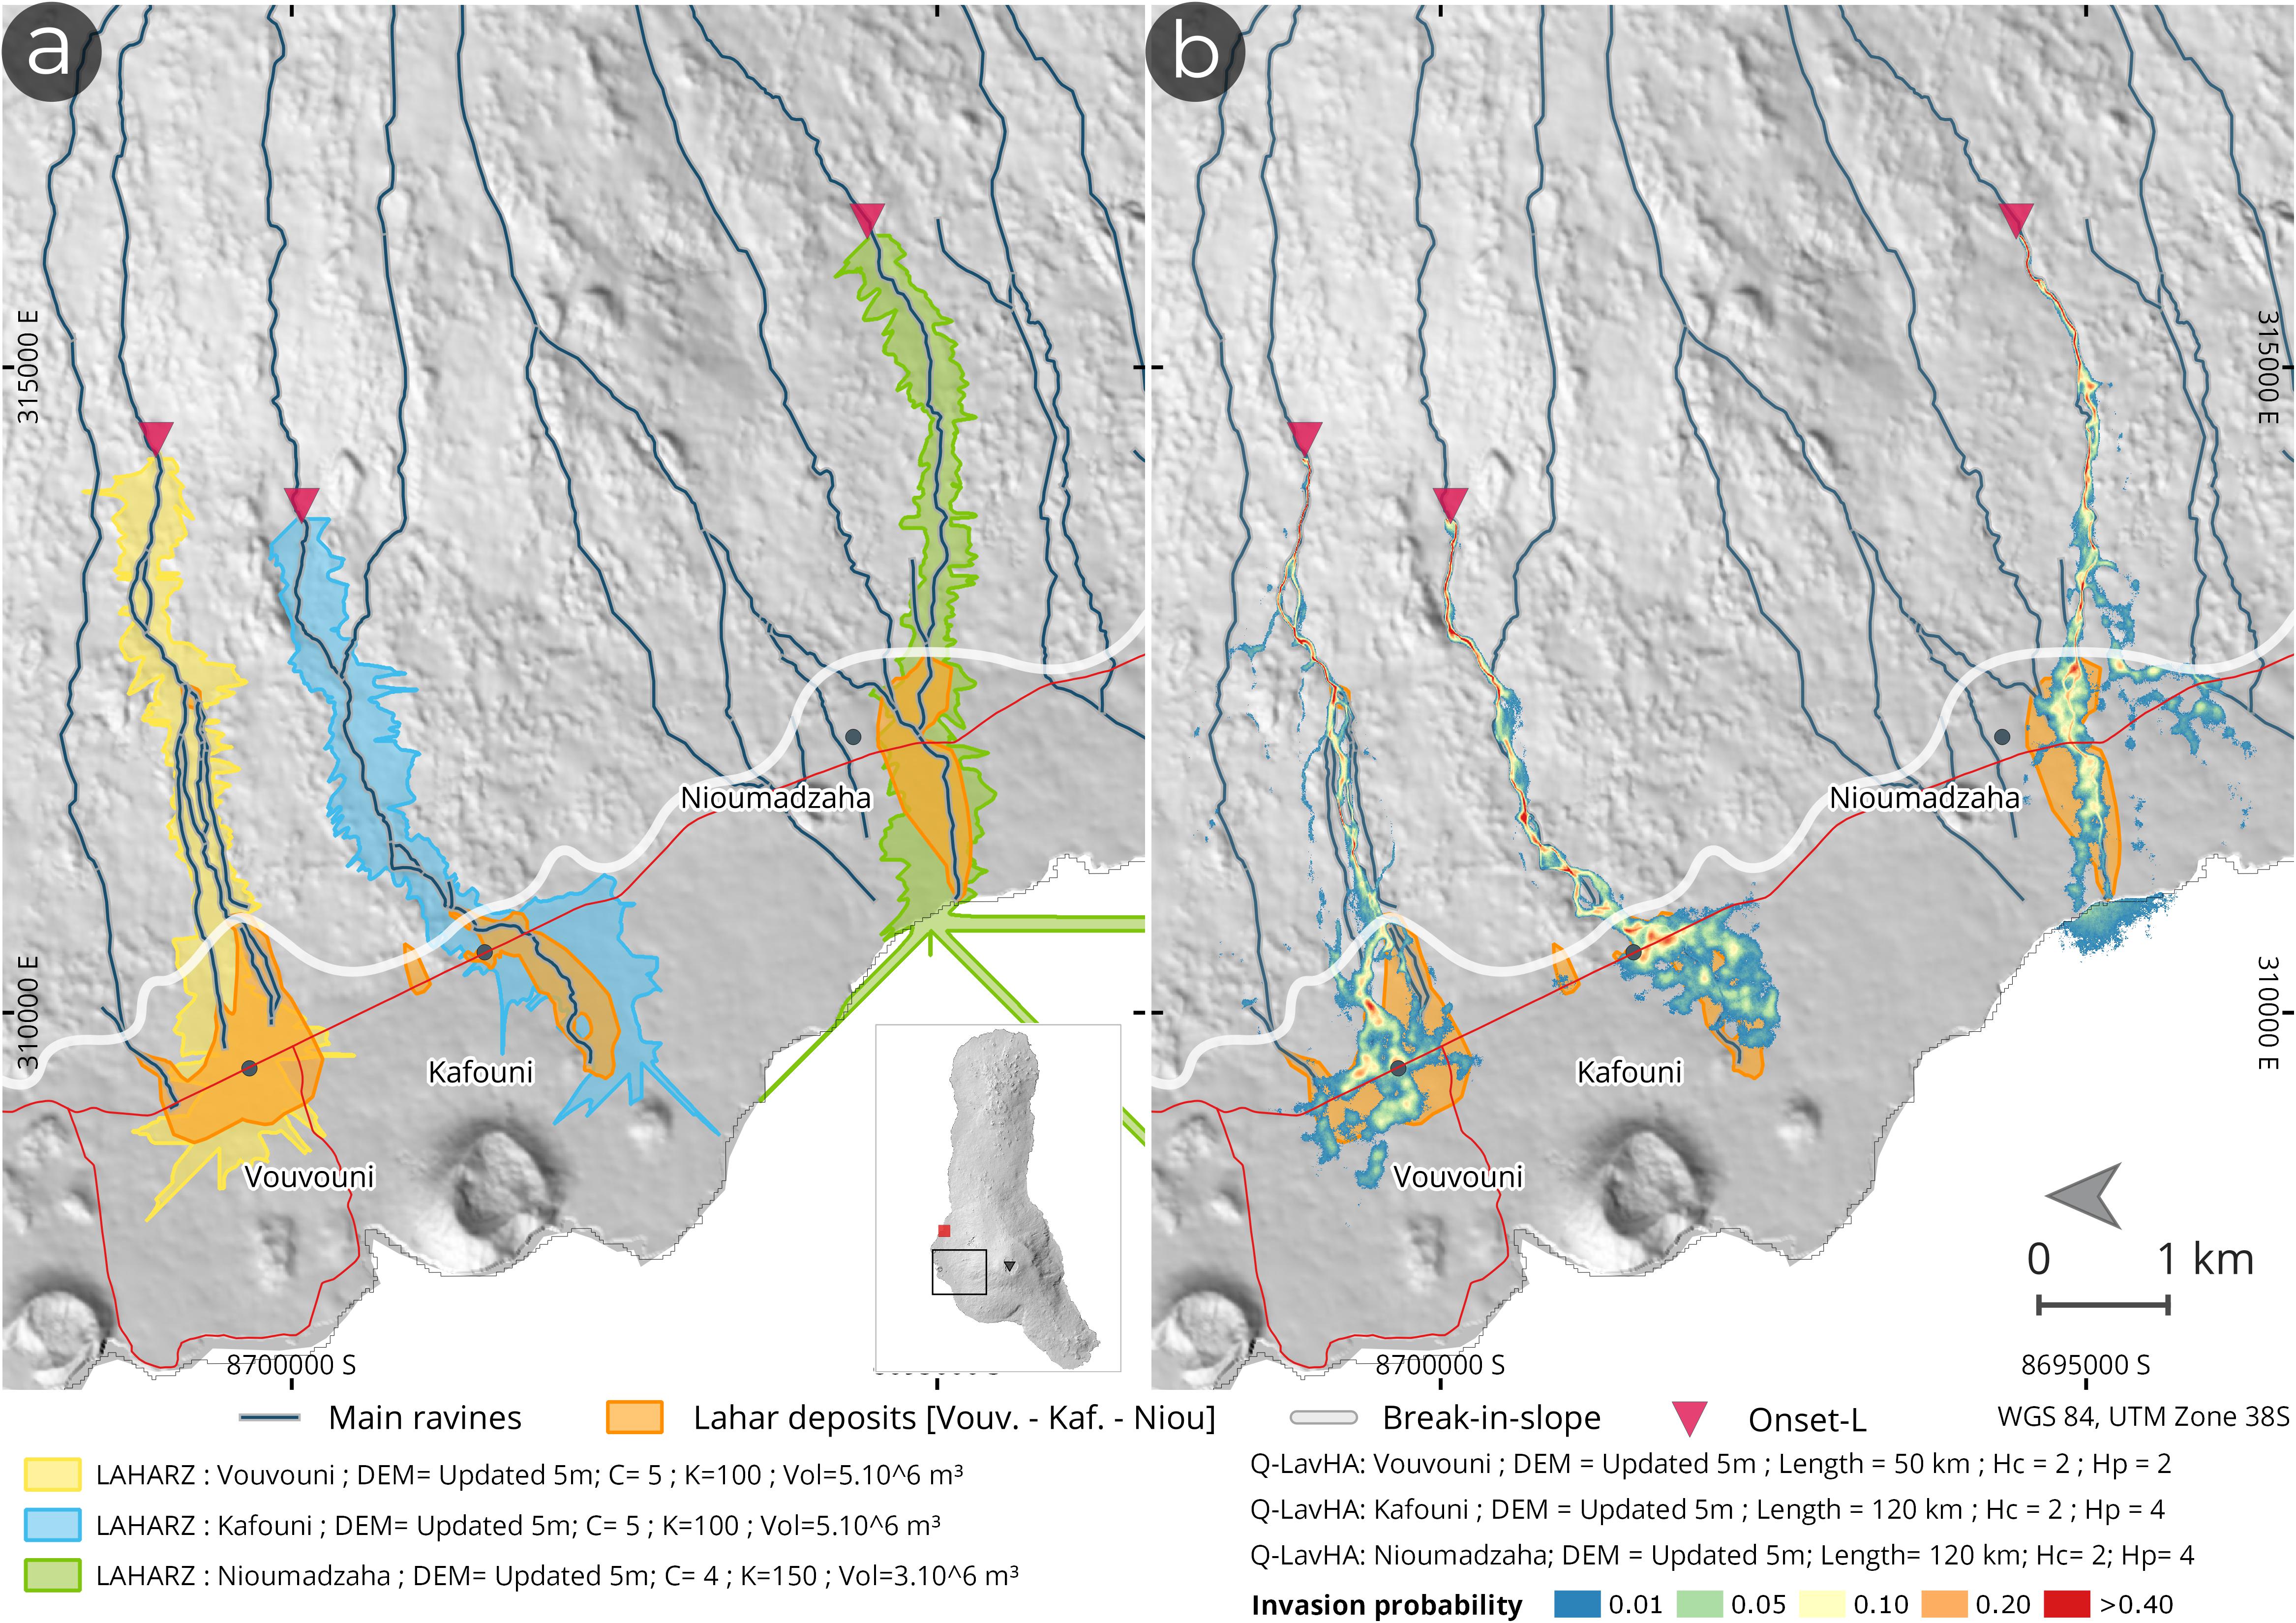
Figure 5. Lahar simulations on Karthala western flank with (a) LaharZ and (b) Q-LavHA. Simulations with the highest accuracies for the three ravines are shown. The inundation area modeled is compared to the extent of lahar deposits mapped in the field in September 2015 and indicated in orange. The triangles represent the locations of the onsets used for the simulation. All area having an invasion probability lower than 1% in Q-LavHA outputs were filtered out.
Overall, the calculated model accuracies are relatively low, with a median true positive (TP) below the break-in-slope for the three ravines of 0.40 with LaharZ and 0.37 with Q-LavHA (Table 2). Importantly, a generally higher fraction of false negative (FN) is observed with Q-LavHA (median value of 0.30 compared to 0.06 for LaharZ simulations). The location (elevation) chosen for the origin of the simulation greatly impacted the calculated accuracy of the outputs of both models. Except for one LaharZ simulation set over the northern ravine, the highest accuracies were always obtained with the lower simulation onset (Onset-L; see Supplementary Table 2).
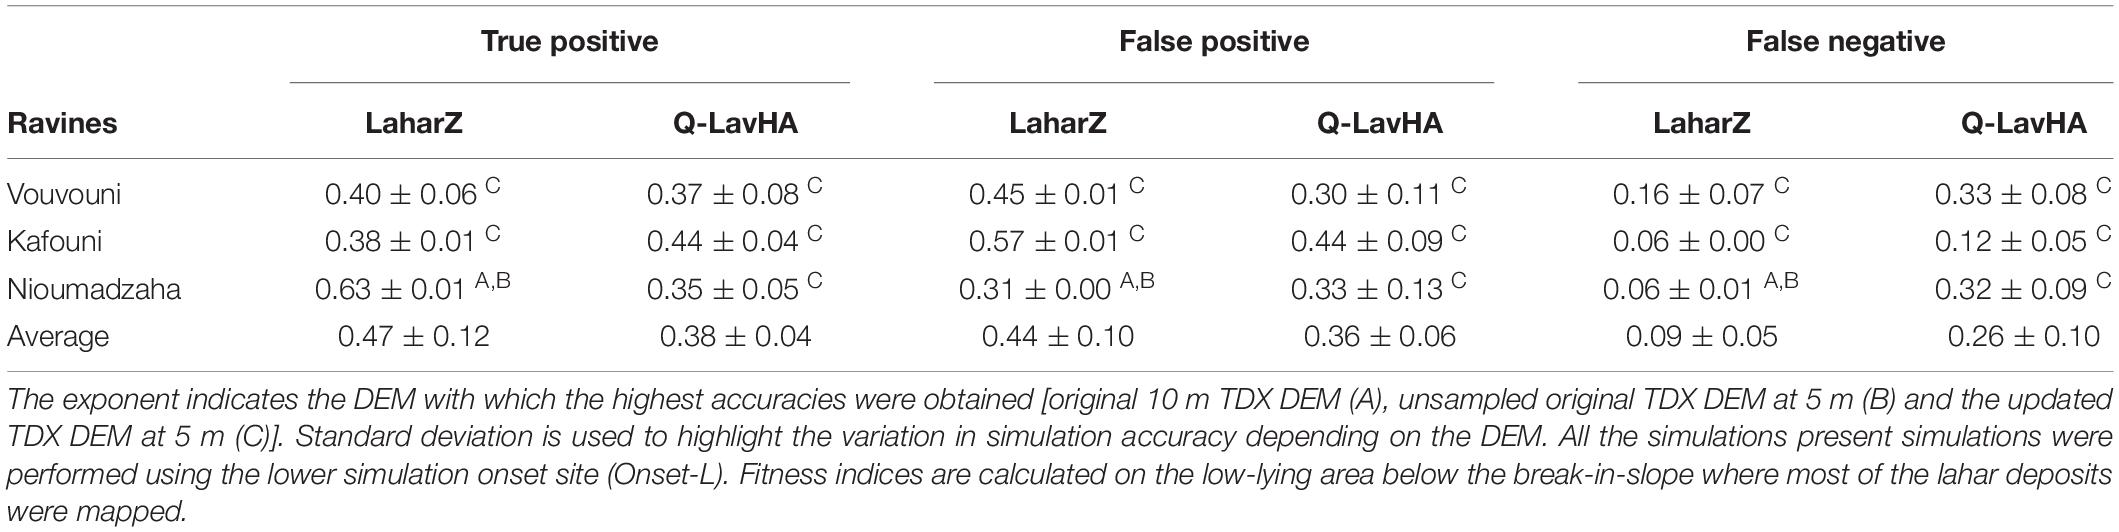
Table 2. Fitness indices for simulations with the highest accuracies obtained by LaharZ and Q-LavHA for the three different ravines.
Calibration procedure to obtain best-fit scenarios (most accurate simulations for each DEM, onset and ravine are shown in Supplementary Table 2) shows no significant variations of LaharZ simulation outputs with a modification of the C constant. The best-fit value for the planimetric coefficient K depends on the location of the simulation onsets. Simulations performed with a K value of 100 gave the most accurate results for simulations from Onset-L; while a K value of 200 provided the highest accuracies for simulation from Onset-H (Karthala summit). Simulation with volumes in the high spectrum of the range provided the highest accuracies (i.e., 3 × 10⁶ m3 − 5 × 10⁶ m3). For Q-LavHA, corrective factors providing the most accurate simulations were 2 m for Hc and 2–4 m for Hp in function of the ravine. These values seem appropriate in light of the maximum inundation depth reported by eyewitnesses in the villages affected by the lahars. Usually, very high runout length values (between 30 and 120 km) gave the most accurate simulations in Q-LavHA (Figure 5 and Supplementary Table 2).
Impact of DEM Update on Flow Simulations
The highest simulation accuracies were generally obtained with the use of the updated DEM (Figure 5 and Table 2). The modifications of the DEM impacted the flow trajectory (particularly for LaharZ), sometimes allowing for the correct identification of the hazard prone-position of settlements otherwise missed with the use of the original DEM. However, the implementation of an accurate drainage system into the DEM did not fully prevent flow simulations from bifurcating to ravines that correspond to another catchment.
Figure 6 displays averaged quality indices over the three ravines using distinct DEMs. Comparison of the fitness indices for the different simulations shows slight improvements for LaharZ and more significant changes with Q-LavHA. On average over the three ravines, the true positives (TP) increased for the two models, from 1 to 10% with LaharZ and from 13 to 77% with Q-LavHA. False negative (FN) values, on the other hand, decreased 7–40% with LaharZ, but increased up to 120% for Q-LavHA in comparison to the use of the original DEM. This increase of false negatives with Q-LavHA simulations is reduced when compared to the upsampled original DEM (Figure 6).
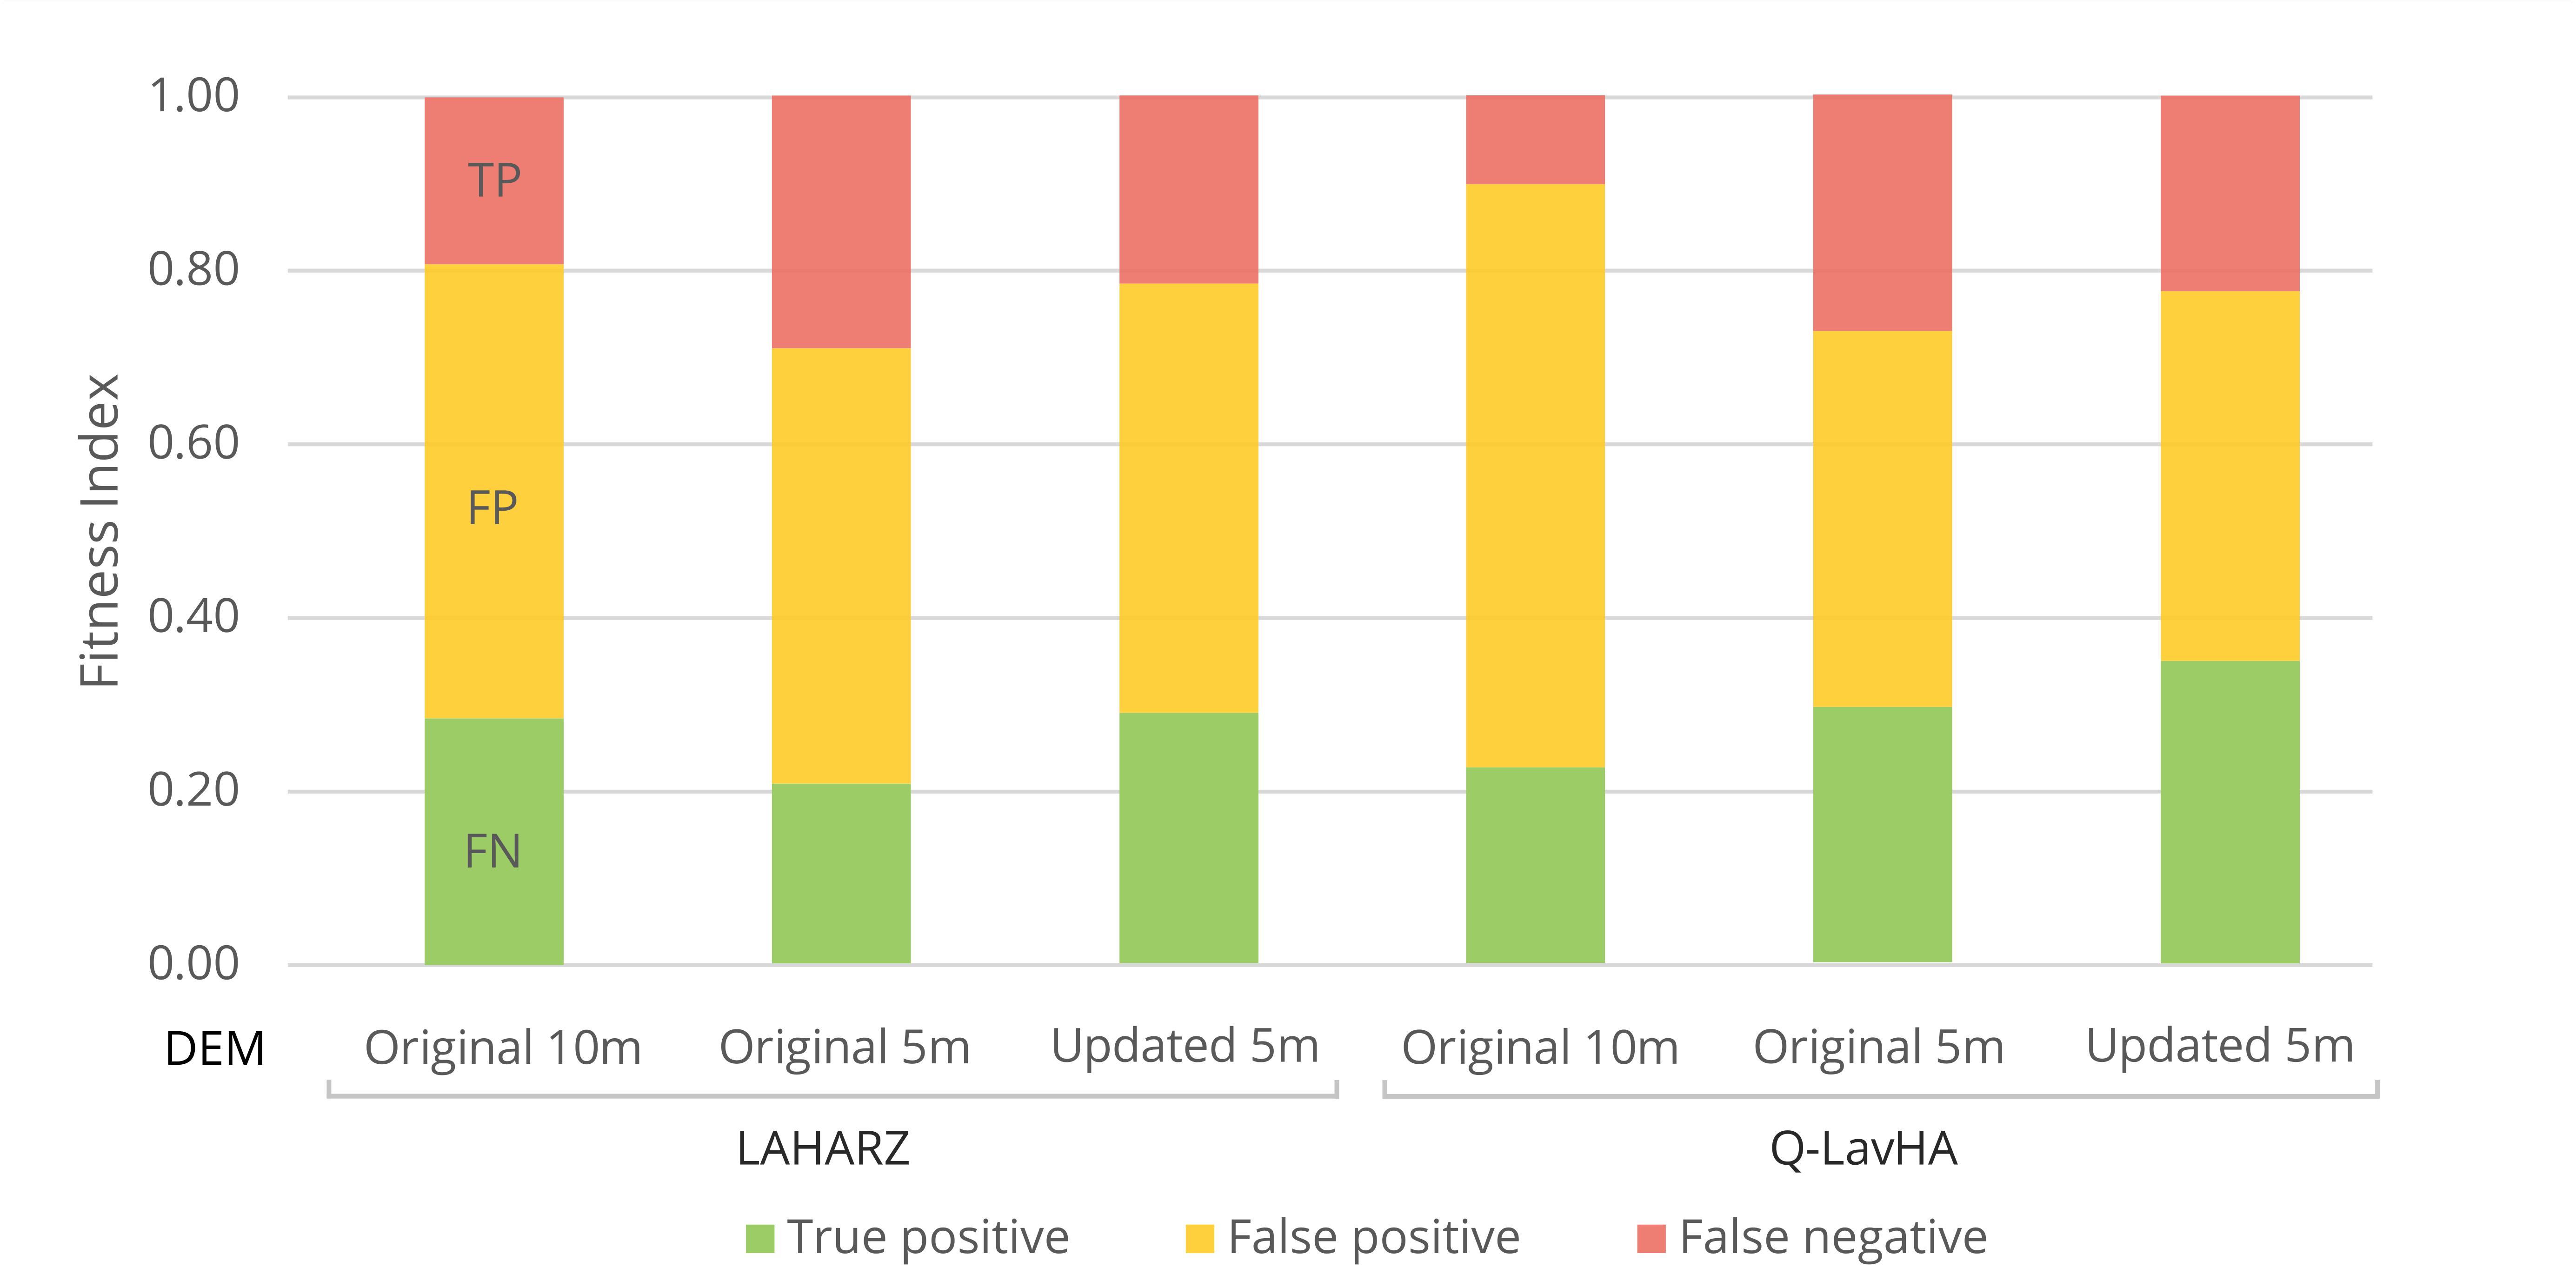
Figure 6. Averaged accuracy indices for simulations using different DEMs for LaharZ (left) and Q-LavHA (right). These indices show the average for results of simulations with an origin located at both onsets (H and L). The use of the updated DEM does not provide significant improvements in LaharZ simulation accuracies. With Q-LavHA, it allows for an important increase of the true positives (TP), which, however, comes at the expense of a rise in false negatives (FN) due to the increased simulation resolution.
Discussion
Lahars Following the 2005 Karthala Eruption
Destruction of vegetation and loss of infiltration capacity by deposition of a meter-thick ash blanket greatly increased surface runoff at the summit of Karthala. Since the summit also represents the origin of most of the ravines draining the flanks of the volcano, it is not surprising that these changes provoked important disturbances to the drainage dynamics. The geomorphic responses included an increase in the frequency, magnitude and spatial extent of seasonal floods, adjustments of the ravine morphology and a strong rise in sediment yield. While common for the aftermath of explosive volcanic eruptions (e.g., Pierson and Major, 2014; Jones et al., 2017), this is unusual for basaltic shield volcanoes. It was here made possible by the deposition of fine ash associated with two phreatic eruptions in 2005, as well as the relative steep flanks and very high rainfall intensity around the volcano summit. Altogether, the documented series of sediment-laden flows are considered as secondary lahars such as defined by Vallance (2000) and Pierson (2005). The study of lahar deposits and eyewitness testimonies illustrate both variations in total discharge volume and sediment concentration across different lahar sequences. Overall, flow magnitudes were probably constrained by catchment characteristics (small and densely vegetated), with recurrent formation of small-scale secondary lahars having volumes of about 104–105 m3 and peak discharges in the order of a few 10 m3/s.
Material from both the volcano summit and ravine channels was found in the aggradation zones over the coastal area, illustrating that flow sediment concentration and mean particle size were increased by bulking. This process led to significant channel and bank erosion upstream of the break-in-slope and incremental infilling of the ravine channels downstream. Incremental filling promoted further reductions of the conveyance capacities of the lower channel reaches, facilitating overflow and the emplacement of large quantities of sediments over adjacent low-lying slopes. This process was certainly favored by the relatively small scale of the ravines in a context of absence of perennial streams. The locations of the villages, almost all located near the break-in-slope, situate them in this zone of overflow. The local socio-economic conditions also made the inhabitants highly vulnerable by preventing mitigation measures from being implemented (Morin et al., 2009; Direction Générale de la Sécurité Civile [DGSC], 2012; Mossoux et al., 2018, 2019). Reestablishment of channel conveyance capacity between flow sequences and channelizing flows through construction of dykes are measures that otherwise could have reduced the impact of recurring flow sequences (Blong, 2000; Pierson, 2005). However, it must be underscored that the lahars have initially not only been considered a threat by the inhabitants but also as an economic opportunity in the form of extractable construction materials their deposits offer (Morin et al., 2009).
A decrease in sediment concentration with time after tephra deposition is rather common for secondary lahars. It is commonly associated with depletion in erodible material and re-establishment of vegetation (e.g., Vallance and Iverson, 2015; Major et al., 2016). However, the largest lahars on Karthala occurred in April 2009 and 2012, respectively, 4 and 7 years after the initial tephra emplacement. The 2012 lahar sequence also accounts for most of the debris deposits found at the foot of Karthala, reflecting its unprecedented volume and debris content. The absence of perennial flows on the flanks of the volcano strongly couple flow discharge with precipitations intensity, causing large variations in flow competence from one flow to another. We therefore suggest that, if most small-scale events probably had the capacity to trigger bank and bed erosion, many may have had insufficient competence to transport the largest scoured clasts downstream. This material would ultimately be transported by larger-scale events which would thus have unusually high solid load. This may explain the 4–7 years offset between the volcanic eruptions and the occurrence of the largest lahars (that were associated with exceptional rainfalls (section “Description of the Flow Events”). At the daily scale, the apparent delay between the onset of intense rainfall episodes and the timing of the documented lahars [occurring after a few days of important precipitations for both April 2009 and 2012 (Supplementary Figure 2)] is difficult to explain. A 1- or 2-day(s) offset may be associated with uncertainty in the (incomplete) testimonies documented, but up to a 10 days offset is recorded in April 2009. An explanation may lie in the high permeability of volcanic material (when not cover by fine ash), that could accommodate first rains through infiltration, while prolonged rainfall would lead to saturation and high surface runoff. Whether the small overall transport capacity of the ravines could in addition be responsible for a relatively “slow” erosion and transport of material downstream remains to be understood. Although no clear evidence has been found in the field, another explanation may lie in the occurrence of landslides on the tephra-covered forested hillslopes. The time needed to the ground to saturate and pore water pressure to rise to a level potentially triggering slope failure would in this case explain the apparent delay (Korup et al., 2019).
No lahars have occurred since April 2012, suggesting that infiltration capacity and quantity of easily mobilized volcanic material have returned to normal, decreasing the probability of lahar events. However, our study helps understanding the effect potential future (mildly) explosive eruptions may have to renew the conditions for the occurrence of similar new lahar events.
Modeling of Lahars
Flow modeling commonly aims for the delineation of potential lahar extent to evaluate the hazard exposure of assets such as settlements or infrastructure (Rodolfo, 2000; Huggel et al., 2008; Anderson et al., 2016). Our simulations benefited from the collection and integration of extensive field measurements and observations allowing calibration of mass flow model input parameters and evaluation of the output accuracies. As shown, however, none of the simulations performed here captured the full spatial pattern of the documented flood areas. Apparently restricted both by the relative small scale of the lahars (that e.g., changes relationships between volume, cross-sectional and planimetric inundation area compared to large-volume lahars; Schilling, 2014) and by the complex topographic settings (smooth topography with unclear drainage pattern that leads to errors in the simulation of the flow path), the proportion of false negatives in simulation outputs is never negligible (from 0.06 to 0.16 for LaharZ and 0.12 to 0.33 for Q-LavHA). False positive (overestimation), however, commonly represents the largest proportion of the modeled inundation area (Figure 6). Such a high proportion of false negative is a major flaw for the effective use of simulation outputs in risk management. While simulations often represent a key aspect of lahar hazard assessment – especially in the rather common circumstances where no direct field observations of previous events are available – these results demonstrate the need for careful investigation and evaluation of simulation outputs before their dissemination. We expect that similar simulations on a rougher topography (e.g., at a stratovolcano, where ravines are commonly deeply incised in the volcano edifice) would obtain higher accuracies (e.g., Castruccio and Clavero, 2015; Charbonnier et al., 2018). Our study therefore highlights a limiting case in the use of numerical models for lahar hazard assessment where reliable, detailed input data lack.
The ash blanket emplaced by the 2005 eruptive sequence at Karthala volcano has been largely depleted over the past decade. Future phreatic eruptions may nevertheless emplace new tephra material, after which renewed periods of increased lahar hazard may be expected. In this perspective, our calibration data and study of models limitations provides insights to better evaluate future lahar hazard, key for improving the risk mitigation strategies on this highly populated volcanic island (Mossoux et al., 2018).
Comparison of Flow Models
This study also aimed to investigate the relevance of Q-LavHA for numerical modeling of lahars and compare it to the widely used LaharZ code. Important disparities between the simulated and affected areas are observed with both models, but LaharZ generally achieves higher simulation accuracies than Q-LavHA. Fitness indices and visual investigation of the outputs show that LaharZ is able to both limit the underestimated area (FN) and constrain overestimation of the inundated area (FP) after the break-in-slope. Q-LavHA, on the other hand, has a stronger tendency to underestimate the area affected by the flow (higher FN).
Our results also illustrate the difference in the type of model outputs, with a probability of inundation of each individual grid cell calculated by Q-LavHA to be compared to the planimetric inundation area for given flow volumes in LaharZ. Consideration of volumes in LaharZ allows investigating multiple hazard scenarios with a gradation of their likelihood. It however also comes with the disadvantage of a binary discrimination between “safe/unsafe” zones which may reinforce the misperception of the hazard map as absolute, while Q-LavHA offers the possibility of constructing probabilistic hazard maps which are found to be usually better suited for communication with and between local stakeholders (e.g., Zerger, 2002; Smemoe et al., 2007; Darnell et al., 2012; Thompson et al., 2015). Note, however, that the volumes needed in LaharZ to obtain the most accurate simulation outputs were unrealistically high (usually 3 × 10⁶ to 5 × 10⁶ m3) in comparison to the documented flows (3 ± 0.6 105 – 1 ± 0.2 106 m3).
Commonly highlighted LaharZ drawbacks include its sensitivity to the vertical accuracy of the DEM and the unrealistic shape of the modeled inundation zones, noticeable as jagged edges of the simulation results (e.g., Huggel et al., 2008; Castruccio and Clavero, 2015). Placing the simulation onsets at the foot of the Proximal Hazard Zone Boundary (PHZB) in a study area deprived of a clear drainage pattern implies that the different catchments have to be accurately delineated in advance. As shown in this study, the origin of the ravines may, however, be difficult to define in certain environments. When considering localized drainage disturbance, this can lead to confusion in the zonation of the future hazard. Another highlighted limitation of LaharZ is its impossibility to simulate a bifurcation of the flow path, despite its importance for simulations over gentle terrains and complex topographies (e.g., Darnell et al., 2012).
Q-LavHA overall simulation accuracies are lower than those of LaharZ, the first being regularly penalized by higher false negative. Q-LavHA has, however, features that allow getting around some limitations of LaharZ. Besides its ability to simulate flow path bifurcations, Q-LavHA generally offers a better distinction between channelized and unconfined flow zones. This characteristic is important over gently-sloping terrains. Another advantage is the high sensitivity of Q-LavHA to small topographic features, that can be fine-tuned by the use of the corrective factors (Hc and Hp). On the other hand, the absence of implemented relations between initial flow volume and potential runout length yield the need for a manual calibration with historic events or inundation scenarios. While for the sake of hazard zone delineation on volcanic islands a choice for selecting run-out distances that allow the simulated flows to reach the shoreline may be valid, it may be trickier for other environments, in particular in absence of historic events. The unrealistically high run-out length values needed in our simulations (up to 130 km while the maximal ravine length is 14 km) is a common flaw of iterative probabilistic flow models (Mossoux et al., 2016). These models being built from iterations of single flow lines, the higher the resolution, the less direct and more meandering, and thus longer, a flow line is before it reaches the actual physical head of the simulated flow. As an alternative to the use of maximal runout distance in Q-LavHA, an estimation of the lahar mobility could potentially be implemented by parameterizing a coefficient of friction along its flow path, such as proposed in the Modified Single Flow Model (MSF; Huggel et al., 2003). Such coefficient could be approximated using the Heim Coefficient, which is simply a measure of the tangent of the mean slope from the top of the source area to the most distal part of the flow (Charbonnier et al., 2018).
Finally, both models assume that lahars flow from a fixed and unique source and all at once. This assumption is not completely valid for lahars. Indeed, the incorporation of material through bulking and debulking processes and water integration from tributaries has to be considered. Both may lead to important volume changes along the flow path (Vallance and Iverson, 2015). The potential for repetition of lahar events is neither taken into account, while, as shown for Karthala, it may greatly affect the impacted zone due to incremental infilling of the channels with material deposits. Models that incorporate channel infilling, volume and concentration changes as well as bulking along the flow path (such as investigated by Fagents and Baloga, 2006; Castruccio and Clavero, 2015; Reid et al., 2016) are considered as particularly promising (Doyle et al., 2011).
Influence of DEM Modifications: Pertinence and Limitations
Despite its high original resolution, the 10 m TDX DEM incompletely represents the drainage system and ultimately leads to errors in the simulation of the lahar-prone areas. We suggest that those uncertainties were not associated with the intrinsic qualities of the DEM, but rather with the characteristics of the volcanic edifice. Karthala is a representative example of a young basaltic shield volcano not yet heavily dissected by erosion (Bachèlery et al., 2016). Its flank topography is therefore relatively smooth, with the presence of only few, low relief topographic features and no well-defined valleys. In addition, the dense and persistent forest canopy conceals large sections of Karthala’s small-dimension ravines, making their identification difficult for the X-Band SAR sensor used for DEM creation (i.e., X-Band SAR has low vegetation penetrating capabilities, e.g., Dzurisin and Lu, 2006). These characteristics are less common on stratovolcanoes – where the topography is usually dominated by deeply incised valleys. The smooth topography and tropical forest make the simulation of flow trajectories on tropical shield volcanoes more subject to errors, in turn reducing the accuracy of hazard-zone delineations. Similar limitations were highlighted with LaharZ at other tropical volcanoes, motivating the design of our study (Muñoz-Salinas et al., 2009; Deng et al., 2019).
The implementation of detailed channel geometries into the DEM generally improved the delineation of lahar flow paths, and ultimately of modeled inundation areas. Small changes in the terrain morphology are known to modify the drainage course (Stevens et al., 2003; Hubbard et al., 2007; Schneider et al., 2008). The consequences of such hydrographic errors may be that the model misses the hazard-prone position of settlements actually affected by the hazard. This was especially noticeable in simulations initiating from source areas close to Karthala’s summit. Changes in DEM particularly impacted Q-LavHA simulation results. In these simulations, the highest accuracies were obtained using an updated 5 m DEM in which channel geometries were edited. However, the change in DEM resolution (upsampling from 10 to 5 m) itself had a strong influence on the simulation outputs. Q-LavHA is known to be sensitive to differences in DEM resolution (Mossoux et al., 2016) and our results highlight that a careful selection of the DEM resolution is essential to ensure the most accurate simulations. Although the implementation of the drainage network within the DEM led to a clear increase in true positives, the upsampling strongly reduced the overall inundation area, ultimately leading to an increase of the false negatives. In our case, the small spatial scale of the ravines did not allow the use of an updated DEM with a lower spatial resolution, but it should be considered bearing in mind the size of the ravine.
Overall, our results highlight the importance of accurate terrain representation in the context of hazard assessment, as well as the differences in model sensitivity to the DEM quality and resolution (e.g., Davila et al., 2007; Hubbard et al., 2007; Huggel et al., 2008; Darnell et al., 2010, 2013). Updates of DEMs generally yield improved lahar simulation accuracies and could be considered in similar environments with unclear drainage systems such as other undissected basaltic shields or flat alluvial plains.
Conclusion
This study aims to gain insights in the recurrent formation of small-scale secondary lahars subsequent to the basaltic phreatic eruptions of Karthala volcano in 2005. Emplacement of unconsolidated volcanic material and damages to the summit vegetation caused important disturbances to water infiltration and drainage, ultimately leading to the repetitive formation of lahars on the flanks of the volcano. Exceptional rainfall events triggered the occurrence of the two largest lahar sequences in 2009 and 2012. The complete sequence of flows repetitively affected thousands of inhabitants living in settlements located at the foot of Karthala, becoming one of the primary hazards associated with the volcano. Our analysis allowed defining these flows as small-scale (volumes ≤ 105 m3), rain-triggered and predominantly low sediment concentration lahars.
Field measurements served to calibrate and compare numerical lahar simulations from the widely used LaharZ model with results from Q-LavHA, but were hindered by the time lag of several years between the occurrence of the events (2005–2012) and the field observations (2015). Our model comparison demonstrates that LaharZ outperforms Q-LavHA for small-scale lahar simulations. While Q-LavHA has features that mitigate some limitations of LaharZ, such as its ability to simulate flow bifurcations and the transition from constrained to unconstrained flow, it typically yielded lower simulation accuracies compared to LaharZ simulations (true positive values of 0.38 ± 0.04 vs. 0.47 ± 0.12). Such values represent a rather poor performance for both models compared to existing studies on larger-volume lahars. While the relatively small scale of Karthala lahars certainly played a role – e.g., by changing relationships between volume, cross sectional and planimetric inundation area compared to larger lahars – our results indicate the lower simulation accuracies to mostly result from errors arising from difficulties in delineating lahar flow trajectories on the smooth, poorly eroded topography of the volcanic edifice. Both models encountered difficulties delineating lahar flow paths. We showed that using a DEM updated on a small spatial scale with detailed channel topography can lead to improved simulations with both models (increased true positive values of 1–10% for LaharZ and 13–77% for Q-LavHA simulations). This approach did not fully prevent simulations to sometimes miss the hazard-prone position of settlements which were actually affected by the hazard. Whereas we illustrate how the simulations can benefit from the integration of field observations, the rather poor performance of both simulation strategies demonstrates the need for careful investigation and evaluation of simulation outputs before their dissemination.
Although small flood events occurred in 2016, no lahars have occurred on Karthala since. The regrowth of vegetation on the upper flank of Karthala as well as the decline in the quantity of volcanic material which can potentially be mobilized decreases the occurrence probability of such lahar sequences. However, new (mildly) explosive eruption(s) may occur in the future. In this perspective, our study of the lahars that followed the 2005 eruptions, as well as our calibration data and study of models limitations, provides insights to better evaluate future lahar hazard, key for improving the risk mitigation strategies on this highly populated volcanic island (Mossoux et al., 2018). Our results indicate that accurate topographic representations and detailed documentation of spatial extent of the impacted area and lahar deposit thickness are essential to produce accurate lahar simulations, as well as the further adaptation of existing numerical simulation tools to better suit these particular environmental settings.
Data Availability Statement
The datasets generated for this study are available on request to the corresponding author.
Author Contributions
AD, SP, and MK conceived and designed the study. AD ran the simulations and analyzed the results. AD wrote the manuscript, with main inputs from MK, SP, and SM. AD, HS, and SP participated in the field data acquisition. All authors contributed to the final version of the manuscript.
Funding
AD was supported by the Belgian Science Policy Office (BELSPO) for RESIST (SR/00/305), MODUS (SR/00/358) and AfReSlide (BR/121/A2/AfReSlide) research projects (http://resist.africamuseum.be/, http://afreslide.africamuseum.be/). SP was financially supported by the Vocatio grant for field work on Karthala, and the FWO-Flanders Ph.D. Aspirant fellowship.
Conflict of Interest
The authors declare that the research was conducted in the absence of any commercial or financial relationships that could be construed as a potential conflict of interest.
Acknowledgments
We are extremely grateful to the “Centre National de Documentation et de la Recherche Scientifique” (CNDRS) of the Comores Union, and specifically the “Observatoire Volcanologique du Karthala” for their logistic support and providing field assistance from several students of the Université des Comores. Farid Hassane from the Comorian “Agence nationale de l’Aviation Civile de la Métérologie” (ANACM) kindly shared precipitation data available for Moroni. Elise Monsieurs assisted in the acquisition of the GPM IMERG data. Discussions with Julie Morin and Patrick Bachèlery helped planning and interpretation of field work. We thank the two reviewers and the associate editor for their comments that helped improving this manuscript.
Supplementary Material
The Supplementary Material for this article can be found online at: https://www.frontiersin.org/articles/10.3389/feart.2020.00369/full#supplementary-material
References
Anderson, E. R., Griffin, R. E., and Irwin, D. E. (2016). “Implications of different digital elevation models and preprocessing techniques to delineate debris flow inundation hazard zones in el salvador,” in Natural Hazard Uncertainty Assessment: Modeling and Decision Support, eds K. Riley, P. Webley, and M. Thompson (Hoboken, NJ: John Wiley & Sons, Inc), 167–177. doi: 10.1002/9781119028116.ch11
Bachèlery, P., Morin, J., Villeneuve, N., Soulé, H., Nassor, H., and Ali, A. R. (2016). “Structure and eruptive history of Karthala Volcano,” in Active Volcanoes of the Southwest Indian Ocean: Piton de La Fournaise and Karthala, eds P. Bachelery, J.-F. Lenat, A. Di Muro, and L. Michon (Berlin: Springer), 345–366. doi: 10.1007/978-3-642-31395-0_22
Blong, R. (2000). “Volcanic hazards and risk management,” in Encyclopedia of Volcano, 1st Edn, ed. Academic Press (Berlin: Springer), 1215–1227.
Boreggio, M., Bernard, M., and Gregoretti, C. (2018). Evaluating the differences of gridding techniques for digital elevation models generation and their influence on the modeling of stony debris flows routing: a case study from rovina di cancia basin (North-eastern Italian alps). Front. Earth Sci. 6:89. doi: 10.3389/feart.2018.00089
Bourhane, A., Comte, J.-C., Join, J.-L., and Ibrahim, K. (2016). “Groundwater Prospection in Grande,” in Active Volcanoes of the Southwest Indian Ocean: Piton de La Fournaise and Karthala, eds P. Bachelery, J.-F. Lenat, A. Di Muro, and L. Michon (Berlin: Springer), 385–401. doi: 10.1007/978-3-642-31395-0
Canuti, P., Casagli, N., Catani, F., and Falorni, G. (2002). Modeling of the guagua pichincha volcano (Ecuador) lahars. Phys. Chem. Earth 27, 1587–1599. doi: 10.1016/S1474-7065(02)00180-8
Carranza, E. J. M., and Castro, O. T. (2006). Predicting lahar-inundation zones: case study in West Mount Pinatubo, Philippines. Nat. Hazards 37, 331–372. doi: 10.1007/s11069-005-6141-y
Castruccio, A., and Clavero, J. (2015). Lahar simulation at active volcanoes of the Southern Andes: implications for hazard assessment. Nat. Hazards 77, 693–716. doi: 10.1007/s11069-015-1617-x
Charbonnier, S. J., Connor, C. B., Connor, L. J., Sheridan, M. F., Oliva Hernández, J. P., and Richardson, J. A. (2018). Modeling the October 2005 lahars at Panabaj (Guatemala). Bull. Volcanol. 80:4. doi: 10.1007/s00445-017-1169-x
Córdoba, G. A., Sheridan, M. F., and Pitman, B. (2018). Titan2F code for lahar hazard assessment?: derivation, validation and verification. Bolet. Soc. Geol. Mex. 70, 611–631. doi: 10.18268/BSGM2018v70n3a3
Darnell, A. R., Barclay, J., Herd, R. A., Phillips, J. C., Lovett, A. A., and Cole, P. (2012). Geographical information system approaches for hazard mapping of dilute lahars on Montserrat, West Indies. Bull. Volcanol. 74, 1337–1353. doi: 10.1007/s00445-012-0596-y
Darnell, A. R., Lovett, A. A., Barclay, J., and Herd, R. A. (2010). An application-driven approach to terrain model construction. Int. J. Geogr. Inf. Sci. 24, 1171–1191. doi: 10.1080/13658810903318889
Darnell, A. R., Phillips, J. C., Barclay, J., Herd, R. A., Lovett, A. A., and Cole, P. D. (2013). Developing a simplified geographical information system approach to dilute lahar modelling for rapid hazard assessment. Bull. Volcanol. 75:713. doi: 10.1007/s00445-013-0713-6
Davila, N., Capra, L., Gavilanes-Ruiz, J. C., Varley, N., Norini, G., and Vazquez, A. G. (2007). Recent lahars at Volcán de Colima (Mexico): drainage variation and spectral classification. J. Volcanol. Geotherm. Res. 165, 127–141. doi: 10.1016/j.jvolgeores.2007.05.016
Deng, F., Rodgers, M., Xie, S., Dixon, T. H., Charbonnier, S., Gallant, E. A., et al. (2019). High-resolution DEM generation from spaceborne and terrestrial remote sensing data for improved volcano hazard assessment — A case study at Nevado del Ruiz, Colombia. Remote Sens. Environ. 233:111348. doi: 10.1016/j.rse.2019.111348
Dezfuli, A. K., Ichoku, C. M., Huffman, G. J., Mohr, K. I., Selker, J. S., Van De Giesen, N., et al. (2017). Validation of IMERG precipitation in Africa. J. Hydrometeorol. 18, 2817–2825. doi: 10.1175/JHM-D-17-0139
Doyle, E. E., Cronin, S. J., and Thouret, J.-C. (2011). Defining conditions for bulking and debulking in lahars. Bull. Geol. Soc. Am. 123, 1234–1246. doi: 10.1130/B30227.1
Dzurisin, D., and Lu, Z. (2006). “Interferometric synthetic-aperture radar (InSAR),” in Volcano Deformation: New Geodetic Monitoring Techniques, ed. D. Dzurisin (Cham: Springer Science & Business Media).
Fagents, S. A., and Baloga, S. M. (2006). Toward a model for the bulking and debulking of lahars. J. Geophys. Res. Solid Earth 111, 1–21. doi: 10.1029/2005JB003986
Favalli, M., Mazzarini, F., Pareschi, M. T., and Boschi, E. (2009). Topographic control on lava flow paths at Mount Etna, Italy: implications for hazard assessment. J. Geophys. Res. 114, 1–13. doi: 10.1029/2007JF000918
Hubbard, B. E., Sheridan, M. F., Carrasco-Núñez, G., Díaz-Castellón, R., and Rodríguez, S. R. (2007). Comparative lahar hazard mapping at Volcan Citlaltépetl, Mexico using SRTM, ASTER and DTED-1 digital topographic data. J. Volcanol. Geotherm. Res. 160, 99–124. doi: 10.1016/j.jvolgeores.2006.09.005
Huffman, G., Bolvin, D., Braithwaite, D., Hsu, K., and Joyce, R. (2019). NASA Global Precipitation Measurement - Integrated Multi-satellite Retrievals for GPM, Algorithm Theoretical Basis Document v06. Washington, DC: National Aeronautics and Space Administration.
Huggel, C., Kääb, A., Haeberli, W., and Krummenacher, B. (2003). Regional-scale GIS-models for assessment of hazards from glacier lake outbursts: evaluation and application in the Swiss Alps. Nat. Hazards Earth Syst. Sci. 3, 647–662. doi: 10.5194/nhess-3-647-2003
Huggel, C., Schneider, D., Miranda, P. J., Delgado Granados, H., and Kääb, A. (2008). Evaluation of ASTER and SRTM DEM data for lahar modeling: a case study on lahars from Popocatépetl Volcano, Mexico. J. Volcanol. Geotherm. Res. 170, 99–110. doi: 10.1016/j.jvolgeores.2007.09.005
Hutchinson, M., Xu, T., and Stein, J. (2011). Recent progress in the ANUDEM elevation gridding procedure. Geomorphometry 2011, 19–22.
Hutchinson, M. F. (1989). A new procedure for gridding elevation and stream line data with automatic removal of spurious pits. J. Hydrol. 106, 211–232. doi: 10.1016/0022-1694(89)90073-5
Iverson, R. M., Schilling, S. P., and Vallance, J. W. (1998). Objective delineation of lahar-inundation hazard zones. Geol. Soc. Am. Bull. 110, 972–984. doi: 10.1130/0016-76061998110<0972:odolih<2.3.co;2
Jones, R., Manville, V., Peakall, J., Froude, M., and Odbert, H. (2017). Real-time prediction of rain-triggered lahars: incorporating seasonality and catchment recovery. Nat. Hazards Earth Syst. Sci. Discuss. 17, 2301–2312. doi: 10.5194/nhess-2017-166
Korup, O., Seidemann, J., and Mohr, C. H. (2019). Increased landslide activity on forested hillslopes following two recent volcanic eruptions in Chile. Nat. Geosci. 12, 2–8. doi: 10.1038/s41561-019-0315-9
Lavigne, F., Thouret, J., Voight, B., Suwa, H., and Sumaryono, A. (2000). Lahars at Merapi volcano, Central Java: an overview. J. Volcanol. Geotherm. Res. 100, 423–456. doi: 10.1016/S0377-0273(00)00150-5
Lavigne, F., and Thouret, J. C. (2003). Sediment transportation and deposition by rain-triggered lahars at Merapi Volcano, Central Java, Indonesia. Geomorphology 49, 45–69. doi: 10.1016/S0169-555X(02)00160-5
Levandowsky, M., and Winter, D. (1971). Distance between sets. Nature 234, 34–35. doi: 10.1038/234034a0
Macías, J. L., Capra, L., Arce, J. L., Espíndola, J. M., García-Palomo, A., and Sheridan, M. F. (2008). Hazard map of El Chichón volcano, Chiapas, México: constraints posed by eruptive history and computer simulations. J. Volcanol. Geotherm. Res. 175, 444–458. doi: 10.1016/j.jvolgeores.2008.02.023
Maerker, M., Quénéhervé, G., Bachofer, F., and Mori, S. (2015). A simple DEM assessment procedure for gully system analysis in the Lake Manyara area, northern Tanzania. Nat. Hazards 79, 235–253. doi: 10.1007/s11069-015-1855-y
Major, J. J., Bertin, D., Pierson, T. C., Amigo, A., Iroume, A., Ulloa, H., et al. (2016). Extraordinary sediment delivery and rapid geomorphic response following the 2008-2009 eruption of Chaiten Volcano. Chile. Water Resour. Res. 52, 5075–5094. doi: 10.1002/2015WR018250
Manville, V., Major, J. J., and Fagents, S. A. (2012). “Modeling lahar behavior and hazards,” in Modeling Volcanic Processes The Physics and Mathematics of Volcanism, eds S. A. Fagents, T. K. P. Gregg, and R. M. C. Lopes (Cambridge: Cambridge University Press), 300–330. doi: 10.1017/cbo9781139021562.014
Manville, V., Németh, K., and Kano, K. (2009). Source to sink: a review of three decades of progress in the understanding of volcaniclastic processes, deposits, and hazards. Sediment. Geol. 220, 136–161. doi: 10.1016/j.sedgeo.2009.04.022
Mead, S., Magill, C., and Hilton, J. (2016). Rain-triggered lahar susceptibility using a shallow landslide and surface erosion model. Geomorphology 273, 168–177. doi: 10.1016/j.geomorph.2016.08.022
Morin, J. (2012). Gestion Institutionnelle et Réponses des Populations Face Aux Crises Volcaniques: Études de Cas á La Réunion et en Grande Comore. La Réunion, France: Université de la Réunion.
Morin, J., Bachèlery, P., Soulé, H., Nassor, H., and Hamidi, N. (2016). “Volcanic risk and crisis management on Grande comore Island,” in Active Volcanoes of the Southwest Indian Ocean: Piton de La Fournaise and Karthala, eds P. Bachèlery, J.-F. Lénat, A. Di Muro, and L. Michon (Berlin: Springer), doi: 10.1007/7854
Morin, J., Lavigne, F., Bachelery, P., Finizola, A., and Villeneuve, N. (2009). Institutional and social responses to hazards related to Karthala volcano, Comoros - PART II: the deep-seated root causes of Comorian vulnerabilities. SHIMA Int. J. Res. Isl. Cult. 3, 54–71.
Mossoux, S., Kervyn, M., and Canters, F. (2019). Assessing the impact of road segment obstruction on accessibility of critical services in case of a hazard. Nat. Hazards Earth Syst. Sci. 19, 1251–1263. doi: 10.5194/nhess-19-1251-2019
Mossoux, S., Kervyn, M., Soulé, H., and Canters, F. (2018). Mapping population distribution from high resolution remotely sensed imagery in a data poor setting. Remote Sens. 10:1409. doi: 10.3390/rs10091409
Mossoux, S., Saey, M., Bartolini, S., Poppe, S., Canters, F., and Kervyn, M. (2016). Q-LAVHA: a flexible GIS plugin to simulate lava flows. Comput. Geosci. 97, 98–109. doi: 10.1016/j.cageo.2016.09.003
Mothes, P. A., and Vallance, J. W. (2015). “Lahars at Cotopaxi and Tungurahua volcanoes, ecuador: highlights from stratigraphy and observational records and related downstream hazards,” in Hazards and Disasters Series: Volcanic Hazards, eds J. F. Shroder and P. Papale (Amsterdam: Elsevier Inc), 141–168. doi: 10.1016/b978-0-12-396453-3.00006-x
Muñoz-Salinas, E., Castillo-Rodríguez, M., Manea, V., Manea, M., and Palacios, D. (2009). Lahar flow simulations using LAHARZ program: application for the Popocatépetl volcano. Mexico. J. Volcanol. Geotherm. Res. 182, 13–22. doi: 10.1016/j.jvolgeores.2009.01.030
Muñoz-Salinas, E., Renschler, C. S., Palacios, D., and Namikawa, L. M. (2008). Updating channel morphology in digital elevation models: lahar assessment for Tenenepanco-Huiloac Gorge, Popocatépetl volcano, Mexico. Nat. Hazards 45, 309–320. doi: 10.1007/s11069-007-9162-x
O’Brien, J. S., Julien, P. Y., and Fullerton, W. T. (2007). Two-Dimensional Water Flood and Mudflow Simulation. J. Hydraulic Eng. 119:2.
Perrotta, A., Scarpati, C., and Luongo, G. (2006). Volcaniclastic resedimentation on the northern slope of Vesuvius as a direct response to eruptive activity. Landslides 3, 295–301. doi: 10.1007/s10346-006-0057-9
Pierson, T. C. (2005). “Hyperconcentrated flow - transitional process between water flow and debris flow,” in Debris Flow Hazards and Related Phenomena, eds M. Jakob and O. Hungr (Berlin: Springer), 159–202. doi: 10.1007/3-540-27129-5_8
Pierson, T. C., and Major, J. J. (2014) Hydrogeomorphic effects of explosive volcanic eruptions on drainage basins. Ann. Rev. Earth Planet. Sci. 42, 469–507. doi: 10.1146/annurev-earth-060313-054913
Pierson, T. C., and Scott, K. M. (1985). Downstream dilution of a lahar: transition from debris flow to hyperconcentrated streamflow. Water Resour. Res. 21, 1511–1524. doi: 10.1029/WR021i010p01511
Pistolesi, M., Cioni, R., Rosi, M., and Aguilera, E. (2014). Lahar hazard assessment in the southern drainage system of Cotopaxi volcano, Ecuador: results from multiscale lahar simulations. Geomorphology 207, 51–63. doi: 10.1016/j.geomorph.2013.10.026
Pitman, E. B., and Le, L. (2005). A two-fluid model for avalanche and debris flows. Philos. Trans. A. Math. Phys. Eng. Sci. 363, 1573–1601. doi: 10.1098/rsta.2005.1596
Reid, M. E., Coe, J. A., and Brien, D. L. (2016). Forecasting inundation from debris flows that grow volumetrically during travel, with application to the Oregon Coast Range, USA. Geomorphology 273, 396–411. doi: 10.1016/j.geomorph.2016.07.039
Rodolfo, R. S. (2000). “The Hazard from Lahars and Jokulhlaups,” in Encyclopedia of Volcano, 1st Edn, eds H. Sigurdsson, B. F. Houghton, S. R. McNutt, H. Rymer, and J. Stix (London: Academic Press), 973–995.
Schilling, S. (2014). Laharz _ py: GIS tools for automated mapping of lahar inundation hazard zones. U.S. Geol. Surv. 78:1073. doi: 10.3133/ofr20141073
Schneider, D., Delgado Granados, H., Huggel, C., and Kääb, A. (2008). Assessing lahars from ice-capped volcanoes using ASTER satellite data, the SRTM DTM and two different flow models: case study on Iztaccíhuatl (Central Mexico). Nat. Hazards Earth Syst. Sci. 8, 559–571. doi: 10.5194/nhess-8-559-2008
Scott, K. M. (1988). Origins, Behavior, and Sedimentology of Lahars and Lahar-Runout Flows in the Toutle-Cowlitz River System. Professional Paper 1447- A. Washington, DC: UGSC.
Scott, K. M., Vallance, J. W., Kerle, N., Macías, J. L., Strauch, W., and Devoli, G. (2005). Catastrophic precipitation-triggered lahar at Casita volcano, Nicaragua: occurrence, bulking and transformation. Earth Surf. Process. Landf. 30, 59–79. doi: 10.1002/esp.1127
Skofronick-Jackson, G., Petersen, W. A., Berg, W., Kidd, C., Stocker, E. F., Kirschbaum, D. B., et al. (2017). The global precipitation measurement (GPM) mission for science and society. Bull. Am. Meteorol. Soc. 98, 1679–1696. doi: 10.1175/BAMS-D-15-00306.1
Smemoe, C. M., Nelson, E. J., Zundel, A. K., and Miller, A. W. (2007). Demonstrating floodplain uncertainty using flood probability maps. J. Am. Water Resour. Assoc. 43, 359–371. doi: 10.1111/j.1752-1688.2007.00028.x
Smietana, M., Bachelery, P., Boivin, P., and Boudon, G. (2007). Etude Pétrologique et Volcanologique des Dépôts des Quatre Dernières Éruptions du Karthala. Réunion: Université de la Réunion.
Smith, G. A., and Lowe, D. R. (1991). “Lahars: volcano-hydrologic events and deposition in the debris flow-hyperconcentrated flow continum,” in Sedimentation in Volcanic Settings, eds R. V. Fisher and G. A. Smith (Tulsa: Society for Sedimentary Geology), 59–70. doi: 10.2110/pec.91.45.0059
Stevens, N., Manville, V., and Heron, D. (2003). The sensitivity of a volcanic flow model to digital elevation model accuracy: experiments with digitised map contours and interferometric SAR at Ruapehu and Taranaki volcanoes, New Zealand. J. Volcanol. Geotherm. Res. 119, 89–105. doi: 10.1016/S0377-0273(02)00307-4
Thompson, M. A., Lindsay, J. M., and Gaillard, J. C. (2015). The influence of probabilistic volcanic hazard map properties on hazard communication. J. Appl. Volcanol. 4:6. doi: 10.1186/s13617-015-0023-0
Thouret, J. C., Antoine, S., Magill, C., and Ollier, C. (2020). Lahars and debris flows: characteristics and impacts. Earth Sci. Rev. 201:103003. doi: 10.1016/j.earscirev.2019.103003
Vallance, J. W. (2000). “Lahars,” in Encyclopedia of Volcano, eds H. Sigurdsson, B. F. Houghton, S. R. McNutt, H. Rymer, and J. Stix (Amsterdam: Elsevier), 601–616.
Vallance, J. W. (2005). “Volcanic debris flow,” in Debris Flow Hazards and Related Phenomena, eds M. Jakob and O. Hungr (Berlin: Springer), 247–274. doi: 10.1007/3-540-27129-5_10
Vallance, J. W., and Iverson, R. M. (2015). “Lahars and their deposits,” in The Encyclopedia of Volcanoes, 2nd Edn, eds H. Sigurdsson, B. F. Houghton, S. R. McNutt, H. Rymer, and J. Stix (Berlin: Springer), 650–664.
Wechsler, S. (2007). Uncertainties associated with digital elevation models for hydrologic applications: a review. Hydrol. Earth Syst. Sci. 11, 1481–1500. doi: 10.5194/hessd-3-2343-2006
Worni, R., Huggel, C., Stoffel, M., and Pulgarín, B. (2012). Challenges of modeling current very large lahars at Nevado del Huila Volcano, Colombia. Bull. Volcanol. 74, 309–324. doi: 10.1007/s00445-011-0522-8
Keywords: volcano-hydrologic hazards, small-scale lahars, field observation, LaharZ, Q-LavHA, tropical Africa, Digital Elevation Model, Comoros
Citation: Dille A, Poppe S, Mossoux S, Soulé H and Kervyn M (2020) Modeling Lahars on a Poorly Eroded Basaltic Shield: Karthala Volcano, Grande Comore Island. Front. Earth Sci. 8:369. doi: 10.3389/feart.2020.00369
Received: 24 October 2019; Accepted: 10 August 2020;
Published: 02 September 2020.
Edited by:
Stuart Mead, College of Sciences, Massey University, New ZealandReviewed by:
Jon J. Major, United States Geological Survey (USGS), United StatesClaudio Scarpati, University of Naples Federico II, Italy
Copyright © 2020 Dille, Poppe, Mossoux, Soulé and Kervyn. This is an open-access article distributed under the terms of the Creative Commons Attribution License (CC BY). The use, distribution or reproduction in other forums is permitted, provided the original author(s) and the copyright owner(s) are credited and that the original publication in this journal is cited, in accordance with accepted academic practice. No use, distribution or reproduction is permitted which does not comply with these terms.
*Correspondence: Antoine Dille, YW50b2luZS5kaWxsZUB2dWIuYmU=; YW50b2luZS5kaWxsZUBnbWFpbC5jb20=