- 1State Key Laboratory of Cryospheric Sciences, Northwest Institute of Eco-Environment and Resources, Lanzhou, China
- 2University of Chinese Academy of Sciences, Beijing, China
- 3College of Geography and Environmental Sciences, Northwest Normal University, Lanzhou, China
- 4College of Sciences, Shihezi University, Xinjiang, China
- 5Key Laboratory of Western China’s Environmental Systems (Ministry of Education), College of Earth and Environmental Sciences, Lanzhou University, Lanzhou, China
To analyze the impacts of dust storms on the atmospheric and meltwater environment, intensive and simultaneous sampling for aerosols and meltwater on the terminal moraine (41°73′ N, 79°88′ E, 3,789 m a.s.l.) of Qingbingtan Glacier No. 72 (Glacier No. 72) on the northern margin of the Taklamakan Desert were conducted during the summer of 2008. Aerosol and meltwater chemistry (including the species of Na+, K+, Mg2+, Ca2+, NH4+, Cl−, SO42−, and NO3−) was analyzed by ion chromatography. The results indicated that the major anions and cations in the samples were SO42− and Ca2+, respectively. In the dust event, the average value of aerosol ions was 566.91 neq·m−3, which was nearly five times that under nondust conditions (115.58 neq·m−3). In addition, in the meltwater samples, the sum of ion concentrations ranged from 31.26 to 180.98 mg·L−1, with an average of 76.40 mg·L−1. When a dust storm occurred, the ion concentrations in these two media increased significantly and simultaneously, but with different trends due to the different influencing factors. That is, the atmospheric environment was significantly affected by the dust storm. According to the correlation analysis and principal component analysis, the water-soluble ions, such as SO42−, Cl−, Na+, K+, Mg2+, and Ca2+, originated from natural sources, while NH4+ and NO3− originated from anthropogenic sources. The results of the air mass trajectory suggested that the regional dust storms caused by the air masses originating from Eastern Europe and Siberia had a significant influence on the glacial environment.
Introduction
Dust aerosols contribute nearly 75% of the global aerosol mass load and 30% of the global aerosol optical thickness. It is highly emphasized that dust aerosols play an important role in connecting the atmosphere, biosphere, and lithosphere, making them a critical factor in global mass circulation (Tang et al., 2018). The Earth’s radiation budget can be perturbed by dust aerosols through their direct (scattering as well as absorbing solar and terrestrial thermal radiation), semidirect (changing the evaporation rate of cloud droplets), and indirect (modification of cloud optical properties and lifetimes) effects (Seinfeld et al., 2016; Kedia et al., 2018). Dust aerosols also have a significant impact on global climate change (Wang et al., 2015), deterioration of air quality, visibility reduction and human health (Goudie, 2014), marine ecosystems, and biogeochemical cycles through their transportation mechanisms. The transportation mechanisms are highly dependent on the composition, concentration, and particle size distribution of dust aerosols (Ramanathan et al., 2001; Chow et al., 2008; Seinfeld and Pandis, 2012). The radiative forcing of aerosols is considered to be especially important at the regional scale because their lifetime is relatively short, which is different from the radiative forcing of greenhouse gases. Aerosols are removed from the atmosphere through dry and wet deposition. Dust aerosols can also mix with anthropogenic aerosols while they are being transported hundreds to thousands of kilometers away, which play a crucial role in the atmospheric chemistry and biogeochemical cycles in the Northern Hemisphere (Duce et al., 1991; Arimoto et al., 1996; Griffin, 2007). Dust aerosols deposited on glacial surfaces can decrease snow albedo by enhancing lighting absorption, which is a vital factor influencing glacial melt (Wang et al., 2013; Kaspari et al., 2015). Dust particles also have a significant impact on the chemistry of glacial meltwater. The hydrochemical characteristics of meltwater runoff will be affected by dust particles. Analyzing meltwater chemistry is of great significance to studying dramatic glacial change influences on meltwater (Dong et al., 2014). Moreover, glacial meltwater is an essential water resource in arid and semiarid areas of Northwestern China. Some dust particles stored in glaciers will be released with glacial meltwater into glacial runoff and eventually incorporated into downstream aquatic ecosystems (Zhang et al., 2019).
The Tianshan area is located in the arid and semiarid region of Central Asia, which is in a significant dust source region of the Northern Hemisphere (Li et al., 2011; Dong et al., 2014); a great quantity of dust has been transported to the North Pacific and the western coast of America or even globally under the action of strong winds each year. The information of aerosol dust can be recorded in the snow and ice of high mountains and polar regions. During the past few decades, dust particles in glaciers of Central Asia have been of widespread concern. In the early stage, the studies of dust storms in the glacial region mainly focused on the properties of dust particles in snow and ice. Wake et al. (1994) analyzed the concentrations and size distributions of insoluble particles in snow and ice samples and discussed the spatial and seasonal distributions of eolian dust deposition in Central Asia. Subsequently, Dong et al. (2009) measured the deposition of atmospheric dust in snow deposited on Haxilegen Glacier No. 51 in Kuitun, Glacier No.1 at the headwater of Urumqi River, and Miaoergou Glacier in Hami in East Tianshan Mountains. Dong et al. (2010) researched the characteristics of aerosol dust in fresh snow during Asian dust and nondust periods at Urumqi Glacier No. 1 of eastern Tian Shan. Dong and Li, (2011) and Dong et al. (2013) analyzed the characteristics of atmospheric dust deposition in snow on Glacier No. 72 and Glacier No. 4, Mt Bogeda. Dong et al. (2014a) studied and compared the deposition of atmospheric dust in snow deposited on Glacier No. 12 at the Laohugou River, Shiyi Glacier in Yeniugou of the western Qilian Mountains, China. In recent years, Asia dust provenance in snow and ice of glacier regions was analyzed by researchers (Xu et al., 2012; Yu et al., 2013; Du et al., 2015; Dong et al., 2016; Du et al.,2017). These studies mainly focus on the characteristics of Asia dust particles in snow and ice, as well as the spatial and temporal distribution and source analysis. However, there are few studies on the impact of dust storms on aerosols and meltwater. You and Dong (2011) also studied samples collected from aerosols, fresh snow, and snow pits on Urumqi Glacier No. 1 and determined the deposition processes and characteristics of mineral dust microparticles from aerosols to fresh snow and then the evolution to snow pits. Little research has been carried out regarding dust particle effects on the physicochemistry of glacial meltwater runoff. Dong et al. (2014b) discussed the temporal variations in various physicochemical species in the meltwater runoff of Laohugou Glacier No. 12 in Central Asia and their correlation with dust particles based on two-year field observations in the summers of 2012 and 2013.
However, there are few studies on the coupling relationship between the atmospheric environments and meltwater environments of glaciers during dust storms. In addition, there has been little research on aerosols of Glacier No. 72. Therefore, aerosol samples and meltwater samples were collected on Glacier No. 72 during 2008. The purposes of this research were to comprehend the water-soluble ion chemical characteristics of aerosols in the region and the coupling relationship between aerosols and meltwater on both dust and nondust days. Although the field experiment was carried out for only seven days, inorganic ion chemistry and individual analyses of aerosols were investigated in this study for the first time. Thus, it is essential to investigate the chemical characteristics of aerosols and glacial meltwater at Glacier No. 72 in the southern Tianshan Mountains.
Materials and Methods
Site Description
Glacier No. 72 (41°45.51′N, 79°54.43′E) is a compound valley glacier located in the southern foot of the Tianshan Mountains and the southern part of Tomur peak in the northern margin of the Tarim Basin in Xinjiang. This glacier is representative of many other glaciers on Mount Tomur, with the highest elevation of 5,986 m a.s.l. The glacier is surrounded by vast deserts and Gobi (Figure 1). The climate in this area is typical of the continental climate and mainly affected by the westerlies. The aerosol sampling point is located at the lateral moraine at the east end of Glacier No. 72 at an altitude of 3,789 m. The bedrock is exposed without vegetation coverage. The salt contents of crystalline rocks, such as granite and metamorphic rocks, in the alpine zone, are difficult to dissolve. The soluble salt is mainly bicarbonate, some of which included marble and limestone. The low mountain zone is composed of the salt bearing rock series of the Tertiary system, with soluble salts. The area of mobile sand dunes in the Taklimakan Desert is as high as 85%. Evaporites such as the gypsum layer, Glauber’s salt, halite, and sylvite are widely developed in the underlying strata.
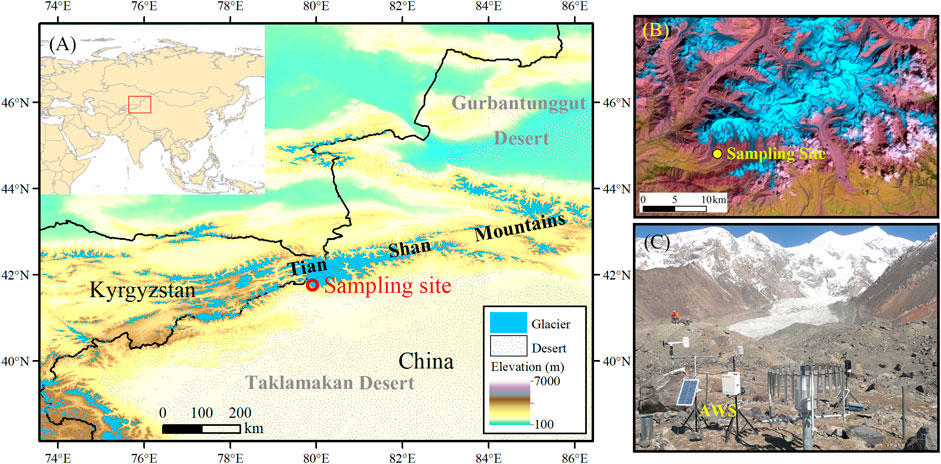
FIGURE 1. Map showing the location of Qingbingtan Glacier No. 72 (A,B) and automatic weather station at the end of glacier 72 (C).
Sample Collection and Analyses
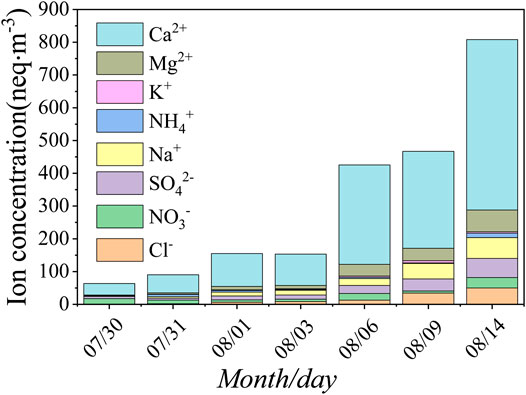
Aerosol samples were collected for seven days from July 30 to August 14, 2008 (Figure 2). Four samples were collected on July 30, July 31, August 1, and August 3 before the dust storm on August 5. Three samples were collected after the dust storm on August 6, 9, and 14, respectively. Zefluor™ Teflon filters, 47 mm diameter with 2.0 μm pore size (Gelman Sciences), were used to collect the aerosol samples. The sampler was driven by a 24 V diaphragm pump powered by solar cells. The filters were mounted face-down approximately 1.5 m above the ground surface. Sampling usually started at 11:00 in the morning (Beijing time). No samples were collected during rainy or foggy weather. The air extraction volumes of aerosol samples varied from 2.71 to 6.25 m3; for details, see (Zhao et al., 2011). The air volume through the filter was measured by an in-line meter and then converted into standard conditions according to local environmental pressure and temperature. Based on the average flow rate of 1.27 m3·h−1 on the filter, the particle collection efficiency was greater than 97% for aerosol particles with the diameter larger than 0.035 μm (Liu et al., 1984; Li et al., 2011). After sampling, the filters were removed from the filter holder and placed into cleaned airtight plastic containers and stored at 4°C before analysis. When loading and unloading the filters, the operator should wear plastic gloves and face the upwind side to minimize pollution.
Nine days of meltwater samples were collected from July 30 to August 9, 2008. The sampled hydrological section was 1.1 km away from the end of the No.72 glacier. The SWY-20 type monthly self-metering water level and water gauge were adopted to measure the water level and flow rate, and there was an automatic weather station in the area to measure wind speed and direction, air temperature, air pressure, precipitation, and relative humidity. Meltwater samples were collected at 14:00 every day. All samples were kept frozen and transported in the condition of −18°C until laboratory measurement at the State Key Laboratory of Cryospheric Science of Chinese Academy of Sciences. Before testing and analyzing, the sample melted naturally at room temperature.
Both samples and field blank filters were analyzed in a class 100 clean room at the State Key Laboratory of Cryosphere Sciences, Chinese Academy of Sciences (Lanzhou). In order to efficiently extract the water-soluble species from the filters, the sample and blank filters were first wetted with 200 μL ultra-pure methanol. The soluble components were then extracted with 25 ml of deionized water for about 30 min using an ultrasonic water bath device (Zhao and Li, 2004; Zhao et al., 2011; Zhang et al., 2016). Dionex model 320 ion chromatograph (Thermo Fisher Scientific, Inc.) was used to determine the major ion concentrations in the aqueous extracts. Zhao and Li (2004) and Zhao et al. (2011) have described the detailed experimental methods. Mean concentrations of five field blank filters were Cl− (3.66 ng/g), NO3− (17.31 ng/g), SO42− (2.60 ng/g), Na+ (2.61 ng/g), NH4+ (3.35 ng/g), K+ (0.04 ng/g), Mg2+ (2.44 ng/g), and Ca2+ (6.41 ng/g). These were obviously lower than the concentrations detected in the aerosol samples. The average blank values were subtracted from the sample concentrations.
In addition, the scanning electron microscopy-energy dispersive X-ray spectrometer (SEM-EDX) was used to analyze individual particles. For each membrane, a part of the total filter was cut and mounted on an electron microprobe stub, and a thin gold film (16 nm) was coated to obtain a high-quality secondary electron image. The operating conditions were listed as follows: the accelerating voltage is in the range of 5–10 kV; and the spectral acquisition time is 60 s. Noran TM System software (Thermo Fisher Scientific Inc.) for energy dispersive microanalysis was used for the quantitative analysis of individual particles. The morphological characteristics of aerosol samples were classified, and the detailed analytical techniques of aerosols are described in the literature (Zhao et al., 2011).
Results and Discussion
Impact of Dust Storms on the Atmospheric Environment of Glacial Areas
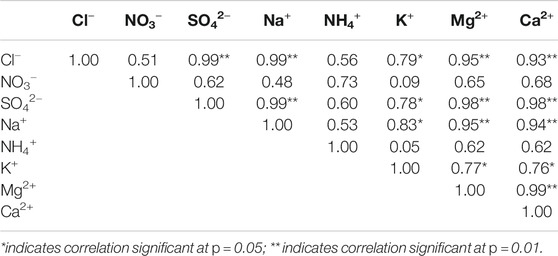
On August 5, 2008, there was a strong dust storm event in southern Xinjiang, http://www.duststorm.com.cn/. According to the field records obtained during sampling, there was strong dusty weather at Glacier No. 72 on the afternoon of August 5, and there was floating dust in the air all day on August 6. Therefore, the three aerosol samples collected from August 6 to August 14 were affected by dust storms with varying degrees, which was helpful for understanding the impact of dust storms on the atmospheric environments in high-altitude areas. According to the sampling time, the seven aerosol samples were divided into two parts: before the dust storm event of July 30 to August 3 and after the dust storm event of August 6 to August 14. Supplementary Table S1 presents the mean concentrations of the water-soluble primary inorganic ions (Cl−, NO3−, SO42−, Na+, NH4+, K+, Mg2+, and Ca2+). Of all seven samples, the sum of anions and cations in the aerosols ranged from 63.66 to 808.29 neq·m−3, with an average of 309.01 neq·m−3. Table 1 showed that the total number of cations measured in the aerosols [ ∑+ = (Na+) + (NH4+) + (K+) + (Mg2+) + (Ca2+) ] was 4.82 times the total number of anions measured [ ∑- = (Cl−) + (NO3−) + (SO42−) ]. This phenomenon existed in all samples, indicating that aerosol particles on that day were more alkaline (Yang et al., 2016). Most of the excess cations in the samples could be balanced by carbonate ions (HCO3−/CO32− = ∑+−∑− = ΔC) that were not detected in the experiment (Zhao et al., 2008). Ca2+ and ΔC were the main ions in the aerosols, accounting for 78.88% of the total measured anions and cations.
Before the dust storm occurred, the sum of anions and cations in the aerosols ranged from 63.66 to 154.99 neq·m−3, with an average of 115.58 neq·m−3. The order of ion concentrations was Ca2+ > NO3− > SO42− > Na+ > Mg2+ > Cl− > NH4+ > K+, which represented the background value of the atmospheric environment in the region. However, after the dust storm, the sum of anions and cations in the aerosols ranged from 425.35 to 808.29 neq·m−3, with the average of up to 566.91 neq·m−3, which was 4.9 times the average before the dust storm. The order of ion concentrations was Ca2+ > Mg2+ > Na+ > SO42− > Cl− > NO3− > NH4+ > K+. According to the orders of ion concentrations, Ca2+ and SO42- were the most important cations and anions in this area, whether affected by dust storms or not. Dust storm events could bring much Mg2+ and Na+, so that the relative positions of the two ions in the sequence were advanced. During the sampling period, except for the nonobvious change in K+, the other seven ions showed a significant increasing trend, especially after the occurrence of the dust storm on August 5. In particular, with Ca2+, the average ion concentration after the dust storm event was 5.21 times that before the dust storm event, which showed that the dust storm event had a great impact on the atmospheric environment in the glacial area.
In previous studies, Ca2+ and Mg2+ were thought to be the index of dust substitution in studies of crustal sources on snow and ice chemistry (Wake et al., 1994; Dong et al., 2009; Zhang et al., 2016). Glacier No. 72 was surrounded by desert and located in the source area of Asian dust. There were many minerals, such as quartz, feldspar, calcite, yellow flash, and black mica, in the sand of the desert, which was also rich in CaCO3, CaSO4, and NaCl. When dust storms occurred, a large amount of dust was carried to the glaciers. Therefore, the concentrations of Ca2+ and Mg2+ increased significantly. Simultaneously, the debris at the southern foot of Mt. Tomur was rich in limestone, amphibole, and other minerals, and these minerals were also abundant in Ca, Mg, Na, and other substances. In addition, the concentrations of Na+, Cl−, and K+ also increased significantly. This was because the air masses that passed by the salty sea and Issky Kul Lake could bring more salt particles with high concentrations. These factors contributed to the concentrations of water-soluble ions increases in the atmospheric environment of the glacial area after a dust storm.
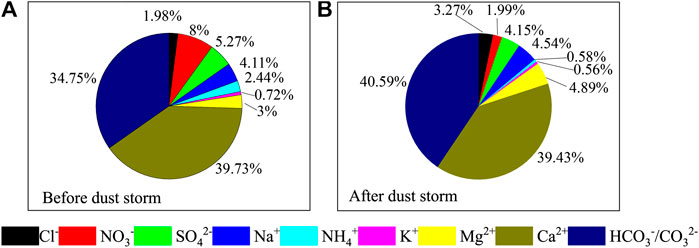
To calculate the relative contributions of each ion to aerosols before and after the dust storm, the percentage value was calculated based on each sample. Then the average value was calculated (Figure 3). In general, Ca2+ and HCO3−/CO32− were the most abundant ions in aerosols, accounting for 39.26% and 39.62%, respectively, of the ion balance. The contributions of Ca2+, HCO3−/CO32−, NO3−, and SO42− to the ion balance were 39.73%, 34.75%, 7.99%, and 5.27%, respectively, from July 30 to August 3 (nondust days). The contributions of HCO3−/CO32−, Ca2+, Mg2+, Na+, and SO42− to the ion balance were 40.59%, 39.43%, 4.89%, 4.54%, and 4.15%, respectively, from August 6 to August 14 (dust days). Based on the contributions of the above ions, CaCO3/Ca (HCO3)2 was the main dust material during the sampling period.
The SEM-EDX technique is an important method to analyze the characteristics of aerosol particles, which can supply detailed information about the shape and size of particulate matter, such as morphology, element composition, surface load, and agglomeration (Li et al., 2011; Zhang et al., 2016), and this method used to analyze aerosol samples is able to more intuitively understand the effects of dust storms on the atmospheric environment. The single-particle analysis for aerosols at Urumqi Glacier No. 1 and Mt. Bogda indicated that natural sources of dust and mineral particles usually appeared irregular, and then, the particles produced by artificial sources of pollution usually appeared as surface light sliding spherical or floc aggregates (Li et al., 2011; Zhao et al., 2011). According to Figure 4, most of the particles enriched on Teflon sampling filters were irregular, mainly minerals and dust particles. There may be aluminosilicate, quartz, feldspar, gypsum, and calcite in these particles. This indicated that the atmospheric environment of the glacier area was mainly affected by natural sources. By comparing the samples for August 6, August 14, and August 3, it could be found that the particles attached to the membrane showed an increasing tendency due to the August 5 dust storm incident. Thus, the occurrence of dust storms could bring large quantities of mineral particles, causing the concentrations of water-soluble ions in the atmosphere of the glacier area to increase sharply.

FIGURE 4. Scanning electron microscope (SEM) images of typical aerosol samples. (A) 3 August 2008 before the dust storm; (B) 6 August 2008 after the dust storm; (C) 14 August 2008 after the dust storm.
For comparison, the average soluble ion concentrations of aerosols in this work and other glaciered areas are summarized in Supplementary Table S2. When analyzing the spatial difference in aerosol chemical composition, the average concentration of the four samples before the dust storm event at Glacier No. 72 represented the background concentration of aerosols. Bogda glacier is close to Glacier No.72; both of them are affected by the prevailing westerly. The sampling period was the same, all in summer; thus it had certain comparability. In general, the ion concentration of Glacier No. 72 was higher than that of Bogda glacier, especially Ca2+ and Mg2+. Compared with Bogda glacier, the average temperature (5.4°C) and humidity (72%) of Glacier No. 72 were higher than those of Bogda glacier (4.7°C, 57%), but the average wind speed (2.6 m·s−1) was lower than that of Bogda glacier (4.8 m·s−1). Wake et al. (1990) and Sun et al. (1998) have also pointed out that Na+ and Cl− originated from the extensive evaporate deposits in the arid regions surrounding these mountain ranges. When the temperature was higher, it contributed to evaporating the sediment; thus the concentrations of Na+ and Cl− were relatively high. When the wind velocity was low, it was not conducive to the local emission of dust (Dong et al., 2013). The concentrations of Ca2+ and Mg2+ should be lower, but the ion concentrations of Glacier No. 72 were much higher than that of Bogda glacier. The main reason was that Glacier No.72 was located in the northern edge of the desert, which was closest to the Taklimakan Desert, and was greatly affected by the Taklimakan Desert.
Impact of Dust Storms on Meltwater in Glacial Areas
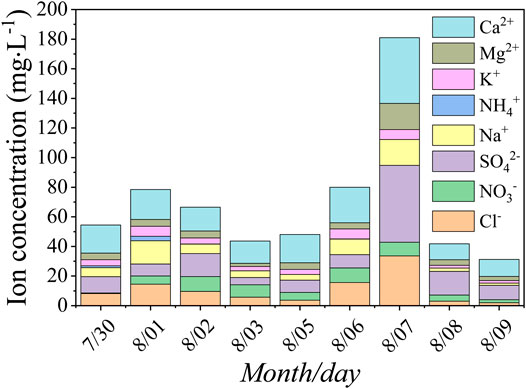
Glacial meltwater is an important part of the terrestrial hydrosphere, and the change is the result of the water-energy balance in the basin, which can accurately reflect the river basin information on climate change at different time scales and human activities in the region. The sum of ions in the samples from Glacier No. 72 ranged from 43.65 to 78.48 mg·L−1, with an average of 60.77 mg·L−1 (Supplementary Table S3). Ca2+ was the main ion in the measured samples, with a mean value of 17.62 mg·L−1, followed by SO42−, with a mean value of 9.89 mg·L−1. Besides, the standard deviation also showed that the change in the concentration of these two ions was very large, while the concentrations of K+ and NH4+ were low and relatively stable. In general, the meltwater ions were mainly composed of the sulfate-calcium type, which was consistent with the characteristics of the atmospheric environment of the glacial area. The order of ion concentration was SO42− > Ca2+ > Cl− > NO3− > Na+ > Mg2+ > K+ > NH4+. After the dust storm, ion concentrations significantly increased; the sum of ion concentrations ranged from 31.26 to 180.98 mg·L−1, with an average of 76.40 mg·L−1, the mean concentration of Ca2+ was approximately 21.94 mg·L−1, and SO42− was approximately 18.95 mg·L−1, which were 1.25 and 1.92 times greater, respectively, than before. Dust storms could bring more Ca2+, SO42−, Mg2+, and so on. Figure 5 also showed that the concentrations of various meltwater ions increased significantly on August 6 and August 7, especially Ca2+, Mg2+, and SO42−. According to the field records of sampling, there was strong dust weather on Glacier No. 72 in the afternoon of August 5, and there was floating dust all day on August 6. After the dust storm, the dust particles fell onto the surface of the glacier and meltwater through a dry and wet deposition. The dust composition changes from one chemical state to another. Different chemical substances dissolved into the meltwater, which led to the higher ion concentration in meltwater. We find that the higher concentration of cations and anions is of Ca2+, Mg2+, Na+, and SO42−, Cl− in meltwater samples, respectively. The total ion concentration also increased on the sixth and seventh. Considering the dust storm on August 5, we can infer that the chemical constituents mainly reflect the apparent effects of mineral dust input on glacier meltwater.
As for the concentration of ions in glacial meltwater, it was not only affected by the dry and wet deposition of glacial dust but also affected by the erosion effect of glacial meltwater on the channel bed, namely, the water-rock interaction. Water-rock interaction is related to geological conditions and flow velocity, and various ions in rocks and weathering materials around the river bed are brought into the meltwater mainly through the erosion of the water. The geological conditions are relatively stable in a long time series, so it has little effect on the ion species in the river water (Zhang and Chen, 2000). The higher discharge of meltwater will affect the erosion rate, thereby affecting the process of physical and chemical weathering, making it higher than the continental average (Kumar et al., 2019). The discharge of meltwater mainly depends on meteorological factors. Due to the increase in temperature or precipitation, the discharge volume increases (Li et al., 2019). After the dust storm occurred on August 5, the temperature dropped, there was no significant precipitation, the flow velocity tended to decrease, the water-rock interaction weakened, and the ion concentration in the sample would not increase rapidly. Therefore, after excluding relevant factors that may cause ion changes in meltwater, it is concluded that the sudden increase in ion concentrations during this period is mainly related to the occurrence of dust storms.
After the dust storm, the temperature rose, the glacier melted faster, the runoff increased, and the flow velocity increased. The contact time between the water and the channel bed was relatively short; the soluble salts in the soil and rocks less dissolved in the water. At the same time, during the sampling period, there was precipitation on August 9. Atmospheric precipitation is one of the water bodies with the lowest soluble matter content. Therefore, when there was more precipitation replenishment to the river, due to the dilution of precipitation, there is a negative correlation between the total amount of meltwater ions and the corresponding regional rainfall (Zhang and Chen, 2000). After the ninth, the amount of precipitation increased, and the runoff of river water recharged from atmospheric precipitation increased, which could lead to increased erosion of glacial moraine and lateral moraine, and increased interaction of river water and rock, resulting in increased river water ion concentration.
Coupling Relationship of Typical Dust Concentrations in Aerosol and Meltwater Samples
The effect of dust storms on the glacial environment was based on dry and wet deposition. To observe the effect of the dust storm on the atmospheric environment and water environment in the glacial area, the four main ions carried in the dust (SO42−, Na+, Mg2+, and Ca2+) were selected as the research objects. There was a significant increase between August 3 and August 6 (Figure 6) in both the aerosol samples and meltwater samples. The concentrations of SO42−, Na+, Mg2+, and Ca2+ increased by 1.95, 1.44, 3.42, and 3.17 times in the aerosol samples and increased by 1.82, 2.35, 1.91, and 1.59 times in the meltwater samples, respectively. The increases in Mg2+ and Ca2+ in the aerosol samples were the largest, indicating that dust storms largely influenced the chemical composition of the atmosphere and water environment of the glacial area, especially in the atmospheric environment.
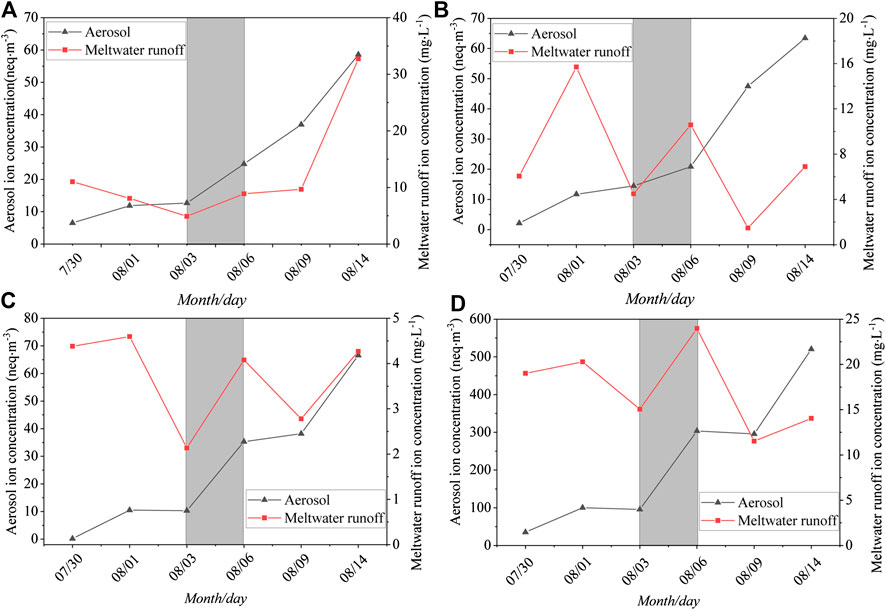
FIGURE 6. Temporal variations in typical ions in aerosol and meltwater runoff samples in 2008. (A) SO42-; (B) Na+; (C) Mg2+; (D) Ca2+.
In the process of a dust storm, if there was no precipitation, a large amount of dust would remain in the atmosphere, and the horizontal diffusion rate would be extremely slow. Approximately one week after the end of the dusty weather, the air cleanliness could be restored to the level it was before the dust storm, so the ion concentration in the atmosphere would not decrease over a short time (Shen and Wen, 1994). However, due to the limited collection of samples, we did not observe that the aerosol returned to the normal levels, and the ion concentration was still high on the 14th.
However, the trend in ion concentration in the meltwater runoff was inconsistent with the change in ion concentration in atmospheric aerosols because of the different factors affecting ion concentration in the two media. The flow of meltwater gradually weakened the effect of dust storms on the water environment, so the ion concentration decreased in a stepwise manner. Also, the sampling point was surrounded by a large number of moraines composed of rocks and sand, and the erosion of the meltwater would continuously bring a large amount of sulfate, such as calcium sulfate, dissolved in the water, which hydrolyzed into Ca2+ and SO42−, so there was no significant reduction in SO42−. After August 9, the temperature rose, the upstream glaciers ablated dramatically, the amount of meltwater increased, the flow rate also increased, and the river water erosion on the riverbed strengthened; those caused the ions in the river to increase again. The concentrations of SO42−, Na+, Mg2+, and Ca2+ increased by 3.38, 4.68, 1.54, and 1.22 times, respectively. Among them, the increases in SO42− and Na+ were greater than when the dust storm occurred. This result indicated that when the dust storm event occurred, although the chemical compositions of both the atmospheric environment and water environment in the glaciers were greatly affected by dust storms, the effect of the dust storm on the atmospheric environment was strong, and the impact on the water environment mainly because of temperature rise would cause more glacier melting and then more dust deposited on glacier surface was moved to glacial river by meltwater.
Source Analysis of Water-Soluble Ions in Aerosols
Dust storms had a substantial impact on the atmospheric environment of the glacial area because the materials in the area would be carried to the glacial area by air masses, including some sources of anthropogenic pollution, such as NO3− and NH4+. Subsequently, the chemical composition of the water environment in the glacial area was affected by the dry and wet deposition of dust aerosols. Therefore, the primary sources of dust aerosols were analyzed by correlation analysis and principal component analysis.
Correlation coefficients among the main water-soluble ions are presented in Table 1. Significant positive correlation coefficients were found between Ca2+ and Mg2+ (r = 0.99) and Ca2+ and SO42− (r = 0.98), which indicated that these two species might come from the same source. High Ca2+ was a tracer of dust from desert and loess areas in Asia (Dong and Li, 2011; Zhao et al., 2011). For Ca2+ and SO42−, because the Tianshan Mountains were surrounded by a large number of deserts and Gobi, the calcium-rich minerals in the desert were usually CaCO3, CaSO4, or a mixture of CaCO3, CaSO4, and silicates. Meanwhile, when the air masses passed from west to east or from south to north through the desert, these air masses would bring a large amount of sand and stone grains rich in Ca2+ and Mg2+ (Okada and Kai, 2004). In addition to the surrounding desert and soil, the soil in the middle of the Caspian Sea and the Aral Sea west of the Tianshan Mountains may also be one of the primary sources of Ca2+ in this area (Claquin et al., 1999). Furthermore, there were many evaporite sedimentary zones between the Aral Sea and Kuzul Kum Desert in the Western Tianshan Mountains, in which the sulfate (including gypsum) content was relatively rich (Kreutz and Sholkovitz, 2000). Besides, the oxidation of sulfur dioxide from coal combustion for industrial production was another possible source of SO42−. The equivalent concentration ratio of SO42-/Ca2+ described by Ming et al. (2007) was calculated to distinguish SO42− from anthropogenic sources or natural sources. The values of SO42−/Ca2+ in our study only ranged from 0.08 to 0.19. Thus, the SO42− in our samples mainly originated from natural processes.
In addition, significant positive correlation coefficients were also found among Ca2+, Na+ and Cl−, Ca2+, and Cl− (r = 0.93), Ca2+ and Na+ (r = 0.99), and Na+ and Ca2+ (r = 0.94), suggesting that they may have had the same desert source as Ca2+. An analysis of aerosol samples collected in the Taklimakan Desert found that halite (NaCl) particles were more commonly discovered in sand and dust (Okada and Kai 2004). Early research also showed that Na+ and Cl− rich dust originated from extensive evaporate deposits from surrounding salt lakes. K+ might also be derived from the same source because it was more highly correlated with Na+ (r = 0.83).
NH4+ and NO3− showed significant positive correlation coefficients (r = 0.73) but had a weak correlation with other ions. NH4+ came from wet or dry deposited gaseous NH3 or was neutralized with sulfuric acid, nitric acid, and hydrochloric acid to form ammonium hydrogen sulfate (NH4HSO4), ammonium nitrate (NH4NO3), and ammonium chloride (NH4Cl). The neutralization progress was accomplished by particle gas formation and gas-to-particle conversion (Ianniello et al., 2011). The potential sources for NH4+ near the glacier areas were human agriculture activities such as fertilizer use, animal farming, and organic matter decomposition (Verma et al., 2010). NO3− was almost the reaction product of NOx emissions, while NOx emissions were mainly caused by biomass burning and fossil fuel combustion (Wang et al., 2006; Wu et al., 2006). Wensu County, where Qingbingtan Glacier No. 72 is located, was dominated by agriculture, and animal husbandry was the second most important factor. NOx and NH3 were produced by frequent farming and animal husbandry activities, strong decomposition of animal excreta, the use of chemical fertilizers, and traffic emissions. Therefore, in this study, the weaker correlation between the two and other ions may indicate that they had different sources compared to other ions, mainly related to anthropogenic pollution.
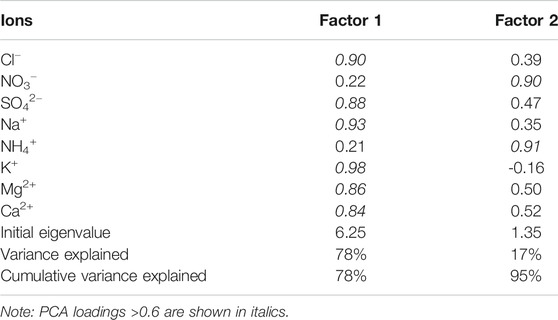
To further determine the possible sources of various ions, the principal component analysis (PCA) was performed. SPSS 22.0 software was used to conduct PCA analysis for water-soluble ions for Glacier No. 72. Detailed information is presented in Table 2. Principal components (PCs) extracted with Varimax rotation provided a clearer variable loading mode in factors, making data easier to interpret (Xu et al., 2017). Two PCs were extracted from the rotated component matrix for the PCA. The first factor displayed high loadings of Ca2+, Mg2+, K+, Na+, Cl−, and SO42−, with a total variance of 78%. Studies have shown that these soluble ions may come from natural sources such as deserts and loess soils (Zhang and Edwards, 2011). The second factor was related to NO3− and NH4+, with a total variance of 17%. The result indicated that the two ions were derived from anthropogenic activities and had a strong correlation coefficient. This finding was consistent with the correlation analysis results.
Transport Path and Potential Sources of Aerosols
Hybrid Single-Particle Lagrangian Integrated Trajectory from the Air Resources Lab of National Oceanic and Atmospheric Administration has been widely used (Draxler and Rolph, 2003; Zhang et al., 2016) to identify potential source regions and transport pathways of aerosols. To interpret the source of water-soluble ions in aerosols before and after the dust storm in this study, the five-day backward trajectory analysis started at 500 m from the sampling site was performed by using GIS-based software TrajStat model (Wang et al., 2009). The backward air trajectories were simulated with a daily resolution. Trajectories were calculated at the end of 00:00, 06:00, 12:00, and 18:00 (UTC) each day. The Global Data Assimilation System (GDAS) date (1.0° × 1.0°) of the corresponding time period provided by NCEP was adopted to simulate the daily backward trajectories. The trajectories for air masses reaching the sampling site are plotted in Figure 7. During the dust event, air masses originated from the arid regions of the Eastern European plains, Kazakhstan and Kyrgyzstan. Affected by the westerlies, the cold air masses that were further developed by the low pressure in the southern Xinjiang basin invaded from the Eastern European Plain to the southeast. This meteorological condition led to the occurrence of the dust storm event (Yang et al., 2006). In addition to dust storms, the air masses descended from the northwest could bring more sand and dust to the glacial area. This was because there were a large number of deserts in the area where the air masses passed, including the Muyunkum desert and Sary Ishkotrau desert. In addition, the pollutants produced by human activities could be carried to the Tomur peak glacial area, including Glacier No. 72, by the air masses. Thus, the concentrations of Ca2+, Mg2+, SO42−, and NO3− were very high. To corroborate the inference, the variation of wind direction on different isobaric surfaces was calculated in Figure 8. Figure 8 indicated that the prevailing wind at Glacier No. 72 was northwesterly with a higher wind speed, which further confirmed the impact of Central Asia on the glacier.
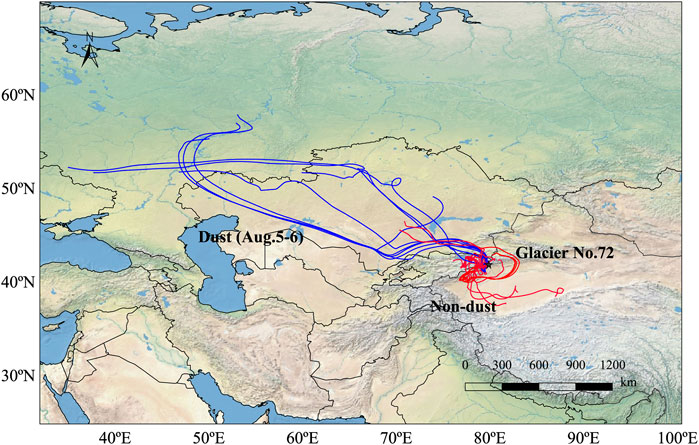
FIGURE 7. Analysis of the 5-day air mass back trajectories with beginning heights at 500 m above ground level at Glacier No. 72 during the sampling periods (July 2008 to August 2008).
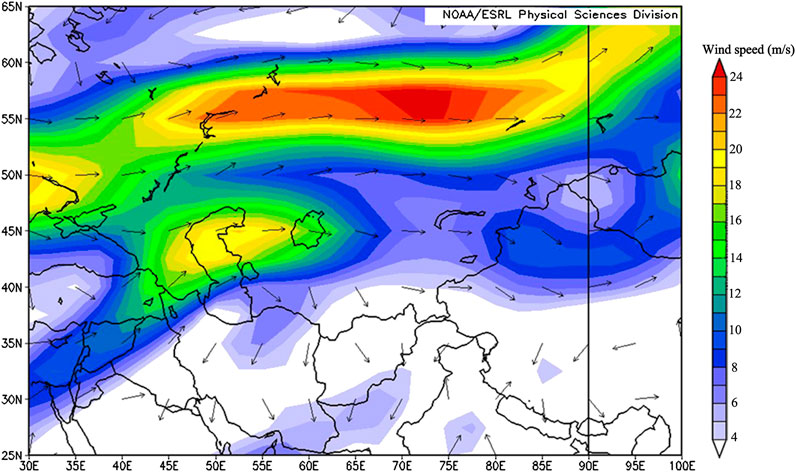
FIGURE 8. The wind stream of the 700 hPa isobaric surface (August 5–7, 2008) over Glacier No. 72 and the surrounding regions, based on NCEP/NCAR reanalysis (shadowing indicates the wind speed, and arrows indicate the wind direction).
In the nondust period, according to their origins and paths, all the trajectories could be divided into two categories: northwest and southeast. The northwest route mainly originated from Kazakhstan, and the deserts were widely distributed in the route area. The air masses mainly transported a lot of dust particles to the glacial area of Mount Tomur through low-altitude transmissions. The southeast route was mainly affected by the summer monsoon. Although the water vapor carried by the northward movement of the summer monsoon decreased gradually, the dust from the Taklimakan Desert could still be brought to the glacier area during the northward movement of the summer monsoon. Moreover, when they passed through some areas with intensive human activities and heavy industries, such as Kashi, Karamay, and the other regions, some anthropogenic pollutants in these areas could still be carried to the surfaces of the glaciers at high altitudes, which would lead to increases in the concentrations of SO42−, NO3−, and Ca2+. However, overall, the impact on the glacial environment was relatively nonsignificant.
In this study, the backward air mass trajectory analysis indicated that, in both dust and nondust periods, although the origins of the air mass trajectories were different, they mainly originated from both the northwest and southeast directions, which was consistent with the prevailing westerly circulation in the region.
Conclusion
In situ and intensive measurements of aerosol and meltwater samples conducted from July 31 to August 14, 2008, provide the first information of aerosols over Glacier No. 72 on Mount Tomur in southern Tianshan and further our understanding of the characteristics of dust aerosol in this region. Although Dong and Li, (2011) and Zhang et al. (2012) studied the chemical composition of the snowpack at Glacier No. 72, no aerosols data in Mount Tomur were found. Dust storms caused the ion concentrations in both the atmosphere and meltwater of Glacier No. 72 to increase significantly, but the subsequent change trends were different, mainly because of the various influencing factors. The change of ion concentration in atmospheric aerosol was mainly affected by dust storm, while the change of ion concentration in glacial meltwater was mainly affected by the change of temperature. When the dust storm event occurred, although the chemical compositions of both the atmospheric environment and the water environment in the glaciers were affected, the atmospheric environment was more affected by dust storms. During the dust storm period, the backward trajectory analysis showed that air masses originated from Eastern Europe and Siberia. Strong wind and cold weather could not only bring dust and anthropogenic pollutants from Central Asia to the glacial areas but also cause regional dust storms due to the formation of unstable temperature stratification in southern Xinjiang, which would lead to the further increase in natural source ions in the glacial areas. During the nondust storm period, the air masses originated from Kazakhstan and Kyrgyzstan in Central Asia. These air masses could bring part of the dust material to the glacial area, but the extent was not large and could not cause strong regional dust storm events.
Data Availability Statement
The datasets generated for this study are available on request to the corresponding author.
Author Contributions
ZL designed the experiments; the intensive and simultaneous sampling for aerosol and meltwater were conducted by PZ; CZ wrote the manuscript in consultation with XZ (4th author), SM, and XZ (5th author).
Funding
This work was supported by The Second Tibetan Plateau Scientific Expedition and Research (2019QZKK0201), the Strategic Priority Research Program of Chinese Academy of Sciences (Class A) (XDA20060201; XDA20020102), the National Natural Science Foundation of China (41761134093; 41471058), and The SKLCS founding (SKLCS-ZZ-2020).
Disclaimer
Frontiers Media SA remains neutral with regard to jurisdictional claims in published maps and institutional affiliations.
Conflict of Interest
The authors declare that the research was conducted in the absence of any commercial or financial relationships that could be construed as a potential conflict of interest.
Acknowledgments
The authors would like to thank PZ for the sampling and YuMan Zhu, QiuFang Bao, and YaPing Liu for the chemical analyses.
Supplementary Material
The Supplementary Material for this article can be found online at: https://www.frontiersin.org/articles/10.3389/feart.2020.527663/full#supplementary-material.
References
Arimoto, R., Duce, R. A., Savoie, D. L., et al. (1996). Relationships among aerosol constituents from Asia and the North Pacific during PEM-West A. J. Geophys. Res. 101, 2011–2023. doi:10.1029/95JD01071
Chow, J. C., Watson, J. G., Lowenthal, D. H., and Magliano, K. L. (2008). Size-resolved aerosol chemical concentrations at rural and urban sites in Central California, USA. Atmos. Environ. 90, 243–252. doi:10.1016/j.atmosres.2008.03.017
Claquin, T., Schulz, M., and Balkanski, Y. J. (1999). Modeling the mineralogy of atmospheric dust sources. J. Geophys. Res.: Atmosphere. 104 (D18), 22243–22256. doi:10.1029/1999JD900416
Dong, Z., and Li, Z. (2011). Characteristics of atmospheric dust deposition in snow on Glacier No. 72, Mt. Tuomuer, China. Arctic Antarct. Alpine Res. 43 (4), 517–526. doi:10.1657/1938-4246-43.4.517
Dong, Z., Li, Z., Wang, F., and Zhang, M. (2009). Characteristics of atmospheric dust deposition in snow on the glaciers of the Eastern Tien Shan, China. J. Glaciol. 55 (193), 797–804. doi:10.3189/002214309790152393
Dong, Z., Li, Z., Xiao, C., Zhang, M., and Wang, F. (2010). Characteristics of aerosol dust in fresh snow in the Asian dust and non-dust periods at Urumqi Glacier No. 1 of eastern Tian Shan, China. Environ. Earth Sci. 60, 1361–1368. doi:10.1007/s12665-009-0271-6
Dong, Z., Li, Z., Wang, W., Li, K., and Zhou, P. (2013). Characteristics of atmospheric dust deposition in snow on Glacier No. 4, Mt Bogeda, China. Environ. Earth Sci. 70, 1423–1433. doi:10.1007/s12665-013-2228-z
Dong, Z., Qin, D., Chen, J., Qin, X., Ren, J., Cui, X., et al. (2014a). Physicochemical impacts of dust particles on alpine glacier meltwater at the Laohugou Glacier basin in western Qilian Mountains, China. Sci. Total Environ. 493, 930–942. doi:10.1016/j.scitotenv.2014.06.025
Dong, Z., Qin, D., Kang, S., Ren, J., Chen, J., Cui, X., et al. (2014b). Physicochemical characteristics and sources of atmospheric dust deposition in snow packs on the glaciers of western Qilian Mountains, China. Tellus B. 66 (1), 20956. doi:10.3402/tellusb.v66.20956
Dong, Z., Kang, S., Qin, D., Li, Y., Wang, X., Ren, J., et al. (2016). Provenance of cryoconite deposited on the glaciers of the Tibetan Plateau: new insights from Nd-Sr isotopic composition and size distribution. J. Geophys. Res.: Atmosphere. 121 (12), 7371–7382. doi:10.1002/2016JD024944
Draxler, R. R., and Rolph, G. (2003). HYSPLIT (HYbrid single-particle Lagrangian integrated trajectory) model access via NOAA ARL READY. Silver Spring, Maryland: NOAA Air Resources Laboratory
Du, Z., Xiao, C., Liu, Y., and Wu, G. (2015). Geochemical characteristics of insoluble dust as a tracer in an ice core from Miaoergou Glacier, east Tien Shan. Global Planet. Change. 127, 12–21. doi:10.1016/j.gloplacha.2015.01.011
Du, Z., Xiao, C., Liu, Y., Yang, J., and Li, C. (2017). Natural vs. anthropogenic sources supply aeolian dust to the Miaoergou Glacier: evidence from Sr-Pb isotopes in the eastern Tienshan ice core Part B. Quat. Int. 430, 60–70. doi:10.1016/j.quaint.2015.11.069
Duce, R. A., Liss, P. S., Merrill, J. T., Atlas, E. L., Buat-Menard, P., Hicks, B. B., et al. (1991). The atmospheric input of trace species to the world ocean. Global Biogeochem. Cycles. 5, 193–259. doi:10.1029/91GB01778
Goudie, A. S. (2014). Desert dust and human health disorders. Environ. Int. 63, 101–113. doi:10.1016/j.envint.2013.10.011
Griffin, D. W. (2007). Atmospheric movement of microorganisms in clouds of desert dust and implications for human health. Clin. Microbiol. Rev. 20 (3), 459–477. doi:10.1128/CMR.00039-06Clin
Ianniello, A., Spataro, F., Esposito, G., Allegrini, I., Hu, M., and Zhu, T. (2011). Chemical characteristics of inorganic ammonium salts in PM2.5 in the atmosphere of Beijing (China). Atmos. Chem. Phys. 11, 10803–10822. doi:10.5194/acp-11-10803-2011
Kaspari, S., McKenzie Skiles, S., Delaney, I., and Dixon, D. A. (2015). Accelerated glacier melt on snow Dome, Mt. Olympus, Washington, USA due to deposition of black carbon and mineral dust from wildfire. J. Geophys. Res.: Atmosphere. 120, 2793–2807. doi:10.1002/2014JD022676
Kedia, S., Kumar, R., Islam, S., Sathe, Y., and Kaginalkar, A. (2018). Radiative impact of a heavy dust storm over India and surrounding oceanic regions. Atmos. Environ. 185, 109–120. doi:10.1016/j.atmosenv.2018.05.005
Kreutz, K. J., and Sholkovitz, E. R. (2000). Major element, rare earth element, and sulfur isotopic composition of a high elevation firn core: sources and transport of mineral dust in Central Asia. G-cubed. 1, 2000GC000082. doi:10.1029/2000GC000082
Kumar, A., Bhambri, R., Tiwari, S. K., Verma, A., Gupta, A. K., and Kawishwar, P. (2019). Evolution of debris flow and moraine failure in the Gangotri Glacier region, Garhwal Himalaya: hydro-geomorphological aspects. Geomorphology 333, 152–166. doi:10.1016/j.geomorph.2019.02.015
Li, X. Y., Ding, Y. J., Liu, Q., Zhang, Y., Han, T. D., et al. (2019). Intense chemical weathering at glacial meltwater-dominated Hailuogou basin in the southeastern Tibetan plateau. Water. 11, 1209. doi:10.3390/w11061209
Li, Z., Zhao, S., Edwards, R., Wang, W., and Zhou, P. (2011). Characteristics of individual aerosol particles over Ürümqi Glacier No.1 in eastern Tianshan, central Asia, China. Atmos. Res. 99 (1), 57–66. doi:10.1016/j.atmosres.2010.09.001
Liu, B., Pui, D., and Rubow, K. (1984). “Characteristics of air sampling filter media,” In Aerosols in the mining and industrial work environments. Editors V. A. Marple and B. Y. H. Liu (Instrumentation, Butterworth-Heinemann, Newton, Mass), 3, 989–1038.
Ming, J., Zhang, D., Kang, S., and Tian, W. (2007). Aerosol and fresh snow chemistry in the east Rongbuk Glacier on the northern slope of Mt. Qomolangma (Everest). J. Geophys. Res. 112, D15307. doi:10.1029/2007JD008618
Okada, K., and Kai, K. J. (2004). Atmospheric mineral particles collected at Qira in the Taklamakan Desert, China. Atmos. Environ. 38, 6927–6935. doi:10.1016/j.atmosenv.2004.03.078
Ramanathan, V., Crutzen, P. J., Kiehl, J. T., and Rosenfeld, D. (2001). Aerosols, climate, and the hydrological cycle. Science. 294, 2119–2124. doi:10.1126/science.1064034
Seinfeld, J. H., Bretherton, C., Carslaw, K. S., Coe, H., DeMott, P. J., Dunlea, E. J., et al. (2016). Improving our fundamental understanding of the role of aerosol-cloud interactions in the climate system. Proc. Natl. Acad. Sci. U.S.A. 113 (21), 5781–5790. doi:10.1073/pnas.1514043113
Seinfeld, J. H., and Pandis, S. N. (2012). Atmospheric chemistry and physics: from air pollution to climate change. Environment. 40 (7), 26. doi:10.1080/00139157.1999.10544295
Shen, Z. B., and Wen, J. (1994). The atmospheric turbidity and the influence of the dust atmosphere on the surface radiation balance in desert in region spring. Plateau Meteorol. 13 (3), 330–338.
Sun, J., Qin, D., Mayewski, P. A., Dibb, J. E., Whitlow, S., Li, Z., et al. (1998). Soluble species in aerosol and snow and their relationship at Glacier 1, Tien Shan, China. J. Geophys. Res. 103 (D21), 28021–28028. doi:10.1029/98JD01802
Tang, Y., Han, Y., Ma, X., and Liu, Z. (2018). Elevated heat pump effects of dust aerosol over northwestern China during summer. Atmos. Res. 23, 95–104. doi:10.1016/j.atmosres.2017.12.004
Verma, S. K., Deb, M. K., Suzuki, Y., and Tsai, Y. I. (2010). Ion chemistry and source identification of coarse and fine aerosols in an urban area of eastern central India. Atmos. Environ. 95, 65–76. doi:10.1016/j.atmosres.2009.08.008
Wake, C. P., Mayewski, P. A., and Spencer, M. J. (1990). A review of central Asian glaciochemical data. Ann. Glaciol. 14, 301–306. doi:10.1017/S026030550000879X
Wake, C. P., Mayewski, P. A., Li, Z., Han, J., and Qin, D. (1994). Modern eolian dust deposition in central Asia. Tellus Ser. B Chem. Phys. Meteorol. 46 (3), 220–223. doi:10.1034/j.1600-0889.1994.t01-2-00005.x
Wang, Y., Zhuang, G., Zhang, X., Huang, K., Xu, C., Tang, A., et al. (2006). The ion chemistry, seasonal cycle, and sources of PM 2.5 and TSP aerosol in Shanghai. Atmos. Environ. 40, 2935–2952. doi:10.1016/j.atmosenv.2005.12.051
Wang, Y., Zhang, X., and Draxler, R. (2009). TrajStat: GIS-based software that uses various trajectory statistical analysis methods to identify potential sources from long-term air pollution measurement data. Environ. Model. Software. 24, 938–939. doi:10.1016/j.envsoft.2009.01.004
Wang, X., Doherty, S. J., and Huang, J. (2013). Black carbon and other light-absorbing impurities in snow across northern China. J. Geophys. Res.: Atmosphere. 118, 1471–1492. doi:10.1029/2012JD018291
Wang, W., Sheng, L., Jin, H., and Han, Y. (2015). Dust aerosol effects on cirrus and altocumulus clouds in northwestern China. J. of Meteoro. Res. 29, 793–805. doi:10.1007/s13351-015-4116-9
Wu, D., Tie, X., and Deng, X. (2006). Chemical characterizations of soluble aerosols in southern China. Chemosphere. 64, 749–757. doi:10.1016/j.chemosphere.2005.11.066
Xu, J., Yu, G., Kang, S., Hou, S., Zhang, Q., Ren, J., et al. (2012). Sr-Nd isotope evidence for modern aeolian dust sources in mountain glaciers of western China. J. Glaciol. 58 (211), 859–865. doi:10.3189/2012JoG12J006
Xu, J., Xu, M., Snape, C., He, J., Behera, S. N., Xu, H., et al. (2017). Temporal and spatial variation in major ion chemistry and source identification of secondary inorganic aerosols in northern Zhejiang Province, China. Chemosphere. 179, 316–330. doi:10.1016/j.chemosphere.2017.03.119
Yang, L., Zhang, G., and Yang, Q. (2006). Circulation dynamical structure of sand-storm caused by cold air crossing mountains in southern Xinjiang. J. Desert Res. 26 (1), 71–76.
Yang, Y., Zhou, R., Yan, Y., Yu, Y., Liu, J., Du, Z., et al. (2016). Seasonal variations and size distributions of water-soluble ions of atmospheric particulate matter at Shigatse, Tibetan Plateau. Chemosphere. 145, 560–567. doi:10.1016/j.chemosphere.2015.11.065
You, X., and Dong, Z. (2011). Deposition process of dust microparticles from aerosol to snow-firn pack on glacier No. 1 in eastern Tianshan mountains, China. J. Earth Sci. 22 (4), 460–469. doi:10.1007/s12583-011-0200-y
Yu, G., Xu, J., Kang, S., Zhang, Q., Huang, J., Ren, Q., et al. (2013). Lead isotopic composition of insoluble particles from widespread mountain glaciers in western China: natural vs. anthropogenic sources. Atmos. Environ. 75 (4), 224–232. doi:10.1016/jorg/.atmosenv.2013.04.018
Zhang, L. T., and Chen, J. S. (2000). The relationship between the composition of the major ion of river of China and regional natural factors. Sci. Geogr. Sin. 20 (3), 236–240. doi:10.13249/j.cnki.sgs.2000.03.007
Zhang, N., Cao, J., Ho, K., and He, Y. (2012). Chemical characterization of aerosol collected at Mt. Yulong in wintertime on the southeastern Tibetan Plateau. Atmos. Res. 107, 76–85. doi:10.1016/j.atmosres.2011.12.012
Zhang, X., and Edwards, R. (2011). Anthropogenic sulfate and nitrate signals in snow from glacier of Mt. Bogda, eastern Tianshan. J. Earth Sci. 22 (4), 490–502. doi:10.1007/s12583-011-0196-3
Zhao, S. H., Li, Z. Q., and Zhou, P. (2011). Ion chemistry and individual particle analysis of atmospheric aerosols over Mt. Bogda of eastern Tianshan Mountains, Central Asia. Environ. Monit. Assess. 180, 409–426. doi:10.1007/s10661-010-1796-6
Zhang, X., Li, Z., Zhou, P., Wang, S. J., et al. (2016). Characteristics and source of aerosols at Shiyi Glacier, Qilian mountains, China. Sciences in Cold and Arid Regions. 8 (2), 0135–0146. doi:10.3724/SP.J.1226.2016.00135
Zhang, Q., Sun, X., Sun, S., Yin, X., Huang, J., Cong, Z., et al. (2019). Understanding mercury cycling in Tibetan glacierized mountain environment: recent progress and remaining gaps. Bull. Environ. Contam. Toxicol. 102, 672–678. doi:10.1007/s00128-019-02541-0
Zhao, Z., and Li, Z. (2004). Determination of soluble ions in atmospheric aerosol by ion chromatography. Mod. Sci. Instrum. 5, 46–49.
Keywords: qingbingtan glacier No 72, dust storms, atmospheric aerosol, meltwater, sources
Citation: Zheng C, Li Z, Zhou P, Zhang X, Zhou X and Ma S (2021) Physicochemical Impacts of Dust Storms on Aerosol and Glacier Meltwater on the Northern Margin of the Taklimakan Desert. Front. Earth Sci. 8:527663. doi: 10.3389/feart.2020.527663
Received: 17 January 2020; Accepted: 16 December 2020;
Published: 28 January 2021.
Edited by:
Khanghyun Lee, Korea Polar Research Institute, South KoreaReviewed by:
Zhiwen Dong, Chinese Academy of Sciences (CAS), ChinaJizu Chen, Chinese Academy of Sciences (CAS), China
Ramanathan Alagappan, Jawaharlal Nehru University, India
Copyright © 2021 Zheng, Li, Zhou, Zhang, Zhou and Ma. This is an open-access article distributed under the terms of the Creative Commons Attribution License (CC BY). The use, distribution or reproduction in other forums is permitted, provided the original author(s) and the copyright owner(s) are credited and that the original publication in this journal is cited, in accordance with accepted academic practice. No use, distribution or reproduction is permitted which does not comply with these terms.
*Correspondence: Zhongqin Li, bGl6cUBsemIuYWMuY24uY29t
 Cunying Zheng
 Zhongqin Li1,3,4*
 Xi Zhou