- 1Department of Earth and Environmental Sciences, The University of Manchester, Manchester, United Kingdom
- 2Geological Survey of Japan, National Institute of Advanced Industrial Science and Technology, Tsukuba, Japan
- 3Istituto Nazionale di Geofisica e Vulcanologia, Osservatorio Etneo, Catania, Italy
- 4Instituto Nicaragüense de Estudios Territoriales, Frente a Policlínica Oriental, Managua, Nicaragua
High precision and accuracy in volcanic SO2 emission rate quantification is critical for eruption forecasting and, in combination with in-plume gas ratios, quantifying global volcanic emission inventories. Light dilution, where scattering of ultraviolet light dilutes plume SO2 absorbance signals, has been recognized for more than 50 years, but is still not routinely corrected for during gas flux quantification. Here we use modeling and empirical observations from Masaya volcano, Nicaragua, to show that light dilution produces: i) underestimates in SO2 that can reach a factor of 5 and, at low column densities, cause little impact on standard retrieval fit quality, even for heavily diluted spectra; ii) retrieved SO2 amounts that are capped by a maximum value regardless of the true amount of SO2, with this maximum amount being reduced as light dilution increases. Global volcanic volatile emission rates may therefore be significantly underestimated. An easily implementable dual-waveband analysis provides a means to detect, and in clear sky conditions, correct dilution effects directly from the spectra, opening a path to more accurate SO2 quantifications.
Introduction
Emission rates of volcanic gases, and their relative abundances, provide valuable insights into the magma dynamics that drive volcanic activity (e.g., Malinconico Jr, 1979; Sutton et al., 2001; Oppenheimer et al., 2003; Caltabiano et al., 2004). Sulfur dioxide is the most commonly measured of these gases due to its low background atmospheric concentration and strong spectral ultraviolet absorption features (Platt et al., 2018). Combining SO2 emission rate with volcanic gas ratios produces an estimate of all major plume emissions (e.g., Burton et al., 2000; Aiuppa et al., 2008; Martin et al., 2010; Sawyer et al., 2011). Volcano observatories monitor unrest and attempt to forecast eruptions by integrating such gas measurements with other data streams. Once released, these gases directly impact climate (e.g., Robock, 2000), global volatile cycles (e.g., Wong et al., 2019) and local air quality (e.g., Delmelle et al., 2002), further increasing the importance of accurate quantification.
SO2 flux was originally obtained using correlation spectrometers (e.g., Moffat and Millan, 1971; Williams-Jones et al., 2008), but today is more commonly measured using miniature spectrometers (e.g., Galle et al., 2003; Elias et al., 2006). These spectrometers are small, lightweight, and capable of recording moderate-resolution spectra (∼0.5–1.0 nm). Spectra are usually analyzed with differential optical absorption spectroscopy (DOAS), retrieving an SO2 slant column density (SCD) (Platt and Stutz, 2008). Operators traverse beneath or scan across the volcanic plume, creating a cross-section from multiple SCD measurements (e.g., Williams-Jones et al., 2008; Platt et al., 2018). Multiplying a plume SO2 cross-section by the wind velocity then produces an instantaneous flux. Observatories can also construct SO2 cross-sections autonomously using zenith pointing spectrometer arrays (Elias et al., 2018) or permanent scanning stations (e.g., Edmonds et al., 2003). Scanning networks are more widespread, including the FLAME network on Sicilian active volcanoes (Salerno et al., 2009a), and the NOVAC network (Galle et al., 2010) which covers 37 volcanoes as of June 2018 (https://novac-community.org/). Researchers have argued that while exact emission rate quantification by scanning networks may be inaccurate, all large changes important for monitoring are observable (e.g., de Moor et al., 2017). Key sources of uncertainty in emission rate quantification are spectroscopic effects, plume velocity, radiative transfer, and in the case of scanners, plume height.
There are two different radiative transfer corrections required, namely for “multiple scattering” and “light dilution” (Bobrowski et al., 2010; Kern et al., 2010). These phenomena are caused by photons interacting with molecules and particles in the air, causing them to scatter elastically (Rayleigh) or inelastically (Raman) (Figure 1). Multiple scattering occurs in volcanic plumes where large amounts of ash, water vapor or aerosol are present. With more of these particles, photons passing through a plume have a greater chance of scattering, increasing their travel distance inside the plume relative to the idealized linear path, allowing more absorption to occur. Conversely, the path length could decrease when photons cannot penetrate the center of the plume due to high opacity.
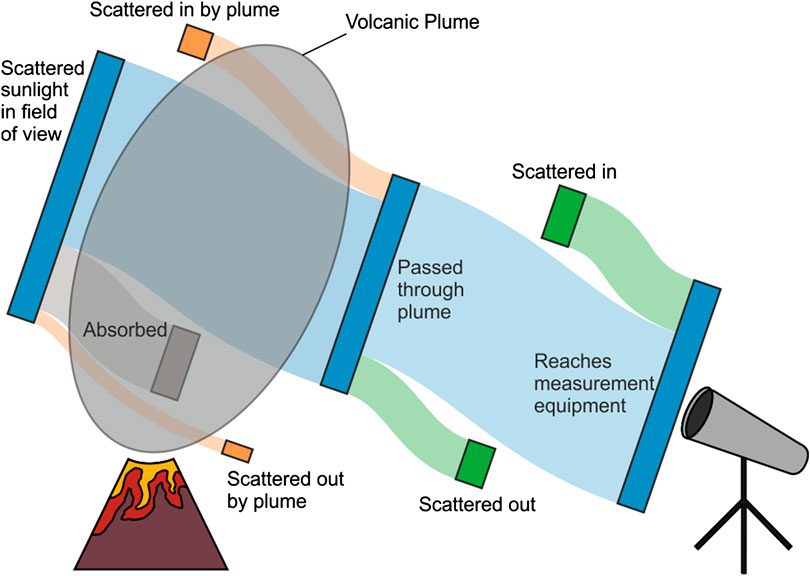
FIGURE 1. Scattered sunlight (blue) in the field of view of the instrument does not all arrive at the measuring device. Gases in the plume (gray) absorb some of the light. Radiative transfer effects in the plume such as single and multiple scattering by aerosols (orange) also affect how much light reaches the other side. Once out of the plume, photons can be scattered by ambient aerosols and molecules between the plume and the equipment, causing the light dilution effect (green). In general, the impact of light dilution is greater when the distance and opacity of the plume is greater.
Light dilution arises when photons that have not passed through the plume are scattered into the field of view. While a high aerosol loading of the air between the plume and the detector increases the effect, even a clear atmosphere can cause significant underestimation of the observed SO2 SCD (Moffat and Millan, 1971; Mori et al., 2006). First-order correction of the dilution relies on its distance-dependence, using simultaneous measurements of the plume from multiple locations (e.g., Bluth et al., 2007; Vogel et al., 2011; Ilanko et al., 2019). Other studies shift their measurements to a higher wavelength range, where both the SO2 absorption and scattering efficiency are lower, reducing, but not eliminating, the impact (e.g., Bobrowski et al., 2010; Gliß et al., 2015; Fickel and Granados, 2017).
A more thorough correction utilizes full Monte-Carlo photon simulations of the measurement radiative transfer conditions at a single location (Weibring et al., 2002; Kern et al., 2010). These models reveal that dilution dominates over multiple scattering for largely transparent plumes observed at a distance of several kilometers. They, however, do not directly reveal how light dilution affects the spectrum fitting process. Later literature addresses this point (Kern et al., 2012), though the method proposed requires either significant a priori knowledge or automatic iteration of lighting conditions, plume geometry and atmospheric properties to correct a spectrum. In practice, this has prevented widespread usage of such models (Arellano et al., 2017). As dilution is the most significant radiative transfer correction required under favorable conditions, a simple, practical method that can detect and quantify the light dilution directly from spectra would be of great benefit.
When light dilution occurs it manifests as a systematic discrepancy in retrieved SO2 SCDs from different analysis wavelength windows (Mori et al., 2006). The difference between the SCDs retrieved for each waveband, however, is significantly greater than expected from the difference in scattering efficiency alone. In this paper, we also use a dual-waveband approach to identify light dilution occurring, but develop this further using an adapted version of “iFit” (Esse et al., 2020) to model light dilution impacts on the spectra recorded and the retrieved SO2 SCD. We select the wavebands 306–316 nm (W1) and 312–322 nm (W2) for our analysis. The model allows us to probe the effect light dilution has on a recorded spectrum, explaining the unexpectedly greater difference between retrieved SCDs observed by Mori et al. (2006). We then diagnose and correct light dilution in campaign measurements at Masaya volcano.
Materials and Methods
Spectral Fitting
Volcanic SO2 retrievals typically use traditional implementations of DOAS, such as QDOAS (Danckaert et al., 2012), DOASIS (Kraus, 2006), or custom-made code. The majority of these implementations require a measured spectrum of the sky, clear of any plume (Galle et al., 2003), though some invoke a modeled reference (Salerno et al., 2009b; Hibert et al., 2015; Lübcke et al., 2016). Broadband and narrowband absorption are typically separated, and the narrowband features of the recorded spectrum in a given wavelength range are matched to reference gas spectra. The optical depth of each gas directly retrieves the SCD of that gas.
In this paper, we use an alternative spectral fitting method called “iFit” (short for intensity fitting) for the majority of our analysis, though comparison to QDOAS is available (see Supplementary Material 1). iFit fits spectra in intensity space rather than optical depth space. It uses a forward model of a high-resolution (0.01 nm) synthetic spectrum calculated from variable physical parameters. These parameters are iteratively adjusted to fit a pre-processed observed spectrum, which has had the dark spectrum, electronic offset and stray light removed. Full details of this approach can be found elsewhere (Esse et al., 2020), and a coded implementation is available on GitHub (Esse, 2019), but a short summary is provided here.
For each spectrum fit, the iFit forward model starts with a high resolution Fraunhofer spectrum (Chance and Kurucz, 2010). This is similar to other modeled reference techniques (Salerno et al., 2009b), but we do not apply an instrument line shape (ILS) at this stage. Solar light undergoes inelastic scattering in the atmosphere, and this is modeled as a pseudo-absorber, often called the Ring spectrum, which we generate using the QDOAS software (Grainger and Ring, 1962; Danckaert et al., 2012). A background polynomial models other scattering effects. We add absorptions from atmospheric and plume gases, namely SO2 (Rufus et al., 2003) and O3 (Gorshelev et al., 2014). Finally, iFit convolves the resulting modeled spectrum with the ILS. This can be summarized with Eq. 1 below:
where
Light Dilution Theory
Light dilution occurs due to the scattering of photons that have not passed through the plume into the spectrometer field of view. As the distance d between plume and spectrometer increases, there is a greater path over which this scattering can occur. For brevity, we define
Light dilution can be adapted in the final measured spectrum
where
This approximation requires that the scattering sunlight behind the plume has an identical spectral shape to that of the scattering sunlight in front of the plume, and that the plume has no effect on the spectrum other than the absorption of SO2. These assumptions may be violated, notably for:
• Scattering in a strongly condensing plume or low visibility atmosphere
• Additional wavelength-dependent absorptions in the plume, such as ash.
• Direct sunlight measurements (plume directly between the spectrometer and the Sun)
Assuming Eq. 4 does hold:
The scattering coefficient
Light dilution can be expressed as the fraction of light that has not passed through the plume relative to the total intensity before plume absorption is considered.
The equation to calculate a diluted spectrum then becomes:
While we used Eq. 7 for our model (i.e., light dilution is expressed as a function of wavelength), we report a light dilution factor (LDF) to aid readability of the extent of light dilution occurring. It is specified as the value of LD(λ) at 310 nm, representing the fraction of
A calculated literature value of
Masaya Field Site
At Masaya volcano, Nicaragua, we collected two sets of measurements: the first using traverses close to the plume for an undiluted measurement as a simple test case of our model, and the other from a static location several kilometers away where light dilution may significantly affect the SO2 retrieval.
For the undiluted case, we conducted six traverses using an Ocean Optics (now Ocean Insight) FLAME-S-UV-VIS spectrometer on the January 13, 2018. The spectrometer’s spectral range is 255–405 nm, with 2,048 pixels and a resolution of ∼0.7 at 300 nm. It connected via optical fiber to a collimating telescope, which has a Hoya U330 visible cut filter to remove unwanted wavelengths above 400 nm. Each measurement is a composite spectrum made of 10 coadded individual spectra with an integration time of 500 ms.
The telescope was affixed to a vehicle and aimed vertically upwards. This vehicle drove along a road approximately 5 km away from the vent and 500 m a.s.l., and collected a composite spectrum every 5 s. In total, we recorded 750 of these spectra from 20:47 to 21:54 UTC (local time UTC-6, solar elevation angle 36°–22°). Simultaneous camera measurements observed the plume traveling horizontally after leaving the crater, spreading between the crater floor and ∼1,000 m a.s.l., hence the traverse plume to spectrometer distance was small (<1 km).
For a diluted example, we used the same spectrometer attached to a fixed tripod located at the Mirador overview point on the January 15, 2018, aimed obliquely toward the volcano. It observed a point ∼300 m above the crater wall and ∼700 m downwind of the vent, recording 841 spectra over 70 min from 17:00 to 18:10 UTC (solar elevation angle between 57° and 54°). The plume to spectrometer distance was ∼4.8 km, calculated using the intersection of the spectrometer field of view with the volcano to plume-center bearing obtained from simultaneous traverses conducted using a second spectrometer (Figure 2).

FIGURE 2. (A) Map of Masaya crater with important measurement locations marked. Traverses were conducted along the Ticuantepe road to the West of the volcano (blue line) and a fixed spectrometer was deployed at the Mirador viewpoint. The plume direction (red line) shown is the average location along the road of the plume center of mass (inset shows the location of Masaya volcano within Nicaragua). (B) shows a photograph taken from the Mirador viewpoint with the approximate spectrometer field of view marked.
Modeling the Impact of Light Dilution on Spectra
We produced synthetic spectra with varying SO2 SCDs and light dilution, so they can be analyzed to observe the impact of light dilution on SO2 retrieval. First, a synthetic clear spectrum was created that is representative of the lighting conditions using the forward model (Eq 1), with optimized parameters of a plume-free spectrum captured on location fitted between 305 and 323 nm. This waveband covers the two smaller fitting windows used, with a 1 nm buffer to avoid edge effects. For our analysis, we chose a spectrum captured at 17:43 UTC on the January 15, 2018 from the Mirador viewpoint, and a spectrum captured at 15:05 UTC on the January 13, 2018 from the traverse measurements, primarily because they are clear from plume contamination. We then produced a suite of synthetic spectra using the obtained parameters (Eq. 7), but SO2 SCD is varied in 20 ppm m increments between 0 and 5,000 ppm m and LDF in 0.002 increments between 0 and 0.998. These new spectra were analyzed using the standard iFit approach (Eq. 1) without light dilution. Two different wavebands are used, namely 306–316 nm (W1) and 312–322 nm (W2), and the SO2 SCD retrieved by both was stored (Figure 3) in a lookup grid.
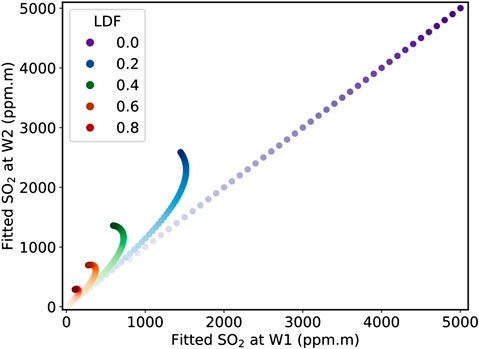
FIGURE 3. Retrieved SO2 slant column densities (SCDs) from the analysis of all synthetic spectra generated by varying input SO2 between 0 and 5,000 ppm m and the light dilution factor (LDF) between 0.0 and 0.8 (here in steps of 0.2 for display purposes). All the synthetic spectra are generated from a single clear spectrum captured from stationary measurements at Masaya volcano and analyzed using the two wavebands W1 (306–316 nm) and W2 (312–322 nm). Darker shading of the points represents increased input SO2 SCD, with the darkest shade always representing 5,000 ppm m, hence the maximum fitted SCD at both wavebands is less than the input SCD at all LDFs greater than 0. Note how light dilution produces an upper limit on measured gas amounts for LDFs greater than 0.2 in this SO2 SCD input range.
Correction of the Light Dilution Effect
All Masaya spectra were then analyzed using the standard iFit procedure using the two wavebands W1 and W2. The SO2 SCDs retrieved at both wavelengths were plotted against each other. Different wavebands should produce different SO2 SCDs if light dilution is present and identical SCDs if it is not.
We used the uncorrected SCDs retrieved from each spectrum to find the location of the data point on the lookup grid (Figure 4). The four bounding points of the lookup table grid are identified, then a best estimate of the LDF and corrected SO2 SCD is obtained from barycentric interpolation using three of the four points that form a bounding triangle. The error of the LDF and SO2 was obtained by finding the first lookup LDF and SO2 grid line that does not contain a point lying within error of the uncorrected measurement SCDs.
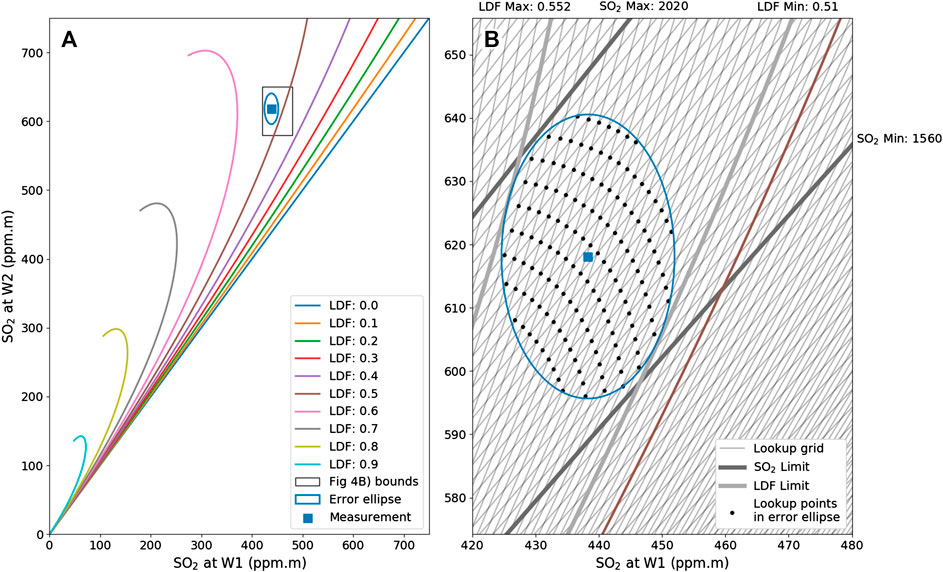
FIGURE 4. (A) A single measurement of SO2 (blue square) at W1 (306–316 nm) and W2 (312–322 nm) is shown with a typical fitting error (blue ellipse). It is plotted on a set of light dilution curves spaced with LDFs between 0 and 0.9. The black box highlights the region of the graph for (B). (B) Shows the full light dilution lookup table. Here, the SO2 grid is spaced every 20 ppm m between 0 and 5,000 ppm m, and LDF is spaced every 0.02 between 0 and 0.998. The intersections of the grid that lie in the error ellipse are plotted. An estimate of the SO2 is made from interpolating the measurement point inside the grid, giving a best estimate of LDF and SO2. An estimate for the error is provided by finding the first line that does not contain a lookup point inside the error ellipse.
Each spectrum was then re-fitted using iFit by including the retrieved LDF in the fitting procedure (using Eq. 7 inside the iFit forward model). SCDs retrieved at the two wavebands should then be equal, providing the inclusion of the LDF term corrects the residual present in the original fit. This process produces a time-series of corrected SO2 SCDs, but the error obtained from the lookup table is kept. Results, however, are largely unconstrained for low uncorrected SO2 SCDs, as the lookup grid is extremely closely spaced close to zero. This means any typical measurement error could cause a large change in retrieved LDF and hence SCD. Therefore, if the uncorrected SO2 point was within two standard deviations of zero for either SO2 SCD at W1 or W2, we recorded the retrieved LDF as invalid, and used an average of the last 20 valid LDFs for the refitting instead.
Results
Modeled Spectra
Our simple model explores the effects of light dilution on the spectral fitting process. A modeled LDF of zero results in an exact correspondence between the analysis windows (Figure 3). This is expected, because for zero LDF, the spectrum creation and fitting functions are identical. In both wavelength windows, any light dilution reduces the measured SO2 SCD, regardless of the original SCD value.
For diluted spectra, as input SO2 SCD increases there is a greater difference measured between the two retrieved SO2 SCDs (Figure 5), with the 306–316 nm waveband obtaining less SO2 than the 312–322 nm waveband. A greater LDF also increases the relative difference. This is the large discrepancy in retrieved SO2 SCD observed between different wavelength windows described by Mori et al. (2006). It arises because absorption is exponential in intensity space (Beer-Lambert Law) while dilution is linear. Where the absorption is stronger, the effect of the exponential is greater, increasing the effect of the linear dilution
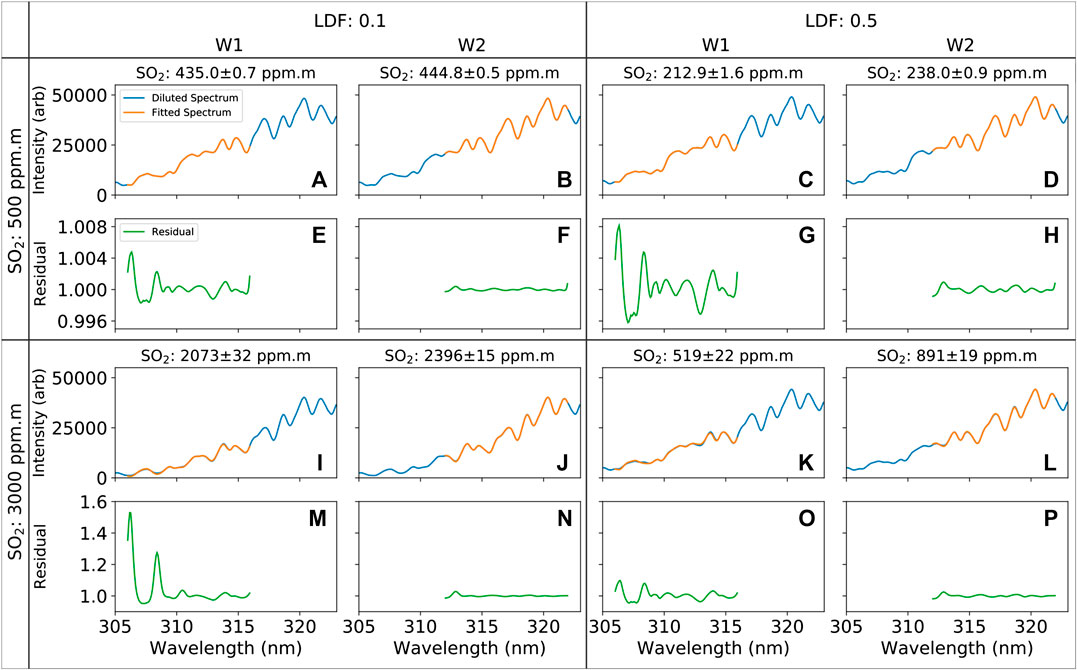
FIGURE 5. Synthetic spectra (blue) are created from a single Masaya spectrum by varying SO2 SCD and LDF in the altered forward model (run between 305 and 323 nm). These spectra are then analyzed using the traditional iFit, creating a fitted spectrum (orange). (A,C,I,K) show fits for W1 (306–316), while (B,D,J,L) show fits for W2 (312–322 nm). The retrieved values are shown above each spectra plot. Residuals of these fits are shown (green), calculated as the synthetic model spectrum divided by the fitted spectrum (E–H,M–P). Note the scale for the residual plots is much larger for the 3,000 than 500 ppm m plots.
Interestingly, at very high SCDs and LDFs, there appears to be an upper limit on observable SO2 SCD (e.g., with an LDF of 0.4 present, SO2 SCDs retrieved at 306–316 nm do not exceed 750 ppm m). This would mean standard retrieval at these wavelengths could not increase in their SO2 reading for the LDF, while producing SCDs that are relatively small, making quantification very inaccurate. In fact, increasing plume SO2 SCD in these cases can decrease the measured values, potentially leading to large underestimates. This surprising result was also produced in Kern et al. (2012) with their more complex radiative transfer modeling of an SO2 plume from Kīlauea.
In this fitting of synthetic spectra during the creation of the model, high residuals do not necessarily correspond with high light dilution values. The largest residuals are instead found with greater SO2 SCD and low non-zero LDFs between 0.1 and 0.2. In contrast, heavily diluted spectra with low SO2 load may not show detectable above-noise residual in a single analysis window. These residuals are important as a smaller residual is more likely to be below noise, and hence undetectable using standard measurement techniques, but the dilution may still be observable as an offset between the retrieved SO2 SCDs when dual-wavebands are used.
Light Dilution During Masaya Passive Degassing Measurements
We next tested the model by comparing two sets of measurements captured from two different distances at the same volcano, aiming to replicate and quantify the increase in light dilution with distance. For our undiluted traverse measurements, analysis with both wavebands produced nearly identical results (Figure 6A), confirming that there was no detectable light dilution in these measurements.
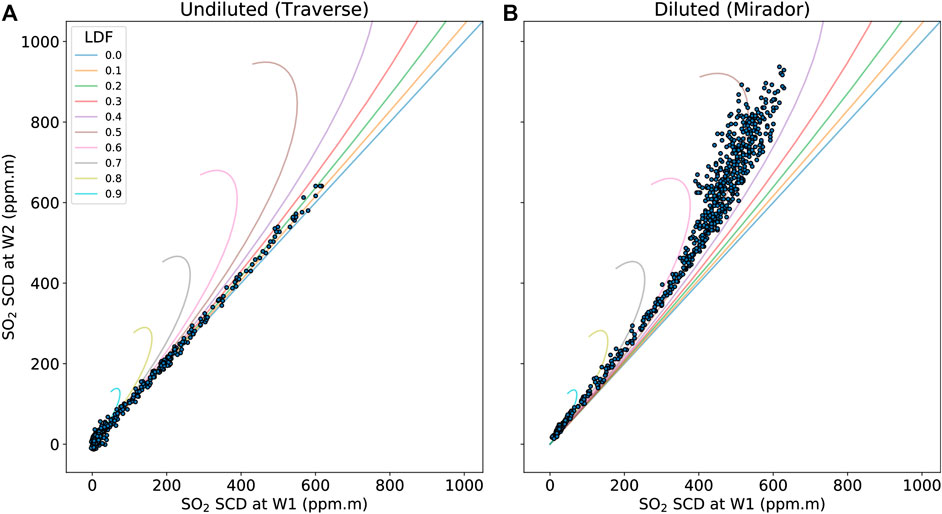
FIGURE 6. Spectra, taken during the road traverses in panel (A), and from Mirador in panels (B), are analyzed using two different wavebands W1 (306–316 nm) and W2 (312–322 nm). The results are then compared to the model output to estimate the light dilution factor occurring, with LDFs displayed every 0.1 (solid lines).
For our diluted oblique measurements, the spectra do not produce a 1:1 agreement between the analysis windows, with analysis using W1 retrieving considerably lower SO2 SCDs than W2 (Figure 6B). The retrieved uncorrected SO2 SCDs are consistent with an LDF of between 0.4 and 0.6, but there is considerable variation in the raw data.
We used the lookup tables to obtain an estimate of the LDF and a possible SO2 range for each spectrum. The raw spectra were then re-fitted using the estimated LDFs. Retrieved SO2 SCDs using the estimated LDFs were almost identical between the two wavebands, suggesting the correction method has successfully removed light dilution (Figure 7). SO2 SCDs are up to 5 times larger than those of the original data, with the maximum SO2 retrieved increasing from 600 for W1 and 900 ppm m for W2 to 3,000 ppm m (Figure 8). The estimated LDF slightly increases with increasing corrected SO2 SCD, possibly due to a slight increase in plume opacity from aerosol and other gas species. There are also longer-scale changes in the LDF, possibly due to changing solar position or atmospheric conditions.
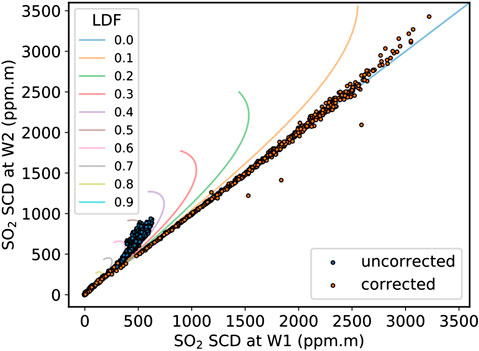
FIGURE 7. Correction of light dilution in spectra captured from Mirador. The original spectra are analyzed using the W1 (306–316 nm) and W2 (312–322 nm) wavebands, retrieving SO2 slant column density (blue dots). The light dilution modeled curves (colored lines for LDFs every 0.1) indicate an LDF of between 0.4 and 0.6 is occurring. We then reanalyze the spectra with the LDF determined from the lookup table at both wavebands (orange).
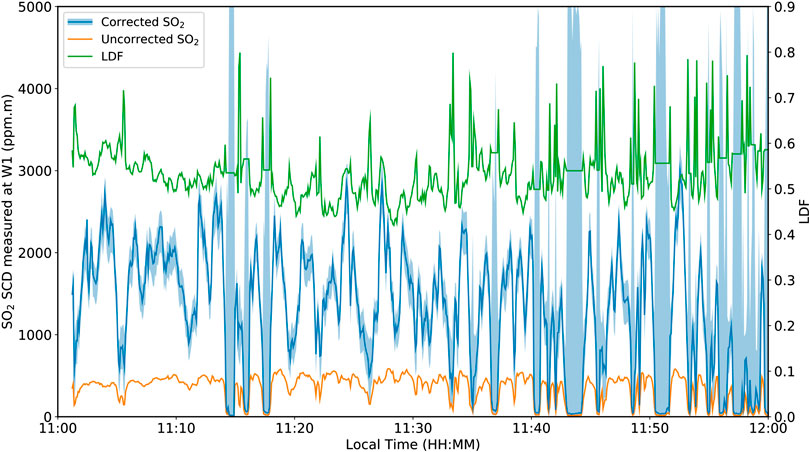
FIGURE 8. The retrieved SO2 time series before correction (orange) and after correction (blue). The SO2 error determined from the lookup table is included as light blue shading. The correction is poorly constrained for low SO2 SCDs. The light dilution time series is included (green).
At low SO2 SCDs, however, both corrected SO2 SCD and LDF are poorly constrained, as at these uncorrected SO2 amounts the exact LDF has only a small impact on the residual but a dramatic impact on the corrected SO2 SCD. This is reflected in the large reported error for these measurements. Large unrealistic spikes in corrected SCD at these very low uncorrected SCDs, however, are successfully avoided using the average LDF of the past few measurements.
Discussion
Our dual-waveband approach allows easy detection of light dilution using both intensity and optical depth fitting. It can also provide an estimate of the magnitude of dilution for intensity fitting under clear conditions, offering a means to correct SO2 quantification. In our examples, we find correction produces a large increase in retrieved SO2, up to a factor of 5.
Several studies have noted that light dilution increases with the distance between a spectrometer and a volcanic plume (e.g., Moffat and Millan, 1971; Bluth et al., 2007). The effect was initially presumed to be logarithmic with distance, considering transmitted intensity exponentially decays with distance, but our study and others (Kern et al., 2012) show the relationship is more complex at high SO2 SCDs. Lower wavebands suffer greater underestimation at such SCDs due to the greater SO2 absorption present, but show greater fitting residuals.
Our model shows fitting using longer wavelengths, e.g., 314–316 nm (Mori et al., 2006), only improves the fit residual, but does not correct the majority of the underestimation resulting from light dilution (Figure 5). Previous work has used wavebands around 360–390 nm to avoid scattering issues (e.g., Bobrowski et al., 2010; Gliß et al., 2015), but rough calculations show this would at most halve the scattering coefficient compared to 306 nm, based on the Rayleigh relationship between wavelength and scattering coefficient. Therefore, these spectra likely will still suffer from light dilution while being indistinguishable in appearance from undiluted spectra.
Strikingly, ignoring light dilution leads to an effective upper limit of quite low SCDs at certain wavelengths. This is because, with traditional analysis, high SCD diluted absorption will yield similar retrieved SCDs to low SCD undiluted absorption. If dilution were systematically ignored during measurements, this limit would mean important changes in emission rate at a volcano could be missed, and eruptive mechanisms misinterpreted. Therefore monitoring techniques may not always be able to detect precursory increases in SO2 emission rate, defying the commonly held assumption.
We successfully tested our light dilution model for spectra from Masaya volcano, Nicaragua, showing that at around 5 km from the plume approximately half the light measured at 310 nm had not passed through the plume, consistent with the expected values for clear air. In contrast, we did not detect any dilution for traverses directly beneath the plume. The approach, however, does not include other potential radiative transfer effects. Consequently, we anticipate that our model could perform poorly for an optically thick plume or in a low visibility background atmosphere. Our correction is also poorly constrained for very low SO2 SCDs, though these points can be identified prior to re-fitting.
Scientists monitoring volcanic SO2 emissions can readily deploy the dual-waveband approach to detect light dilution. Simply plotting the SCD retrieved in two wavebands is sufficient for detection, as a noticeable curve will be present when dilution is occurring for both DOAS- and iFit-retrieved results. Longer or shorter wavelength wavebands may be needed for very different plume SO2 SCDs than those presented here, for example during a fissure eruption. If dilution is detected, a number of options are available to scientists. They could reduce the distance between the spectrometer and plume by changing the location of scanners or using an alternative traverse road, but this is not always possible in a mountainous volcanic landscape. Deploying UAV-mounted spectrometers could also help in such landscapes (Stix et al., 2018). Alternatively, our modeling could be used to estimate the dilution occurring under clear conditions. If the more complex Monte-Carlo radiative transfer models were used for correction, our simple modeling could provide additional constraints for their setup.
Light dilution will particularly affect volcanoes with a large distance between their monitoring spectrometers and plume, especially during heightened activity. Many of the volcanoes in the top 50 global emitters of SO2 (Carn et al., 2016), including Etna (Salerno et al., 2009a), Popocatépetl (Fickel and Granados, 2017), Tungurahua (McCormick et al., 2014; Hidalgo et al., 2015), Nyiragongo and Nyamuragira (Arellano et al., 2017), have traverse roads or deployed scanners at least 1 km below their vent. While volcanoes at high altitudes may be more resilient to the effect due to reduced atmospheric density, a large increase in plume height could still cause significant light dilution to occur. The effect will also be significantly worse if the scanner or road is not situated directly beneath the plume, as the oblique measurement would further increase the spectrometer-plume distance.
We highlight that SO2 emission rate measured with UV spectroscopy is the primary method used to quantify emissions of other volcanic species, such as CO2, required for estimates of the total global volcanic CO2 emission (Burton et al., 2013; Fischer and Aiuppa, 2020); a key parameter in geochemical cycles. Our analysis shows that light dilution can produce large underestimates in SO2 SCD, and therefore global volcanic SO2 and CO2 inventories may also be underestimated.
Data Availability Statement
All datasets generated for this study are included in the manuscript/Supplementary Material. The Masaya datasets created for and analyzed during this study are available from Figshare at DOI:10.6084/m9.figshare.11637462. The base iFit code, and modifications to it detailed in this publication, are available from https://github.com/benjaminesse/iFit.
Author Contributions
MV designed code adjustments, analyzed the spectra and drafted the manuscript. BE created the initial iFit code-base. BE, RK, and MI assisted field measurements. MI provided expertise on the activity of Masaya volcano. MB, BE, RK, and GS helped developed the methods used, and all authors reviewed the manuscript.
Funding
The work contained in this paper contains work conducted during a PhD study supported by the Natural Environment Research Council (NERC) EAO Doctoral Training Partnership grant number NE/L002469/1 alongside a CASE award from INGV, whose support is gratefully acknowledged.
Conflict of Interest
The authors declare that the research was conducted in the absence of any commercial or financial relationships that could be construed as a potential conflict of interest.
Acknowledgments
We would like to thank the staff at INETER for their expertise on Masaya volcano and help with measurements.
Supplementary Material
The Supplementary Material for this article can be found online at: https://www.frontiersin.org/articles/10.3389/feart.2020.528753/full#supplementary-material
References
Aiuppa, A., Giudice, G., Gurrieri, S., Liuzzo, M., Burton, M., Caltabiano, T., et al. (2008). Total volatile flux from Mount Etna. Geophys. Res. Lett. 35, L24302. doi:10.1029/2008gl035871
Arellano, S., Yalire, M., Galle, B., Bobrowski, N., Dingwell, A., Johansson, M., et al. (2017). Long-term monitoring of SO2 quiescent degassing from Nyiragongo’s lava lake. J. Afr. Earth Sci. 134, 866–873. doi:10.1016/j.jafrearsci.2016.07.002
Bluth, G. J. S., Shannon, J. M., Watson, I. M., Prata, A. J., and Realmuto, V. J. (2007). Development of an ultra-violet digital camera for volcanic SO2 imaging. J. Volcanol. Geoth. Res. 161, 47–56. doi:10.1016/j.jvolgeores.2006.11.004
Bobrowski, N., Kern, C., Platt, U., Hörmann, C., and Wagner, T. (2010). Novel SO2 spectral evaluation scheme using the 360–390 nm wavelength range. Atmos. Meas. Tech. 3, 879–891. doi:10.5194/amt-3-879-2010
Burton, M. R., Oppenheimer, C., Horrocks, L. A., and Francis, P. W. (2000). Remote sensing of CO2 and H2O emission rates from Masaya volcano, Nicaragua. Geology 28, 915–918. doi:10.1130/0091-7613(2000)28<915:rsocah>2.0.co;2
Burton, M. R., Sawyer, G. M., and Granieri, D. (2013). 11. Deep carbon emissions from volcanoes. Rev. Mineral. Geochem. 75, 323–354. doi:10.2138/rmg.2013.75.11
Caltabiano, T., Burton, M., Giammanco, S., Allard, P., Bruno, N., Murè, F., et al. (2004). Volcanic gas emissions from the summit craters and flanks of Mt. Etna, 1987–2000. Geophys. Mon. Ser. 143, 111–128. doi:10.1029/143GM08.
Campion, R., Delgado-Granados, H., and Mori, T. (2015). Image-based correction of the light dilution effect for SO2 camera measurements. J. Volcanol. Geoth. Res. 300, 48–57. doi:10.1016/j.jvolgeores.2015.01.004
Carn, S. A., Clarisse, L., and Prata, A. J. (2016). Multi-decadal satellite measurements of global volcanic degassing. J. Volcanol. Geoth. Res. 311, 99–134. doi:10.1016/j.jvolgeores.2016.01.002
Chance, K., and Kurucz, R. L. (2010). An improved high-resolution solar reference spectrum for earth’s atmosphere measurements in the ultraviolet, visible, and near infrared. J. Quant. Spectrosc. Radiat. Transf. 111, 1289–1295. doi:10.1016/j.jqsrt.2010.01.036
Danckaert, T., Fayt, C., Van Roozendael, M., De Smedt, I., Letocart, V., Merlaud, A., et al. (2012). QDOAS Software user manual. Belgian Institute for Space Aeronomy (BIRA-IASB). Available at: http://uv-vis.aeronomie.be/software/QDOAS/QDOAS_manual.pdf (Accessed October 7, 2020).
de Moor, J. M., Kern, C., Avard, G., Muller, C., Aiuppa, A., Saballos, A., et al. (2017). A new sulfur and carbon degassing inventory for the southern central American volcanic arc: the importance of accurate time-series data sets and possible tectonic processes responsible for temporal variations in arc-scale volatile emissions. Geochem. Geophys. Geosyst. 18, 4437–4468. doi:10.1002/2017gc007141
Delmelle, P., Stix, J., Baxter, P., Garcia-Alvarez, J., and Barquero, J. (2002). Atmospheric dispersion, environmental effects and potential health hazard associated with the low-altitude gas plume of Masaya volcano, Nicaragua. Bull. Volcanol. 64, 423–434. doi:10.1007/s00445-002-0221-6
Edmonds, M., Herd, R. A., Galle, B., and Oppenheimer, C. M. (2003). Automated, high time-resolution measurements of SO2 flux at Soufrière Hills Volcano, Montserrat. Bull. Volcanol. 65, 578–586. doi:10.1007/s00445-003-0286-x
Elias, T., Kern, C., Horton, K. A., Sutton, A. J., and Garbeil, H. (2018). Measuring SO2 emission rates at Kīlauea volcano, Hawaii, using an array of upward-looking UV spectrometers, 2014–2017. Front. Earth Sci. 6, 214. doi:10.3389/feart.2018.00214
Elias, T., Sutton, A. J., Oppenheimer, C., Horton, K. A., Garbeil, H., Tsanev, V., et al. (2006). Comparison of COSPEC and two miniature ultraviolet spectrometer systems for SO2 measurements using scattered sunlight. Bull. Volcanol. 68, 313–322. doi:10.1007/s00445-005-0026-5
Esse, B. (2019). iFit (computer software). Available at: https://zenodo.org. (Accessed June 25, 2020).
Esse, B., Burton, M., Varnam, M., Kazahaya, R., and Salerno, G. (2020). iFit: a simple method for measuring volcanic SO2 without a measured Fraunhofer reference spectrum. J. Volcanol. Geoth. Res. 402, 107000. doi:10.1016/j.jvolgeores.2020.107000.
Fickel, M., and Delgado Granados, H. (2017). On the use of different spectral windows in DOAS evaluations: effects on the estimation of SO2 emission rate and mixing ratios during strong emission of Popocatépetl volcano. Chem. Geol. 462, 67–73. doi:10.1016/j.chemgeo.2017.05.001
Fischer, T. P., and Aiuppa, A. (2020). AGU centennial grand challenge: volcanoes and deep carbon global CO2 emissions from subaerial volcanism—recent progress and future challenges. Geochem. Geophys. Geosyst. 21, e2019GC008690. doi:10.1029/2019gc008690
Galle, B., Johansson, M., Rivera, C., Zhang, Y., Kihlman, M., Kern, C., et al. (2010). Network for observation of volcanic and atmospheric change (NOVAC)—a global network for volcanic gas monitoring: network layout and instrument description. J. Geophys. Res. 115, D05304. doi:10.1029/2009jd011823
Galle, B., Oppenheimer, C., Geyer, A., McGonigle, A. J. S., Edmonds, M., and Horrocks, L. (2003). A miniaturised ultraviolet spectrometer for remote sensing of SO2 fluxes: a new tool for volcano surveillance. J. Volcanol. Geoth. Res. 119, 241–254. doi:10.1016/s0377-0273(02)00356-6
Gliß, J., Bobrowski, N., Vogel, L., Pöhler, D., and Platt, U. (2015). OClO and BrO observations in the volcanic plume of Mt. Etna—implications on the chemistry of chlorine and bromine species in volcanic plumes. Atmos. Chem. Phys. 15, 5659–5681. doi:10.5194/acp-15-5659-2015
Gorshelev, V., Serdyuchenko, A., Weber, M., Chehade, W., and Burrows, J. P. (2014). High spectral resolution ozone absorption cross-sections–part 1: measurements, data analysis and comparison with previous measurements around 293 K. Atmos. Meas. Tech. 7, 609–624. doi:10.5194/amt-7-609-2014
Grainger, J. F., and Ring, J. (1962). Anomalous Fraunhofer line profiles. Nature 193, 762. doi:10.1038/193762a0
Hibert, C., Mangeney, A., Polacci, M., Muro, A. D., Vergniolle, S., Ferrazzini, V., et al. (2015). Toward continuous quantification of lava extrusion rate: results from the multidisciplinary analysis of the 2 January 2010 eruption of Piton de la Fournaise volcano, La Réunion. J. Geophys. Res. Solid Earth. 120, 3026–3047. doi:10.1002/2014jb011769
Hidalgo, S., Battaglia, J., Arellano, S., Steele, A., Bernard, B., Bourquin, J., et al. (2015). SO2 degassing at Tungurahua volcano (Ecuador) between 2007 and 2013: transition from continuous to episodic activity. J. Volcanol. Geoth. Res. 298, 1–14. doi:10.1016/j.jvolgeores.2015.03.022
Ilanko, T., Pering, T., Wilkes, T., Apaza Choquehuayta, F., Kern, C., Díaz Moreno, A., et al. (2019). Degassing at Sabancaya volcano measured by UV cameras and the NOVAC network. Volcanica 2, 239–252. doi:10.30909/vol.02.02.239252
Kern, C., Deutschmann, T., Vogel, L., Wöhrbach, M., Wagner, T., and Platt, U. (2010). Radiative transfer corrections for accurate spectroscopic measurements of volcanic gas emissions. Bull. Volcanol. 72, 233–247. doi:10.1007/s00445-009-0313-7
Kern, C., Deutschmann, T., Werner, C., Sutton, A. J., Elias, T., and Kelly, P. J. (2012). Improving the accuracy of SO2 column densities and emission rates obtained from upward‐looking UV‐spectroscopic measurements of volcanic plumes by taking realistic radiative transfer into account. J. Geophys. Res. 117, D20302. doi:10.1029/2012jd017936
Kraus, S. (2006). DOASIS: a framework design for DOAS. PhD dissertation. Mannheim, Germany: University of Mannheim.
Lübcke, P., Lampel, J., Arellano, S., Bobrowski, N., Dinger, F., Galle, B., et al. (2016). Retrieval of absolute SO2 column amounts from scattered-light spectra: implications for the evaluation of data from automated DOAS networks. Atmos. Meas. Techn. 9, 5677–5698. doi:10.5194/amt-2016-24
Malinconico, L. L. (1979). Fluctuations in SO2 emission during recent eruptions of Etna. Nature 278, 43–45. doi:10.1038/278043a0
Martin, R., Sawyer, G., Spampinato, L., Salerno, G., Ramirez, C., Ilyinskaya, E., et al. (2010). A total volatile inventory for Masaya Volcano, Nicaragua. J. Geophys. Res. 115, B09215. doi:10.1029/2010jb007480
McCormick, B. T., Herzog, M., Yang, J., Edmonds, M., Mather, T. A., Carn, S. A., et al. (2014). A comparison of satellite- and ground-based measurements of SO2 emissions from Tungurahua volcano, Ecuador. J. Geophys. Res. Atmos. 119, 4264–4285. doi:10.1002/2013jd019771
Moffat, A. J., and Millan, M. M. (1971). The applications of optical correlation techniques to the remote sensing of SO2 plumes using sky light. Atmos. Environ. 5, 677–690. doi:10.1016/0004-6981(71)90125-9
Mori, T., Mori, T., Kazahaya, K., Ohwada, M., Hirabayashi, J. I., and Yoshikawa, S. (2006). Effect of UV scattering on SO2 emission rate measurements. Geophys. Res. Lett. 33, 101029. doi:10.1029/2006gl026285
Oppenheimer, C., Pyle, D. M., and Barclay, J. (2003). Volcanic degassing. London: Geological Society of London.
Penndorf, R. (1957). Tables of the refractive index for standard air and the Rayleigh scattering coefficient for the spectral region between 02 and 200 μ and their application to atmospheric optics. J. Opt. Soc. Am. 47, 176–182. doi:10.1364/josa.47.000176
Platt, U., Bobrowski, N., and Butz, A. (2018). Ground-based remote sensing and imaging of volcanic gases and quantitative determination of multi-species emission fluxes. Geosciences 8, 44. doi:10.3390/geosciences8020044
Platt, U., and Stutz, J. (2008). “Introduction,” in Differential optical absorption spectroscopy: principles and applications. Berlin, Heidelberg: Springer-Verlag, 1–4.
Robock, A. (2000). Volcanic eruptions and climate. Rev. Geophys. 38, 191–219. doi:10.1029/1998rg000054
Rufus, J., Stark, G., Smith, P. L., Pickering, J., and Thorne, A. (2003). High‐resolution photoabsorption cross section measurements of SO2, 2: 220 to 325 nm at 295 K. J. Geophys. Res. 108, 5011. doi:10.1029/2002je001931
Salerno, G. G., Burton, M. R., Oppenheimer, C., Caltabiano, T., Randazzo, D., Bruno, N., et al. (2009a). Three-years of SO2 flux measurements of Mt. Etna using an automated UV scanner array: comparison with conventional traverses and uncertainties in flux retrieval. J. Volcanol. Geoth. Res. 183, 76–83. doi:10.1016/j.jvolgeores.2009.02.013
Salerno, G. G., Burton, M. R., Oppenheimer, C., Caltabiano, T., Tsanev, V. I., and Bruno, N. (2009b). Novel retrieval of volcanic SO2 abundance from ultraviolet spectra. J. Volcanol. Geoth. Res. 181, 141–153. doi:10.1016/j.jvolgeores.2009.01.009
Sawyer, G. M., Salerno, G. G., Le Blond, J. S., Martin, R. S., Spampinato, L., Roberts, T. J., et al. (2011). Gas and aerosol emissions from Villarrica volcano, Chile. J. Volcanol. Geoth. Res. 203, 62–75. doi:10.1016/j.jvolgeores.2011.04.003
Stix, J., de Moor, J. M., Rüdiger, J., Alan, A., Corrales, E., D’Arcy, F., et al. (2018). Using drones and miniaturized instrumentation to study degassing at Turrialba and Masaya volcanoes, Central America. J. Geophys. Res.: Solid Earth. 123, 6501–6520.
Sutton, A. J., Elias, T., Gerlach, T. M., and Stokes, J. B. (2001). Implications for eruptive processes as indicated by sulfur dioxide emissions from Kı̄lauea Volcano, Hawaii, 1979–1997. J. Volcanol. Geoth. Res. 108, 283–302. doi:10.1016/s0377-0273(00)00291-2
Vogel, L., Galle, B., Kern, C., Delgado Granados, H., Conde, V., Norman, P., et al. (2011). Early in-flight detection of SO2 via differential optical absorption spectroscopy: a feasible aviation safety measure to prevent potential encounters with volcanic plumes. Atmos. Meas. Techn. 4, 1785–1804. doi:10.5194/amtd-4-2827-2011
Weibring, P., Swartling, J., Edner, H., Svanberg, S., Caltabiano, T., Condarelli, D., et al. (2002). Optical monitoring of volcanic sulphur dioxide emissions-comparison between four different remote-sensing spectroscopic techniques. Optic Laser. Eng. 37, 267–284. doi:10.1016/s0143-8166(01)00084-7
Williams-Jones, G., Stix, J., and Hickson, C. (2008). The COSPEC cookbook: making SO2 measurements at active volcanoes. IAVCEI. Methods in Volcanology, 1. Available at: https://www.researchgate.net/publication/302988478_The_COSPEC_Cookbook_Making_SO2_Measurements_at_Active_Volcanoes
Keywords: SO2 flux, light dilution, volcanic gas, spectroscopy, magmatic degassing, SO2 emission rate, dual-band modeling, Masaya Volcano
Citation: Varnam M, Burton M, Esse B, Kazahaya R, Salerno G, Caltabiano T and Ibarra M (2020) Quantifying Light Dilution in Ultraviolet Spectroscopic Measurements of Volcanic SO2 Using Dual-Band Modeling. Front. Earth Sci. 8:528753. doi:10.3389/feart.2020.528753
Received: 21 January 2020; Accepted: 22 September 2020;
Published: 16 October 2020.
Edited by:
John Stix, McGill University, CanadaReviewed by:
Christoph Kern, USGS, United StatesPatricia Nadeau, United States Geological Survey, United States
Copyright © 2020 Varnam, Burton, Esse, Kazahaya, Salerno, Caltabiano and Ibarra. This is an open-access article distributed under the terms of the Creative Commons Attribution License (CC BY). The use, distribution or reproduction in other forums is permitted, provided the original author(s) and the copyright owner(s) are credited and that the original publication in this journal is cited, in accordance with accepted academic practice. No use, distribution or reproduction is permitted which does not comply with these terms.
*Correspondence: Matthew Varnam, bWF0dGhldy52YXJuYW1AbWFuY2hlc3Rlci5hYy51aw==
This article was submitted to Volcanology, a section of the journal Frontiers in Earth Science
 Matthew Varnam
 Mike Burton
 Ben Esse
 Ryunosuke Kazahaya
 Giuseppe Salerno
 Tommaso Caltabiano
 Martha Ibarra4