 Janina K. Gillies1*Ben M. Kennedy1Darren M. Gravley1Graham S. Leonard2James Cowlyn1
- 1School of Earth and Environment, University of Canterbury, Christchurch, New Zealand
- 2GNS Science, Lower Hutt, New Zealand
Pyroclastic density current (PDC) deposits, especially small to medium volume events, have low preservation potential at many volcanoes, particularly when unconsolidated or deposited on steep, glaciated slopes. This may lead to an underrepresentation of these events in the eruptive record, and consequently, in hazard management planning; leaving populations on and around the volcanoes unprepared for the threat of these smaller eruptions. Therefore, it is important to investigate and recognize these smaller events in the volcanic record to create more comprehensive plans for future eruptions. Mt. Ruapehu is one of New Zealand’s most active volcanoes, last erupting in 2007. Few studies have investigated the PDC occurrence on this volcano, despite PDCs being one of the most hazardous volcanic processes. Poor preservation of PDC deposits, due to small volume, past glaciations, erosion, burial, and poor consolidation has left a significant gap in Mt. Ruapehu’s eruptive record. By identifying and characterizing PDCs on Mt. Ruapehu this paper provides an updated account of PDC occurrence on this volcano, especially for smaller scale PDCs. Comprehensive field-mapping forms the basis for this study by identifying PDC deposits from partial outcrop exposures. We use field observations of these deposits to describe the lithofacies and infer PDC behavior. Relative stratigraphy and whole-rock geochemistry are used to correlate deposits with dated units from literature and provide approximate age ranges. This study describes 12 PDC deposits representing at least 10 previously unidentified flows. Combined with PDCs identified in previous studies there is a total of 23 PDC deposits found on Mt. Ruapehu, including the PDC observed during the 1945 eruption. These PDCs have been emplaced throughout Mt. Ruapehu’s 250 ka eruptive history. The PDCs were concentrated and dominated by granular flow or granular fluid-based flow transport regimes. The lithofacies show PDCs forming from column collapse and dome collapse or explosion events. This demonstrates that Mt. Ruapehu is capable of producing a spectrum of PDC styles and sizes, something that must be considered during future hazard planning on the volcano.
Introduction
With increasing populations, urbanization, and infrastructure over the last 50 years, natural hazards such as volcanic eruptions are posing a greater threat to society (Johnston et al., 2000). Therefore, it is crucial to fully understand these hazards in order to reduce the impact they have on society. This is especially important at volcanoes with large numbers of tourists, such as Mt. Ruapehu (New Zealand), or numerous residents living in the impact area. This was also highlighted by the tragic events at Whakaari/White Island (New Zealand) on December 9, 2019, where approximately 47 tourists were caught in a sudden-onset phreatic eruption, resulting in 21 deaths.
Pyroclastic density currents (PDCs) are one example of a volcanic hazard that threatens populations surrounding the volcano, contributing to 33% of fatalities during volcanic disasters since 1600 AD (Auker et al., 2013). PDCs can be generated by several different mechanisms: the collapse of an eruption column, boiling-over (Branney and Kokelaar, 2002), directed lateral blast (Waitt Jr., 1981), explosion or gravitational collapse of a lava dome (Dufek et al., 2015) or the toe of flowing lava (Valentine et al., 2000; Stinton and Sheridan, 2008; Buchwaldt, 2013; Dufek et al., 2015), or the collapse of accumulated Strombolian spatter (Valentine et al., 2000). These different mechanisms can produce different styles and sizes of PDCs.
Small to medium sized unconsolidated PDC deposits have a low preservation potential, especially when sedimented on steep slopes and in active drainages for water and ice (Manville et al., 2000; Cowlyn, 2016). This leads to an underrepresentation of these events in the volcanic record and, therefore, in hazard management plans. Recognizing and characterizing these types of PDCs is important in fully preparing for a range of eruption sizes and styles, not only large climactic events.
Lithofacies classifications are commonly used in literature to characterize deposits and infer emplacement mechanisms based on textural features. This is especially useful when describing PDC deposits due to the variety of generation, transport, and emplacement mechanisms that can influence the characteristics of the final deposit. Branney and Kokelaar (2002) provide an in-depth overview of ignimbrite lithofacies and interpretations for the processes that influenced them. Other work on ignimbrites includes Brown and Branney (2004) who characterized the lithofacies from the 273 ka Poris Formation on Tenerife. The ignimbrites from this eruption are composed of massive, diffuse bedded, and diffuse stratified lapilli tuff facies. These PDCs were density stratified and deposited massive, coarse ignimbrites in the valleys and finer-grained bedded tuff on topographic highs. Smaller pumiceous PDCs include the 1993 Lascar Volcano deposits, described by Calder et al. (2000). This pumice rich facies includes poorly sorted, reverse graded, ash rich deposits with elutriation pipes and fine-grained basal layers. Based on the lithofacies Calder et al. (2000) infers the PDC was a highly concentrated granular flow, and consisted of multiple flows. Pumice clasts are concentrated at the deposit margins due to flotation from their lower densities. Lube et al. (2011) and Charbonnier and Gertisser (2011) describe the lithofacies of small volume block-and-ash flows from the 2006 dome collapse events at Merapi. These include the massive, coarse, matrix supported, breccia channel facies, fine grained surge facies, and massive, matrix supported veneer facies. These flows were interpreted to have formed during unsteady granular PDCs dominated by particle interactions and segregation processes (Charbonnier and Gertisser, 2011). Torres-Orozco et al. (2018) also describe the lithofacies of block-and-ash flows deposits at Mt. Taranaki. This facies consisted of poorly sorted, matrix supported, dense blocks, and ash deposits. Torres-Orozco et al. (2018) used the reverse grading common in this facies to infer that dispersive pressure from grain collisions was the dominant process. These previous studies provide the basis for the lithofacies classifications used in this paper to characterize and interpret small, heavily eroded PDC deposits on Mt. Ruapehu.
Recent studies have highlighted in detail the PDC hazard at New Zealand volcanoes, such as Mt. Taranaki (Torres-Orozco et al., 2017a; Torres-Orozco et al., 2017b; Torres-Orozco et al., 2018). While the occurrence of PDCs on Mt. Ruapehu has been briefly mentioned in past literature (Hackett, 1985; Donoghue et al., 1995; Pardo et al., 2012a; Pardo et al., 2014; Townsend et al., 2017) little investigation has been conducted into their distribution, frequency, and subsequent hazard.
Poor consolidation, small eruptive events, and active drainages on a heavily glaciated volcano make it difficult to locate and identify PDC deposits on Mt. Ruapehu, leading to an unknown PDC hazard. A PDC was photographed during Mt. Ruapehu’s 1945 eruption (Johnston and Neall, 1995; Cowlyn, 2016), illustrating that PDCs have historically occurred at Mt. Ruapehu. It has also been suggested that the 1996 eruption columns were likely to have collapsed to form PDCs if not for the presence of winds that increased the buoyancy of the plume during the eruption (Degruyter and Bonadonna, 2013).
Prior to the study conducted by Cowlyn (2016), who identified multiple PDC deposits on the eastern side of Mt. Ruapehu, the PDC hazard was generally overlooked. This is likely due to a lack of historic PDCs and the poor preservation of prehistoric PDC deposits. Houghton et al. (1987) noted the occurrence of pyroclastic surges during historical eruptions and speculated the occurrence of pyroclastic flows during future eruptions. Donoghue et al. (1995) described evidence for a magma mingling episode in the juvenile material of the Pourahu PDC within the Bullot Formation (27–10 ka; Pardo et al., 2012b). In more recent studies, Pardo (2012) and Pardo et al. (2014) found evidence of eruption columns that collapsed to form PDC deposits interspersed with fallout deposits. One PDC deposit, part of the Oruamatua Eruptive Unit (between 13 and 12 ka) was found up to 16 km from the source, Ruapehu’s northern crater area (Pardo et al., 2014). Another PDC deposit, part of the Okupata-Pourahu Eruptive Unit (11.6 ka), was also found up to 16 km from the source, the southern crater area, which is still active today. PDC deposits were also identified in the Upper Waikato drainages, most likely formed from the partial collapse of an unsteady eruption column (Pardo, 2012; Pardo et al., 2014).
During these recent studies on Mt. Ruapehu, Pardo et al. (2014) hypothesized that pyroclastic flows accompanied some of Ruapehu’s largest eruptions. Cowlyn (2016) later identified pumiceous PDC deposits from these eruptions and additional PDC deposits spanning a range of eruption styles and sizes. The deposits described by Cowlyn (2016) fit three main categories: 1) Pumice-dominated PDC deposits, 2) Variably welded PDC deposits containing rounded clasts, and 3) Small volume PDC deposits containing dense primary clasts. The pumice-dominated PDC deposits described by Cowlyn (2016) were found to be geochemically similar to nearby Plinian fall deposits from the Taurewa (11.8–9.5 ka) and Ohinewairua (∼13.6–11.6 ka) eruptive periods (Donoghue et al., 1999; Pardo et al., 2012b).
The study conducted by Cowlyn (2016) identified 12 previously unknown PDC deposits near the Tukino ski area on the eastern flank of Mt. Ruapehu. All of the deposits were estimated to have been emplaced within the last ∼13.6 ka. However, that study did not investigate PDC occurrence in other sectors of Mt. Ruapehu, leaving a significant gap in the knowledge of PDCs on this volcano. The goal of this study is, therefore, to identify and characterize other poorly preserved PDC deposits throughout Mt. Ruapehu to better understand the overall hazard.
Geological Setting
Mt. Ruapehu (2,797 m), located at the southern end of the Taupo Volcanic Zone (Figure 1), is an active, andesite-dacite composite volcano with a volume of approximately 150 km3 (Hackett and Houghton, 1989). This volcano consists of four formations: Te Herenga (200–180 ka), Wahianoa (166–80 ka), Mangawhero (50–15 ka), and Whakapapa (<17 ka) (Hackett and Houghton, 1989; Conway et al., 2016).
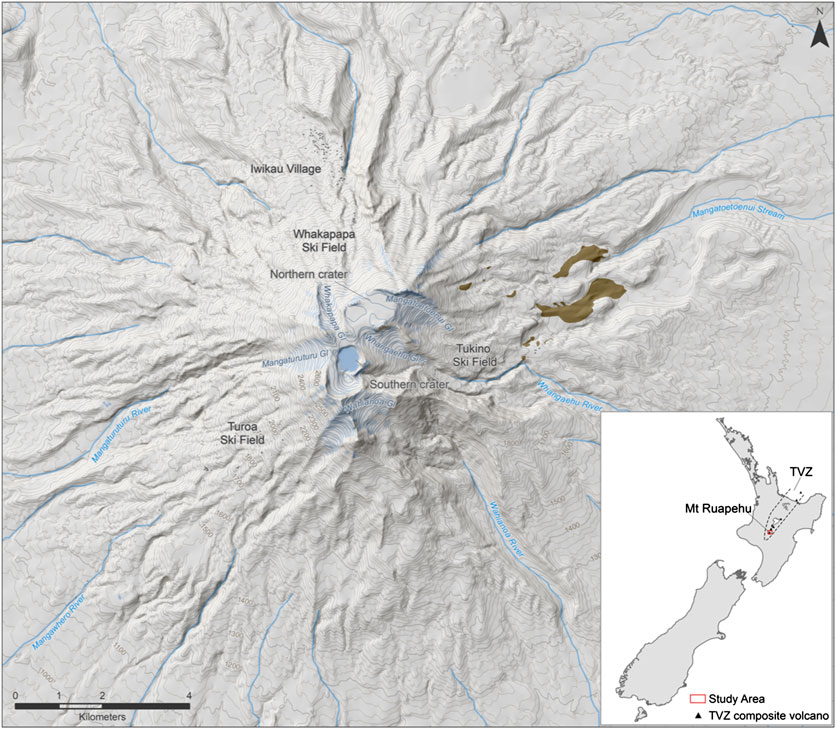
FIGURE 1. Topographic map of Mt. Ruapehu with pyroclastic density current deposits identified by Cowlyn (2016) (brown areas). Inset shows location of Mt. Ruapehu within New Zealand and the Taupo Volcanic Zone (TVZ). Map data gathered from https://data.linz.govt.nz.
A series of intense constructional events separated by periods of erosion, sector collapse, and minor volcanic activity characterize the formation of Mt. Ruapehu (Price et al., 2012). There is an apparent hiatus in eruptive activity from 80 to 50 ka (Townsend et al., 2017). Compositions range from basalt to dacite with predominantly medium K andesite (Hackett and Houghton, 1989). More evolved compositions have been erupted over time (Hackett and Houghton, 1989). The currently active vent is located in the southern portion of the broad summit, and forms the acidic Crater Lake/Te Wai-ā-moe (Hackett and Houghton, 1989).
Throughout its formation, eruptive activity at Mt. Ruapehu has included Plinian, sub-Plinian, Strombolian, phreatomagmatic, Vulcanian, dome-related activity, and the extrusion of lava flows (Houghton et al., 1987; Hackett and Houghton, 1989; Pardo et al., 2012b). Over the last 150 years the most frequently observed eruption types include phreatomagmatic and phreatic activity, with a larger lava-dome explosion event in 1945 that occurred during an eruptive period also associated with sub-Plinian and Strombolian eruption styles (Johnston et al., 2000). More than 40 eruptions have occurred since then (Kilgour et al., 2013).
Methods
Field Work
Field work formed the basis of this study, with three months spent on Mt. Ruapehu between November 2017 and March 2018. The targeted areas of the mountain were partly determined based on previous visits by other researchers. Other potential PDC deposits were identified in the field while accessing these targeted areas. While a broad area of the volcano was covered, logistics, and difficult terrain hindered access into some locations, especially the NW sector and the Wahianoa Valley.
Each location involved the sampling, identification, and textural description of PDC deposits. Permit restrictions within the National Park limited the quantity and size of samples. Clast and component percentages were quantified in the field using a percentage composition chart (Terry et al., 1955). Nearby units were also briefly described to correlate with mapped formations in Townsend et al. (2017).
Density
One to three lapilli, representative of the overall clast type at each outcrop, were selected from each deposit to measure indicative clast density using the methods of Houghton and Wilson (1989) and Barker et al. (2012). Sample size restrictions limited the quantity of lapilli of an appropriate size in each sample. Details about sample preparation and measurement are reported in Appendix 1 in Supplementary Material. The clast densities were calculated using the equation outlined in Houghton and Wilson (1989):
Where Wclast(dry) is the weight of the clast measured while dry, S.G is the specific gravity of water, and Wcage(wet) the weight of the cage while in water. Wwax(wet) is the weight of the wax while being held underwater in the cage. The buoyancy of the wax resulted in a negative value.
It is important to note that the small quantity of lapilli clasts used for this method limits how representative the density values are for each deposit. However, these values are only used to give an approximation of the clast densities present in each deposit, not an extensive range.
Geochemistry
The geochemical analyses were conducted at Massey University (New Zealand) using a Bruker S8 TIGER Series WDXRF Spectrometer calibrated against international standards (OREAS 24c). Major and trace element geochemical data was measured for each sample. For complete sample preparation and analysis details, see Appendix 2 in Supplementary Material.
Deposit Ages
The ages of deposits were estimated by geochemically correlating the deposits, through major and trace elements, with dated units (Pardo et al., 2012a; Conway et al., 2016). These correlations were also supported by comparing the relative stratigraphy of the deposits observed in the field to the surrounding units on a geological map of Mt. Ruapehu (Townsend et al., 2017). This approach allowed the age of the PDC deposits to be approximately bracketed.
Results
A total of 12 new pyroclastic deposit outcrops were identified on Mt. Ruapehu on the northern, eastern, and south-western sectors of the mountain (Figure 2). Field descriptions of each deposit can be found in Appendix 3 in Supplementary Material.
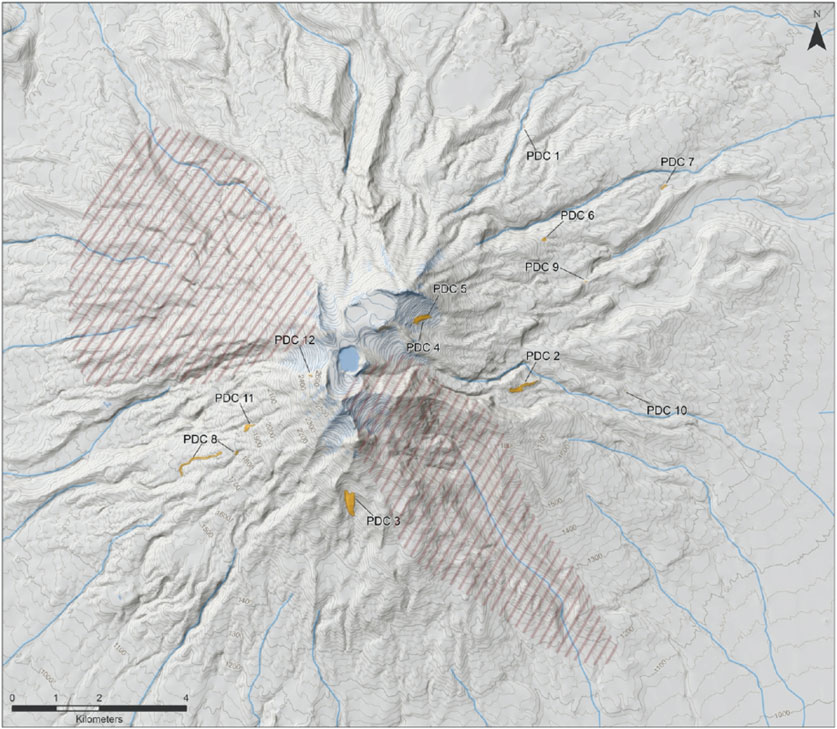
FIGURE 2. Pyroclastic density current (PDC) deposits identified during this study. A total of 12 PDC deposits were identified. Red dashes indicate main areas that were unable to be accessed during this study due to time constraints or difficult terrain. Map data gathered from https://data.linz.govt.nz.
Pyroclastic Deposits
Pyroclastic Density Current 1
Located on the lower north-eastern slopes of Mt. Ruapehu 6.7 km away from the vent, this deposit is 5 m thick and located underneath approximately 50 m of lava flows. It is formed by two well indurated, poorly sorted, and matrix supported layers (Figure 3A). The lower layer is primarily massive, with ash to block-sized clasts. This layer grades into a 20 cm fines-rich bed of ash and lapilli. The upper layer truncates the lower layer and thickens toward the topographic low. This upper layer displays reverse grading where the base of the layer is primarily composed of ash and lapilli, and grades up to bomb-sized clasts in an ash matrix. The maximum clast size observed in the field was 40 cm. Juvenile clasts are vesicular, sub-rounded to sub-angular and comprise 20–30% of the outcrop. In both layers there are occasional dense, well rounded, and dark gray clasts. The average density of main clast type in this deposit is 1.3 ± 0.085 g/cm3.
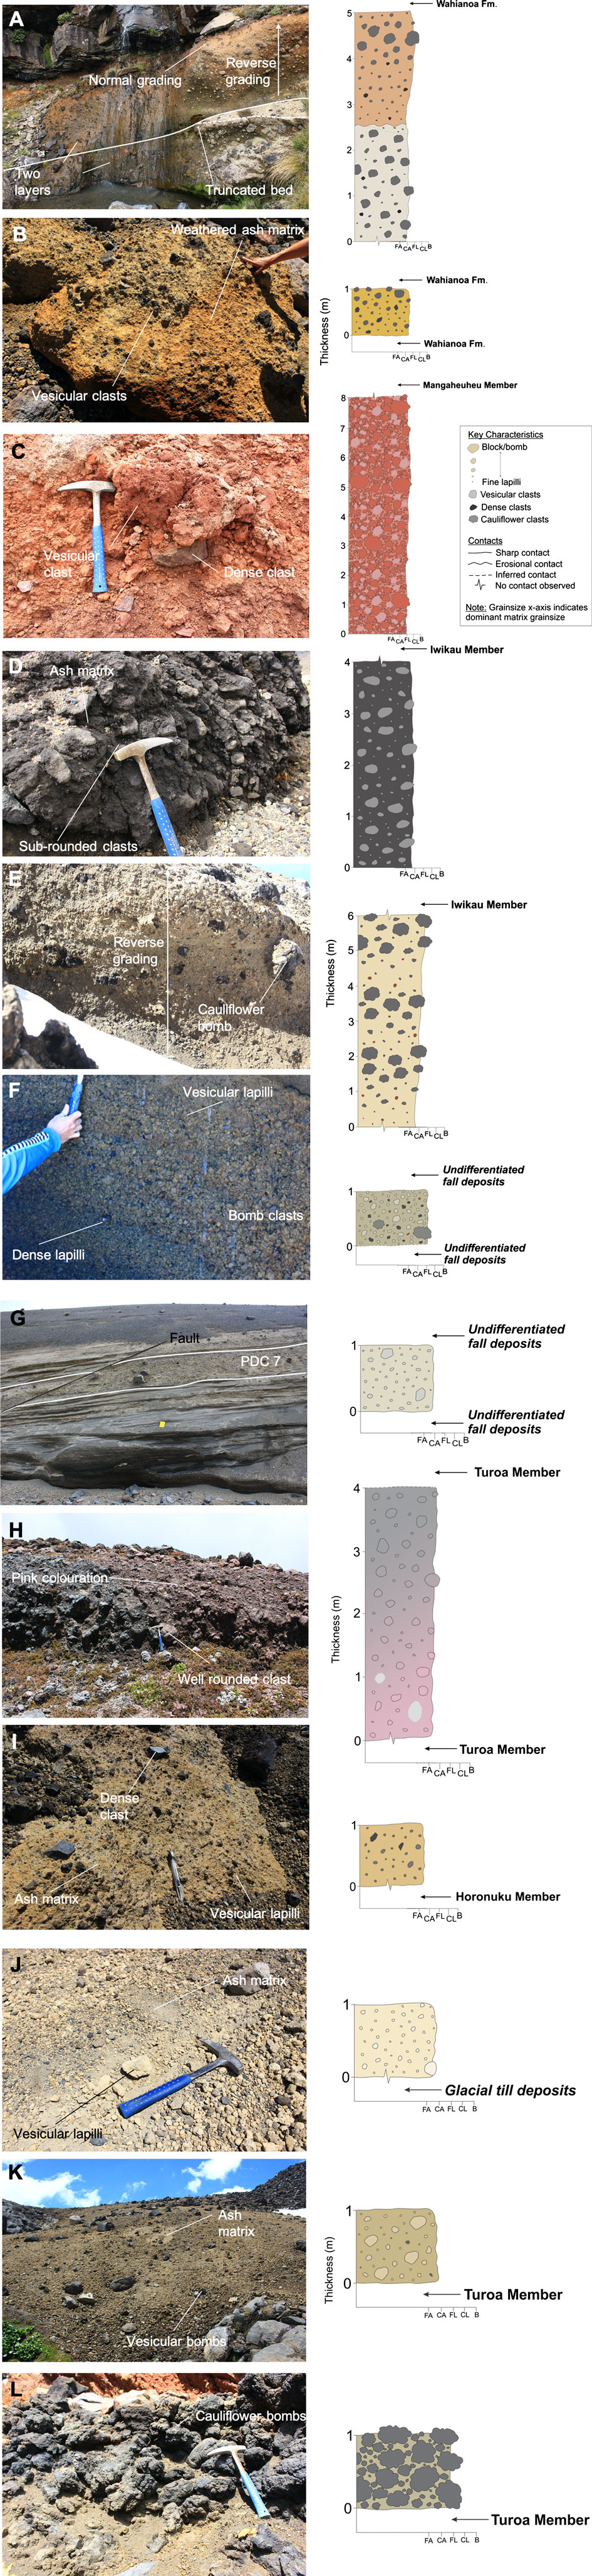
FIGURE 3. Field photos of each deposit and corresponding stratigraphic columns illustrating main textural features. Grainsize axis on stratigraphic columns correspond to fine ash (FA), coarse ash (CA), fine lapilli (FL), coarse lapilli (CL), and blocks/bombs (B). (A) Pyroclastic density current (PDC) 1 underneath Wahianoa Formation lava flows. Two layers, the upper of which displays reverse and normal grading. The lower layer is primarily massive, but does have a fines-rich layer at the top of the flow. An erosional contact separates the two layers. (B) Weathered orange PDC 2 with black vesicular clasts concentrated on the surface. This deposit is found both above and below Wahianoa Formation units. (C) Close up image of PDC 3 showing the occurrence of both vesicular and dense clasts. The entire outcrop is bright red. (D) PDC 4 is black, well-indurated, and contains sub-rounded clasts. (E) PDC 5 is rich in ash and vesicular clasts. Large, black, vesicular bombs display multiple layers of reverse grading. (F) PDC 6 is primarily composed of vesicular ash and lapilli. Occasional dense lapilli clasts and vesicular bombs also occur. Above and below this layer is a series of ashfall deposits. (G) PDC 7 is situated between a series of airfall deposits and is bisected by a fault. This deposit is primarily composed of ash and lapilli, but does contain occasional blocks and bombs. (H) PDC 8 is well-indurated and contains sub-angular to well rounded clasts. The deposit is gray with pink areas dispersed throughout. Turoa Member lava flows were observed both above and below the deposit. (I) PDC 9 is thin and well-indurated. This deposit is primarily composed of ash and vesicular lapilli though it does contain occasional dense clasts. (J) PDC 10 is located on the surface of glacial till deposits and is ash supported and rich in vesicular lapilli, with occasional vesicular bombs. (K) PDC 11 is located on the surface of Turoa Member lava flows and is rich in ash and vesicular clasts (both lapilli and bombs). (L) PDC 12 is clast supported and is primarily composed of black cauliflower bombs. There is ash and black lapilli filling in the gaps between these clasts. Deposited above Turoa Member lava flows.
Pyroclastic Density Current 2
This deposit is located on the eastern side of Mt. Ruapehu between 3.7 and 4.3 km away from the vent and consists of a series of orange outcrops exposing a 0.3–1 m thick unit draping the surface (Figure 3B). The thinnest deposits were observed upslope, closer to the topographic highs. PDC 2 is well indurated, matrix supported, and display minor reverse grading. Grainsizes range from ash to bombs (∼10 cm). The majority of the clasts are sub-rounded, black, and vesicular. There are occasional gray, dense, and angular lithic clasts. The average density of the dominant clasts is 1.2 ± 0.14 g/cm3.
Pyroclastic Density Current 3
PDC 3 was found on the southern side of Mt. Ruapehu 3–3.5 km away from the vent as a bright red, 8 m thick, well indurated outcrop with a layer of unconsolidated material on top (Figure 3C). The outcrop is thickest in the center of the valley and appears to thin toward the valley sides. This deposit is poorly sorted, massive, and clast supported. Grain sizes range between ash and bomb. The deposit is rich in both vesicular, sub-rounded clasts and dense, angular to sub-angular clasts. The densities of these clasts range between 1.3 ± 0.0015 g/cm3 for the vesicular clasts, and 2.3 ± 0.0016 g/cm3 for the dense clasts.
Pyroclastic Density Current 4
This deposit was found below the Mangatoetoenui Glacier 1.9 km away from the vent as a 4 m thick, well indurated black outcrop (Figure 3D). The deposit can be seen outcropping across the entire valley with little variation in thickness. It is massive, poorly sorted, and matrix supported. Clasts comprise 40% of the visible outcrop. Grain sizes range from ash to bombs. The maximum observed grainsize is 50 cm. The clasts are sub-rounded to well-rounded and vesicular. The average density of the clasts in this group is 1.3 ± 0.18 g/cm3.
Pyroclastic Density Current 5
PDC 5 is also located below the Mangatoetoenui Glacier 1.9 km from the vent, outcropping in two places across the valley. Overall it is a thick (∼6 m), poorly sorted deposit, with multiple layers of reverse grading, and supported by an ash-rich matrix. The dominant clasts are pale yellow-grey and vesicular, or large black vesicular cauliflower bombs (<70 cm) (Figure 3E). These are primarily sub-rounded and constitute 25% of the outcrop. Occasional lithic clasts are distributed throughout the lower outcrop, though they appear to comprise less than 5% of the overall deposit. The average density of the vesicular clasts is 0.92 ± 0.080 g/cm3.
This deposit is texturally similar to Package 1, part of the Ohinewairua eruptive period (∼11.6–13.6 ka), identified by Cowlyn (2016) and was found topographically upslope of that package.
Pyroclastic Density Current 6
PDC 6 was found 5.2 km from the vent, on the north-eastern slopes of the mountain where a small channel has exposed a 1 m cross-sectional view of the deposit. This deposit is massive, matrix supported, and poorly sorted (Figure 3F). Grainsizes range from ash to lapilli, with occasional cauliflower bombs (<50 cm) that comprise 2% of the outcrop. The majority of the clasts are sub-angular and vesicular. There are also occasional angular, dense lapilli clasts. The average density of the vesicular clasts is 1.3 ± 0.16 g/cm3.
Pyroclastic Density Current 7
This 1 m thick deposit was found 8.3 km from the vent in the valley of a small tributary to the Ohinepango stream on the north-eastern side of Mt. Ruapehu. PDC 7 is poorly sorted, massive, and matrix supported (Figure 3G). The grainsizes range from ash to lapilli, with occasional bombs (<15 cm) and angular blocks (<25 cm). These large blocks and bombs constitute for 5% of the outcrop. The clasts are angular to sub-angular, and dominantly vesicular. The average vesicular clast density is 1.3 ± 0.11 g/cm3.
Pyroclastic Density Current 8
PDC 8 was found as two long outcrops down a small valley on the southwestern flanks of the volcano. The deposits are located between 3.3 and 4.7 km from the vent. These gray and light pink outcrops are well indurated and some reach 4 m in visible thickness (Figure 3H). The deposit is poorly sorted, massive, and matrix supported. Grain sizes range from ash to bombs (<65 cm). The majority of clasts are well-rounded and mildly vesicular. Occasional well-rounded, dense clasts also occur (<50 cm). The average density of the dominant clasts type is 1.5 ± 0.044 g/cm3.
Pyroclastic Density Current 9
PDC 9 is a thin deposit found on the eastern side of Mt. Ruapehu 5.8 km from the vent. Only 1 m is exposed, which is well-indurated and massive. The deposit is supported by a pale ash matrix, with vesicular black lapilli (20%) and occasional dense lithic clasts (<2%) (Figure 3I). Vesicular clasts are sub-rounded, while the dense lithics are angular. The average vesicular clast density is 1.4 ± 0.036 g/cm3.
Pyroclastic Density Current 10
Found in a small valley on the eastern flanks of the volcano, 6.3 km from the vent, this 1 m thick deposit is pale brown, and poorly indurated. The outcrop is poorly sorted, massive, matrix supported, and is primarily composed of ash and vesicular lapilli (Figure 3J). There are also occasional vesicular bombs within the deposit (<15 cm) that constitute 1% of the outcrop. The clasts are primarily sub-rounded, and the average density is 0.92 ± 0.089 g/cm3.
PDC 10 is texturally similar to Unit 4 (Cowlyn, 2016), emplaced during the Taurewa eruptive period (∼11.6 ka), and is located in a valley adjacent to this unit.
Pyroclastic Density Current 11
PDC 11, found 2.9 km from the vent, is a light brown, poorly indurated ∼1 m thick deposit located as a single outcrop in a small depression on the south-western side of Mt. Ruapehu (Figure 3K). The deposit has a small lobate front, and is massive, poorly sorted, and matrix supported. Clast sizes range between ash and blocks (<20 cm). The clasts are primarily sub-rounded though many are sub-angular where fragmentation has occurred. The entire deposit is rich in vesicular clasts, with only occasional dense lithic clasts appearing at the surface. The average vesicular clast density is 1.2 ± 0.043 g/cm3.
Pyroclastic Density Current 12
This 1 m thick, 1 m wide deposit was found 1 km from the vent on the upper western side of Mt. Ruapehu, next to the Mangaturuturu Glacier. It is poorly sorted, massive, and clast supported. PDC 12 is primarily composed of black, vesicular, and sub-angular cauliflower bomb clasts (<50 cm) constituting for 60% of the deposit (Figure 3L). Vesicular lapilli and ash fill in the gaps between the larger clasts. The average clast density for this deposit is 1.1 ± 0.038 g/cm3.
Geochemistry
We show the total alkali silica diagram for classification purposes (Figure 4) and follow Cowlyn (2016) by plotting CaO/MgO (Figure 5).
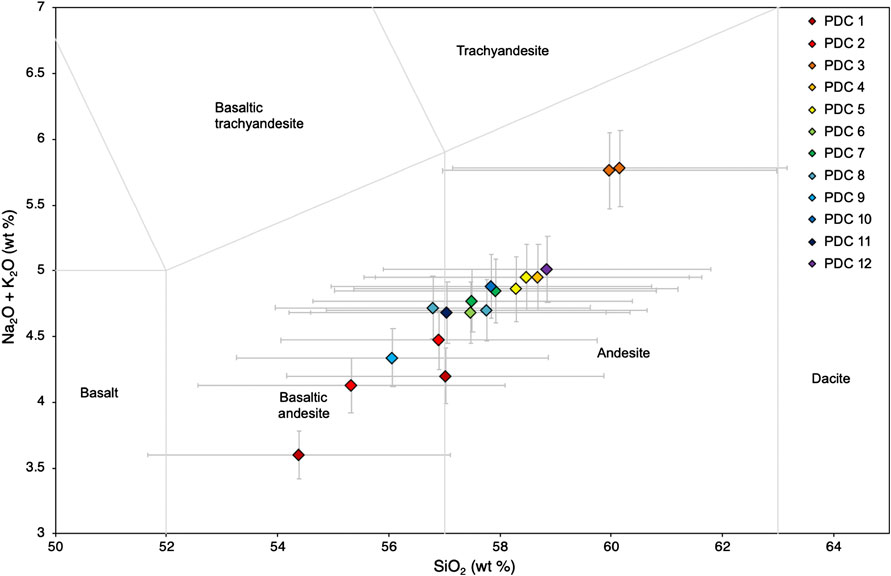
FIGURE 4. Total alkali silica diagram showing the geochemical distribution of the pyroclastic density currents (PDCs) identified in this study. All samples fall within the basaltic andesite–andesite range, though the majority are andesite.
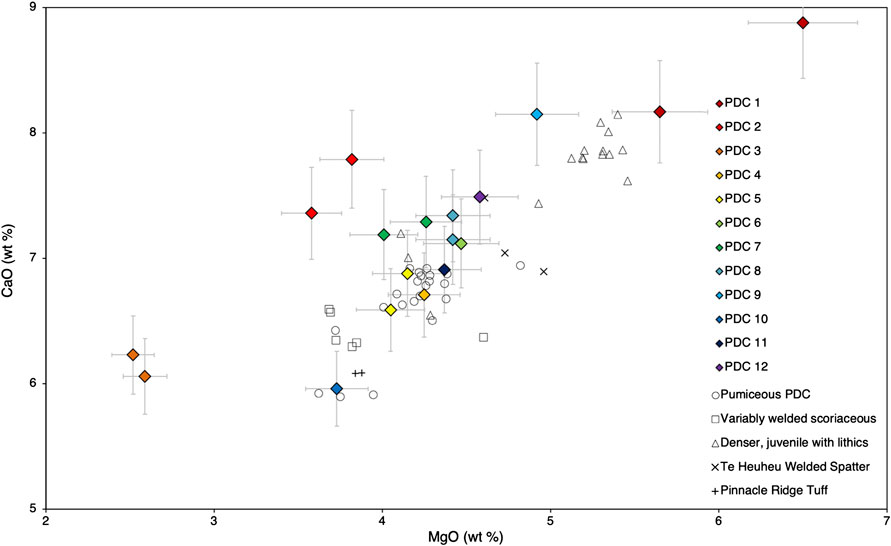
FIGURE 5. MgO/CaO geochemical diagram comparing pyroclastic density currents (PDCs) identified by Cowlyn (2016) (black symbols), and those PDCs identified in this study (colored symbols). PDC 1, PDC 2, and PDC 3 are outside of the geochemical range identified by Cowlyn (2016). The majority of the other samples are within the range and follow the trend of increasing MgO/CaO. For raw geochemistry data, see Appendix 2 in Supplementary Material.
Figure 4 shows that all deposits fall within the basaltic andesite to andesite geochemical range. PDC 1 is basaltic andesite and has the lowest SiO2 and Na2O + K2O wt% values. The compositions increase linearly into andesite. PDC 3, an andesite, has the highest SiO2 and Na2O + K2O wt% values. The majority of the compositions are andesite and plot closely together near the boundary between basaltic andesite and andesite.
The compositional range of the samples in Figure 5 is relatively small, with only 4 wt% SiO2 separating the lowest and highest sample. PDC 3 shows the lowest CaO and MgO wt% values, while PDC 1 displays the highest values. PDC 5 has a similar composition to the pumiceous PDC group identified by Cowlyn (2016) especially samples from Package 1. PDC 10 correlates with Unit 4 of the pumiceous PDC group and is separate from the other deposit compositions. Many of the deposits in this study have marginally higher CaO values than most of those identified by Cowlyn (2016).
Figure 6 shows two examples of the trace elements graphs used to compare the PDC deposits in this paper against the lava flow units from Conway et al. (2016) (Figure 6A) and explosive eruptive units from Pardo et al. (2012a) (Figure 6B). Figure 6A displays an overall positive linear trend, where Cr (ppm) increases with increasing MgO (wt%). This figure also shows PDC 1 within the range of the Te Herenga and Wahianoa Formations. This similarity can also be seen when using other trace elements. The remaining PDC deposits frequently occur within the ranges of multiple formations. Figure 6B shows an overall negative linear trend, with decreasing Ba (ppm) as MgO (wt%) increases. The majority of the PDC deposits fall frequently within the range of the Okupata-Pourahu and Oruamatua Eruptive Units. Like Figure 6A, the PDC deposits in Figure 6B plot within the geochemical ranges of multiple eruptive units. This makes it difficult to geochemically correlate the PDC deposits with specific eruptive units.
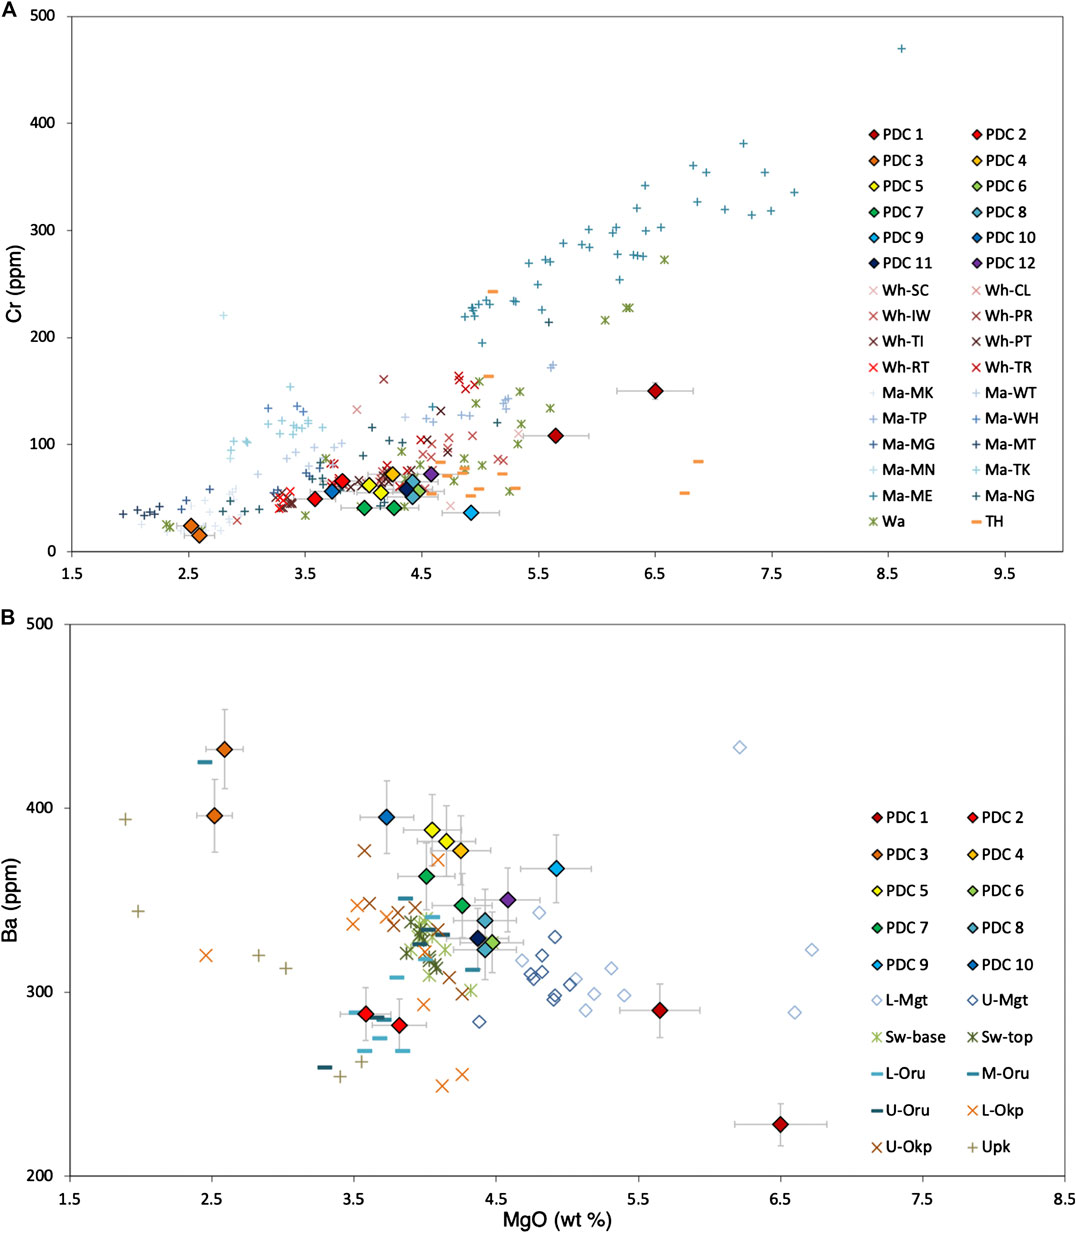
FIGURE 6. Trace element graphs used to compare pyroclastic density current (PCD) deposits with formations identified by Conway et al. (2016) (A), and Pardo et al. (2012a) (B). For a summary of geochemical correlations between these formations and the PDC deposits, see Table 1. For raw trace element data see Appendix 2 in Supplementary Material.
Deposit Ages
Table 1 provides a summary of the relative stratigraphy and geochemical correlations with dated units used to provide an approximate age range for the deposits identified in this study. The pyroclastic deposits identified in this study have been erupted throughout Mt. Ruapehu’s history. PDC 1, the oldest identified deposit, is located underneath thick lava flows from the Wahianoa Formation (115–160 ka). This suggests it was emplaced prior to 160 ka, and hence, within the Te Herenga Formation (180–250 ka) (Figure 7). This is supported by geochemical similarities between PDC 1 and the Te Herenga Formation (Figure 6A) (Conway et al., 2016; Townsend et al., 2017). The next oldest deposit, PDC 2, was observed above and below lava flows associated with the Wahianoa Formation (Conway et al., 2016; Townsend et al., 2017). Geochemically, this deposit also correlates with the Wahianoa Formation geochemistry (Figure 6A). Two other deposits, PDC 3 and PDC 4, were identified beneath lava flows from the Mangaheuheu Member (47–40 ka) in the Mangawhero Formation, and the Iwikau Member (<10 ka) in the Whakapapa Formation, respectively, (Conway et al., 2016; Townsend et al., 2017).
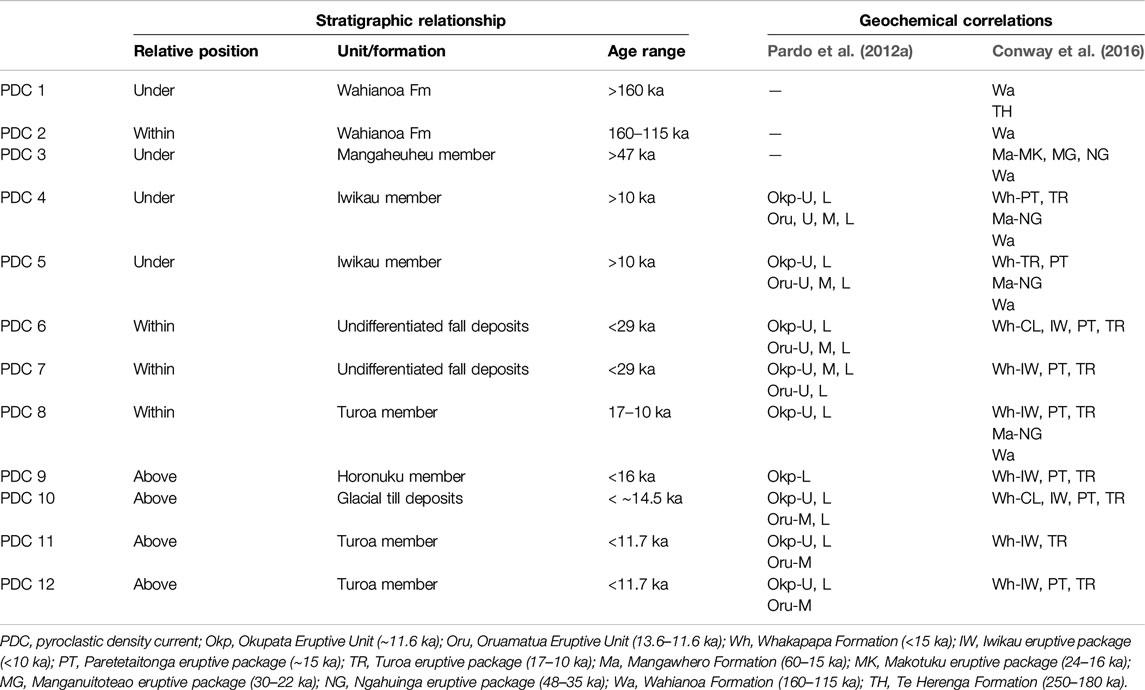
TABLE 1. Stratigraphic relationships of PDC deposits based on field observations and the geological map created by Townsend et al. (2017). Geochemical correlations for each deposit with formations and eruptive periods described by Conway et al. (2016) and Pardo et al. (2012a) are also summarized.
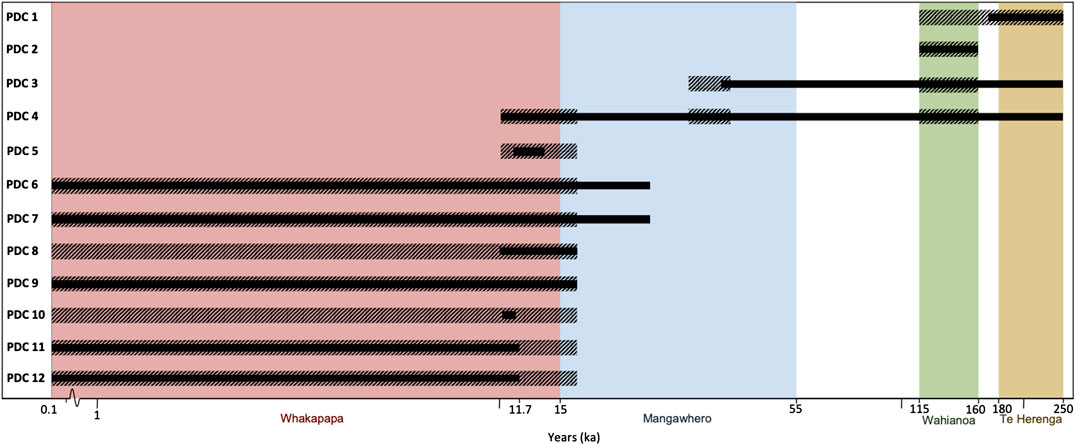
FIGURE 7. Possible age ranges of pyroclastic density currents (PCDs) identified during this study. Age ranges are based on the relative stratigraphy (solid bars) with mapped units, and geochemical correlations to known eruptions (dashed bars). Trace element correlations that do not fall within the range of the stratigraphic age bracket have not been included. The stratigraphic constraints for PDC 5 and PDC 10 are based on the ages of Package 1 and Unit 4, respectively, as they are extensions of these PDC deposits identified by Cowlyn (2016). See Table 1 for a summary of the stratigraphic relationships and geochemical correlations between the PDC deposits and known units and eruptive periods. Geological formations identified by Conway et al. (2016) are plotted along the age axis at a log10 scale. Geochemical data is from Pardo et al. (2014) and Conway et al. (2016). Relative stratigraphy is based on the geological map developed by Townsend et al. (2017).
Eight (66%) of the deposits were emplaced during the Whakapapa Formation. Many of these deposits were found overlying lava flows from the Turoa (17–10 ka) and Horonuku (29–16 ka) Members. PDC 6 and PDC 7 were found within undifferentiated fall deposits (<29 ka) (Townsend et al., 2017). PDC 5 is texturally and geochemically similar to Package 1 (Cowlyn, 2016). This deposit is found above lava flows associated with the Turoa Member (17 and 10 ka). Based on the similarities in texture and geochemistry, and overlap in age ranges, the approximate age of PDC 5 is based on that of Package 1 (∼13.6–11.6 ka) (Cowlyn, 2016). PDC 10 closely resembles Unit 4, texturally and geochemically (Cowlyn, 2016). This deposit was emplaced above glacial till deposits (14.5–45 ka) (Townsend et al., 2017). Due to the similarities in geochemistry and textures, and the overlap in relative stratigraphic ages, the age range for PDC 10 is based on Unit 4 (∼11.6 ka) (Cowlyn, 2016).
Discussion
Lithofacies
Here we describe the lithofacies for each deposit (Table 2) based on the textural characteristics observed in the field and interpret the PDC behavior based on these facies. The lithofacies classification is based on techniques used by Torres-Orozco et al. (2018) and Németh and White (2003). In Table 2, deposits that were rich in grainsizes ranging from blocks to ash, were given the code BLA (blocks, lapilli, ash). Deposits that were primarily lapilli and ash rich (containing <3% blocks) have the code LA (lapilli, ash). The grouping method was further separated into clast supported and matrix supported deposits. In each of those groups, there are subgroups for the dominant clast type. This includes pumice/scoria-rich, or rich in both vesicular clasts and dense clasts. The matrix supported group only has one subgroup as there were no matrix supported deposits that were rich in dense and vesicular clasts. Grading is included in this classification scheme to help infer the PDC behavior at the locations they were deposited. The textural characteristics and interpretations of generation, transport, and deposition mechanism are collated in Figure 8.
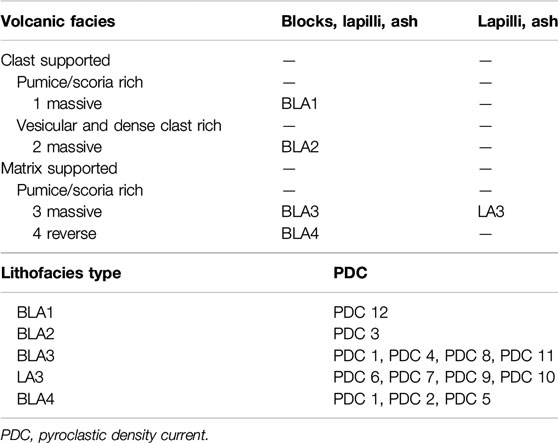
TABLE 2. Lithofacies classification system used to describe PDC deposits.
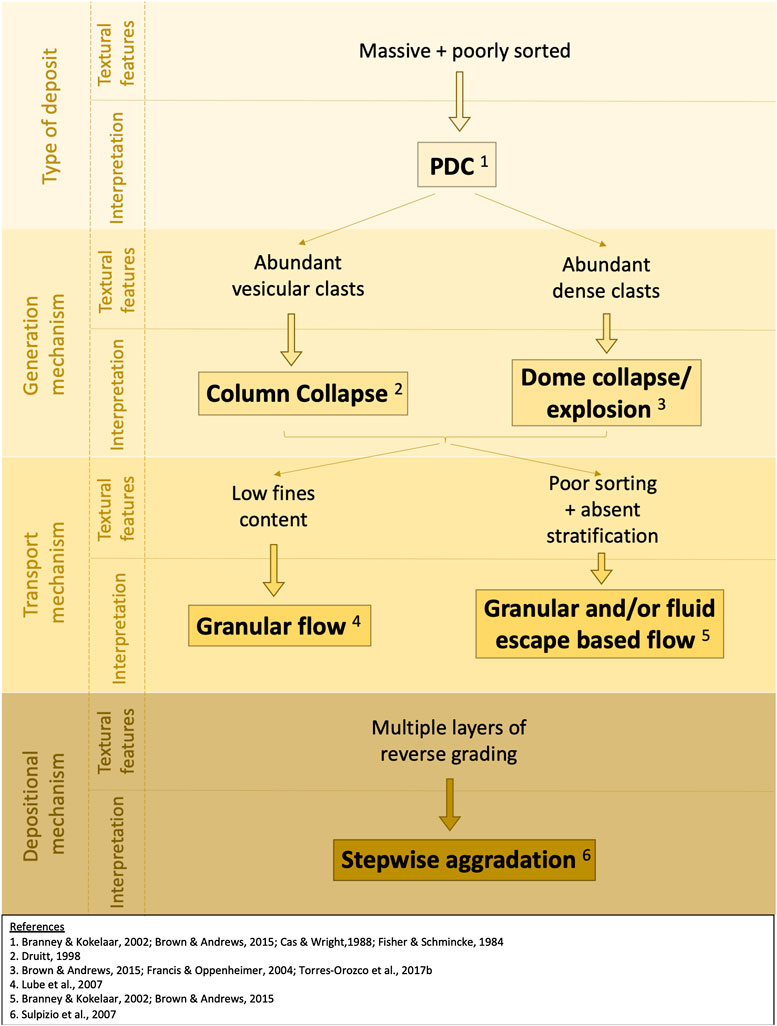
FIGURE 8. Workflow chart outlining the textural characteristics used to interpret the deposit type, generation mechanism, transport mechanism, and depositional model for the lithofacies. Stepwise aggradation is attributed to one lithofacies as there was not enough textural data to interpret the depositional model in other facies. Interpretations are described in more detail in Lithofacies.
BLA1
Description
This lithofacies was only found in PDC 12 in a topographic low. This facies is found proximally, 1 km from the vent. BLA1 is poorly sorted, massive, and clast supported. Less than 20% of ash was observed in this deposit. This facies consists of vesicular clasts with grainsizes ranging from blocks to ash. Clasts in this facies are black, sub-angular, and cauliflower bombs.
Interpretation
The proximity of the deposit to the vent (1 km) may indicate that this facies was deposited as proximal fall or ballistics. However, the presence of lapilli and ash infilling the gaps between the larger clasts indicates that this deposit may instead originate from a PDC (Branney and Kokelaar, 2002). The low fines content and large proportion of very coarse clasts suggest that this facies may have been transported by a granular flow regime where gas-fluidization was subordinate during transport and deposition (Lube et al., 2007). The absence of gas-escape structures also supports this interpretation.
BLA2
Description
BLA2 was only found in PDC 3 in a valley. This facies is found proximally, approximately 3 km from the vent. The deposit in this lithofacies is characterized as massive, clast supported, and rich in vesicular and dense clasts. Grainsizes range from blocks to ash. Vesicular clasts, which comprise approximately 30% of the deposit, are primarily sub-rounded, whereas the dense clasts are angular to sub-angular.
Interpretation
As this lithofacies is poorly sorted and massive, it has been inferred as a deposit from a concentrated PDC (Fisher and Schmincke, 1984; Branney and Kokelaar, 2002; Cas and Wright, 1988; Brown and Andrews, 2015). The scarcity of fine material, and absence of fluid-escape structures in this facies suggest that it may have been deposited under a granular flow regime where there was little fine ash to help facilitate gas-fluidization processes (Lube et al., 2007). The red and pink coloration observed in the deposit may have originated during PDC deposition. When freshly emplaced hot PDC deposits come into contact with water, steam is produced. As this steam rises through the deposit, it causes rapid thermal oxidation of iron within the deposit, resulting in a red coloration (Fisher and Schmincke, 1984; Francis and Oppenheimer, 2004; Cas and Wright, 1988). The abundance of dense clasts in this deposit indicates that it formed during a lava dome collapse or lava dome explosion PDC (Francis and Oppenheimer, 2004; Brown and Andrews, 2015; Torres-Orozco et al., 2017b). The significant proportion of vesicular clasts in this facies indicates that there may have been continued vesiculation of the erupted material after fragmentation of the lava dome (Brown and Andrews, 2015).
BLA3
Description
The BLA3 lithofacies was observed in four deposits (PDC 1, 4, 8, and 11), all of which occur in valleys. The facies is in the proximal to medial region, with deposits occurring between 3 and 7 km from the vent. The deposits are massive, matrix supported, and poorly sorted. This facies is rich in vesicular clasts, with few dense clasts. Grainsizes range from blocks (<65 cm) to ash. Clasts in this facies are primarily sub-rounded to well rounded.
Interpretation
The poorly sorted and massive characteristics suggests that this lithofacies was emplaced by PDCs (Fisher and Schmincke, 1984; Branney and Kokelaar, 2002; Cas and Wright, 1988; Brown and Andrews, 2015). The abundant vesicular clasts and scarcity of dense clasts indicates that the deposit may have been emplaced during a column collapse PDC (Druitt, 1998). The poor sorting and absence of stratification implies the PDC may have been concentrated with a granular fluid-based flow regime, where granular and/or fluid-escape processes may be predominant at different levels within the flow (Branney and Kokelaar, 2002; Brown and Andrews, 2015). Due to the lack of textural data we are unable to conclude that one transport mechanism was dominant over the other, so we include both mechanisms in these interpretations. No directional fabrics were observed in these facies which indicates that the grains in the flow did not experience significant shear as they were deposited, possibly due to deposition in a valley bottom or on low angle slopes (Branney and Kokelaar, 2002).
LA3
Description
This lithofacies was found in four deposits (PDC 6, 7, 9, and 10), which occur in small valleys and on topographic highs. LA3 is found in the upper medial region, with deposits occurring between 5 and 8 km from the vent. This facies is massive, matrix supported, poorly sorted, and rich in vesicular clasts. Occasional dense clasts also occur. Grainsizes primarily range from ash to lapilli, with <3% blocks in the deposits. Clasts are sub-rounded to sub-angular.
Interpretation
Like BLA3, the poor sorting and massive nature of the deposits suggest that this lithofacies was emplaced during PDCs (Fisher and Schmincke, 1984; Branney and Kokelaar, 2002; Cas and Wright, 1988; Brown and Andrews, 2015). Based on the highly vesicular clasts, and scarcity of dense clasts, LA3 may have been deposited during a column collapse PDC (Druitt, 1998). The lack of stratification and poor sorting also suggest that this facies may have been emplaced from a granular fluid-based flow regime (Branney and Kokelaar, 2002; Brown and Andrews, 2015). The smaller average grainsize in this facies may be a result of the flow’s inability to carry larger clasts, possibly due to a less energetic eruption or the distance traveled from the vent (Brown and Andrews, 2015), or a combination of both.
BLA4
Description
The BLA4 lithofacies is found in three deposits (PDC 1, 2, and 5), occurring in valleys and on valley sides. This facies is located in the proximal to medial region, found between 2 and 7 km from the vent. The deposits in this lithofacies are characterized as reverse graded, matrix supported, and poorly sorted. They are rich in vesicular clasts, and grainsizes range from blocks to ash. Occasional dense clasts also occur in this facies. Vesicular clasts are primarily sub-rounded.
Interpretation
The combination of poor sorting, and reverse grading suggests that this lithofacies was produced by a PDC (Branney and Kokelaar, 2002; Cas and Wright, 1988). The poor sorting and absence of stratification in this lithofacies indicate a potentially concentrated PDC with a granular fluid-based flow regime (Druitt, 1998; Branney and Kokelaar, 2002; Brown and Andrews, 2015). If transport was dominated by grain-to-grain interactions then reverse grading may have formed through kinetic sieving due to the dispersive pressure created during the flow (Sulpizio et al., 2014). Clast vibrations in the PDC generates pressure which inflates the granular mass. This dispersive pressure promotes the segregation of small particles downward into the gaps between larger particles, leaving the larger clasts toward the top of the flow-boundary zone. If this facies transport was instead dominated by fluid-escape processes the reverse grading may have been formed through floating processes due to the density contrast between the vesicular clasts and matrix of the flow (Branney and Kokelaar, 2002; Sulpizio et al., 2014). The presence of multiple layers of reverse grading in one of the deposits suggests that this lithofacies may have been emplaced through stepwise aggradation, where the main flow was deposited as several pulses, each displaying reverse grading (Sulpizio et al., 2007).
Limitations
In addition to the limitations associated with each individual method, there were other limitations that hindered the use of partial outcrops to make implications.
The short time frame, limited funds, and breadth of this study resulted in a restricted methodology, where some analyses, such as absolute age dating, were unable to be conducted. Age estimation based on stratigraphy and geochemistry had to be utilized instead. Due to the short time frame, only locations where PDC deposits were suspected were visited, leaving much of Mt. Ruapehu unexplored. Therefore, many PDC deposits may not have been located, leading to an underestimation of the PDC occurrence.
Most identified outcrops have been heavily eroded with little of the original deposit remaining. This limited the representativeness of field observations as the thickness and extent has been reduced over time. These small outcrops also made characterisation of the deposit difficult, as there was often not enough of the deposit exposed to see a cross-sectional view or spatial variations within the flow. This also hindered lithofacies interpretations. The scarcity of prehistoric PDC deposits also limits the estimation of PDC occurrence and frequency on Mt. Ruapehu.
Despite these limitations, this paper provides descriptions and characteristics of previously unstudied PDC deposits. This information acts as a foundation for further studies of PDCs on Mt. Ruapehu.
Conclusion
The updated PDC record presented here builds on previous work and extends the PDC history of Mt. Ruapehu. The main conclusions drawn from this study are as follows:
• Twelve new PDC deposits were identified. When combined with the deposits identified by Cowlyn (2016), taking into account some deposits that are extensions of their flows, and the known 1945 PDC, this is a total of 23 PDCs identified during these two studies. These were all emplaced during the past 250 ka years, and most in the past 15 ka years. Due to the poor preservation of pyroclastic material on glaciated volcanoes such as Mt. Ruapehu it is likely that many past PDCs deposits have been completely removed from the rock record. It is also likely that, due to the large field area of this project, other PDC deposits have been overlooked. These limitations have contributed to an underestimation of the PDC hazard on Mt. Ruapehu.
• PDC lithofacies at Mt. Ruapehu range from massive, clast supported deposits rich in vesicular and dense blocks and ash; to massive, matrix supported deposits dominated by vesicular lapilli and ash. Based on lithofacies characteristics the PDCs were identified as concentrated flows, with most dominated by granular fluid-based transport regimes. Two PDCs were dominated by granular flow regimes. These lithofacies also suggest that Mt. Ruapehu has erupted PDCs of varying styles, including column collapse and dome collapse or explosion. This proves that Ruapehu is capable of producing a wide spectrum of different PDCs, something that must be considered during future hazard planning on the volcano.
• This work extends the knowledge of PDCs on Mt. Ruapehu to >180 ka. Consistent with findings of Cowlyn (2016) and Pardo et al. (2012b) there is an abundance of PDCs after 15 ka. We conclude that this is likely due to poor preservation of deposits during glacial maximums on the mountain prior to this time. Poor preservation, particularly of small volume PDCs, needs to be considered in the future when attempting to quantify the frequency of PDCs at Mt. Ruapehu and at other volcanoes.
• This study highlights the importance of recognizing small to medium sized PDCs in the eruptive record at any volcano, especially where erosion or other processes may have played a substantial role in removing evidence of past events. Small PDC deposits may be heavily eroded, making them difficult to identify in the field. Techniques such as lithofacies classification may help in identifying and characterizing these PDC deposits and provide useful information for future hazard planning.
Overall, the evidence presented here necessitates continued comprehensive studies at Mt. Ruapehu to gain a better understanding of future PDC occurrence, and the threat they pose to nearby infrastructure and communities.
Data Availability Statement
All datasets generated for this study are included in the article/Supplementary Material.
Author Contributions
BK conceptualized the study. JG and BK conducted field work. GL provided logistical support prior to field work and background knowledge on the field area. JC contributed knowledge of previous studies. JG completed analyses and wrote the first draft of the manuscript. All authors contributed to interpretations and manuscript revision.
Funding
This research was assisted through funding from the University of Canterbury Mason Trust Fund and the Project Tongariro Memorial Award which supported field work and logistical arrangements.
Conflict of Interest
GL was employed by the company GNS Science. The remaining authors declare that the research was conducted in the absence of any commercial or financial relationships that could be construed as a potential conflict of interest.
Acknowledgments
We thank the NZ Department of Conservation and local iwi Ngāti Rangi and Ngāti Tuwharetoa for sampling permits, allowing access onto the land, blessing our samples, and introducing us to the cultural significance of Mt Ruapehu. Also Georg Zellmer and Anja Moebis from Massey University for assistance with geochemistry analyses, and the technical staff at the University of Canterbury for help with sample preparation and field work support. We also greatly appreciate the logistical support and detailed feedback of early versions of this manuscript from Dougal Townsend. BK also acknowledges GNS-RNC047, Resilience National Science Challenge: Volcanism theme. We would also like to thank the reviewers and editors for their time, patience and constructive feedback, which led to significant improvements in this paper.
Supplementary Material
The Supplementary Material for this article can be found online at: https://www.frontiersin.org/articles/10.3389/feart.2020.542932/full#supplementary-material
References
Auker, M. R., Sparks, R. S. J., Siebert, L., Crosweller, H. S., and Ewert, J. (2013). A statistical analysis of the global historical volcanic fatalities record. J. Appl. Volcanol. 2, 1–24. doi:10.1186/2191-5040-2-2
Barker, S. J., Rotella, M. D., Wilson, C. J. N., Wright, I. C., and Wysoczanski, R. J. (2012). Contrasting pyroclast density spectra from subaerial and submarine silicic eruptions in the Kermadec arc: implications for eruption processes and dredge sampling. Bull. Volcanol. 74, 1425–1443. doi:10.1007/s00445-012-0604-2
Branney, M. J., and Kokelaar, B. P. (2002). Pyroclastic density currents and the sedimentation of ignimbrites. London, UK: Geological Society.
Brown, R. J., and Andrews, G. D. (2015). “Deposits of pyroclastic density currents,” in Encyclopedia of volcanoes. 2nd Edn, Editors H. Sigurdsson, B. F. Houghton, S. Mcnutt, H. Rymer and J. Stix (San Diego, CA: Academic Press), 631–648.
Brown, R. J., and Branney, M. J. (2004). Event-stratigraphy of a caldera-forming ignimbrite eruption on Tenerife: the 273 ka Poris Formation. Bull. Volcanol. 66, 392–416. doi:10.1007/s00445-003-0321-y
Buchwaldt, R. (2013). “Pyroclastic flow,” in Encyclopedia of natural hazards. Editor P. T. Bobrowsky (Dordrecht, The Netherlands: Springer).
Calder, E. S., Sparks, R. S. J., and Gardeweg, M. C. (2000). Erosion, transport and segregation of pumice and lithic clasts in pyroclastic flows inferred from ignimbrite at Lascar Volcano, Chile. J. Volcanol. Geoth. Res. 104, 201–235. doi:10.1016/s0377-0273(00)00207-9
Cas, R. A. F., and Wright, J. V. (1988). Volcanic successions, modern and ancient: a geological approach to processes, products, and successions. London, Boston: Allen & Unwin/Chapman & Hall.
Charbonnier, S. J., and Gertisser, R. (2011). Deposit architecture and dynamics of the 2006 block-and-ash flows of Merapi Volcano, Java, Indonesia. Sedimentology 58, 1573–1612. doi:10.1111/j.1365-3091.2011.01226.x
Conway, C. E., Leonard, G. S., Townsend, D. B., Calvert, A. T., Wilson, C. J. N., Gamble, J. A., et al. (2016). A high-resolution 40Ar/39Ar lava chronology and edifice construction history for Ruapehu volcano, New Zealand. J. Volcanol. Geoth. Res. 327, 152–179. doi:10.1016/j.jvolgeores.2016.07.006
Cowlyn, J. D. (2016). Pyroclastic density currents at Ruapehu volcano; New Zealand. PhD thesis. Christchurch: University of Canterbury.
Degruyter, W., and Bonadonna, C. (2013). Impact of wind on the condition for column collapse of volcanic plumes. Earth Planet. Sci. Lett. 377–378, 218–226. doi:10.1016/j.epsl.2013.06.041
Donoghue, S. L., Gamble, J. A., Palmer, A. S., and Stewart, R. B. (1995). Magma mingling in an andesite pyroclastic flow of the Pourahu Member, Ruapehu volcano, New Zealand. J. Volcanol. Geoth. Res. 68, 177–191. doi:10.1016/0377-0273(95)00012-j
Donoghue, S. L., Palmer, A. S., Mcclelland, E., Hobson, K., Stewart, R. B., Neall, V. E., et al. (1999). The Taurewa Eruptive Episode: evidence for climactic eruptions at Ruapehu volcano, New Zealand. Bull. Volcanol. 61, 223–240. doi:10.1007/s004450050273
Druitt, T. H. (1998). “Pyroclastic density currents,” in The Physics of Explosive Volcanic Eruptions: Geological Society of London Special Publication. Editors J. Gilbert, R. S. J. Sparks (Bath), Vol. 145, 145–182.
Dufek, J., Ongaro, T. E., and Roche, O. (2015). “Pyroclastic density currents: processes and models,” in The Encyclopedia of Volcanoes. (Academic Press), 617–629.
Hackett, W. R. (1985). Geology and petrology of Ruapehu volcano and related vents. PhD thesis. Wellington: Victoria University of Wellington.
Hackett, W. R., and Houghton, B. F. (1989). A facies model for a quaternary andesitic composite volcano: Ruapehu, New Zealand. Bull. Volcanol. 51, 51–68. doi:10.1007/bf01086761
Houghton, B. F., Latter, J. H., and Hackett, W. R. (1987). Volcanic hazard assessment for Ruapehu composite volcano, taupo volcanic zone, New Zealand. Bull. Volcanol. 49, 737–751. doi:10.1007/bf01079825
Houghton, B. F., and Wilson, C. J. N. (1989). A vesicularity index for pyroclastic deposits. Bull. Volcanol. 51, 451–462. doi:10.1007/bf01078811
Johnston, D. M., Houghton, B. F., Neall, V. E., Ronan, K. R., and Paton, D. (2000). Impacts of the 1945 and 1995-1996 Ruapehu eruptions, New Zealand: an example of increasing societal vulnerability. Geol. Soc. Am. Bull. 112, 720–726. doi:10.1130/0016-7606(2000)112<720:iotare>2.0.co;2
Johnston, D. M., and Neall, V. E. (1995). Ruapehu awakens: the 1945 eruption of Ruapehu. Issue 1 of Science Centre and Manawatu Museum Scientific Monograph. Palmerston North, New Zealand: Science Centre and Manawatu Museum.
Kilgour, G., Blundy, J., Cashman, K., and Mader, H. M. (2013). Small volume andesite magmas and melt-mush interactions at Ruapehu, New Zealand: evidence from melt inclusions. Contrib. Mineral. Petrol. 166, 371–392. doi:10.1007/s00410-013-0880-7
Lube, G., Cronin, S. J., Platz, T., Freundt, A., Procter, J. N., Henderson, C., et al. (2007). Flow and deposition of pyroclastic granular flows: a type example from the 1975 Ngauruhoe eruption, New Zealand. J. Volcanol. Geoth. Res. 161, 165–186. doi:10.1016/j.jvolgeores.2006.12.003
Lube, G., Cronin, S. J., Thouret, J.-C., and Surono, S. (2011). Kinematic characteristics of pyroclastic density currents at Merapi and controls on their avulsion from natural and engineered channels. Geol. Soc. Am. Bull. 123, 1127–1140. doi:10.1130/b30244.1
Manville, V., Hodgson, K. A., Houghton, B. F., Keys, J. R., and White, J. D. L. (2000). Tephra, snow and water: complex sedimentary responses at an active snow-capped stratovolcano, Ruapehu, New Zealand. Bull. Volcanol. 62, 278–293. doi:10.1007/s004450000096
Németh, K., and White, J. D. L. (2003). Reconstructing eruption processes of a Miocene monogenetic volcanic field from vent remnants: Waipiata volcanic field, South Island, New Zealand. J. Volcanol. Geoth. Res. 124, 1–21. doi:10.1016/s0377-0273(03)00042-8
Pardo, N. (2012). Andesitic Plinian eruptions at Mt. Ruapehu (New Zealand): from lithofacies to eruption dynamics. PhD in earth science. Palmerston North: Massey University.
Pardo, N., Cronin, S. J., Palmer, A., and Németh, K. (2012a). Reconstructing the largest explosive eruptions of Mt. Ruapehu, New Zealand: lithostratigraphic tools to understand subplinian-plinian eruptions at andesitic volcanoes. Bull. Volcanol. 74, 617–640. doi:10.1007/s00445-011-0555-z
Pardo, N., Cronin, S. J., Palmer, A., Procter, J., and Smith, I. (2012b). Andesitic Plinian eruptions at Mt. Ruapehu: quantifying the uppermost limits of eruptive parameters. Bull. Volcanol. 74, 1161–1185. doi:10.1007/s00445-012-0588-y
Pardo, N., Cronin, S. J., Wright, H. M. N., Schipper, C. I., Smith, I., and Stewart, B. (2014). Pyroclast textural variation as an indicator of eruption column steadiness in andesitic Plinian eruptions at Mt. Ruapehu. Bull. Volcanol. 76, 1–19. doi:10.1007/s00445-014-0822-x
Price, R. C., Gamble, J. A., Smith, I. E. M., Maas, R., Waight, T., Stewart, R. B., et al. (2012). The anatomy of an andesite volcano: a time-stratigraphic study of andesite petrogenesis and crustal evolution at Ruapehu volcano, New Zealand. J. Petrol. 53, 2139–2189. doi:10.1093/petrology/egs050
Stinton, A. J., and Sheridan, M. F. (2008). Implications of long-term changes in valley geomorphology on the behavior of small-volume pyroclastic flows. J. Volcanol. Geoth. Res. 176, 134–140. doi:10.1016/j.jvolgeores.2008.01.010
Sulpizio, R., Dellino, P., Doronzo, D. M., and Sarocchi, D. (2014). Pyroclastic density currents: state of the art and perspectives. J. Volcanol. Geoth. Res. 283, 36–65. doi:10.1016/j.jvolgeores.2014.06.014
Sulpizio, R., Mele, D., Dellino, P., and La Volpe, L. (2007). Deposits and physical properties of pyroclastic density currents during complex Subplinian eruptions: the AD 472 (Pollena) eruption of Somma-Vesuvius, Italy. Sedimentology 54, 607–635. doi:10.1111/j.1365-3091.2006.00852.x
Terry, R. D., Chilingar, G. V., and Hancock, A. (1955). Summary of “Concerning some additional aids in studying sedimentary formations,” by M. S. Shvetsov. J. Sediment. Res. 25, 229–234. doi:10.1306/74d70466-2b21-11d7-8648000102c1865d
Torres-Orozco, R., Cronin, S. J., Damaschke, M., and Pardo, N. (2017a). Diverse dynamics of Holocene mafic-intermediate Plinian eruptions at Mt. Taranaki (Egmont), New Zealand. Bull. Volcanol. 79, 1–27. doi:10.1007/s00445-017-1162-4
Torres-Orozco, R., Cronin, S. J., Pardo, N., and Palmer, A. S. (2017b). New insights into Holocene eruption episodes from proximal deposit sequences at Mt. Taranaki (Egmont), New Zealand. Bull. Volcanol. 79, 1–25. doi:10.1007/s00445-016-1085-5
Torres-Orozco, R., Cronin, S. J., Pardo, N., and Palmer, A. S. (2018). Volcanic hazard scenarios for multiphase andesitic Plinian eruptions from lithostratigraphy: insights into pyroclastic density current diversity at Mount Taranaki, New Zealand. Bull. Geol. Soc. Am. 130, 1645–1663. doi:10.1130/b31850.1
Townsend, D. B., Leonard, G. S., Conway, C. E., Eaves, S. R., and Wilson, C. J. N. (2017). Geology of the Tongariro National Park area. GNS Science geological map 4. Lower Hutt, New Zealand: GNS Science.
Valentine, G. A., Perry, F. V., and Woldegabriel, G. (2000). Field characteristics of deposits from spatter-rich pyroclastic density currents at Summer Coon volcano, Colorado. J. Volcanol. Geoth. Res. 104, 187–199. doi:10.1016/s0377-0273(00)00206-7
Keywords: pyroclastic density currents, relative stratigraphy, Ruapehu volcano, hazard, lithofacies, column collapse, dome explosion, geochemistry
Citation: Gillies JK, Kennedy BM, Gravley DM, Leonard GS and Cowlyn J (2020) Identifying Pyroclastic Density Currents From Partial Outcrop Exposure on Mt. Ruapehu, New Zealand. Front. Earth Sci. 8:542932. doi:10.3389/feart.2020.542932
Received: 14 March 2020; Accepted: 24 August 2020;
Published: 16 September 2020.
Edited by:
Laura Sandri, National Institute of Geophysics and Volcanology, ItalyReviewed by:
Claudio Scarpati, University of Naples Federico II, ItalySylvain Charbonnier, University of South Florida, United States
Copyright © 2020 Gillies, Kennedy, Gravley, Leonard and Cowlyn. This is an open-access article distributed under the terms of the Creative Commons Attribution License (CC BY). The use, distribution or reproduction in other forums is permitted, provided the original author(s) and the copyright owner(s) are credited and that the original publication in this journal is cited, in accordance with accepted academic practice. No use, distribution or reproduction is permitted which does not comply with these terms.
*Correspondence: Janina Gillies amFuaW5hLmdpbGxpZXNAZ21haWwuY29t