 S. J. Charbonnier1*J.-C. Thouret2V. Gueugneau1R. Constantinescu1
- 1School of Geosciences, University of South Florida, Tampa, FL, United States
- 2Laboratoire Magmas et Volcans, CNRS, OPGC et IRD, Université Clermont-Auvergne, Aubière, France
Pyroclastic currents (PCs) are the most challenging volcanic hazards for disaster planners in populated areas around volcanoes. “El Misti” volcano (5,825 m above sea level), located only 17 km from the city center of Arequipa (>1.1 million inhabitants), South Peru, has produced small-to-moderate volume (<1 km3) PCs with a frequency of 2,000–4,000 years over the past 50 kyr. The most recent Plinian eruption dated at 2070 cal yr BP (VEI 4) has been selected as one of the reference events for the hazard assessment and risk mitigation plan of Arequipa. Associated pumice- and lithic-rich PC deposits were emplaced from at least four phases of column-collapse into the radial valleys draining the volcano as far as 13 km toward the city. Field mapping and stratigraphic surveys conducted in seven valleys affected by the 2070 cal yr BP PCs were combined with a new high-resolution (2 m) digital surface model of the volcano to better estimate the distribution of individual PC volumes. Such data acquisition is particularly critical for two of these valleys (San Lázaro and Huarangal-Mariano Melgar) for which the medial and distal reaches now cross the suburbs of Arequipa. The total area covered by the PC deposits is estimated at 141 km2 for a total bulk volume estimated at 406 ± 140 × 106 m3. These volumes were used as input parameters to better calibrate probabilistic numerical simulations of future similar PC events using the two-layer VolcFlow model and assess the impacts of both the concentrated and dilute portions of these currents in the San Lázaro and Huarangal valleys. We discuss probability values of PC inundation obtained from these simulations both in terms of their implications for the dynamics of such hazardous PCs at El Misti and for their integration into its current multi-hazard assessment. Modeling results demonstrate that the risk of overbank processes and spreading of unconfined PCs inside Arequipa should be refined. This multi-disciplinary study aims to help the civil authorities’ understanding of the likely effects of PCs associated with a similar VEI 4 eruption of El Misti on the urban area of Arequipa.
Introduction
Pyroclastic currents (PCs) are one of the most dangerous and least understood phenomena of explosive volcanism, leading to the highest number of fatalities during recent explosive eruptions. In the past decade alone, more than 1,000 people were killed by PCs around the world [e.g., Merapi (Indonesia) in 2010 (Surono et al., 2012), Sinabung (Indonesia) in 2014 and 2016 (Andreastuti et al., 2019), Fuego (Guatemala) in 2018 (Charbonnier et al., 2019), White Island (New Zealand) in 2019]. With more than 500 million people living in the proximity of an active volcano around the world and growing populations spreading over their flanks (Marti, 2017), improved methodologies and techniques for quantitative PC hazard assessment constitute a primary research objective in volcanology and volcanic hazard sciences. In this paper, we use the example of El Misti volcano (Peru) and its last Plinian eruption (∼2070 calibrated 14C years or “cal yr” BP) to demonstrate how robust field and laboratory work, along with high-resolution satellite imagery, can inform state-of-the-art computer models and drive a fully probabilistic PC hazard assessment at this high-risk volcano.
El Misti volcano (5,822 m), located in southern Peru within the northern segment of the Central Andes volcanic zone, is potentially one of the most active volcanoes in the region (Thouret et al., 2001; Harpel et al., 2011; Cobeñas et al., 2012). Arequipa, the second largest city and economic center of Peru with a population of 1,130,000 (as of 2017), is located at the foot of El Misti. The city center lies only 17 km southwest of El Misti’s crater and approximately 3.5 km below the summit (Figure 1). In the past, El Misti has displayed a variety of eruptive styles, including Vulcanian and Plinian eruptions (Table 1).
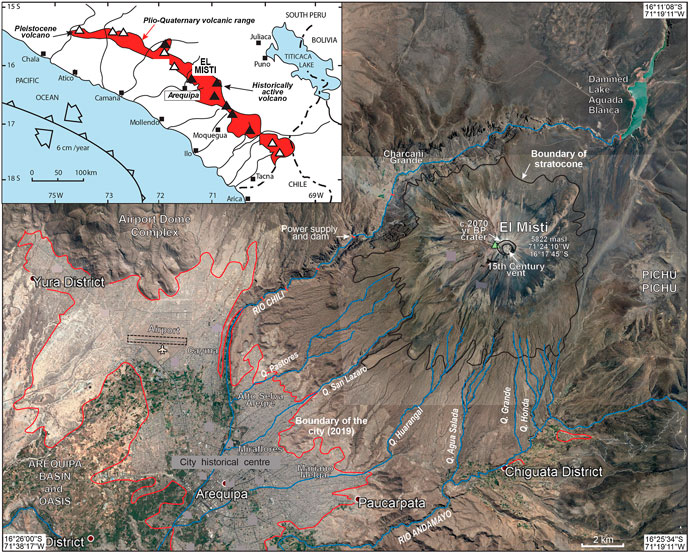
FIGURE 1. Google Earth image of El Misti volcano showing the principal geological features, the drainage network in blue (Río Chili Valley and its tributaries Quebradas = seasonal ravines), and the urban area of the city of Arequipa (red line). The bold line indicates the boundary between El Misti stratocone and its ring plain. Inset: location of El Misti volcano in the central volcanic zone in south Peru.
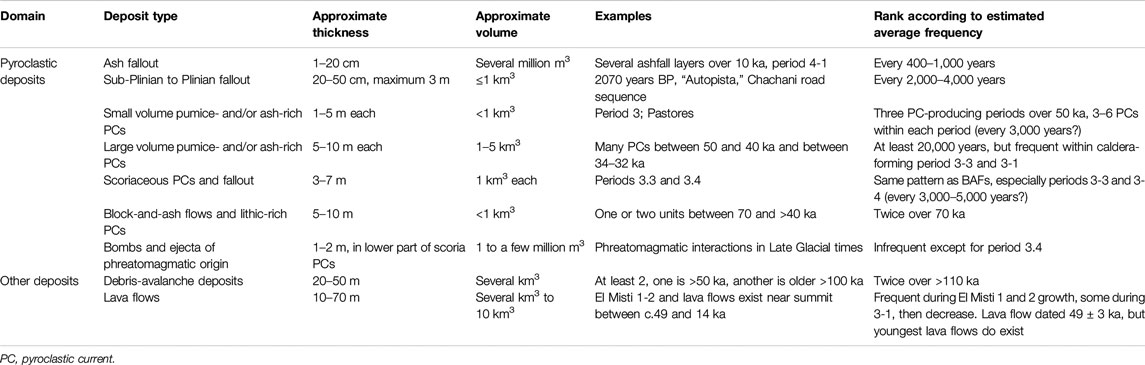
TABLE 1 . Summary of magnitude and frequency data for each eruptive and non-eruptive phenomenon at El Misti volcano collected from eruptive records over the last 50 kyr of activity. Modified from Sandri et al. (2014).
From these, two eruptions have been selected as reference hazard scenarios (Sandri et al., 2014): 1) The small magnitude and high frequency VEI 2 (Volcanic Explosivity Index, Newhall and Self, 1982) Vulcanian eruption that occurred in 1440–1470 CE (Chávez Chávez, 1992) and emplaced an andesitic plug in the 400 m-wide vent, nested in the large 2070 cal yr BP crater, is the most likely scenario for renewed activity; 2) The VEI 4 2070 cal yr BP event (weighted mean age 2070 ± 20 14C cal yr BP, i.e., 1990–2060 cal yr BP; Cobeñas et al., 2014) because of its high recurrence rate, estimated between 2,000 and 4,000 years based on the chrono-stratigraphical dataset (see Table 1 and Thouret et al., 2001; Sandri et al., 2014). The aim of Cobeñas et al. (2012, 2014) was to describe and explain how the 2070 cal yr BP tephra fallout and PC deposits were formed, and to understand the mechanisms that triggered the eruption with a rationale of providing civil authorities with a clear understanding of the likely effects of a major eruption of El Misti on Arequipa’s urban area. With an increasing population and sprawling of developed area by ≥30% in the past 30 years, one of the goals of this study is to re-assess the PC extents, volumes and hazards around El Misti, using new high-resolution field-based, remote sensing, and numerical modeling tools.
Field mapping and stratigraphic surveys conducted in seven valleys affected by the 2070 years BP PCs were combined with a new high-resolution (2 m) digital surface model (DSM) of the volcano obtained by fusing a stereo-pair of Pleiades optical images with lower-resolution (10 m) TanDEM-X (TDX) radar data. Surveys and DSM embedded in GIS tools allow to better estimate the distribution of individual PC volumes emplaced in each of the valleys impacted by this Plinian event. In addition, sedimentological analyses were performed on 16 samples collected during stratigraphic surveys to investigate the facies variations of the main valley-confined PC deposit units both longitudinally and laterally across the NW to SE flanks. Finally, this dataset was used to calibrate the source conditions (i.e., location, initial volume, and particle mean diameter) for probabilistic numerical simulations of potential similar PC events on the SW flank of the volcano using the two-layer VolcFlow model and assess the impacts of both the concentrated and dilute portions of these currents in Arequipa. We discuss probabilities of PC inundation both in terms of their implications for the dynamics of such highly mobile PCs and for their integration into the current multi-hazard assessment at this high-risk volcano. This multi-disciplinary study contributes to the current endeavor, led jointly by several national and international institutions, to revise the hazard-zone map of El Misti to be published in 2021.
The 2070 cal yr BP Eruption and Associated Deposits
Pyroclastic deposits were identified in previous studies by Navarro Colque (1999), Suni Chambi (1999), Thouret et al. (1995, 1999, 2001), Legros (2001) and Harpel et al. (2011). The 2070 cal yr BP deposits are part of El Misti’s fourth growth stage of Holocene age (Thouret et al., 2001; Cobeñas et al., 2012; Sandri et al., 2014), overly the 3,300–3,800 cal yr BP pyroclastic deposit and underlie the tephra fallout layer of the mid-15th Century event. The 2070 cal yr BP Plinian (VEI 4) eruption of El Misti is divided into five eruptive stages based on deposit stratigraphy: 1) a lower tephra layer deposited from a 21–24 km-high eruptive column, 2) a thin sand-sized, lithic-rich, middle tephra layer associated with the collapse of the crater walls and partial obstruction of the vent, 3) an upper tephra layer deposited when the Plinian eruption column resumed, 4) PC deposits produced by subsequent collapses of the column, 5) an uppermost unit made of a coarse, lithic-rich debris-avalanche deposit attributed to failure of the hydrothermally altered part of the crater rim toward the S and SE (Cobeñas et al., 2012). Tephra and PC deposits from the 2070 cal yr BP eruption were analyzed by Cobeñas et al. (2012), but their findings have been challenged by Harpel et al. (2011, 2013), in particular concerning the determination of the origin -PC vs. lahar- of some of the 2070 cal yr BP deposits. Subsequently, the characteristics of PCs and criteria for distinguishing all deposits associated to the 2070 cal yr BP event have been re-assessed by Cobeñas et al. (2014). We refer the reader to the aforementioned studies for a detailed description of the eruption source parameters and associated tephra fallout deposits. To summarize, the Plinian column rose up to 21–24 km and associated tephra fallout deposits covered an area of at least 2,580 km2 within the 5 cm-isopach line (Figure 2). Eruption duration was estimated between 0.6 and 2.3 h (yielding mass discharge rate between 6.3 × 10⁷ and 1.1 × 10⁸ kg/sec) for a total bulk volume estimated by Cobeñas et al. (2012) at 1.2 km3, including between 0.2 and 0.6 km3 of tephra fallout. The preserved lobe of the 2070 cal yr BP fallout deposit (about 30 cm thick at 9–15 km SW of source) extends as far as 28 km from the summit toward the south and southwest (Figure 2).
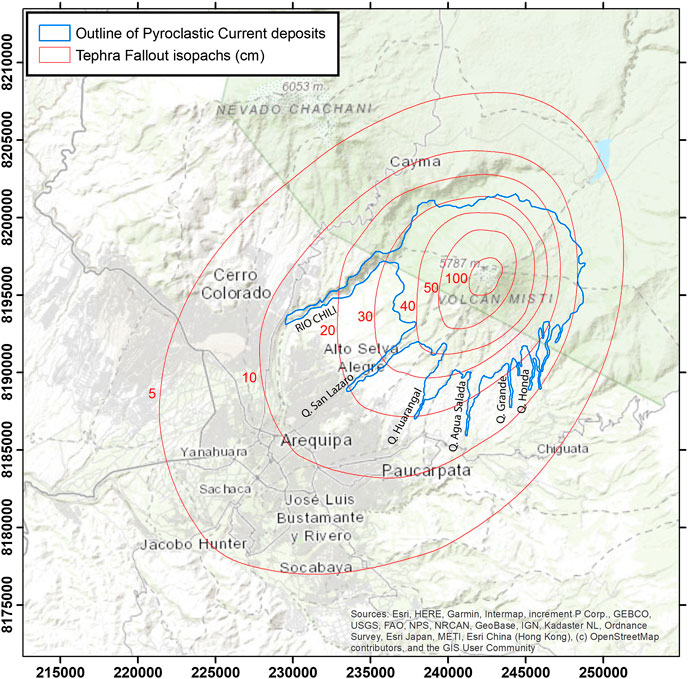
FIGURE 2. Map of the 2070 cal yr BP eruptive deposits with pyroclastic current deposits outlined in blue and tephra fallout isopachs (in cm) delineated in red. Names of the studied valleys are indicated in black. Background map is from the ESRI World Topographic Map (source: ESRI). Modified from Cobeñas et al. (2012).
Pumice- and lithic-rich PC deposits were channeled along several radial ravines and the Río Chili, the main artery incising the west flank of El Misti (Figure 2). The PC deposits either form 5–8 m thick fans on the SW and south slopes or are confined in the pre-existing ravines: the thickness of the preserved valley-confined PC deposits reaches at least 5 m in the Río Chili canyon, and 10–20 m in the ravines draining the SW and south flanks [e.g., Quebradas (Q.) Pastores, San Lázaro, Huarangal also termed “Mariano Melgar (MM),” see Figure 1 for locations] as far as 13 km from the vent. The preserved valley-confined PC deposits are thicker (10–40 m) toward the south and SE, particularly in the Q. Agua Salada, Q. Honda, and Q. Grande where they reached 8–11 km from the summit. Although tephra fallout deposits <10 cm was measured on the northern flank of El Misti, PC deposits have not been observed possibly due to the absence of deep ravines. However, PC deposits can be observed in the middle reach of the Río Chili canyon along with a thick debris avalanche deposit. Such deposits are also present near Charcani Grande upstream of the Río Chili canyon (Figure 1), suggesting that PCs also flowed down the NW flank.
The sharp erosional contact between the tephra fallout and the overlying PC deposits indicates that the currents were emplaced immediately after the pumice fallout, probably due to several episodes of column collapses (Harpel et al., 2011; Cobeñas et al., 2012). However, in the Q. Agua Salada, layers up to 5 cm thick of openwork pumices are intercalated within the lower unit of PC deposits (see Stratigraphy and Mapping and Cobeñas et al., 2014). Previous authors interpreted the intercalated pumice layers within PC deposits as follows: during the Plinian tephra fallout, whose dispersal axis was oriented toward the SW, the majority of PCs were emplaced toward the south in the Agua Salada valley, which is located 8 km off the main axis of the tephra dispersal to the East (Figure 2).
The abundance of lithic clasts and hydrothermal altered fragments in lithic-rich PC units, and the coarse debris avalanche deposit directly overlying the PC deposits toward the south and SE of El Misti suggest that PCs eroded and included parts of the instable uppermost south slope [above 4,800 m above sea level (asl)] during their emplacement. Presently, on the south rim of the 900 m-diameter summit crater, a notch cuts through the hydrothermal system and extends down toward a steep-sided flute and amphitheater carved in unstable rocks. The debris avalanche deposit is witness to the partial collapse of the hydrothermally altered summit above 5,400 m asl, perhaps as the consequence of removal of material by PCs flowing over the south and SE flanks (Cobeñas et al., 2014).
Data Acquisition and Materials
Optical Imagery and Digital Surface Model Generation
A combination of optical and radar imagery were acquired and processed to generate an improved DSM of the El Misti-Arequipa area (Figure 3). Firstly, a stereo-pair of very high-spatial resolution panchromatic (0.5 m) and multispectral (2 m) Pleiades-1A images taken on March 28, 2013, which covered an area including the western part of the volcano as well as the entire city of Arequipa and its suburbs (Figure 3), was processed with the ERDAS Imagine software (Hexagon Geospatial). Using the Photogrammetry toolbox, a DSM of 2 m spatial resolution was extracted after performing an automatic tie point generation and triangulation. Different combinations of parameters for the photogrammetric processing were tested and we opted for those that maximized the number of matched points [see Bagnardi et al. (2016) for more details about this procedure]. In addition, the differential Global Positioning System solutions for the X, Y, and Z position of 58 selected ground control points (GCPs) measured in July 2010 were used to assess the horizontal and vertical accuracy of the new Pleiades DSM. The mean offsets between the selected GCPs and their clearly visible positions in a pansharpened image are <2.0 m (less than the size of one DSM cell) horizontally and 0.87 ± 2.86 m vertically, much lower than the nominal absolute location accuracy of Pleiades-1A imagery (8.5 m after Oh and Lee, 2014).
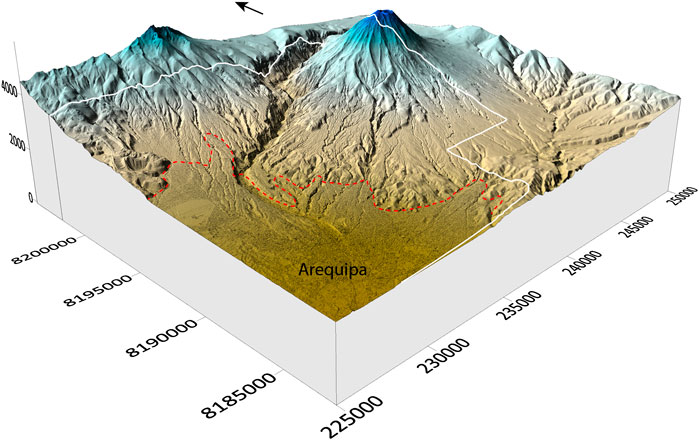
FIGURE 3. 3-D view of the 2 m fused digital surface model oriented from Arequipa to the NE. The white outline defines the boundary between the coverage of the 2 m Pleiades digital surface model (on the west) and the 10 m TanDEM-X DEM (on the east). The red dashed outline defines the boundary of the urban area of Arequipa. The black arrow indicates the North direction. Coordinates are in UTM meters.
Secondly, in order to cover the summit area of the volcano and the eastern portion of the studied area (Figure 3), a digital elevation model (DEM) of 10 m spatial resolution was generated using a pair of bistatic synthetic aperture radar data taken from the TDX mission (German Aerospace Center, DLR) in 2011 and 2013. Details about the adaptive TDX DEM merging strategy employed, as well as statistical information on the TDX coherence and elevation difference maps generated, can be found in Charbonnier et al. (2018). To reduce the effect of geometric distortions inherent in synthetic aperture radar images, TDX DEMs generated from ascending and descending orbits were combined [see Charbonnier et al. (2018) for details]. The same assessment as for the Pleiades DSM was also performed, for completeness, on the 10 m resolution TDX DEM using the same 58 selected GCPs. Residual ramps remained in the elevation difference between the TDX DEM and Pleiades DSM, which could be due to processing errors of the TDX data. The ramp was fitted with a quadratic polynomial using the least-squares method (e.g., Poland, 2014; Arnold et al., 2017), and removed from the original TDX DEM.
Finally, the Pleiades and TDX DEMs were fused in order to close any remaining data gaps and obtain a single DSM of the entire study area. Using the grid mosaicking tool from the SURFER software (Golden Software, 2018), the fused DSM was generated using a bilinear interpolation resample method with a 9 × 9 pixel averaging window in order to smooth the transition at the edges of different data sets.
Field Data
Two field campaigns were carried out in May 2018 and 2019 to collect new data and samples from the 2070 cal yr BP PC deposits. Following the work done by Cobeñas et al. (2012, 2014) on the stratigraphy and sedimentology of these deposits, we focused our field mapping, stratigraphic survey and sampling in seven radial valleys (from northwest to southeast) affected by the various 2070 cal yr BP PCs: Río Chili, Q. Pastores, Q. San Lázaro, Q. Huarangal, Q. Agua Salada, Q. Grande and Q. Honda (Figure 1). In order to better estimate the volume of these deposits, 45 thickness measurements of the different PC units were collected using a TruePulse 360 laser rangefinder with a vertical accuracy of <0.3 m within the range of horizontal distances (<100 m) measured. Additional 15 thickness measurements were collected digitally, using the new elevation data acquired from the Pleiades DSM at 2 m spatial resolution with the VHR panchromatic Pleiades-1A images draped on top for clear visible recognition of the 2070 cal yr BP PC outcrops, along the different valleys surveyed in the field (Figure 4). Because distal valley-confined PC deposits have been eroded away, we focus our data collection on the proximal and medial channeled deposits at distances from 5.2 to 9.5 km to the summit. Stratigraphic logs were built at each location to identify and describe the different PC units and their facies, as well as tentatively correlate them longitudinally inside the same channel and laterally across the different radial valleys (Figure 5). Volumes of the different PC deposits were calculated using the ArcGIS software “Surface Analysis” toolbox (ESRI, Redlands, CA, United States) and the methods described in Charbonnier and Gertisser (2009, 2012). Based on our thickness measurements and the three different PC deposit facies recognized (valley-confined, overbank or veneer and surge), each drainage basin, interfluve and alluvial cone affected by the 2070 cal yr BP PCs has been divided into different zones of constant thicknesses. Volumes obtained for each polygon of the same geomorphic feature identified were added together to obtain the overall deposit volume.
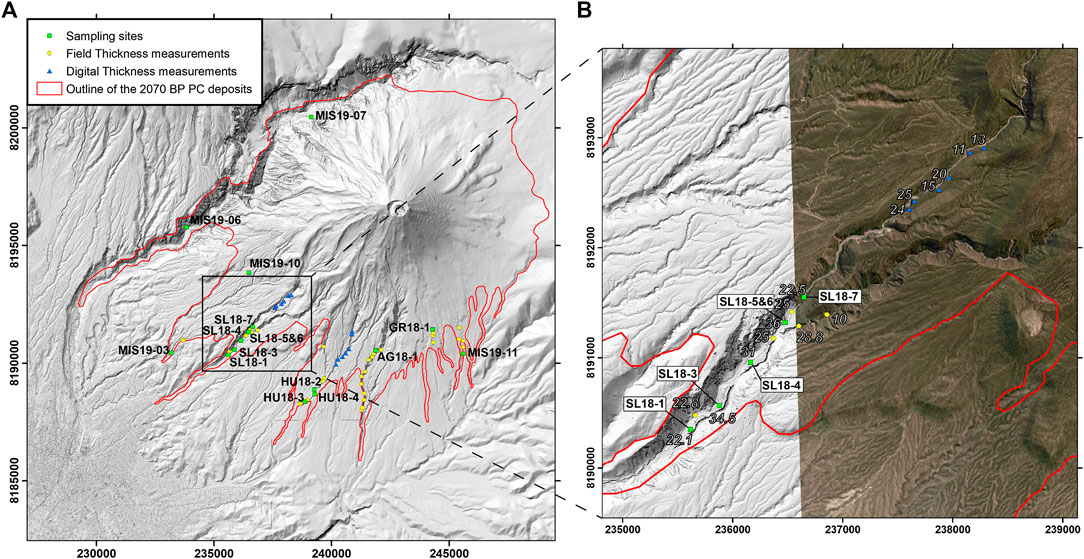
FIGURE 4. (A) Revised extent of the preserved 2070 cal yr BP pyroclastic current deposits as mapped from new field data collected in 2018 and 2019. Sampling sites for sedimentological analyses and locations of field and digital thickness measurements are also included. (B) Close-up view of the sampling sites and thickness measurements along the San Lázaro river system. One of the 2 m resolution multispectral Pleiades 1A image used for digital thickness measurements in the proximal area of Q. San Lázaro has been superimposed on the digital surface model.
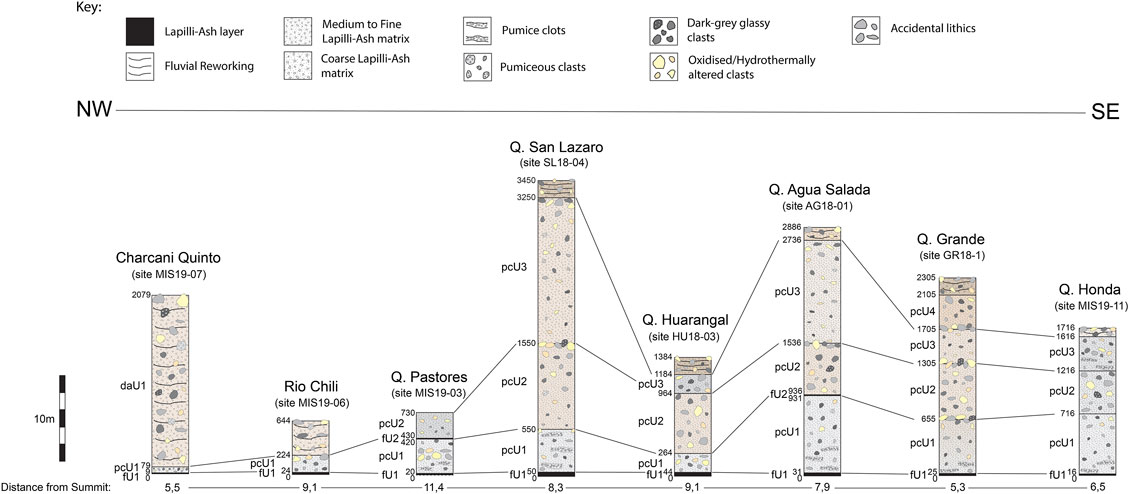
FIGURE 5. Selected correlated stratigraphic sections with deposit facies characteristics (grain size, componentry) from the seven drainages affected by the 2070 cal yr BP pyroclastic currents. See Figure 4 for the locations of the different sections and sampling sites.
To better identify the different PC units recognized during the stratigraphic survey and to characterize their deposit facies, a total of 16 samples were collected for sedimentological analyses. Due to the large range of particle sizes present in the PC deposits, grain size analyses were performed on the lapilli-ash (“matrix”) fractions only (<16 mm or −4 phi). In order to avoid particle breakage and comminution, gentle wet sieving at 1 phi intervals down to 32 µm (5 phi) were carried out in the laboratory and each grain size fraction was weighed after drying in an oven for about 24 h. Estimates based on the loss of fines during wet sieving showed that the fraction smaller than 5 phi never exceeded 20 wt% of the total sample mass. The GRADISTAT software (Blott and Pyle, 2001) was used to compute statistics of the grain size distributions. A lithological component analysis of seven selected samples was performed under a binocular microscope by point counting of ∼700 to 1,000 particles (converted to abundance % in Table 2) from the +2 phi fraction only. This grain size fraction was chosen because 1) it corresponds to the most abundant matrix fraction (by weight) according to the grain size analyses performed on these samples (Table 2), and 2) the size range (250–500 µm) is small enough to avoid particle clusters (i.e., with glass adhering to and/or crystals attached to other grains). Each particle was assigned to one of five lithological component categories: 1) white to brownish, banded-colored, and pumice fragments, 2) dark grey-colored to black, dense to vesiculated glassy fragments, 3) hydrothermally altered and oxidized clasts, 4) altered lava fragments and 5) free crystals.
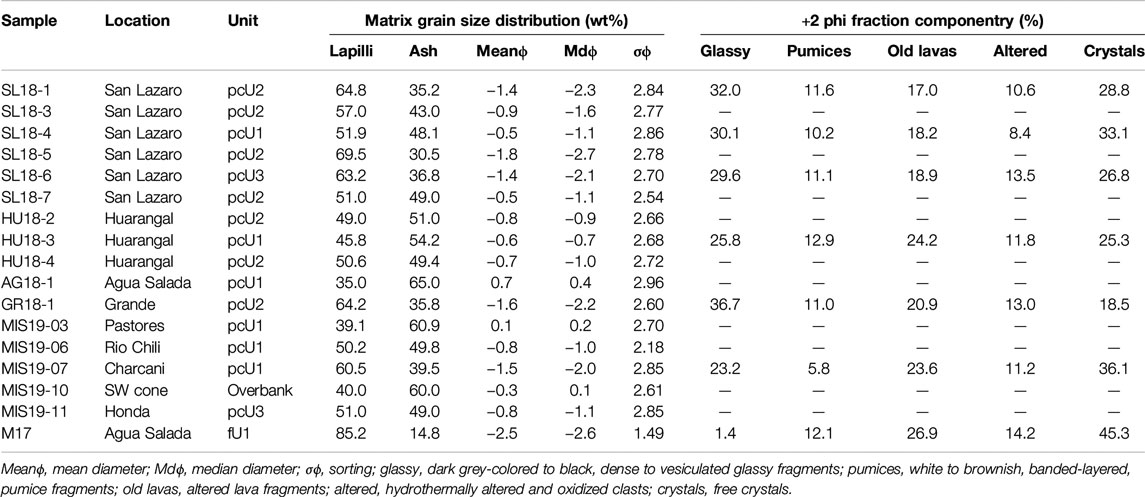
TABLE 2. Matrix grain size distribution (in weight %) of the studied samples and lithological component abundances [% with 700 < N (number of particles) < 1,000] of the +2 phi fraction of selected samples
Probabilistic Modeling
PCs are thought to be composed of two parts: a dense part formed by large blocks and particles that follow the drainage network (also called valley-confined or concentrated PCs) and a more dilute part, formed by small particles maintained in suspension by turbulent gases (also called ash-cloud surges or dilute PCs). Therefore, such complex currents are formed by a mixture of particles and gases of various characteristics (grain sizes, densities, temperature, etc.) transported with a certain velocity. The basic concept of numerical simulation is to solve the balance equations of mass, momentum and energy according to simplified physical laws that model the real physics. A variety of approaches exists, depending on the degree of simplification of the physics and on the way chosen to solve the equations. To decrease the computation time, some approaches consider that the vertical variations of properties and the energy balance can be neglected, and they simplify the equations in 2D, with an isothermal, depth-averaged formulation of problem. A new version of VolcFlow has been developed especially for the simulation of PCs (Kelfoun, 2017). Unlike the previous version of VolcFlow (Kelfoun and Druitt, 2005), it couples two fluids: one for the concentrated part, another for the dilute part. Exchange laws allow the concentrated part to form the dilute part or, inversely, the dilute part to form a deposit or a concentrated current by sedimentation. Details about the two-layer VolcFlow code and its applications to PCs at Merapi and Soufriere Hills volcanoes can be found in Kelfoun (2017), Kelfoun et al. (2017) and Gueugneau et al. (2019).
PC hazard modeling and mapping approaches have developed and diversified in a number of ways. Methods can be subdivided into either deterministic (i.e., scenario-based) or probabilistic types. Probabilistic approaches are often the preferred technique as they are able to incorporate uncertainty in the physical phenomena by using numerous multiple numerical runs as in a “Monte Carlo” simulation approach (i.e., Wadge 2009; Tierz et al., 2016). This methodology, by varying input parameters across likely ranges, explores the effect of modifying key, but uncertain, variables. In some cases, probabilistic PC hazard mapping allows to represent the likelihood of PC inundation or the distribution of a specific hazard variable associated with the current (e.g., velocity, dynamic pressure, temperature, solid concentration).
Here, we propose to assess the uncertainty in PC hazard mapping at El Misti volcano using a fully probabilistic approach. The resulting probabilistic maps benefit from: 1) refined mapping and volume estimates of the 2070 cal yr BP PC deposits in all seven radial valleys affected by the eruption, 2) statistical/stochastic sampling of input parameters including PC volumes and mechanical properties [constant retarding stresses (CRS), mass exchange laws], 3) the new high-resolution (2 m) DSM of El Misti volcano, and 4) new computational capacities at the University of South Florida to perform up to 16 runs simultaneously. Using the Latin Hypercube Sampling method, a statistical method for generating a near-random sample of parameter values from a multidimensional distribution (McKay et al., 1979), 123 simulations were computed with the two-layer VolcFlow model at two locations from the apex of the two major drainage networks, which directly impact the city of Arequipa, the San Lázaro and Huarangal river valleys (Figure 1). Compilations of the 246 VolcFlow simulations were used to compute two probabilistic maps of PC inundation, one for the Q. San Lázaro and another for the Q. Huarangal, respectively. Due to the high computational resources and time used by the two-layer VolcFlow code, the ensemble runs had to be performed over a coarser (8 m spatial resolution) and smaller sample of the DSM, cropped in the East-West direction to cover only the drainage basins of interest. Each ensemble run of 123 simulations took about 720 computational hours with 16 parallel nodes. See Probabilistic Modeling of the 2070 cal yr BP Pyroclastic Currents for details about the procedure, model input parameters and the resulting probabilistic maps of PC inundation obtained.
Field Observations of the 2070 cal yr BP Pyroclastic Current Deposits
Stratigraphy and Mapping
Figure 4 outlines the revised extent of the preserved 2070 cal yr BP PC deposits as mapped from new field data.
While we do not distinguish valley-confined deposits from overbank deposits on the valley margins and ash-cloud surge deposits beyond the valley margins, the analysis of additional stratigraphic sections has enabled us to delineate the approximate extent of the areas where overbank (veneer) and dilute PCs affected the margins of all valleys cutting the West, SW to SE slopes and piedmont (Figure 4). On interfluves and ridges, the PC deposits formed ash layers a few centimeters thick on the SW flanks, overbank deposits 2–4 m thick on the southern flank, and 1–3 m thick overbank and associated surge deposits on the SE flank of the volcano (see Table 3 for thickness measurements). Thin layers of fine-grained, crystal-rich ash, that we assign to the distal settling of dilute PCs that stratigraphically correlate with the 2070 cal yr BP PC deposits, were observed >1 km outside the valleys toward the west, e.g., in the Cayma area and upstream of the airport between 9 and 15 km SW of the vent.
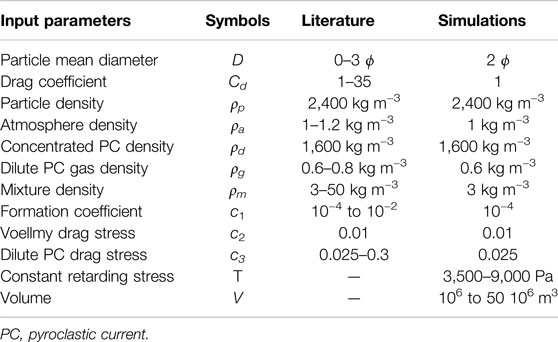
TABLE 3. Input parameters of the two-layer VolcFlow model used for all simulations. The first ten rows refer to fixed input values defined from previous numerical studies (Kelfoun et al., 2017; Gueugneau et al., 2019; Gueugneau et al., 2020). The last two rows refer to parameters which varied in the simulations within the range of values explored.
The non-welded, valley-confined PC deposits emplaced in the seven drainages around the volcano (see Figure 1 for location) consist of one to four units (pcU1–pcU4 in Figure 5). Stratigraphic correlations across these drainages (Figure 5) show a general increase in both the numbers of units found and their individual thicknesses from northwest to south (between 0.7 and 17 m thick, totaling between 6 and 32 m in thickness), reaching a maximum between 3,400 and 2,800 m asl in the Q. San Lázaro and Q. Agua Salada, where they filled three quarters of the pre-existing valley up to 40–50 m deep. Thick stratigraphic sections (up to 21 m thick in the upper course of the Honda and Grande valleys and their tributaries on the eastern flank between 3,400 and 3,800 m asl) expose the maximum number of PC units, with up to four stacked units separated by lithic-rich, coarse-clast trains (pcU1–pcU4 units at Q. Grande section, Figure 5). Elsewhere, clots of pumice mark the boundary between PC units in the lowermost unit, a sharp change in grain size distribution and/or by thin fine ash layers between other units (i.e., fU2 unit in Figure 5). The boundary with the 2070 cal yr BP Plinian fallout deposit (fU1 unit in Figure 5) is sharp or erosional.
Pyroclastic Currents Unit1
The lowermost valley-confined PC unit (pcU1 in Figure 5) outcrops in all seven drainages studied. It consists of a massive, poorly sorted pumice rich unit with a light gray to beige, medium-to-fine grained lapilli-ash matrix and sub-angular to angular, dense lithic blocks. This unit is often reversely graded and contains abundant and coarse pumices with banded layers, sometimes over 10 cm in diameter, as well as several discontinuous pumice lenses or clots, suggesting shearing processes, e.g., in the upper reaches of Q. San Lázaro and Q. Agua Salada (Figure 5). The pcU1 unit shows strong thickness variations due to the infilling of the highly eroded, pre-existing valleys that dissected the cone before the 2070 cal yr BP eruption. While it outcrops only as a thin (0.7 m thick), fine-grained pumice rich PC unit near Charcani Grande in the northwest, unit thickness gradually increases in the southwestern and southern drainages to reach a maximum of 9 m in Q. Agua Salada at ∼3,150 m asl. This lowermost unit is easily distinguishable from the other PC units due to: 1) its grey-colored and finer-grained matrix, 2) abundance of coarse and rounded, banded pumices, and 3) an often erosional contact with the top of the underlying 2070 cal yr BP Plinian fallout deposit.
Pyroclastic Currents Unit2
The second valley-confined PC unit (pcU2 in Figure 5) is missing in the Río Chili but outcrops from Q. Pastores in the southwest to Q. Honda in the southeast. It consists of a massive, poorly sorted lithic rich unit with a grayish to light-brown, medium-to-fine grained lapilli-ash matrix rich in hydrothermally altered fragments. This unit often shows a coarse-tail inverse grading and contains a few whitish-to-pinkish, pumice coarse lapilli as well as abundant sub-angular to sub-rounded, >20-cm sized accidental, lithic dense blocks, e.g., in the Q. Huarangal, Q. Agua Salada, and Q. Grande (Figure 5). Thicknesses of the pcU2 unit are variable across the different drainages, with a minimum of 3 m in Q. Pastores to a maximum of 10 m in Q. San Lázaro. The contact between pcU1 and pcU2 is sharp, and a fine ash fallout layer sometimes separates the two PC units (fU2 unit in Figure 5).
Pyroclastic Currents Unit3
The third valley-confined PC unit (pcU3 in Figure 5) outcrops in a relatively narrow sector between Q. San Lázaro in the southwest to Q. Honda in the southeast. It consists of a massive, poorly sorted, lithic-rich unit with a grayish to light-brown coarse-to-medium grained lapilli-ash matrix and abundant accidental lithics and sub-rounded hydrothermally altered blocks. The base of this unit is uneven and often hard to distinguish from the top of unit pcU2. The presence of an inverse coarse-tail grading and coarse clast trains (in Q. Pastores and Q. Grande) between the two units or discontinuous pumice lenses or clots at the base of pcU3 (Q. Honda) help identify the gradational contact between these two stacked units. This unit has large variations in thickness ranging from ∼2 to 4 m thick in Q. Huarangal and Q. Honda to >17 m thick in Q. San Lázaro at 2,980 m asl (Figure 5), but still represents the thickest unit of the PC deposits.
Pyroclastic Currents Unit4
A fourth valley-confined PC unit is present on top of pcU3 but outcrops are relatively scarce due to the strong erosion of the upper part of the eruptive sequence. The only two drainages where this pcU4 unit was found as a pristine PC unit was inside the upper courses of Q. San Lázaro and Q. Grande between ∼3,200 and 3,650 m asl (Figure 5). Here, it consists of a massive, reversely graded lithic rich unit with a brownish coarse-to-medium grained lapilli-ash matrix and abundant accidental lithics blocks. A few rounded pumices up to 10 cm diameter are also present at the base of this unit. The contact with the pcU3 unit at the base is gradational with the presence of a coarse clast train. The upper part of this ∼4 m thick unit is reworked and overlain by ∼2 m thick post-eruption lahar deposits.
Sedimentology
Grain-size distributions (GSDs) and lithological components of the PC deposits are described in Harpel et al. (2011) and Cobeñas et al. (2012, 2014). However, our new analyses benefit from: 1) a high diversity (three PC units) and a larger geographic distribution (seven valleys) of PC deposits sampled, 2) a large range of matrix grain sizes investigated during laboratory GSD analyses (wide spectrum of lapilli and ash sizes from −4 to 5 phi but excluding blocks), and 3) a quantitative analysis of the lithological components of the PC samples using a binocular microscope. Our results (Table 2) are then used to refine the stratigraphic correlations of the four PC units recognized in the different valleys, re-estimate their runouts, calculate individual areas and volumes and finally calibrate the source conditions (location, input volumes, mean particle diameter) for our numerical simulations.
Most of the valley-confined PC samples analyzed for GSD show bimodal distributions with two modes between −4.5 and −1.5 phi for the coarse sub-population and between 1.5 and 4.5 phi for the fine sub-population. Only three samples have unimodal distributions with a mode between −3.5 and −2.5 phi. While all the samples are poorly sorted with a narrow range of sorting coefficients (σφ between 2.1 and 2.9), they also have very different matrix GSDs, with average mean diameters varying between −1.8 and 0.6 phi and median diameters from −2.6 to 0.1 phi (Table 2). The statistical parameters of the GSD curves show that the PC samples analyzed are fine skewed (spread out toward fine values) and platykurtic. No major differences in terms of matrix GSD were found between the samples from the three different stratigraphic units pcU1-pcU3, except for: 1) samples from pcU2 unit that exhibit the widest range of mean and median diameters, and 2) samples from pcU1 unit that are richer in ash size fractions (< −1 phi) than pcU2 and pcU3 (Table 2; Figure 6). The four samples from the pcU2 unit collected at various distances inside the Q. San Lázaro seem to show a down-flow increase in average median diameters (Mdφ averages from −1 to −2.3 phi), but more samples need to be collected and analyzed to confirm such longitudinal facies variations. Therefore, the variability in matrix GSD observed between the different samples could be due to a combination of topographic factors, variations in composition of the different PC deposits from different drainages (e.g., accidental lithic content, presence of pumices and/or dense glassy clasts) and/or fragmentation characteristics at the source.
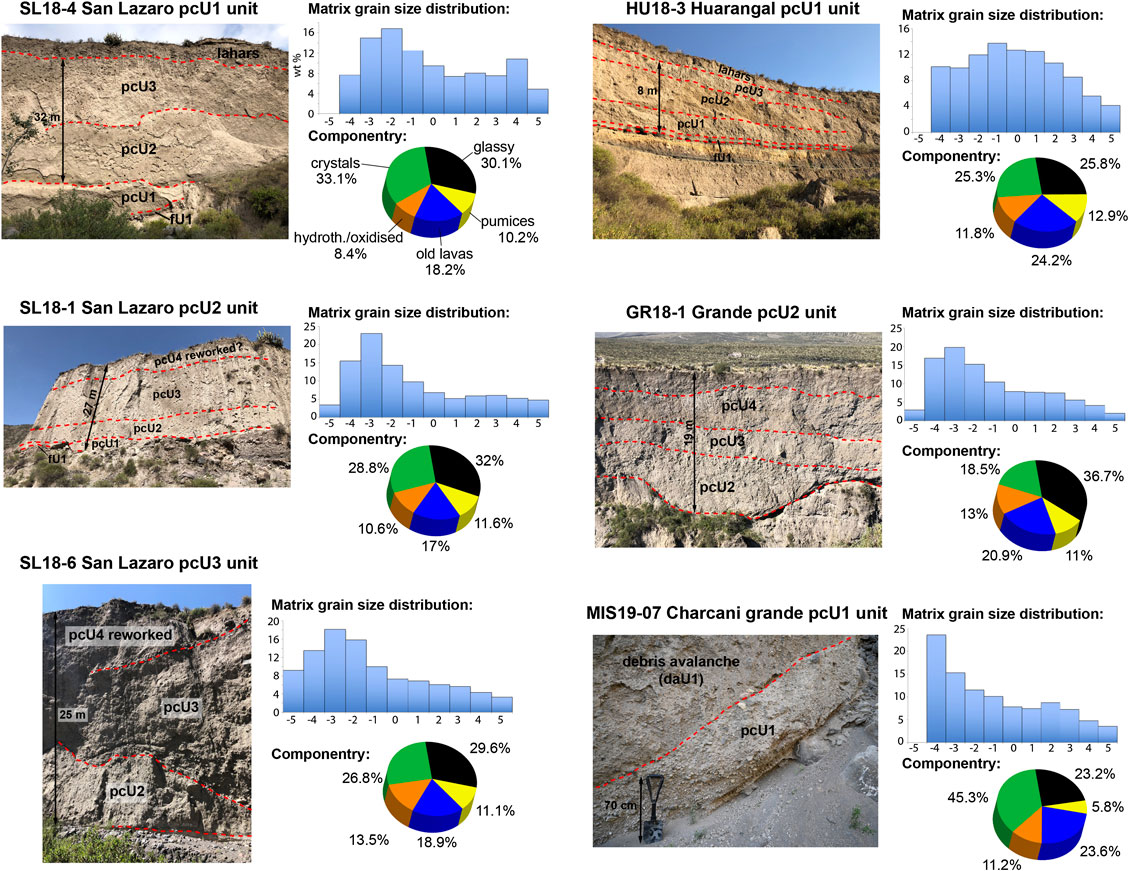
FIGURE 6. Representative stratigraphic sections and sampling sites selected for grain size analyses and componentry. See Figure 4 for the section location and sampling sites and Table 2 for lithological component description. Dashed red lines indicate depositional unit boundaries or contacts between different facies.
Results from quantitative matrix component analyses performed on six valley-confined PC samples (from Río Chili, Q. San Lázaro, Huarangal, and Grande) and a tephra fallout sample collected at the base of the PC sequence in Q. San Lázaro, reveal significant textural variations (in terms of abundances of lithological components) within the 2070 cal yr BP deposit stratigraphy (Table 2; Figure 6). While the proportions of pumice clasts, old lava fragments and hydrothermally altered and oxidized clasts do not vary significantly among the samples analyzed, the abundance of free crystals (amphibole, pyroxene and plagioclase) differs significantly between the tephra fallout and PC deposit samples (Table 2). Moreover, the proportion of free crystals also decreases progressively both stratigraphically within the PC deposit sequence, from unit pcU1 to unit pcU3 (from 33 to 27% in the Q. San Lázaro), and geographically inside the basal unit pcU1 across valleys from the southwest to the southeast (from 36% in Río Chili to 18% in Q. Grande). Finally, the most substantial textural variations found between the tephra fallout and PC deposit samples lie in the abundance of dark gray to black colored, dense to micro-vesiculated glassy fragments (Table 2; Figure 6). While they are rare in the tephra sample (only ∼1%), they constitute the most abundant lithological component inside the PC deposit samples analyzed with proportions between 23% (Río Chili) and 37% (Q. Grande). While the origin of the four other component categories has been documented and interpreted in previous studies (Harpel et al., 2011; Cobeñas et al., 2012, 2014), the source of these glassy fragments is conspicuous. The dark coloration and dense to vesiculated vitric textures suggest they are juvenile components.
Areas and Volume Estimation
Detailed volume calculations of the 2070 cal yr BP PC deposits are listed in Supplementary Table S1. A map of the distribution of 37 ArcGIS polygons of constant thicknesses drawn for each geomorphic feature affected by the PC deposits is shown in Supplementary Figure S1.
The total area covered by the PC deposits is estimated at 141 km2, unevenly distributed between valley-confined (covering only ∼20 km2) and unconfined PC deposits (covering ∼121 km2). The total bulk volume of the 2070 cal yr BP PC deposits is estimated at 406 ± 140 × 106 m3, equally distributed between valley-confined (∼46%) and unconfined deposits (∼54%). The uncertainty on each polygon volume calculation is calculated as the standard deviation of the mean thickness multiplied by the area. The uncertainty on the total volume is taken as the sum of the standard deviations of each mean polygon volume (Supplementary Table S1). Individual deposit volumes in each of the seven drainages vary by one order of magnitude between 4.4 ± 1 × 10⁶ m3 for Q. Grande to 38 ± 7 × 10⁶ m3 for Q. Agua Salada, for which most of the total volume is distributed in the SW to SSW sectors of the cone. PC deposit volumes calculated for the two drainage basins for which the distal reaches now lie within the suburbs of Arequipa are 30 ± 9 × 10⁶ m3 for Q. San Lázaro and its tributaries and 21 ± 4 × 10⁶ m3 for Q. Huarangal and its branches (Supplementary Table S1). While our new areas and volume estimations are more accurate than those from previous studies (Harpel et al., 2011; Cobeñas et al., 2012; Cobeñas et al., 2014), the PC deposit volumes may still be underestimated and should be taken as minimum estimates for three reasons: 1) the proximal deposits on the high flanks of the cone have not been considered, as most of them have been removed, 2) ash-cloud surge and overbank deposits on the valley margins, although much thinner than valley-confined PCs, have not been mapped with accuracy, and 3) thicknesses of valley-confined deposits strongly vary along short distances due to the highly eroded channel geometries of the pre-existing valleys that dissected the cone prior to the 2070 cal yr BP eruption and the presence of several lahar terraces(e.g., along the Q. San Lázaro down valley as far as 12 km from the summit).
Probabilistic Modeling of the 2070 cal yr BP Pyroclastic Currents
Procedure and Input Parameters
To generate the two PC probabilistic maps for the San Lázaro and Huarangal catchments, all the VolcFlow simulations were performed with the same source conditions, with the exception of PC input volume and the rheological parameter. The range of input volumes selected for the simulations is based on field estimates of the PC deposit volumes calculated for the two drainage networks, including the main channel, its tributaries and the interfluves (Supplementary Table S1; Supplementary Figure S1). Total PC deposit volumes are estimated at 30 ± 9 × 10⁶ m3 for the San Lázaro basin and 35 ± 9 × 10⁶ m3 for the Huarangal basin. Given the uncertainties in these numbers, the fact that they are based on eroded deposits and are likely underestimated, the selected range of simulated volumes has been extended from 1 × 10⁶ to 50 × 106 m3 for a more accurate statistical exploration. Previous studies have shown that for such a range of PC volumes (<100 × 106 m3), the volume distribution is not uniform and follows a statistical distribution: Bayarri et al. (2009) demonstrated that the volume frequency of hundreds of PCs from Soufrière Hills Volcano at Montserrat fit well with a Pareto distribution, analogue to a decreasing power law, with a shape parameter α = 0.64. More recently, Charbonnier et al. (in press) showed that the best statistical model describing the volume distribution of PCs at Merapi volcano is a Pareto type II law with a shape parameter α = 0.83. Since PC volume distribution at El Misti is unknown but should follow the same statistical distribution as at Merapi or Soufrière Hills volcanoes, the 123 simulated volumes sampled here follow a Pareto distribution with a shape parameter α = 0.75, corresponding to the mean value of the coefficient used in the studies mentioned above. With such a statistical sampling, the probability of a PC with a volume close to 106 m3 is extremely high while the probability of a PC with a volume close to 50 × 106 m3 is extremely low. The modeled cumulative density function of the Pareto law with α = 0.75 is shown Figure 7A (solid red line) and the values of the 123 volumes sampled using this law are shown on Figure 7B. The Pareto law of Bayarri et al. (2009) and Charbonnier et al. (in press) was also added with dashed lines to better illustrate the role of the shape parameter. In addition, the resulting cumulative probabilities of the sampled volumes are represented as a bar diagram in Figure 7A.
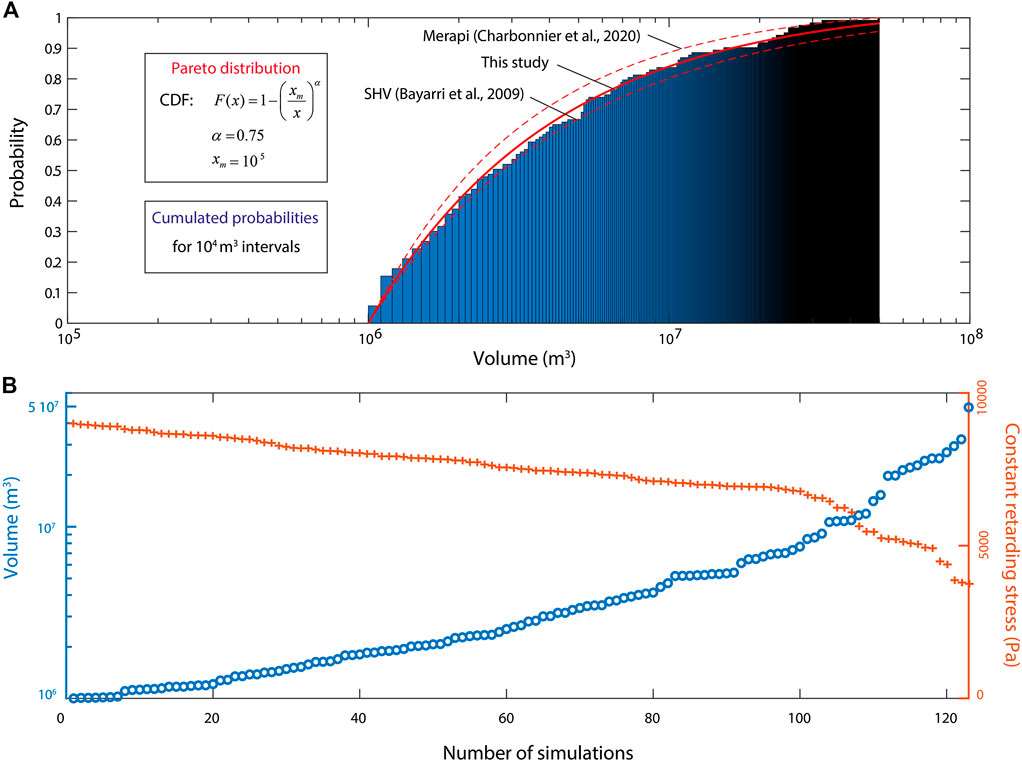
FIGURE 7. Distribution of the 123 simulated pyroclastic current volumes sampled using a Pareto law. Graph (A) shows the cumulative probabilities of the pyroclastic current volumes (bars), obtained following the Pareto distribution for the volume range 1 × 10⁶ to 50 × 106 m3. The selected Pareto law with a shape parameter α = 0.75 is represented by the solid red line and encircled by the Pareto laws from Bayarri et al. (2009) and Charbonnier et al. (in press) as dashed red lines, with a shape parameter α = 0.64 and α = 0.83, respectively. Graph (B) shows the distribution of the 123 volumes together with their associated constant retarding stress.
The physical behavior of the concentrated PC is modeled with a plastic rheology, involving a CRS, considered as the most suitable rheology for the numerical simulation of concentrated PCs with a depth-averaged model (Kelfoun et al., 2009; Kelfoun, 2011; Charbonnier and Gertisser, 2012; Kelfoun et al., 2017; Ogburn and Calder, 2017; Gueugneau et al., 2019). When using such a broad range of simulated PC volumes for probabilistic modeling, the CRS must vary to adapt the physical behavior of the concentrated PC to simulate such large variations in current mobility. Several studies have shown that the higher the volume and current mobility, the lower the CRS, indicating that the CRS seems to be inversely proportional to the volume and mobility of the PC (Charbonnier and Gertisser, 2012; Kelfoun et al., 2017; Ogburn and Calder, 2017), and the same empirical relation was applied here. A broad range of CRS values, comprised from 3,500 to 9,000 Pa, was defined according to the typical values used in previous numerical studies using similar PC volume ranges (Kelfoun, 2011; Charbonnier et al., 2012; Kelfoun et al., 2017; Ogburn and Calder, 2017; Gueugneau et al., 2019). Thus, for each volume, a value of the CRS is attributed as inversely proportional to the position of that volume in the range from 1 × 10⁶ to 50 × 106 m3. This means that the highest CRS is attributed to the smallest volume, and inversely, the smallest CRS is attributed to the highest volume. This yields 123 couples of volume-CRS with their distribution presented in Figure 7B.
The list of input parameters is presented in Table 3. The choice of using fixed values for these parameters over the full range of selected PC volumes and CRS is justified as: 1) other parameters acting on the concentrated PC rheology, the density ρd and the Voellmy drag stress c2, do not vary significantly with different PC volumes and mobilities, as shown by previous numerical studies (Kelfoun, 2011; Charbonnier et al., 2012; Kelfoun et al., 2017; Ogburn and Calder, 2017; Gueugneau et al., 2019), 2) parameters that control the dilute PC formation and its emplacement are poorly constrained from field data and chosen empirically. These parameters are: the particle mean diameter d, the particle drag coefficient Cd, the particle density ρp, the atmosphere density ρa, the gas density of the dilute PC ρg, the density of the mixture transferred from the concentrated PC to the dilute PC ρm, the dilute PC production parameter c1 and the dilute PC drag stress c3 [see Kelfoun et al. (2017) and Gueugneau et al. (2019) for details about their calibration]. With such a large number of input parameters, a stochastic sampling may lead to poor calibration, and subsequently unrealistic simulations. Therefore, the empirical values selected for each of these input parameters are based on previous studies that have successfully reproduced PCs with the VolcFlow two-layer version, at Merapi (Kelfoun et al., 2017), Soufrière Hills Volcano (Gueugneau et al., 2019), and Mount Pelée (Gueugneau et al., 2020). When a range of values was already investigated by these previous studies, the lowest value is used here to obtain the least false negatives (i.e., areas inundated by the observed PCs where not simulated) as possible (Table 3).
For the simulated PCs, both valleys have identical source conditions, a 390 m diameter circular spot sets at the apex of the San Lázaro and Huarangal catchments and located ∼600 m below the summit crater to ensure that most the simulated material flowed down the valley. A constant volumetric rate is supplied for 180 sec through the spot and calculated for each simulation by dividing the selected volume by the total number of time steps performed by the model in this timeframe. Because the time step is automatically adjusted by the model for each simulation, the amount of volume added in each time step is different. The concentrated PC begins at the source and remains in the main river channels whereas the dilute PC starts to form and spreads laterally according to the dilute PC formation law, which is also a function of the velocity of the concentrated PC (Kelfoun, 2017).
Probabilistic Maps
Probabilistic maps of PCs were built by combining the inundated areas of both PC components (dilute and concentrated PCs) from each simulation into a single map for each valley. For that, the number of hits (i.e., the number of times a DSM cell is inundated by a PC simulation) is computed at the end of the probabilistic run and divided by the total number of simulations (123 in our case). This yields a probability of inundation (expressed between 0 and 1) at each DSM cell, computed either for the 123 simulated dilute or concentrated PCs separately, or by combining the probability values (total number of hits) of the two parts of the 123 simulated PCs into integrated values. In order to better distinguish between the spatial distributions of each PC component, two different color scales are used. The resulting maps for the San Lázaro and Huarangal catchments are shown in Figures 8 and 9, respectively.
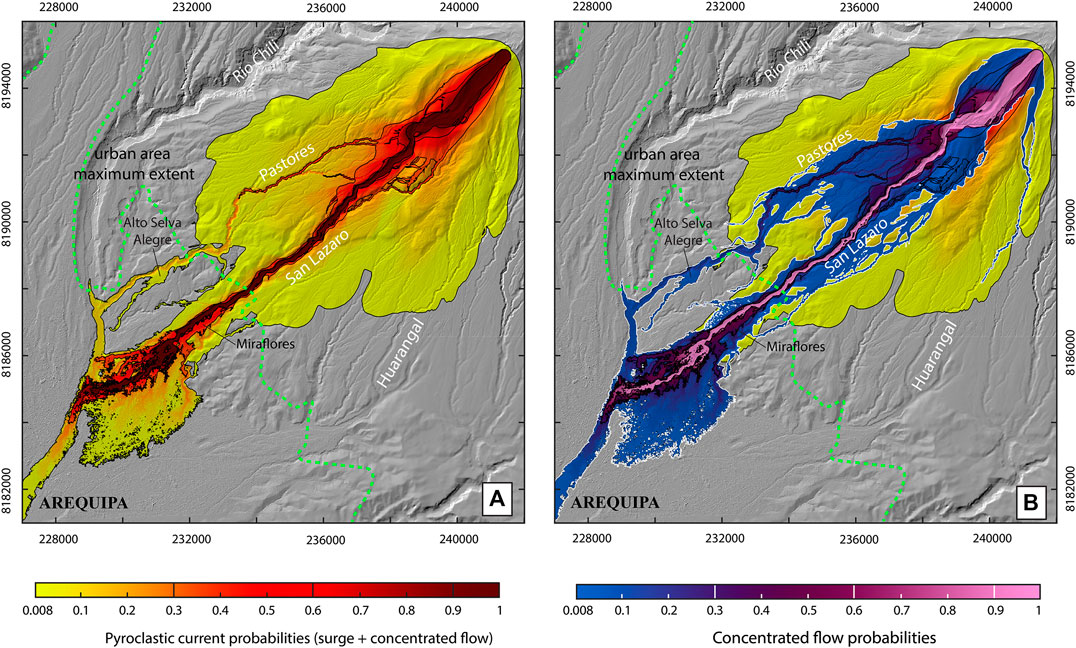
FIGURE 8. VolcFlow probabilistic map for a pyroclastic current in the San Lázaro drainage basin, made by calculating the number of hits at each digital surface model cell for 123 numerical simulations. Map (A) shows the probabilities for the entire pyroclastic current (i.e., dilute + concentrated parts) with a yellow to red color scale. Map (B) distinguishes the probabilities of a concentrated pyroclastic current with a blue to pink color scale, from the dilute pyroclastic current, with a yellow to red color scale. Iso-probability contour lines at every 0.3 probability intervals are also included. The green dashed line corresponds to maximum extent of the Arequipa urban area.
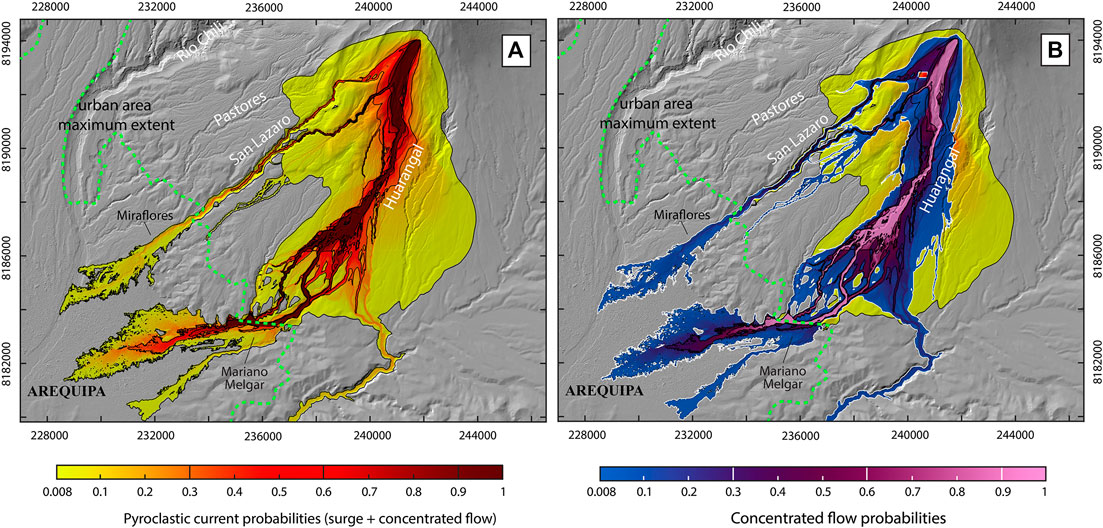
FIGURE 9. VolcFlow probabilistic map for a pyroclastic current in the Huarangal-Mariano Melgar catchment, made by calculating the number of hits at each digital surface model cell for 123 numerical simulations. Map (A) shows the probabilities for the entire pyroclastic current (i.e., dilute + concentrated parts). Map (B) distinguishes the probabilities of a concentrated pyroclastic current with a blue to pink color scale, from the dilute pyroclastic current with a yellow to red color scale. Iso-probability contour lines at every 0.3 probability intervals are also included. The green dashed line corresponds to the maximum extent of the Arequipa urban area.
San Lázaro Valley
The integrated probabilistic map (Figure 8A) shows that the distribution of the PC probabilities exhibits a characteristic pattern, symmetrical to the San Lázaro valley, with a cluster of high probabilities inside the main channel (dark red area with values >0.6) and a sharp decrease in probability away from the main channel (yellow area with probabilities <0.3). This low probability zone is composed of two main lobes: 1) a proximal lobe from the source to the mid slope catchment, and 2) a distal lobe inside Arequipa city center, that extends to the south bank of the narrow San Lázaro channel, cutting through the city (Figure 8A). The unintegrated map (Figure 8B) shows that, as expected, the cluster of high probabilities is attributed to the valley-confined concentrated PCs that follow the main channel (pink area). However, the map also highlights the fact that the distal lobe of low probabilities inside the city (blue area) is attributed to the overspill of concentrated PCs when the San Lázaro channel narrows as it enters the suburbs and Miraflores district (Figure 8B). These overbank processes occur only during simulations with large PC volumes (>30 × 106 m3), with low sampling frequency, explaining the low probability of events. In contrast, the proximal lobe of low probabilities is caused by large dilute PCs generated from fast and voluminous concentrated PCs, probably associated with the same simulations as those that shaped the large overbank areas in Arequipa further downstream.
Based on these probabilistic runs, we show that only the concentrated PCs are able to reach the city of Arequipa through the San Lázaro catchment. The probabilities of PCs entering the city is remarkably high (0.92), and almost every simulated PC reached the city, even though for only a few hundred meters for the lowest volumes (<10 × 106 m3, Figure 8B). The probability of a PC entering the Q. Pastores and crossing the northern area of Arequipa (through the Alto Selva Alegre district, see Figure 1) is very high too, due to a major source of overspill, at a sharp bend in the proximal San Lázaro western bank, where the simulated overbank PCs are voluminous enough to follow the former river path all the way to the Río Chili. The most remarkable aspect concerns the relatively high probabilities of overbank PCs that could inundate both the northern and central districts via the Q. San Lázaro (up to 10% of the simulations reached this distal area). Finally, arrival times of simulated PCs in the urban area of Arequipa vary between 9 and 12 min, depending on the input volumes, with current velocities between 11 and 14 m s−1.
Huarangal–Mariano Melgar Valley
The same observations for the San Lázaro basin can be made for the probability distribution of simulated PCs along the Q. Huarangal-MM (Figure 9A). The same clustering of high probabilities is observed in the valley due to the channelization of concentrated PCs, contrasting with a wide zone of low probabilities on the south flank of the cone (yellow area) linked to the emplacement of voluminous dilute PCs. However, here the direction of the dilute PCs is not symmetrical to the Huarangal-MM channel and three large detachments can be observed, two proximal ones (<3 km from the starting location) toward the southwest entering the Pastores and San Lázaro catchments, and the third toward the east following a major bend in the valley at ∼1 km further downstream (∼4 km from the starting location). Moreover, the unintegrated map (Figure 9B) shows that simulated concentrated PCs are less constrained in the Huarangal-MM valley (slope gradient is lower, 3%) than they are in the San Lázaro (7%). Indeed, voluminous overbank PCs are observed at the middle section of the valley (∼7 km from the starting location), creating a fan that separates the channelized PC into three main branches. These three PC branches merge back into the distal Huarangal-MM channel after a 90° bend in the valley (∼10 km from the starting location) before entering Arequipa through the MM district (Figure 9B).
Beside the fact that the Huarangal-MM valley is longer than the San Lázaro (19 vs. 12 km from the initial confinement area, respectively), the probability of concentrated PCs reaching the eastern part of the city is still high due to re-channelization in the distal section of the valley. Again, simulations reach Arequipa with a relatively high probability (>0.3, first contour line in Figure 9B) with voluminous overflows that spread over the MM district down valley to the city center. In contrast to the San Lázaro, these large overbank PCs have a lower probability (∼0.1) and never cross the city entirely. We notice that a few simulations generated major secondary PCs into the San Lázaro valley that flowed all the way down to Arequipa, stemming from proximal overbank PCs and dilute PC detachments close to the source. However, the occurrence of such secondary PCs seems to depend on our source conditions and only shows that a voluminous (>10 × 106 m3) PC entering the apex of the Huarangal-MM valley will most certainly reach and enter both valleys. Finally, arrival times of simulated PCs in the urban area of Arequipa and corresponding current velocities are estimated at ∼10 min and 15 m s−1, respectively.
Discussion
New Insights Into the 2070 cal yr BP Pyroclastic Currents
Field Data and Optical Imagery
The revised extent of the preserved 2070 cal yr BP PC deposits (Figure 4) allows for the refinement of the runout of valley-confined PCs emplaced in the seven radial valleys affected by the eruption. These runout values should be taken as minimum values due to the intense erosion of the distal deposits. While the PC runouts in valleys from the S to SE flanks (Q. Agua Salada, Q. Grande, Q. Honda) do not change from the previous map proposed by Cobeñas et al. (2012), runout values from valley-confined PCs emplaced in the SW flank have increased, from <1 km in Q. San Lázaro and Q. Huarangual-MM to more than 5 km in Q. Pastores (Figures 2 and 4). The extent of unconfined PC deposits does not vary much between the two studies, except in the area between the Río Chili, Q. Pastores and Q. San Lázaro. Here, new evidence from field surveys allowed us to extend the area inundated by unconfined PCs (mostly overbank PCs) and increase runouts by ∼4.2 km on the piedmont between Q. Pastores and Q. San Lázaro (Figures 2 and 4).
Results from stratigraphic surveys are in agreement with the stratigraphy proposed by Suni Chambi (1999) and Cobeñas et al. (2012, 2014) with up to four PC units recognized in Q. San Lázaro and Q. Grande while only three main PC units are exposed in other valleys (Figure 5). Facies variations also show an increase of matrix grain size (with a decrease of ash fractions), accidental lithics and hydrothermal alteration of the deposit matrices from pcU1 to pcU3 units, similar to previous observations made by the aforementioned authors. The coarser median diameters (from −2.6 to 0.1 phi) and narrower range of sorting (between 2 and 3) obtained in our grain size distributions compared to those from Cobeñas et al. (2012) may be due to the different methodology used for sieving and sampling of the PC deposits.
Significant textural variations (in terms of volume percentages of lithological components) are found within the 2070 cal yr BP deposit stratigraphy and differ quite substantially from similar component analyses performed by previous authors (Suni Chambi, 1999; Harpel et al., 2011; Cobeñas et al., 2012). While the differences in terms of proportions of pumices and free crystals found between the samples from valley-confined PC deposits are mainly due to different grain size fractions analyzed for point counting (+2 phi fraction only in this study), the abundance of dark gray to black colored, dense to micro-vesiculated glassy fragments shows the most significant variations between the tephra fallout and PC deposit samples (Table 2; Figure 6). The dark coloration and dense to micro-vesiculated vitric textures of these glassy fragments suggest they are juvenile (cognate lithics). However, none of the aforementioned studies mentioned such micro-vesiculated glassy texture. We interpret these fragments as input from either a dense degassed magma batch (abundance of dense vitric texture) or the sudden depressurization of material from a gas-rich magma recharge batch (abundance of micro-vesicular texture). The dark coloration and the glassy texture of these clasts also suggest fast magma ascent during this period, as documented in the eruption chronology (Harpel et al., 2011; Cobeñas et al., 2012). Moreover, these glassy fragments are similar to other glassy components of rhyolitic composition found in other PC deposits dated at 31–34 ka at El Misti (group 3 of Thouret et al., 2001). Such glass and cognate lithics in the 2070 cal yr BP PC units may have been tapped from magma batches that remained at shallow level and/or near the conduit since the voluminous explosive eruptions of El Misti around 31–34 ka (Thouret et al., 2001; Rivera et al., 2017). These magma batches, when mixing with the fragmented superficial magma body, may have triggered instabilities in the plume that led to the first column collapse episode and emplacement of the first batch of PCs. Such rapid transitions in conduit/plume dynamics may explain the presence of the transitional, fined-grained pumice-rich pcU1 unit, which immediately overlies and/or erodes through the fU1 Plinian fallout deposit (Figure 5), confirming that only a short period of time elapsed between the end of the main Plinian phase and the emplacement of the first batch of PCs. Detailed petrological and geochemical analyses on these glassy fragments are needed to confirm this hypothesis. Finally, the large abundance of rhyolitic glass and cognate lithics in all the PC units analyzed confirms their pyroclastic nature, where such textural variations are directly linked to changes in dynamics of the plume and/or in the conduit during the eruption. This contradicts Harpel et al. (2011) who inferred that the upper three PC units (pcU2 to pcU4) were lahar deposits emplaced “wet and relatively cold.”
Numerical Modeling
The multi-disciplinary approach taken here by combining field data and optical imagery to reconstruct the volume of past PC deposits is useful to better constrain the eruptive history at El Misti but is also limited by the poor exposure of the distal PC deposits. While this method is useful to constrain the range of input PC volumes used for probabilistic PC modeling, the choice of the Pareto distribution to statistically sample these PC volumes was made empirically and based on frequency-volume distribution of PCs from similar composite volcanoes, not El Misti. An improved frequency-volume distribution of similar PCs for the 2070 cal yr BP events would subsequently improve the hazard assessment performed by numerical modeling and demonstrate whether using a Pareto distribution was a realistic choice.
To our knowledge, the mapping of PC probabilities with the two-layer VolcFlow code represents the first attempt at using a two-phase depth-averaged model to generate probabilistic maps of PCs over natural terrain, where the concentrated PC can be modeled jointly with the dilute PC but mapped separately. The use of a physical-based model like VolcFlow to calculate the propagation of the currents gives more realistic outputs than an empirical model like the Energy Cone (EC) model previously used at El Misti by Harpel et al. (2011). Indeed, the EC model does not simulate the channelization of concentrated PCs, which is recognized here as a critical process in order to correctly assess the PC hazards at El Misti and Arequipa. With such an approach, we are also able to obtain the probability for the dilute and concentrated parts of a PC, in contrast with the TITAN2D model used by Constantinescu et al. (2011) and Sandri et al. (2014), which only simulates the concentrated layer in a deterministic framework. Indeed, the hazards and associated impacts of the concentrated PCs are different than those from the dilute PCs. These can be assessed separately while being parts of a single numerical model, which provides more robust outputs and significantly improves PC hazard assessment at El Misti. However, our PC probabilistic maps should not be considered as hazard maps because probabilities are “conditional” and computed only for the case when PCs generated by a future eruption similar to the VEI 4 2070 cal yr BP eruption enter the two main drainage networks threatening Arequipa (i.e., San Lázaro and Huarangal-MM). With the recurrence rate of similar sub-Plinian–Plinian eruptions at El Misti estimated to range between 2,000 and 4,000 years (see Table 1; Thouret et al., 2001; Sandri et al., 2014), the probability values obtained here may be converted into probabilities of occurrence for a PC of similar size to the 2070 cal yr BP to enter the city of Arequipa. Our maps demonstrate the suitability of a two-phase, depth-averaged numerical model to produce two probabilistic maps over an 8 m resolution DSM in a reasonable amount of time (∼60 days for 246 simulations).
Another interesting result from our simulations stems from the strong channelization and longer runout of the concentrated PCs than those obtained by Constantinescu et al. (2011) and Sandri et al. (2014) with TITAN2D and Harpel et al. (2011) with the EC model. In our simulations, valley-confined PCs reach a maximum runout of 10–15 km in San Lázaro valley and 11–16 km in the Huarangal-MM valley, while the maximum runout obtained by Sandri et al. (2014) was 2–8 km (both valleys) with similar input volumes (>106 m3), and 10 km for Harpel et al. (2011). While the 2070 cal yr BP mapped PC deposits in these two valleys (Figure 4) reach shorter runout distances than in our simulations, we know from the preserved thick deposits that PCs reached further distances; hence our field mapping suffers from poor exposures and intense erosion of the distal valley-confined deposits. The longer PC runouts obtained in our probabilistic simulations are due to the combined use of a broader range of selected input volumes associated with more realistic PC rheology. The strong channelization of the concentrated part of small-volume (<100 × 106 m3) PCs was demonstrated by numerous studies (e.g., Loughlin et al., 2002; Charbonnier and Gertisser, 2012; Charbonnier et al., 2013; Komorowski et al., 2013). The plastic rheology is considered more appropriate to simulate such channelized PCs (Kelfoun, 2011) because it allows the PC to either stay confined in the valley or spill over without losing momentum too rapidly (in contrast to the Mohr–Coulomb frictional rheology used in TITAN2D), providing a longer runout. When combined with an accurate, high-resolution DSM, this modeling approach enhances model accuracy and makes such numerical models a more robust tool for PC hazards reduction.
Considerations for Future Hazard Assessment of Pyroclastic Currents at El Misti
Results of the probabilistic runs performed in both the San Lázaro and Huarangal-MM valleys enable the identification of the principal areas inundated by future PCs with similar physical characteristics to those in 2070 cal yr BP. In order to investigate the potential PC hazards at Arequipa, the two ensemble runs computed for each valley were combined into a single probabilistic map (Figure 10A) which is then compared to the hazard map of El Misti volcano published by Mariño et al. (2007) (Figure 10B).
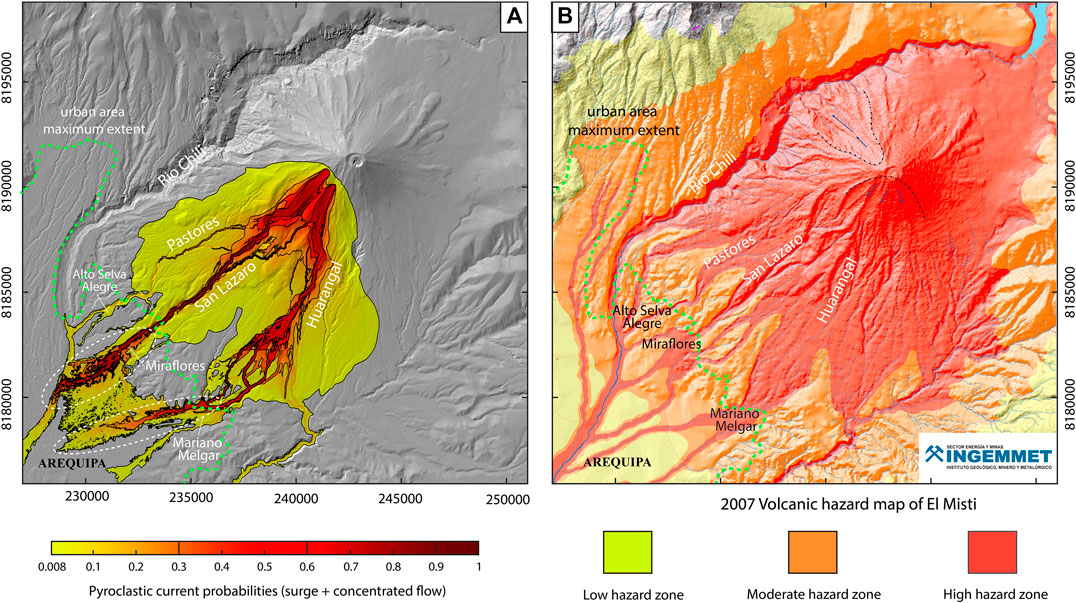
FIGURE 10. Comparison of the map of cumulative pyroclastic current probabilities for both the San Lázaro and Huarangal valleys (A) to the 2007 hazard map of El Misti Volcano (B) published by INGEMMET (Mariño et al., 2007). White dashed ellipsoids indicate the main overbank pyroclastic current areas in the Arequipa urban area.
The discussion of hazards at the volcano scale is not pertinent here because our numerical simulations only cover in two drainage networks in the SW flank. The comparison will then focus only in the Arequipa urban area, where we discuss several features highlighted in our probabilistic maps in terms of considerations for future PC hazards and risk mitigation at El Misti:
1. The maximum extent of the dilute PCs obtained from the most voluminous VolcFlow runs (low probability yellow area in Figure 10A) outlines a single proximal lobe which covers the entire SW-SSW flanks before separating into two individual lobes at ∼6 km from the crater (in the SW and SSW direction) following the main direction of the San Lázaro and Huarangal-MM valleys. The pattern of this modeled dilute PC inundation zone shares some similarities with the surge extent as outlined in the hazard map of Mariño et al. (2007), also discussed in Cobeñas et al. (2012). This zone is represented in their map by the “moderate hazard zone” (orange zone in Figure 10B) and is in accordance with the low probabilities obtained with VolcFlow for this area. However, while the maximum extent of the urban area as mapped in 2013 (green dashed line in Figure 10) coincides with the maximum extent of our modeled dilute PC inundation zone (Figure 10A), this zone extends further toward Arequipa in the 2007 hazard map (Figure 10B). Beside their low probability of occurrence in such distal areas, dilute PCs are responsible for the majority of deaths due to recent small-volume PCs elsewhere (Soufriere Hills, Loughlin et al., 2002; Unzen, Yamamoto et al., 1993; Merapi, Jenkins et al., 2013). Therefore, efforts must be made to maintain the current construction sprawl of Arequipa at a significant distance from the area of the SW flank between the green dashed line and the distal limit of the orange “moderate hazard zone” (Figure 10).
2. The maximum runout of simulated valley-confined PCs is high, even for small-volume PCs (<10 × 106 m3). Because of the strong channelization of the concentrated PCs, the probabilities remain high along both valleys down to Arequipa, where probabilities are still ∼0.3 when simulated PCs reach the upper limit of the urban area (Figure 10A). This valley-confined PC hazard is also included in the El Misti hazard map and represented by the “high hazard level” zone (in red, Figure 10B) that encompasses every valley reaching Arequipa. However, in the PC hazard maps of Harpel et al. (2011) and Sandri et al. (2014), for which no PC channelization is considered, such hazards from valley-confined PCs are not apparent. The channelization of such long-runout PCs at El Misti toward Arequipa should be considered for future mitigation plans, and the probability of such hazardous currents entering the city should not be underestimated.
3. The distal overspill of valley-confined PCs seems to be underestimated in previous studies on Arequipa’s hazards. In our simulations, when PCs exit both valleys, they become unconfined and spread laterally, exposing the northern and eastern districts of Arequipa (Alto Selva Alegre, Miraflores, and MM) to massive overspills with a medium probability of occurrence (0.1–0.3 in Figure 10A). In case of voluminous PCs (>30 × 106 m3 in one valley), the overbank PCs merge and inundate the entire northern part of Arequipa (Figure 10A), reaching the central district. Some simulated overbank processes may be due to the relatively poor representation of the two narrow channels passing through the city in the DSM downgraded at 8 m spatial resolution. However, similar overbank PC phenomenon have repeatedly shown their danger and unpredictability, as witnessed during the Merapi 2006 and 2010 eruptions (Charbonnier and Gertisser, 2008; Lube et al., 2011; Gertisser et al., 2012; Charbonnier et al., 2013) and the Fuego 2018 events. Although the probabilities of these massive overspills are relatively low in our maps, the 2007 hazard-zone map of El Misti seems to disregard this phenomenon by only considering PC hazards along river paths (red zone in Figure 10B) that quickly become a low hazard zone (yellow) away from the river path in the city. The risk for such overbank processes and spreading of unconfined PCs inside Arequipa should then be refined and the “high hazard zone” of the hazard map extended accordingly. In order to help further investigate such overbank PC hazards in the city of Arequipa, future work will involve small-scale, high-resolution numerical modeling of valley-confined PCs performed over a very high resolution (<1 m) DSM along short reaches (few hundreds of meters long) of the San Lázaro and Huarangal-MM channels, similar to the recent work of Mead et al. (2017) to estimate building vulnerability from lahars in Q. Dahlia, a tributary to the latter channel. Robust estimates of the potential range of local mass fluxes and velocities of valley-confined PCs for each channel segment are critical for correctly assessing numerically overbank PC processes at such fine-scale level.
Results from our combined study using field data, optical imagery and numerical modeling at El Misti highlight the need to 1) calibrate model input parameters using quantitative and well-constrained geological data and 2) develop new high-resolution DSMs with high vertical accuracy together with a full probabilistic modeling approach in order to increase the confidence level in results from numerical simulations of small-volume PCs over complex volcanic terrains.
Conclusions
1. This multi-disciplinary study demonstrates the benefit of collecting and combining a quantitative dataset from field data and optical imagery to better calibrate the input parameters of a probabilistic ensemble run using a two-layer, depth averaged mass flow model like VolcFlow.
2. In the case of the 2070 cal yr BP PCs at El Misti volcano, new stratigraphic surveys, sedimentological analyses and thickness measurements of the different PC deposits, combined with a new high-spatial resolution (2 m) DSM of the volcano, allow to better estimate the distribution of individual PC volumes emplaced in each of the valleys impacted by this Plinian event. Such data acquisition is particularly critical for two of these valleys (San Lázaro and Huarangal-MM) for which the medial and distal reaches now cross the suburbs of Arequipa.
3. Volume estimates were used as input parameters to better calibrate probabilistic numerical simulations of future similar PC events using the two-layer VolcFlow model and assess the impacts (e.g., inundation, runout, thickness and velocity) of both the concentrated and dilute portions of these currents in the San Lázaro and Huarangal rivers.
4. Modeling results demonstrate that, while the hazards associated with widespread dilute PCs are in accordance with the extent of the “moderate hazard zone” from the 2007 EL Misti hazard map, the risk of overbank processes and spreading of unconfined PCs inside Arequipa are underestimated and should be refined.
5. Future work should focus on fine-scale studies combining field-based surveys and mapping with numerical modeling over very high resolution (<1 m) DSMs of small areas (<1 km2) of the city at risk from PC overbanking, similar to recent studies focusing on building vulnerabilities from lahar avulsion. Such future work will provide civil authorities with a better understanding of the likely effects of PCs associated with a similar VEI 4 eruption of El Misti on the urban area of Arequipa.
Data Availability Statement
The original contributions presented in the study are included in the article/Supplementary Material, further inquiries can be directed to the corresponding author.
Author Contributions
SC wrote 80% of the manuscript and created 8 figures and 2 tables. JT wrote 10% of the manuscript, created 1 figure and 1 table. VG wrote 10% of the manuscript, created 3 figures and 1 table. RC did the grain size analyses and review the manuscript. SC, JT, and RC collected all field data presented in the manuscript during two field campaigns in 2018 and 2019. SC and VG performed the probabilistic modeling. SC built the DEM, did the volume calculations and stratigraphy, and performed the component analyses.
Funding
This work was partially supported by the National Research Foundation (NSF) through the CAREER grant 1751905. JT acknowledges funding from CLERVOLC and I-Site Cap2025. This research was financed by the French Government IDEX-ISITE initiative 16-IDEX-0001 (CAP 20–25).
Conflict of Interest
The authors declare that the research was conducted in the absence of any commercial or financial relationships that could be construed as a potential conflict of interest.
Acknowledgments
The TanDEM-X data were provided by the German Aerospace Center (DLR) under proposals OTHER0653 and XTIGEOL6738. The VolcFlow simulation code is distributed and written by Karim Kelfoun at Laboratoire Magma et Volcans, Clermont-Ferrand, France. We thank our Peruvian colleagues from INGEMMET for their hospitality and support over the years and for kindly sharing their ideas about the 2070 cal yr BP of El Misti. SC would like to thank Apollo Mapping for their help with the Pleiades optical imagery and Fenghui Deng for processing the TanDEM-X data. JT acknowledges support from CLERVOLC.
Supplementary Material
The Supplementary Material for this article can be found online at: https://www.frontiersin.org/articles/10.3389/feart.2020.557788/full#supplementary-material
References
Andreastuti, S., Paripurno, E., Gunawan, H., Budianto, A., Syahbana, D., and Pallister, J. (2019). Character of community response to volcanic crises at Sinabung and Kelud volcanoes. J. Volcanol. Geoth. Res. 382, 298–310. doi:10.1016/j.jvolgeores.2017.01.022
Arnold, D. W. D., Biggs, J., Anderson, K., Vallejo Vargas, S., Wadge, G., Ebmeier, S. K., et al. (2017). Decaying lava extrusion rate at El Reventador Volcano, Ecuador, measured using high-resolution satellite radar. J. Geophys. Res. Solid Earth 122 (12), 9966–9988. doi:10.1002/2017jb014580
Bagnardi, M., González, P. J., and Hooper, A. (2016). High-resolution digital elevation model from tri-stereo Pleiades-1 satellite imagery for lava flow volume estimates at Fogo volcano. Geophys. Res. Lett. 43, 6267–6275. doi:10.1002/2016gl069457
Bayarri, M. J., Berger, J. O., Calder, E. S., Dalbey, K., Lunagomez, S., Patra, A. K., et al. (2009). Using statistical and computer models to quantify volcanic hazards. Technometrics 51 (4), 402–413. doi:10.1198/tech.2009.08018
Blott, S. J., and Pye, K. (2001). GRADISTAT: a grain size distribution and statistics package for the analysis of unconsolidated sediments. Earth Surf. Process. Landforms 26, 1237–1248. doi:10.1002/esp.261
Chávez Chávez, J. A. (1992). La erupción del Misti. Pasado, presente, futuro. Arequipa: Impresiones Zenith. doi:10.2172/5420913
Charbonnier, S. J., Deng, F., Dixon, T. H., and Malservisi, R. (2018). “High-resolution DEMs of active volcanoes from TanDEM-X data: implications for flow modeling and hazard assessment,” in IGARSS 2018, 2018 IEEE Int. Geosci. Remote Sens. Symp., Valencia, Spain, July 22–27, 2018 (IEEE), 399–402. doi:10.1109/igarss.2018.8518271
Charbonnier, S. J., and Gertisser, R. (2012). Evaluation of geophysical mass flow models using the 2006 block-and-ash flows of Merapi Volcano, Java, Indonesia: towards a short-term hazard assessment tool. J. Volcanol. Geoth. Res. 231–232, 87–108. doi:10.1016/j.jvolgeores.2012.02.015
Charbonnier, S. J., and Gertisser, R. (2008). Field observations and surface characteristics of pristine block-and-ash flow deposits from the 2006 eruption of Merapi Volcano, Java, Indonesia. J. Volcanol. Geoth. Res. 177, 971–982. doi:10.1016/j.jvolgeores.2008.07.008
Charbonnier, S. J., and Gertisser, R. (2009). Numerical simulations of block-and-ash flows using the Titan2D flow model: examples from the 2006 eruption of Merapi Volcano, Java, Indonesia. Bull. Volcanol 71, 953–959. doi:10.1007/s00445-009-0299-1
Charbonnier, S. J., Kelfoun, K., Widiwijayanti, C., Sayudi, D. S., and Putra, R. (In press). “Assessing the pyroclastic density current hazards at Merapi: from field data to numerical simulations and hazard maps,” in Merapi volcano. Editors R. Gertisser, V. Troll, T. Walter, and N. Nandaka, Ratdomopurbo (Berlin, Germany: Springer ‘Active Volcanoes of the World’ Book Series).
Charbonnier, S. J., Varner, L., Escobar Wolf, R., Rodriguez, L., Chigna, G., Chun, C., et al. (2019). “Unravelling the dynamics and hazards of the June 3rd, 2018 pyroclastic currents at Fuego volcano (Guatemala): a multi-parameter approach,” in AGU Fall meeting Abstract #619589, San Francisco, CA, December 2019.
Cobeñas, G., Thouret, J.-C., et al. (2014). Reply to comment on: “Cobeñas, G., Thouret, J.-C., Bonadonna, C., Boivin, P., 2012. The c.2030yr BP Plinian eruption of El Misti volcano, Peru: eruption dynamics and hazard implications. Journal of Volcanology and Geothermal Research 241–242, 105–120.” by Harpel et al., JVGR 2013 G., Thouret, J.-C., Bonadonna, C., and Boivin, P., 2012. The c.2030 yr BP Plinian eruption of El Misti volcano, Peru: eruption dynamics and hazard implications. J. Volc. Geoth. Res. 41–242,105–120.” by Harpel et al., JVGR, 2013. J. Volcanol. Geoth. Res. 275, 103–113. doi:10.1016/j.jvolgeores.2014.02.014
Cobeñas, G., Thouret, J.-C., Bonadonna, C., and Boivin, P. (2012). The c.2030yr BP Plinian eruption of El Misti volcano, Peru: eruption dynamics and hazard implications. J. Volcanol. Geoth. Res. 241-242, 105–120. doi:10.1016/j.jvolgeores.2012.06.006
Constantinescu, R., Thouret, J-C., and Irimus, I. A. (2011). Computer modeling as tool for volcanic hazards assessment: an example of pyroclastic flow modeling at El Misti volcano, Southern Peru. Geogr. Tech. 2-2011, 1–14.
Gertisser, R., Cassidy, N. J., Charbonnier, S. J., Nuzzo, L., and Preece, K. (2012). Overbank block-and-ash flow deposits and the impact of valley-derived, unconfined flows on populated areas at Merapi volcano, Java, Indonesia. Nat. Hazards 60, 623–648. doi:10.1007/s11069-011-0044-x
Gueugneau, V., Kelfoun, K., Charbonnier, S. J., Germa, A., and Carazzo, G. (2020). Dynamic and impacts of the May 8th, 1902 pyroclastic current at Mount Pelée (Martinique): new insights from numerical modeling. Front. Earth Sci 8, 279. doi:10.3389/feart.2020.00279
Gueugneau, V., Kelfoun, K., and Druitt, T. (2019). Investigation of surge-derived pyroclastic flow formation by numerical modeling of the 25 June 1997 dome collapse at Soufrière Hills Volcano, Montserrat. Bull. Volcanol. 81 (4), 25. doi:10.1007/s00445-019-1284-y
Harpel, C., da Silva, S., and Salas, G. (2013). Comment on: “Cobeñas, G., Thouret, J.-C., Bonadonna, C., Boivin, P., 2012. The c.2030 yr BP Plinian eruption of El Misti volcano, Peru: eruption dynamics and hazard implications. J. Volcanol. Geoth. Res. 241–242, 105–120.” J. Volcanol. Geoth. Res. 275, 103–113. doi:10.1016/j.jvolgeores.2014.02.014
Harpel, C., da Silva, S., and Salas, G. (2011). The 2 ka eruption of Misti volcano, southern Peru—the most recent Plinian eruption of Arequipa's iconic volcano. Geol. Soc. Amer. Spec. Pap. 484, 1–7. doi:10.1130/2011.2484
Jenkins, S., Komorowski, J.-C., Baxter, P. J., Spence, R., Picquout, A., Lavigne, F., et al. (2013). The Merapi 2010 eruption: an interdisciplinary impact assessment methodology for studying pyroclastic density current dynamics. J. Volcanol. Geoth. Res. 261 (1), 316–329. doi:10.1016/j.jvolgeores.2013.02.012
Kelfoun, K. (2017). A two-layer depth-averaged model for both the dilute and the concentrated parts of pyroclastic currents. J. Geophys. Res. Solid Earth 122, 1–19. doi:10.1002/2017jb014013
Kelfoun, K. (2011). Suitability of simple rheological laws for the numerical simulation of dense pyroclastic flows and long-runout volcanic avalanches. J. Geophys. Res. 116, B08209. doi:10.1029/2010JB007622
Kelfoun, K., and Druitt, T. H. (2005). Numerical modeling of the emplacement of Socompa rock avalanche, Chile. J. Geophys. Res. Solid Earth 112, B12202. doi:10.1029/2005JB003758
Kelfoun, K., Gueugneau, V., Komorowski, J.-C., Cholik, N., and Merciecca, C. (2017). Simulation of block-and-ash flows and ash-cloud surges of the 2010 eruption of Merapi volcano with a two-layer model. J. Geophys. Res. Solid Earth 122, 1–16. doi:10.1002/2017jb013981CrossRef Full Text | Google Scholar
Kelfoun, K., Samaniego, P., Palacios, P., and Barba, D. (2009). Testing the suitability of frictional behaviour for pyroclastic flow simulation by comparison with a well-constrained eruption at Tungurahua volcano (Ecuador). Bull. Volcanol 71, 1057–1075. doi:10.1007/s00445-009-0286-6
Komorowski, J.-C., Jenkins, S., Baxter, P. J., Picquout, A., Lavigne, F., Charbonnier, S., et al. (2013). Paroxysmal dome explosion during the Merapi 2010 eruption: processes and facies relationships of associated high-energy pyroclastic density currents. J. Volcanol. Geoth. Res. 261, 260–294. doi:10.1016/j.jvolgeores.2013.01.007
Legros, F. (2001). Tephra stratigraphy of Misti volcano, Peru. J. S. Am. Earth Sci. 14 (1), 15–29. doi:10.1016/s0895-9811(00)00062-6
Loughlin, S. C., Calder, E. S., Clarke, A., Cole, P. D., Luckett, R., Mangan, M. T., et al. (2002). Pyroclastic flows and surges generated by the 25 June 1997 dome collapse, Soufrière Hills Volcano, Montserrat. Geol. Soc. Lond. Mem. 21, 191–209. doi:10.1144/gsl.mem.2002.021.01.09
Lube, G., Cronin, S. J., Thouret, J.-C., and Surono, S. (2011). Kinematic characteristics of pyroclastic density currents at Merapi and controls on their avulsion from natural and engineered channels. Geol. Soc. Am. Bull. 123, 1127–1140. doi:10.1130/b30244.1
Mariño, J., Rivera, M., Cacya, L., Thouret, J.-C., Macedo, O., Salas, G., et al. (2007). Data from: Mapa de los peligros volcánicos del Misti. Ingemmet, Proyecto Multinacional Andino, IRD, LMV, Instituto de Geofísica UNAM, UNSA, Universidad Católica de Santa Maria, INDECI, Gobierno regional de Arequipa, Municipalidad provincial de Arequipa, PREDES, SENAMHI, Lima.
McKay, M. D., Beckman, R. J., and Conover, W. J. (1979). Comparison of three methods for selecting values of input variables in the analysis of output from a computer code. Technometrics 21, 239–245. doi:10.1080/00401706.1979.10489755
Mead, S. R., Magill, C., Lemiale, V., Thouret, J-C., and Prakash, M. (2017). Examining the impact of lahars on buildings using numerical modelling. Nat. Hazards Earth Syst. Sci. 17, 703–719. doi:10.5194/nhess-17-703-2017
Navarro Colque, P. (1999). Cartografía geológica, historia eruptiva y evaluación de las amenazas volcánicas del estrato-volcán Misti. [dissertation’s thesis]. Arequipa (Peru): Universidad Nacional San Agustin, Facultad de Geología, Geofísica y Minas.
Newhall, C. G., and Self, S. (1982). The volcanic explosivity index (VEI) an estimate of explosive magnitude for historical volcanism. J. Geophys. Res. 87, 1231–1238. doi:10.1029/jc087ic02p01231
Ogburn, S. E., and Calder, E. S. (2017). The relative effectiveness of empirical and physical models for simulating the dense undercurrent of pyroclastic flows under different emplacement conditions. Front. Earth Sci. 5, 1–26. doi:10.3389/feart.2017.00083
Oh, J., and Lee, C. (2014). Automated bias-compensation of rational polynomial coefficients of high resolution satellite imagery based on topographic maps. ISPRS J. Photogramm. Remote Sens. 100, 12–22. doi:10.1016/j.isprsjprs.2014.02.009
Poland, M. P. (2014). Time-averaged discharge rate of subaerial lava at Kīlauea Volcano, Hawai'i, measured from TanDEM-X interferometry: implications for magma supply and storage during 2011–2013. J. Geophys. Res. Solid Earth 119, 5464–5481. doi:10.1002/2014jb011132
Rivera, M., Martin, H., Le Pennec, J.-L., Thouret, J.-C., Gourgaud, A., and Gerbe, M.-C. (2017). Petro-geochemical constraints on the source and evolution of magmas at El Misti volcano (Peru). Lithos, 268-271, 240–259. doi:10.1016/j.lithos.2016.11.009
Sandri, L., Thouret, J.-C., Constantinescu, R., Biass, S., and Tonini, R. (2014). Long-term multi-hazard assessment for El Misti volcano (Peru). Bull. Volcanol. 76, 771. doi:10.1007/s00445-013-0771-9
Suni Chambi, J. (1999). Estudio geológico y vulcanológico del volcán Misti y sus alrededores. dissertation’s thesis. Arequipa (Peru): Universidad Nacional San Agustin.
Surono, , Jousset, P., Pallister, J., Boichu, M., Buongiorno, M. F., Budisantoso, A., et al. (2012). The 2010 explosive eruption of Java's Merapi volcano-A '100-year' event. J. Volcanol. Geoth. Res. 241–242, 121–135. doi:10.1016/j.jvolgeores.2012.06.018CrossRef Full Text | Google Scholar
Thouret, J.-C., Finizola, A., Fornari, M., Legeley-Padovani, A., Suni, J., and Frechen, M. (2001). Geology of El Misti Volcano near the city of Arequipa, Peru. Geol. Soc. Amer. Bull. 113 (12), 1593–1610. doi:10.1130/0016-7606(2001)113<1593:goemvn>2.0.co;2
Thouret, J.-C., Legros, F., Gourgaud, A., Salas, G., Juvigné, E., Gilot, E., et al. (1995). Un exemple de prévision des risques volcaniques au Pérou méridional (région d'Arequipa), fondé sur l'étude de l'activité éruptive récente du strato-volcan El Misti. C.-R. Acad. Sci. Paris 3, 923–929.
Thouret, J.-C., Suni, J., Eissen, J.-Ph., and Navarro, P. (1999). Assessment of volcanic hazards in the Arequipa area based on the eruptive history of Misti volcano, Southern Peru. Z. Geomorphol 114, 89–112.
Tierz, P., Sandri, L., Costa, A., Zaccarelli, L., Di Vito, M. A., Sulpizio, R., et al. (2016). Suitability of energy cone for probabilistic volcanic hazard assessment: validation tests at Somma Vesuvius and Campi Flegrei (Italy). Bull. Volcanol. 78, 1–15. doi:10.1007/s00445-016-1073-9
Wadge, G. (2009). “Assessing the pyroclastic flow hazards from dome collapse at Soufriere Hills Volcano, Montserrat,” in Studies in volcanology: the Legacy of George Walker, Editors T. Thordarsson, S. Self, G. Larsen, S. K. Rowlands, and A. Hoskuldsson (London, UK: Geological Society, London, Special Publications) 2, 211–224.
Keywords: El Misti volcano, pyroclastic currents, probabilistic modeling, field data acquisition, hazard assessment and mapping
Citation: Charbonnier SJ, Thouret J-C, Gueugneau V and Constantinescu R (2020) New Insights Into the 2070 cal yr BP Pyroclastic Currents at El Misti Volcano (Peru) From Field Investigations, Satellite Imagery and Probabilistic Modeling. Front. Earth Sci. 8:557788. doi:10.3389/feart.2020.557788
Received: 30 April 2020; Accepted: 24 August 2020;
Published: 15 September 2020.
Edited by:
Laura Sandri, National Institute of Geophysics and Volcanology (Bologna), ItalyReviewed by:
Lucia Capra, National Autonomous University of Mexico, MexicoRoberto Sulpizio, University of Bari Aldo Moro, Italy
Copyright © 2020 Charbonnier, Thouret, Gueugneau and Constantinescu. This is an open-access article distributed under the terms of the Creative Commons Attribution License (CC BY). The use, distribution or reproduction in other forums is permitted, provided the original author(s) and the copyright owner(s) are credited and that the original publication in this journal is cited, in accordance with accepted academic practice. No use, distribution or reproduction is permitted which does not comply with these terms.
*Correspondence: Sylvain Charbonnier, c3lsdmFpbkB1c2YuZWR1