 Meike Lemmer
 Line Rochefort
 Maria Strack
- 1Department of Plant Sciences, Centre for Northern Studies, University Laval, Quebec, QC, Canada
- 2Department of Geography and Environmental Management, Wetland Soils and Greenhouse Gas Exchange Lab, University of Waterloo, Kitchener, ON, Canada
In-situ oil extraction activities impact the vast mosaic of boreal wetlands and uplands. Peatland restoration in these regions aims at reestablishing crucial peatland functions, such as peat accumulation and carbon (C) sequestration. In order to assess the success of fen restoration, we evaluated the biogeochemical conditions, the seasonal carbon balances via carbon dioxide (CO2) fluxes and methane (CH4) emissions, and addressed the global warming potential following different restoration techniques at two restored in-situ oil sands well pads, during two consecutive growing seasons. Restoration work involved: 1) the partial or complete removal of introduced well pad construction materials, and spontaneous revegetation, or 2) the partial removal of foreign clay, in addition to reintroduction of typical fen plant species such as Larix laricina, Salix lutea and Carex aquatilis. Comparisons were done with regional reference ecosystems (REF) consisting of three peatlands: a wooded bog, a wooded rich fen and a wooded extreme-rich fen. While the average electric conductivity of restored sectors (946 μS cm−1) was higher compared to REF (360 μS cm−1), the pH was quite similar (pH 5.8 REF, pH 6 restored). Dissolved organic carbon concentration was lower in all restored sectors (5–11 mg L-1 restored sectors, 15–35 mg L-1 REF), presumably due to the still incomplete recovery of vegetation and lower organic matter content associated with remnant well pad material. Re-establishment of shrub and brown moss species improved significantly the C uptake. However, the active introduction of plant species was no crucial restoration step, in order to return species beneficial for C uptake. Restoration treatments that were leveled closest to the surrounding REF showed the most similar seasonal C balance to REF. In shallow open water areas resulting from the complete removal of all construction materials, we measured the highest methane emissions making these flooded sites net C sources to the atmosphere with elevated global warming potential. The partial removal of the well pad’s mineral soil to near the water table level and the surface elevation of the surrounding ecosystem seems to be the most effective site management method to sequester carbon efficiently. However, further research is needed to evaluate the suitability of this restoration method for the recovery of biodiversity and possible impacts of residual foreign materials on fen ecosystems.
Introduction
In the boreal biomes of the northern countries, industrial activities are constantly increasing within the last decades, including the sector of oil sands mining, crude oil and gas extraction. The location of the development of this fast-growing industry coincides with the main distribution of the world’s peatlands. Here we investigate the carbon (C) dynamics of disturbed northern peatlands impacted by oil and gas extraction infrastructure, following restoration with a variety of different techniques after in-place (in-situ) bitumen extraction has ended. The goal is to evaluate the impact of fen restoration on different ecosystem attributes, such as greenhouse gas emissions and the return of the carbon sequestration function, compared with conditions prior to disturbances.
Undisturbed peatlands are recognized as the most effective C storing ecosystems on earth, which, globally, cover an area of more than 3 million km2 and store an estimated 644 to 1,105 Pg C (Leifeld and Menichetti 2018; Nichols and Peteet 2019). At the same time, they continuously take up approximately 0.37 Pg carbon dioxide (CO2) from the atmosphere per year IUCN (International Union for Conservation of Nature) (2017), making them a substantial ally in the fight to reverse global warming. Nevertheless, approximately 1.91 Pg CO2-e are emitted annually by drained and degrading peatlands (Leifeld and Menichetti 2018). Restoration and rewetting of disturbed peatlands is therefore recognized as a natural climate solution and allows countries to improve their C emission balance according to the national climate action plan under the UN Framework Convention on Climate Change (UNFCCC 2009).
Peatland disturbances by the oil and gas industry in the boreal region of northern Alberta are caused by open-pit oil sands mining activities up to 75 m depth (3% of the deposits), and the deep drilling in-situ bitumen extraction infrastructure for oil deposits at ∼200 m depth (97% of the deposits; Government of Alberta 2020). The in-situ oil sands extraction process involves the construction of thousands of oil extraction well pads scattered across the landscape, associated steam, power, and water treatment plants, processing and storage facilities, and exploration and access roads. While an average oil sands well pad is ∼1 ha in size, the total area disturbed, including more than 180,000 well pads and associated facilities installed to date, added up to >149,000 km2 by 2009 (Lee and Cheng 2009; Natural Resources Canada 2015). These developments occur in the boreal region’s vast mosaic of forest and wetlands, and affect the ecosystems' hydrology, biodiversity, and biogeochemistry by ground compaction and introduction of foreign mineral substrates (Price, Heathwaite, and Baird 2003; Graf 2009). In order to stabilize the oil pumps and other processing facilities within a peatland ecosystem, an in-situ oil sands well pad needs to be well-drained and firm. The construction process involves the clearing of larger trees and shrubs if necessary and placing of a geotextile over the then leveled original peatland surface, followed by the installation of a 1–2 m thick layer of compacted mineral substrate, prior the installation of pumping equipment and related oil extraction infrastructure. When the oil reserves are exhausted and the well pad will no longer be used, oil sands operators are required to reclaim these disturbed peatlands according to the Alberta Environmental Protection and Enhancement Act (Alberta Queen’s Printer 1994). Specifically targeted peatland restoration outcomes anticipating an “equivalent land capability” were defined in 2015, where criteria for restoration assessment are based on the vegetation species composition of bryophytes and vascular plants, biogeochemical soil conditions, such as nutrient supply rate, hydrology and soil organic matter content, as well as landscape quality (Environment and Parks 2017). Environment and Parks (2017) defined the long-term goals of peatland restoration after well pad disturbances to be the return of the interdependent ecosystem functions present prior to disturbance, including water storage and filtration, wildlife habitat, peat accumulation, and carbon sequestration.
Restoring peatland functions after in-situ oil sands well site disturbances in Alberta is a fairly new process that has started in 2007. All available trials have stressed the importance of restoring hydrological conditions (Vitt et al., 2011; Vitt, Hayes, and Wieder 2012a; Sobze, Schoonmaker, and Rochefort 2012; Caners and Lieffers 2014). Although few studies have investigated ecological functions returning to restored peatlands after oil sands well site disturbances, the importance of restoring proper hydrologic conditions in peatlands affected by drainage and peat extraction has been broadly studied (Price et al., 2003; Large et al., 2007; Price, McLaren, and Rudolph 2010; Cooper et al., 2017; Ahmad et al., 2020; Saraswati et al., 2020). If oxygen levels rise in the upper peat layer called “acrotelm”, which is periodically saturated and aerated according to the changing water table level, microbial activity and aerobic oxidation are enhanced (Price et al., 2003). In the case of disturbed peatlands due to peat extraction, vascular plant cover is often higher following restoration than in comparable undisturbed peatlands (Strack et al., 2016). The higher the vascular plant cover, the higher the ecosystem respiration (Reco) but they also uptake significant amounts of CO2 at the same time, generally leading to net CO2 storage (Strack et al., 2006; Nwaishi et al., 2016; Strack et al., 2016; Nugent et al., 2018). Vascular plant species of boreal peatlands in Northern Alberta include shrub species, such as Betula sp., Larix laricina, Salix sp., Picea mariana, and ericaceous shrubs like Rhododendron groenlandicum and Vaccinium sp., as well as herbaceous species, namely Caltha palustris, Comarum palustre, Equisetum sp., Maianthemum sp., and a large variety of sedges, such as Carex aquatilis, Carex diandra, Carex bebbii, Carex lasiocarpa, Carex utriculata, Eleocharis sp., Eriophorum sp (Alberta Environment and Sustainable Resource Development (ESRD) 2015). However, vascular peatland plant species, in particular graminoid species such as sedges, rushes, and grasses, are considered to enhance methane (CH4) emissions due to their large aerenchyma (Green and Baird 2012; Lazcano et al., 2018), while Strack et al. (2017) have found brown mosses to effectively decrease CH4 emissions. Following a hydrological restoration after peat extraction for example, an increase in the water table level and vascular plant and moss cover result in the return to uptake of CO2, while CH4 emissions rise due to enhanced methanogenesis, but do not reach the emission rates of natural peatlands (Sundh et al., 1995; Evans, Renou-Wilson, and Strack 2016; Strack et al., 2016; Hemes et al., 2018).
As mentioned above, very few well pad to peatland restoration projects have been attempted to date. In 2012, the moss layer transfer technique (Quinty and Rochefort 2003) was successfully applied on a restored well pad within a wooded bog, in the Carmon Creek division of the Peace River, Alberta. The inversion of the mineral pad and underlying peat layers proved to be a successful base for the introduction of bog moss propagules (Sobze, Schoonmaker, and Rochefort 2012). Shunina et al. (2016) conclude from their bog restoration trial in the Cold Lake region, Alberta, that different microtopographic conditions prove to be favorable for different vascular plant and moss species, while they observed a higher resilience toward interannual moisture variation due to changes in water table level. On the other hand, to restore fens on former in-situ oil sands well pads, only few attempts have been made during the last 12 years, and our understanding of fen restoration method’s abilities to return ecosystem functions remains limited. In this study, we evaluate the effect of different fen restoration techniques on two research sites, located in the oil sands regions of Peace River and Cold Lake, Alberta where a series of different restoration strategies were tested, including the complete and partial removal of the former well pad’s mineral soil and clay layers, as well as re-introduction of specific plant species or natural re-vegetation. While the complete removal of a well pad favors the development of shallow open water sectors with aquatic vegetation, the partial removal of the mineral soil promised to achieve a well-adjusted leveling of the residual well pad with the surrounding fen ecosystems, and obtain an optimal water table level to stimulate natural fen revegetation Imperial Oil Resources. (2007). In 2007, Vitt et al. (2011) attempted to imitate fen initiation via paludification, by restoring peatlands directly on the mineral substrate of the well pad. Pioneer plant species were introduced and the water table level was well managed, in order to promote plant succession for the development of organic matter accumulation over time (Vitt et al., 2011; Koropchak et al., 2012). The introduction of sedge species known to colonize early stage fens proved successful, if hydrological conditions were maintained (Wieder and Vitt 2006; Vitt et al., 2011; Vitt et al., 2012; Koropchak et al., 2012). Another peatland initiation technique was tested in 2009, focusing on the transfer of moss propagules (Sphagnum sp.) in addition to the introduction of vascular plant species (Gauthier 2014; Gauthier et al., 2018). This study clearly illustrated the importance of choosing characteristic fen moss species over bog moss species for mineral wetland restoration after well pad disturbances (Gauthier 2014).
The investigated fen restoration techniques in this study represent some first trials to restore Canadian in-situ oil sands well pads in the boreal region, hence, the outcomes have not been studied before and no best practice has been established to restore former in-situ oil sands well sites. Since the restoration of characteristic peatland functions such as C sequestration and peat accumulation is targeted, our aim was to evaluate the impact of fen restoration techniques on different ecosystem attributes, such as greenhouse gas emission rates and primary production. In this paper we will focus especially on the net ecosystem exchange (NEE) of CO2 and CH4 flux dynamics of spontaneously emerged vegetation communities and of communities with intentionally re-introduced species, in restored fens impacted by mineral substrate. Comparisons will be made to regional peatland reference ecosystems. We hypothesize that the net C uptake will be most similar to the rate of reference ecosystems when 1) characteristic fen vegetation species are present, and also when 2) biogeochemical conditions, such as nutrient rates, pH and electric conductivity, are most similar to reference peatlands. We further hypothesize that 3) CH4 emissions are enhanced through the complete well pad removal, as in the process created depressions and permanently saturated conditions enhance methanogenesis.
Methods
Study Sites
This study was conducted in two different research areas in the Peace River and Cold Lake oil sands regions in northern Alberta, Canada (Figure 1). Two decommissioned in-situ oil sands well pads and three adjacent reference ecosystems served as study sites. Both well pads were about 100 m by 100 m in size and were constructed in the following manner: first, trees and taller shrubs were cut, then a geotextile was placed over the remaining vegetation upon the original peatland, and then 1–2 m compacted clay was laid down on the top of it to stabilize the “swampy” ground before the oil extraction equipment and infrastructure were installed.
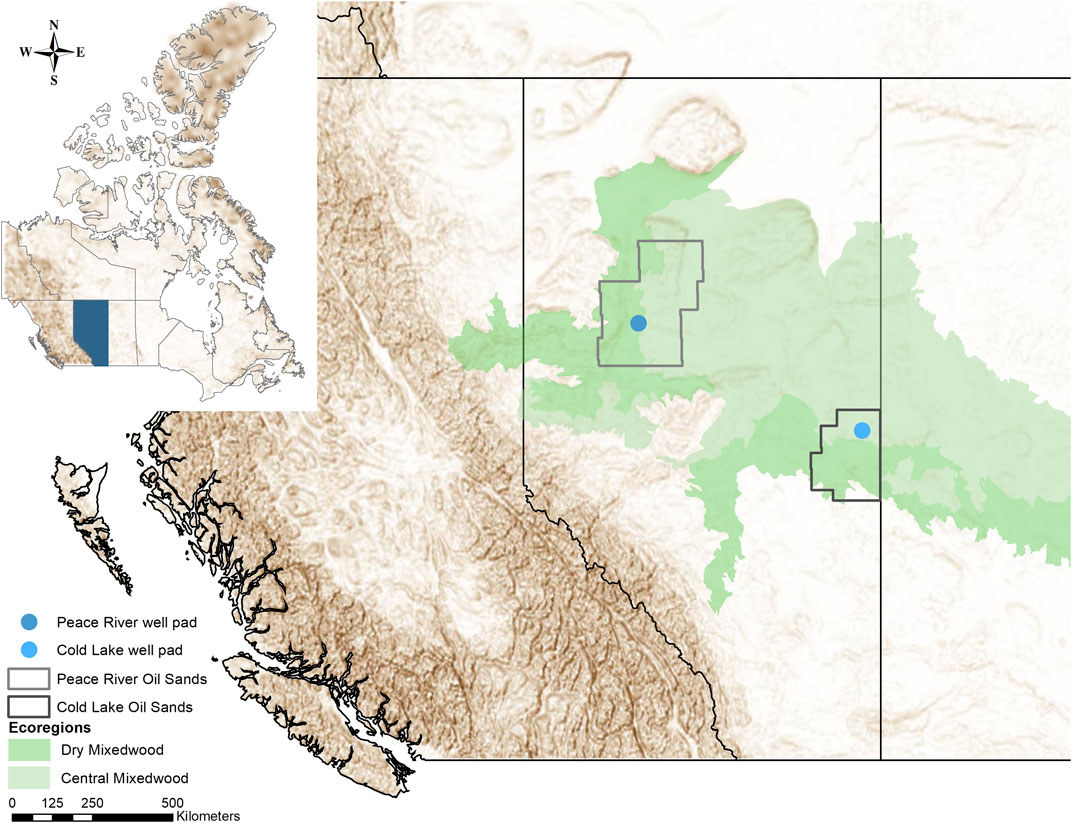
FIGURE 1. The study sites, two restored in-situ oil sands well pads, situated within the oil sands regions of Peace River and Cold Lake. Both sites are located in the Boreal Mixedwood ecoregion of boreal Northern Alberta.
Well Pad in the Peace River Oil Sands
Located 35 km northeast of the city of Peace River, Alberta, one well pad was constructed within a wooded bog ecosystem (56°23'0.95"N, 116°46'43.43"W). In the adjacent bog, a natural undisturbed sector was chosen as one REF for this study (see Reference sites; Figure 2). Peace River, the well pad’s name from here on, is located in the Dry Mixedwood natural region of Alberta’s boreal region (Beckingham and Archibald 1996), with 70% of its annual precipitation falling between April and August, while the annual average precipitation reaches 386 mm (Government of Canada 2019). The average frost free period is 112 days with average daily temperatures of 13°C between May and September (Government of Canada 2019). Wooded and shrubby fens dominate in this region, while sedge fens and bogs are rather seldomly encountered (Natural Regions Committee 2006).
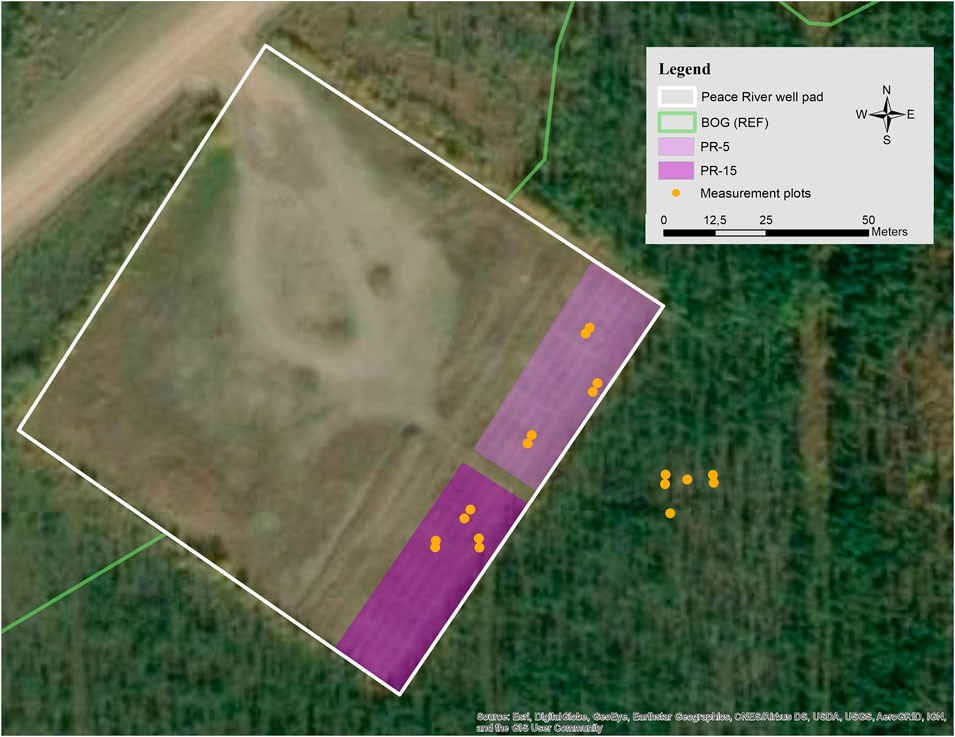
FIGURE 2. The Peace River well pad (white outline) is located within a wooded bog ecosystem, which serves as reference ecosystem (BOG) in this study. In two restored sectors of the well pad, the mineral soil was partially removed (PR) to 15 cm (PR-15) and to 5 cm (PR-5) above the water table of the adjacent peatland. Yellow dots indicate measurement plots.
Peace River was decommissioned in 2000, 20 years post construction. The unaltered original well pad was reclaimed with herb seedings of Melilotus alba and M. officinalis, which were spread atop of the compacted clay surface. In 2007, the site was offered to a research group for a restoration experiment based on the principles of ecological restoration, to assist the return of a peatland. On the east side, a band of the well pad (30 by 100 m) was used to trial treatments to initiate fen development on mineral soil (Vitt et al., 2011; Koropchak et al., 2012). The experimental area was divided into two sectors (Figure 2). Within one sector, the clay fill was partially removed in order to create a surface profile sitting on average 4–6 cm above the water table level of the adjacent bog. In this study, we refer to this treatment as partial removal with water table at 5 cm (PR-5). Within the second sector, less clay was removed so that the grading would create a surface profile being on average 15 cm above the bog’s water level (PR-15). In both sectors, different soil and fertilization amendments were then applied (see Vitt et al., 2011 for details), while Larix laricina, Salix lutea and Carex aquatilis were planted. Ten years following this study, we observe in PR-5 some S. planifolia and S. exigua present among the very dominant C. aquatilis, while in PR-15 L. laricina, S. planifolia and S. pyrifolia were well developed among the mix of dominating Calamagrostis inexpansa and C. aquatilis. To minimize possible effects of the type of soil amendments on the greenhouse gas dynamics, the measurement plots installed in the present study were chosen within amendments as natural as possible, such as commercial peat, slough hay and control plots without any amendment (Vitt et al., 2011; Koropchak et al., 2012).
Well Pad in the Cold Lake Oil Sands
The second well pad in this study is located 33 km northwest of the city of Cold Lake, Alberta (54°41'10.82"N, 110°30'59.75"W). Cold Lake, what this second well pad will be named from here on, was partially constructed on upland, partially in a wooded rich fen characterized by tall trees and partially in a wooded extreme-rich fen, characterized by shrub-sized tree species (see Reference sites; Figure 3). Within each of these two fens adjacent to the well pad, at least 10 m away from any disturbance, a sector was chosen as REF: 1. treed rich fen (TRF) and 2. shrubby extreme-rich fen (SRF). Cold Lake lies in the moist Central Mixedwood ecoregion of boreal Alberta (Beckingham and Archibald 1996), with an annual average of 421 mm precipitation, an average frost free period of 116 days and a daily average temperatures of 13.9°C during the summer months (Government of Canada 2019).
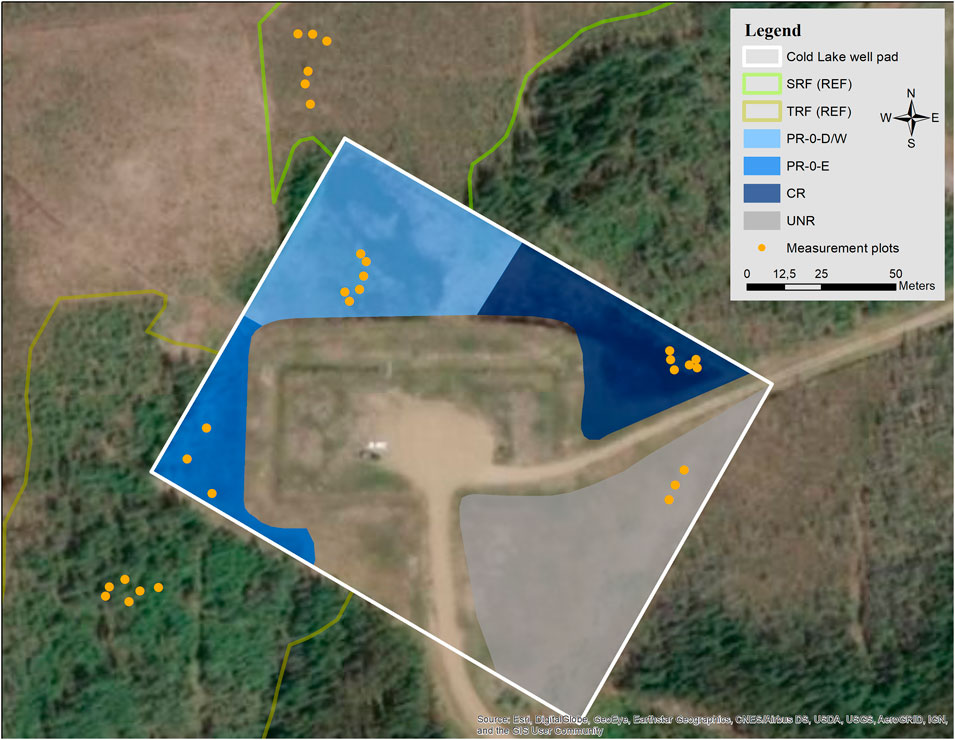
FIGURE 3. The Cold Lake well pad (white outline) is located within a mosaic of uplands and wetlands, which serve as reference ecosystems (TRF = treed rich fen, SRF = shrubby extreme-rich fen). Blue shaded sectors are restored areas where different restoration techniques of complete and partial mineral soil removal were tested (CR = complete removal, PR-0-D/W and PR-0-E = partial removal of mineral soil to near the adjacent fen ecosystems, with high/dry (D) and low/wet (W) microforms, and with even ground (E)). The gray shaded unrestored sector (UNR) serves as a control sector on the former well pad’s residual mineral soil. Yellow dots indicate measurement plots.
Cold Lake was decommissioned in 2003, only one year after its construction, due to drilling problems caused by underlying shale. The well pad was subject to different restoration techniques between 2008 and 2009. The central part of the well pad was kept intact in order to continue operating a monitoring well (unrestored study sector, UNR hereafter, Figure 3). For another part, a complete removal of all introduced building materials (mineral substrate and geotextile) was achieved in spring 2008 (complete removal, CR). In this complete removal sector, a shallow open water area established due to compaction of the underlying peat by the weight of the mineral material. For a third part of the pad, a partial removal of the mineral substrate was carried out successively during 2008 and 2009, as done at Peace River. The goal was to obtain a surface elevation similar to that of the surrounding fens, where water table is close to surface elevation (PR-0). All restored sectors of Cold Lake were left to revegetate spontaneously, with the reasoning that the surrounding wetlands could provide a natural source of diaspores by dispersion. By 2017, emergent aquatic vegetation and a floating moss carpet with sedges and emergent Salix sp. and Betula sp. had formed in the CR sector. We separated the PR-0 sector into two areas with diverse ground relief, where different marsh-like vegetation communities had established. One part is characterized by an uneven relief forming drier and wetter microhabitats, where dominant Typha latifolia, Salix sp., and sedge communities formed (named PR-0-D/W, D for dry and W for wet). The other sector’s ground relief is even, and a diverse moss layer formed between abundant Equisetum spp. and T. latifolia (named PR-0-E, E standing for even).
Reference Sites
Three peatland REF served as monitoring sites for comparison: BOG (56°22'59.50"N, 116°46'38.60"W; Figure 2), a wooded bog, had a characteristic tree and shrub vegetation composition of Picea mariana, Rhododendron groenlandicum, Chamaedaphne calyculata and Vaccinium vitis-idaea, as well as a dense moss layer with Sphagnum fuscum, S. rubellum and Ptychostomum pseudotriquetrum. TRF (54°41'8.88"N, 110°31'4.06"W; Figure 3), a wooded rich fen, had a distinct tree layer with P. mariana and Larix laricina, a shrub layer with R. groenlandicum and a ground layer with Equisetum hyemale, Menyanthes trifoliata and moss species, such as Aulacomnium palustre, Helodium blandowii and Tomentypnum nitens. SRF (54°41'14.80"N, 110°31'0.54"W; Figure 3) was a wooded extreme-rich fen with abundant Betula pumila, Salix sp. and L. laricina that formed a shrub mosaic with abundant herbaceous vegetation like Equisetum sp., M. trifoliata, Triglochin maritima, and sedges, such as Carex lasiocarpa, C. interior, and C. sartwellii.
Measurement Plots
Within all study sites (Supplementary Figure 1A–I)., monitoring sectors were selected according to the restoration technique applied (see Well pad in the Peace River Oil Sands and Well pad in the Cold Lake Oil Sands) and according to the most representative natural state of the reference sites (see Reference sites). Special focus was placed on the vegetation development resulting from differing microforms (Table 1). Microforms were considered either for different elevation, such as hummock/hollow (i.e., in BOG), or for different moisture gradients, such as dry/wet/even (i.e., high lawn with shrubs/low lawn with sedges and mosses/even lawn with mosses). Triplicate measurement plots were selected in each microform within each of the eight study sectors (n = 48) where measurements of CO2, CH4, and abiotic data took place (Figures 2, 3). Each measurement plots was defined by a metal collar of 60 × 60 × 20 cm size that was inserted approximately 17 cm deep into the ground, and which served as a base for the gas flux chamber. All plots were accessible via boardwalks in order to mitigate ground disturbance around the installed collars, during measurements. At each plot, data was collected biweekly during the regional vegetation period from May to September of both monitoring years, 2017 and 2018. The large distance between the sites, as well as weather and industry related constraints made a higher sampling frequency impossible to achieve. This data collection corresponded to 10–11 years post-restoration for Peace River and 8–10 years for Cold Lake.
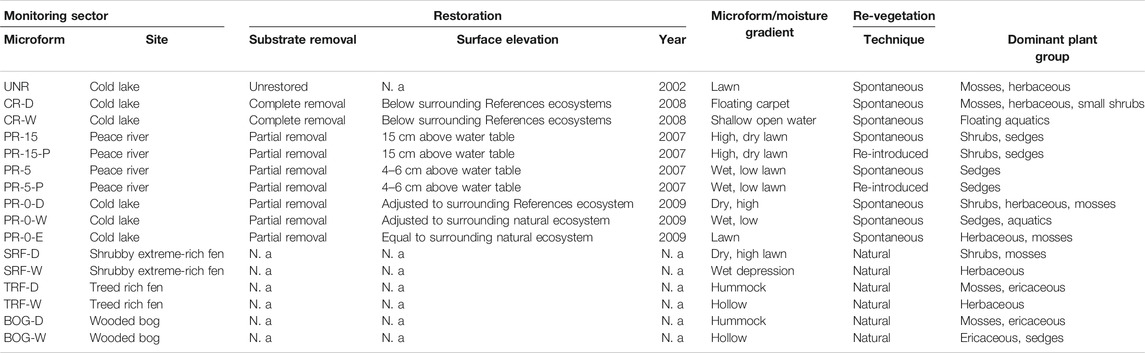
TABLE 1. Site characteristics for the unrestored and restored sectors on two former in-situ oil sands well sites in Peace River and Cold Lake and three reference sites (SRF, TRF, BOG). Monitoring sectors were selected according to the representativity of the natural state, restoration and re-vegetation technique.
Carbon Dioxide Exchange
Measurements of carbon dioxide fluxes were assessed between May 17 and September 28 in 2017 and between May 14 and August 14 in 2018. Fluxes were measured using a dynamic closed chamber technique with a portable infrared gas analyzer (EGM-4) fitted with a PAR Quantum sensor (both PP Systems, Amesbury, MA, USA) that was placed on top of the chamber during measurements. The 60 × 60 × 30 cm large clear polyethylene chamber was equipped with two standard computer fans connected to an external 12 V battery for air circulation, a thermocouple wire to connect to an external type K thermometer (Sper scientific, Scottsdale, AZ, USA), and two tube adapters to connect the IRGA, in order to exchange the sampled air in a circular flow. During measurements, the chamber was fit into the collar’s u-profile rim, which we then filled with water in order to create an airtight seal. In sample plots, where water levels were too high to install collars (CR-W) or collars were submerged (PR-0-W) at certain times, the chamber was fitted with a Styrofoam collar, enabling it to float on the surface. In plots, where shrubby vegetation was too large to fit in the 30 cm high chamber, a 60 cm tall extension made likewise from clear polyethylene, with a u-profile collar at the upper edge, was stacked under the chamber. To account for the enlarged chamber volume, calculations for the flux analysis were accordingly adjusted. Readings of CO2 concentration (ppm), PAR (µmol m−2 s−1) and temperature in the chamber (°C) were recorded in a 15 s interval during 105–120 s. Measurements of net ecosystem exchange (NEE) were repeated under full light conditions and imitating different light conditions through shading of the chamber and the PAR sensor with a mesh material. One mesh cover created 25% shading and a second cover imitated up to 48% covered conditions. Ecosystem respiration (Reco) was determined 8–10 min after full light conditions were captured, by blocking all incoming PAR with an opaque tarp covering both the chamber and PAR sensor. Between each measurement imitating different light conditions, the chamber headspace was vented to adjust to ambient conditions.
Methane Emissions
Methane fluxes were measured bi-weekly eight times each year between May 17 and September 28 in 2017 and between May 14 and August 24 in 2018. CH4 concentration was determined using a closed static chamber technique with opaque polyethylene chambers of the same dimensions as for CO2 measurements. Chambers were darkened with standard spray-paint, aluminum-colored to reduce heating during the flux measurement. Chamber equipment included one standard computer fan for air circulation connected to an external 12 V battery, a thermocouple connected to an external thermometer and one tube with a three-way-valve in order to extract gas samples. All wires and tubes exited the chamber via a rubber plug that fills a hole (5 cm diameter) in the chamber top. At the same time, the rubber plug served as a regulator for possible build-up of air pressure inside the chamber when fitting the chamber to the collar. Again, water poured into the u-profile rim of the collar created an airtight seal of the chamber headspace. Gas samples were taken at 7, 15, 25, and 35 min after chamber closure using a standard 20 ml disposable syringe connected to the three-way-valve. A 20 ml gas sample from the chamber headspace was stored in a 12 ml round bottom Exetainer vial with a septum lid (Labco Limited, Lampeter, Wales, United Kingdom). The created overpressure was necessary in order to prevent any ambient air leaking in. Also, septum lids were discarded after the third use, in order to prevent any leakage due to repeated piercing. Gas samples were sent to the Wetland Soils and Greenhouse Gas Exchange Laboratory at the University of Waterloo, ON for analysis. Analysis for CH4 concentrations was done with a Shimadzu GC2014 gas chromatograph equipped with a flame ionization detector (Shimadzu Scientific Instruments, Kyoto, Japan).
Environmental Parameters, Soil and Water Chemistry
At each plot, manual measurements of water table level and soil temperature (ST) were taken biweekly at the same time as flux measurements. Water level was measured at each spot in perforated pipes, serving as well tubes, that were covered with nylon mesh to prevent silting. These were inserted about 50–100 cm deep into the ground. ST was measured at 2, 5, 10, 15, 20, 25, and 30 cm with a thermocouple probe temperature sensor and reader (Digital thermometer, VWR, Radnor, PA, USA). Water chemistry (pH and electrical conductivity) was measured in August of both 2017 and 2018 with an Orion Versastar Advanced Electrochemistry Meter (Thermo Fisher Scientific Inc., Chelmsford, MA, USA).
Soil samples were collected in August 2018 at each measurement spot and were analyzed for plant available nutrient concentrations of ammonium (N-NH4+), iron (Fe), phosphate (P-PO43−), and sulfate (S-SO42−) as well as for DOC, as these elements were considered indicators of nutrient status and redox state. Analysis for P-PO4, and S-SO42- were done using a FIA Quikchem 8,500 Series 2 (Lachat Instruments, Milwaukee, WI, USA). Fe and N-NH4+ were analyzed via an ICP Agilent 5110 SVDV (Agilent Technologies Inc., Santa Clara, CA, USA). Solutions for DOC analysis were produced via 1:3 soil to water mixtures from soil samples taken within the top 10 cm at each plot. Filtration was done the following day through a 0.45 µm glass fiber filter and stored at 4°C until being analyzed at the Physical Geography Laboratory at the University of Calgary with a TOC-L analyzer (Shimadzu Scientific Instruments Inc., Columbia, MD, USA).
Environmental data of soil temperature (GS3 sensor) and water temperature (CTD-10 sensor) was continuously recorded via EM 50 data loggers (Meter Group Inc., Pullman, WA, USA) from May to September 2017 and May to August 2018. Water tables were also continuously measured with a levelogger (Solinst Canada Ltd., Georgetown, ON) inside a well tube, while the atmospheric pressure for calculating corrected water table level was measured with barologgers (Solinst Canada Ltd., Georgetown, ON) at each site. Additionally, continuous meteorological data of air temperature, precipitation (ECRN-100 sensor), and photosynthetically active radiation (PAR; PYR sensor) was recorded. At Cold Lake, the data recording station was installed directly on the well pad, whereas at Peace River, only environmental data was recorded on site, while the weather station was set up at a nearby restored well pad (approximately 7 km).
Vegetation
The vegetation survey was done within the different sectors during the peak of the vegetation period, in August of both monitoring years. The cover percentage of each vegetation stratum, as well as the percentage of water, bare peat and litter present, was surveyed in all survey quadrats. For each stratum, an additional focus was put on important plant groups, i.e., Ericaceae in the shrub strata, sedges in the herbaceous strata, and Sphagnum sp. in the moss stratum. Within each sector, five vascular plant surveys were done using a 1 m2 survey quadrat and 20 Bryophyte surveys were done using a 625 cm2 survey quadrats. According to the survey type, all plant species were identified to species level while their respective percentage cover and height (in cm) were noted. We determined if a given species, including vascular and moss species likewise, was characteristic of the different fen types found in Alberta, following (Environment and Parks 2017). From here on we refer to these species as fen typical plant species.
Data Analysis
Instantaneous CO2 and CH4 fluxes
NEE (g CO2 m−2 d−1) was calculated according to the linear change of measured CO2 concentration over time, considering collar surface area, chamber volume and air temperature. Gross ecosystem productivity (GEP) was then calculated according to Eq. 1, considering measured NEE and Reco,
Following the atmospheric sign convention, we use negative values to indicate uptake by the ecosystem from the atmosphere, while positive values indicate the release of carbon dioxide and methane. During data cleaning 1% of the data was discarded, including fluxes without a linear change in concentration over time and negative values of Reco.
Methane fluxes (mg CH4 m−2 d−1) were calculated according to the linear change of CH4 concentration over time, in consideration of collar surface area, chamber volume and air temperature inside the chamber. When concentration was low (<3 ppm) and changed less than 0.5 ppm (precision of the sampling and analysis method), respective fluxes were set to 0. In cases where no obvious trend was recognized and where no linearity was achievable, the flux data was rejected. Rejection occurred also in cases of a negative curve following high starting values (>5 ppm). These fluxes are considered as evidence of ebullition caused by ground disturbance during chamber placement and do not represent regular CH4 fluxes. Following this data cleaning procedure, 5% of the data were discarded.
Statistical analyses were done in R 3.6.0 (R Core Team 2019). The package “ggplot2” was used to create figures (Wickham 2016). Analysis of histograms, residuals and the Shapiro-Wilk test for normality indicated that data was not normally distributed in all cases, but no transformations were able to improve the distribution to normality. Despite the non-normally distributed data, we are confident in reporting on one-way ANOVA results, because of the ANOVA’s robustness, where we fit linear models with “microform” as fixed factor and “plot” as random factor. We achieved additional validation by comparison with the results of a non-parametric Kruskal-Wallis test. The Kruskal-Wallis test was validated with a Conover-Iman post-hoc test after Bonferroni adjustment using the package “conover.test” (Dinno 2017), and results were consistent with the ANOVA output. Furthermore, we performed pairwise comparisons using the “emmeans” package and a Tukey Honest Significant Differences (HSD) post hoc analysis with 95% confidence interval (Lenth 2019). We further performed multiple comparisons of treatments between groups with the “agricolae” package (DeMendiburu 2019), in order to complete figures with letters for groups with statistical significant differences. All ANOVAs for NEE and GEP included PAR values >1,000 μmol m−2 s−1 to obtain rates for CO2 uptake that were not limited by light availability (Bubier et al., 2003). A statistical significance was accepted when p < 0.05.
Environmental Influence on Greenhouse Gas Fluxes
Linear regressions were used to further investigate the effect of vascular plant and moss cover, especially of FTP, and water present in the measurement plots, using the lme function (linear mixed effects) in the “nlme” package (Pinheiro et al., 2019). Regressions were calculated between mean seasonal fluxes of CO2 and CH4, and nine independent variables including water table level (WTL), soil temperature at 5 cm depth (ST5), cover of fen typical plant species (FTP), and of all plant functional types (trees, shrubs, ericaceous, herbaceous, sedges, mosses, Sphagnum) and surface available water, litter and bare soil, while plot functioned as a random factor to account for repeated measures over the two years. Package “MuMIn” was used to determine the marginal and conditional R2 (Bartoń 2020). We used a principal component analysis (PCA) to examine the variation among measurement plots considering biotic and abiotic data, and furthermore to explain the variables' contribution to the observed differences among the plots.
Seasonal Carbon Balance
The seasonal carbon balance was estimated according to Eq. 2, where the seasonal GEP (g CO2 m−2 h−1) modeling was done following Baird et al. (2019), fitting a two-parameter model with PAR values in a non-linear regression:
The model parameters are given physical meaning as α represents the slope of a rectangular hyperbola, Q, and gross photosynthesis GPmax is the asymptotic limit theoretical maximum (Baird et al., 2019).
Modeling Reco (g CO2 m 2 h 1) was done following Renou-Wilson et al. (2014), who considered water table level (WT) and soil temperature in order to factor in the different microforms’ diverse moisture regimes, using the Eq. 3:
where a, b, and c are model parameters, TRef is the reference temperature of 283.15 K, T0 is the temperature at biological activation (227.13 K), and TSoil is the measured soil temperature at 5 cm depth (Lloyd and Taylor 1994). Model parameters a, b, and c for the seasonal carbon models of GEP and Reco were calculated using the nonlinear least squares (nls) function in R. GEP and Reco were estimated in half-hourly intervals, averaged and summed for the growing season between May 17 to August 31 in 2017 and between May 22 to September 5 in 2018.
The models’ form was evaluated considering statistically significant parameters and the highest possible correlation coefficient between measured and modeled values.
For each collar we fitted an individual model per year, after exploration of the data suggested that models fits were improved by dividing the data. Due to smaller GEP values caused by springtime conditions such as low temperatures and less photosynthesizing vegetation cover in the early season in 2018, we additionally divided the season into early season (May 22 until June 5, 2018) and late season measurements (June 6 to September 6, 2018) for each sector and fit separate models for each collar per season.
Seasonal CH4 fluxes were estimated by multiplying the measured mean flux values with the number of days for each growing season, following Baird et al. (2019).
Results
Environmental Parameters, Soil and Water Chemistry
The climatic conditions observed during the time of the study were well within the range of the Dry Mixedwood ecoregion’s dry climate in Peace River, and the Moist Mixedwood ecoregion’s humid climate in Cold Lake (Figure 4). During both years of data recording, Cold Lake was characterized by about twice as many rain days as the region of Peace River and even shows consistently higher precipitation data as compared to the 1981–2010 climate normal average of ∼213 and ∼246 mm (Environment and Climate Change Canada 2019). In both regions, the year 2018 was characterized by much wetter conditions than 2017 (Supplementary Table 1). Due to the higher precipitation in 2018’s field season, water table level in the restored and reference sectors were accordingly higher especially in the Peace River region (Table 2). We observed an average rise in water table level of 10.4 cm in the restored sectors, compared to an average rise of 5.6 cm in the reference sectors.
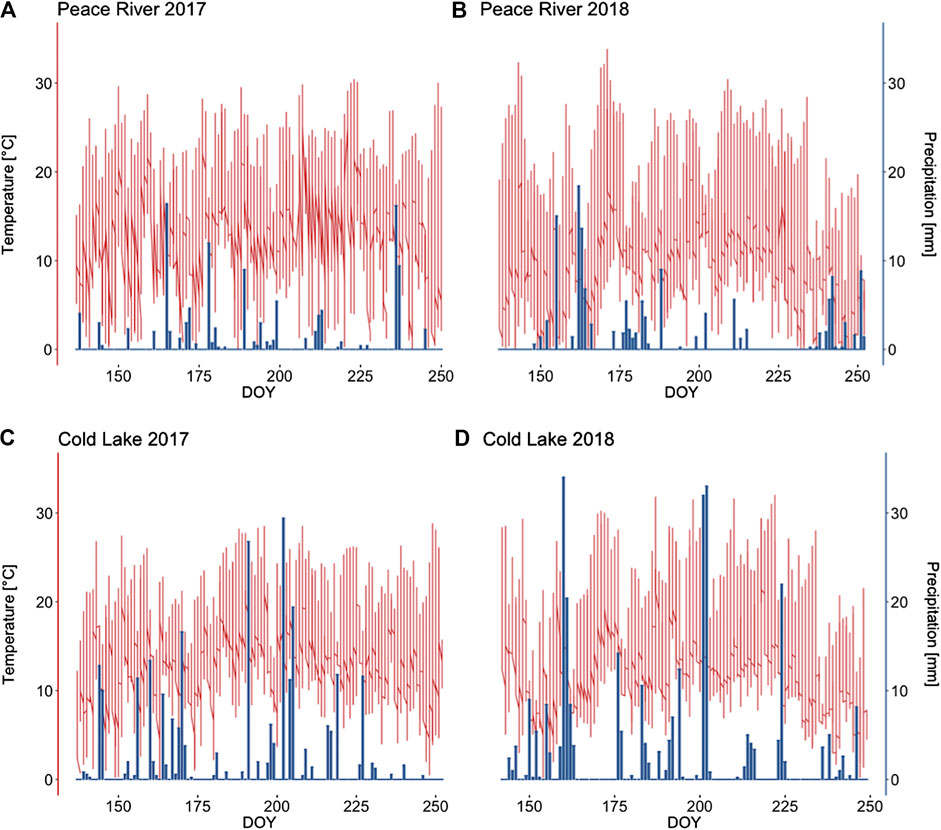
FIGURE 4. Precipitation (mm) and air temperature (°C) measured at a meteorological station on restored in-situ oil sands well pads in the Peace River and Cold Lake Oil Sands, during the monitoring period (May 17 until September 9) in the years 2017 (A+C) and 2018 (B+D).
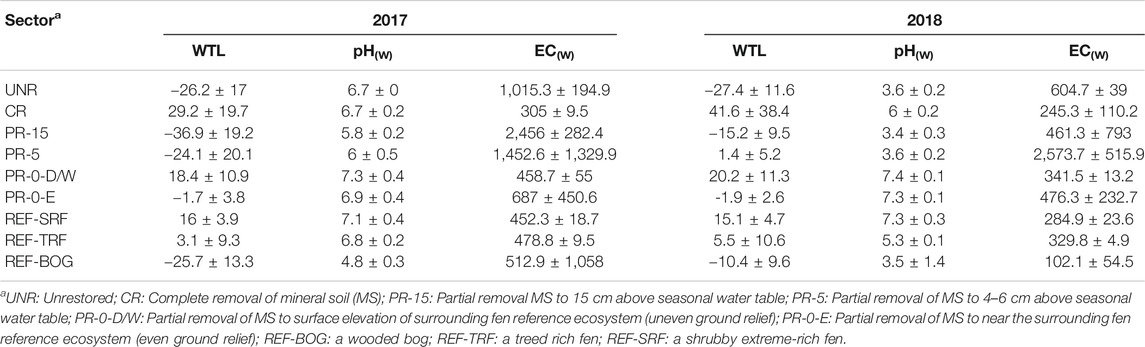
TABLE 2. Mean ± SD water table level (in cm), pH and electric conductivity (EC in µS cm−1) in all different restoration sectorsa on two well pads PRIV and CLAK and three reference ecosystems. Negative values signify a water table below the soil surface, and positive values signify a water table above the soil surface.
The restored sectors PR-5 and PR-15 at Peace River, that were restored by partial removal of the former well pad mineral soil, showed higher values of water pH and electric conductivity in 2017, compared to the water chemistry conditions of wooded fens at SRF and TRF adjacent to Cold Lake, which had lightly more acidic but brackish milieu, with moderate salinity and elevated electric conductivity (Table 2). In 2018, the pH of PR-5 and PR-15 were lower and comparable to the conditions of the adjacent acidic BOG. Here, the values were consistently characteristic for ombrotrophic bogs throughout both years, with highly acidic and oligotrophic conditions (Alberta Environment and Sustainable Resource Development (ESRD) 2015). In all other restored sectors, PR-0 and CR at Cold Lake, fen conditions were maintained throughout both years, where the electric conductivity of water declined in the second year on average by 129 μS cm−1 compared to the previous year, and pH stayed quite stable throughout both years. The same trend in the drop of electric conductivity and water pH can be seen in the unrestored sector UNR. TRF and SRF water chemistry remained quite consistent during both study seasons, with high pH and slightly brackish conditions typical for fens.
Acidic soil conditions were maintained in all restored sectors and BOG throughout 2018 (Table 3). The only outlier with a slight alkaline pH 8 was observed at UNR. EC of the soil remained notably higher in all unrestored and restored sectors, compared to the REF sectors. Dissolved organic carbon (DOC) in the REF was on average 19 mg L−1 higher than in the restored sectors. Comparisons of the average plant available nutrient concentrations of iron, ammonium, phosphorus and sulfur reveal mean concentrations found in the restored sectors were below values found in REF. Only the shallow open water sector CR-D showed REF-equivalent concentrations. In PR-15 and PR-5 we noted exceptionally high sulfur concentrations (5,608 and 1,638 mg S-SO42− l−1, respectively). Highest sulfur concentration found in the REF, was measured in BOG-D.
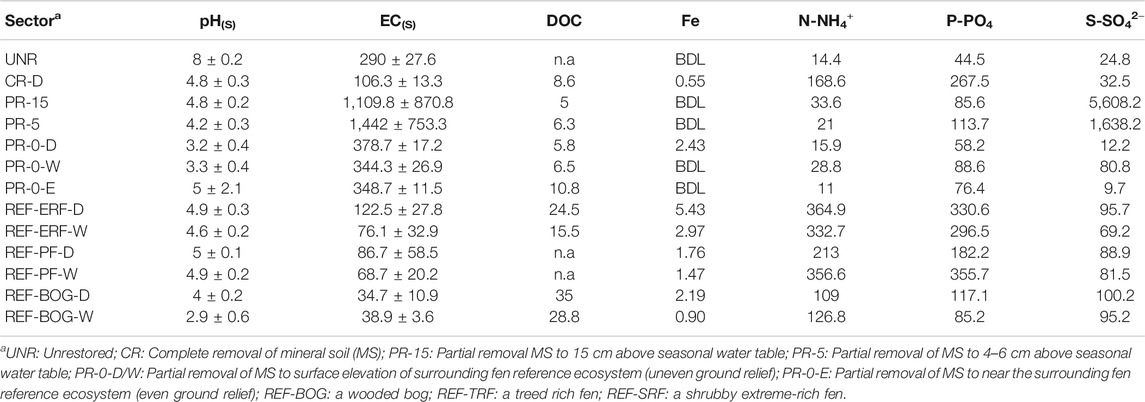
TABLE 3. Mean ± SD soil pH and electric conductivity (EC in µS cm−1), as well as mean dissolved organic carbon (DOC in mg 1–1) and plant available soil nutrient supply rates (in mg 1–1) of ammonium (N-NH4+), iron (Fe), phosphorus (P-PO4) and sulfur (S-SO42−), in all monitoring sectorsa in 2018. BDL stands for values below detection limit (detection limit for Fe 0.12 μg L−1).
According to the principal component analysis (PCA), the first two components explain 48,9% of the variation in biogeochemistry among study plots (Figure 5). Chemical differences are represented in PC1, while PC2 depicts mostly the impact of vegetation and hydrology. The Kaiser-Meyer-Olkin test for sampling adequacy of variables reached 0.57 (Dziuban and Shirkey 1974). Six of the 17 components showed an eigenvalue larger than 1, accounting for more than 81% of the variation. The two variables with the highest loadings are DOC and Fe concentration. A strong clustering according to microforms, especially distinctive between the restored and REF sectors, can be seen (Figure 5). Restored and reference sectors are clearly separated along PC1 with REF sites having higher N-NH4+, and lower S-SO42− and electric conductivity. REF sites were further separated along PC2 depending on differences in vegetation cover, hydrology and pH. Restored sites where fill was removed or scraped to near surface level (PR-0) were closer to the REF sites along PC1 than those sites with thicker fill remaining. CR-W was separated from other sites along PC2 due to deep inundation.
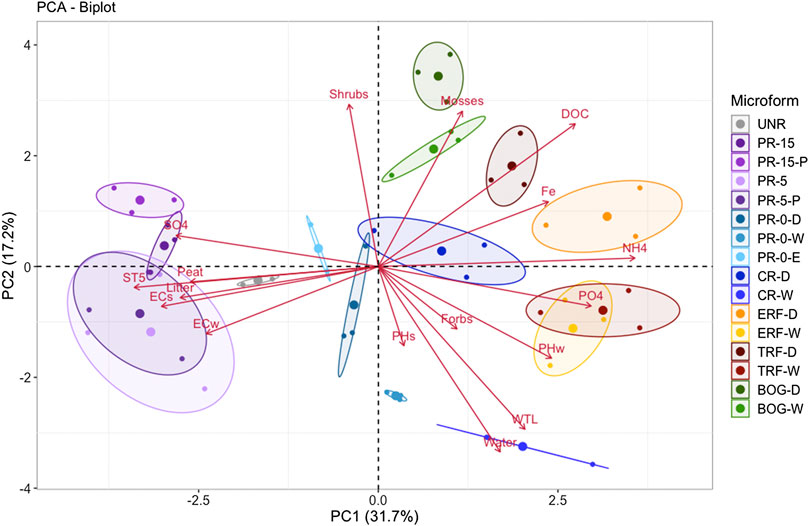
FIGURE 5. Principle component analysis (PCA) of microforms, according to environmental controls of water table level (WTL), soil temperature at 5 cm depth (ST5), soil pH (pHS) and electric conductivity (ECS), water pH (pHW) and electric conductivity (ECW), dissolved organic carbon (DOC), vegetation survey strata (shrubs, forbs, mosses, water, litter, peat), and plant available soil nutrient supply rates (Fe, NH4, PO4, SO4). Strong clustering of monitoring sectors* can be observed.* Restored sectors: UNR = unrestored, PR-15 = partial removal of mineral soil (MS) to 15 cm above seasonal water table, PR-5 = partial removal of MS to 4–6 cm above seasonal water table, PR-0-D/W = partial removal of MS to surface elevation of surrounding fen reference ecosystem (uneven ground relief with microforms dry (D) and wet (W), PR-0-E = partial removal of MS to near the surrounding fen reference ecosystem (even ground relief), CR = complete removal of mineral soil (MS). Reference ecosystem (REF): SRF = shrubby extreme-rich fen; TRF = treed rich fen, BOG = wooded bog.
Vegetation
The total vegetation cover in restored sectors ranges from 37% (PR-5) to 80% (PR-0-E), compared to 68–95% in REF (Table 4). The high cover in PR-0-E is due to bryophytes covering 54%, which represents the highest moss cover in all sectors. The other restored sectors had similar mix of forbs and mosses, while no especially dominant vegetation strata developed, ranging from a lowest 9% forb-cover in PR-5–45% moss-cover in PR-0-D/W. The shrub-cover of 16% in PR-15 was nearly three times higher than in the neighboring sector PR-5 (4%), while shrub species were planted in both sectors equally during the restoration process. Yet PR-5 is characterized by standing surface water of 40% cover, while PR-15 remains dry. On the other hand, an even higher rate of flooding of 93% water cover in PR-0-D/W does not seem to prevent a natural establishment of plants (67% total vegetation cover) in this sector, of which 7% were shrubs. Considering the fen typical plant species cover, natural fens TRF (74%) and SRF (77%) have more than double the cover compared to the restored sectors PR-15 (31%), PR-5 (34%) and PR-0-D/W (31%). Only for PR-0-E, we can report a fen typical plant species cover (64%) comparable to REF.
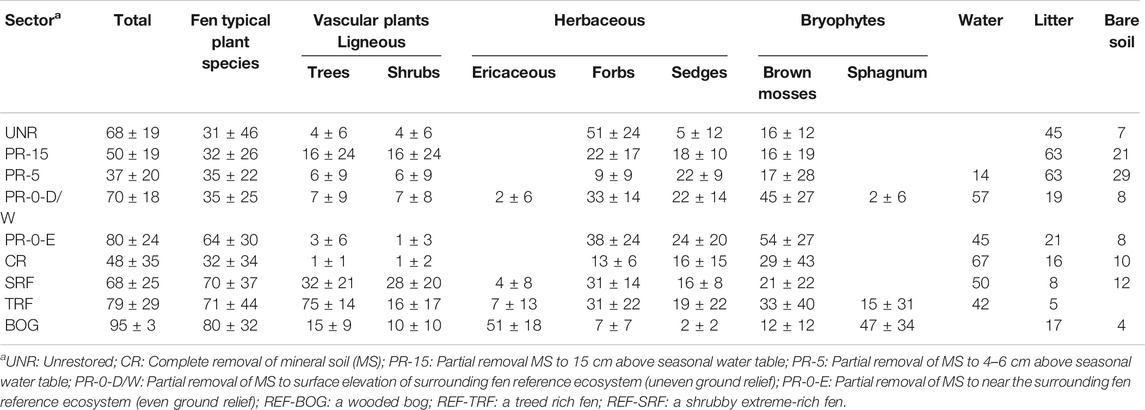
TABLE 4. Mean cover (±SD) in % for plant functional types, water, litter and bare soil (mineral soil or peat), as surveyed in August 2017 and 2018 in all monitoring sectors.
Greenhouse Gas Exchange and Seasonal Carbon Balance
GEP fluxes in 2017 were between –104.4 g CO2 m–2 d–1 at PR-15-P, and –0.1 g CO2 m–2 d–1 in SRF-D (Figure 6A). In 2018 on the other hand, lowest GEP fluxes were measured in SRF-W (–89.6 g CO2 m–2 d–1), while CR-W showed highest fluxes with –0.2 g CO2 m–2 d–1 (Figure 6D). NEE in 2017 ranged from –55.9 g CO2 m–2 d–1 in PR-15-P to 34.6 CO2 m–2 d–1 in ERF-W (Figure 6B), and in 2018 from –56.6 g CO2 m–2 d–1 in ERF-W to 20.6 CO2 m–2 d–1 in CR-W (Figure 6E). ANOVA results reveal a significant effect of soil temperature on GEP and Reco in 2017, which is repeated only for Reco in 2018 (Table 5). Microform on the other hand has a consistent significant effect on all fluxes, whereas water table level only has a significant effect on all fluxes 2018. We notice that the wetter the microform, the higher the Reco fluxes (Figure 6)C+F and CH4 fluxes (Figure 7).
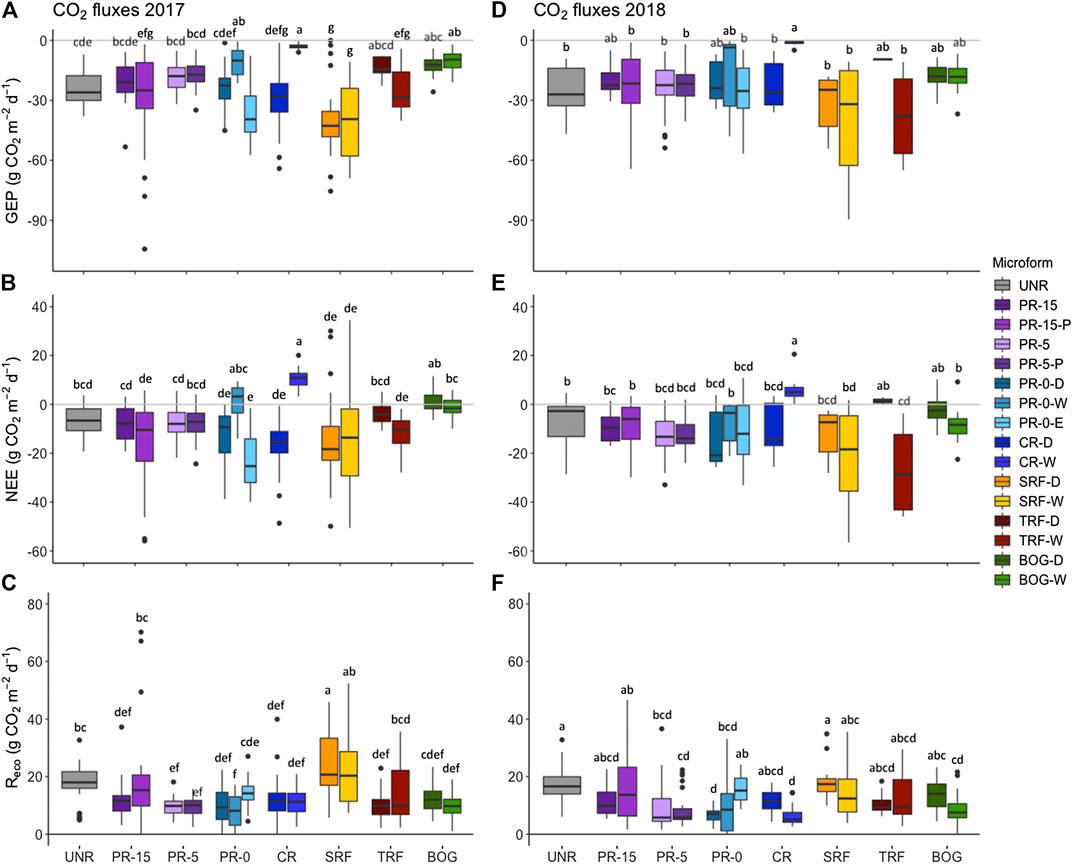
FIGURE 6. Measurements in all monitoring sectors* during the monitoring season of 2017 (A–C) and the season of 2018 (D–F) show the mean gross ecosystem production (GEP in g CO2 m−2 d−1) at a photosynthetically active radiation (PAR) photon flux density ≥1,000 μmol m−2 s−1 (A+D), the mean net ecosystem exchange (NEE in g CO2 m−2 d−1, B+ E), and the mean ecosystem respiration (Reco in g CO2 m−2 d−1, C + F). Groups with the same letters are not significantly different. Statistical results of the ANOVAs for 2017 show GEP: F(17, 359) = 16.43, p < 0.001, adj. R2 = 0.41; NEE: F(17, 376) = 14, p < 0.001, adj. R2 = 0.36; Reco: F(17, 550) = 19.16, p < 0.001, adj. R2 = 0.35. For flux recordings in 2018 the ANOVA results reveal GEP: F(17, 212) = 4.38, p < 0.001, adj. R2 = 0.2; NEE: F(17, 220) = 7.29, p < 0.001, adj. R2 = 0.31; Reco: F(17, 329) = 6.77, p < 0.001, adj. R2 = 0.22.* Restored sectors: UNR = unrestored, PR-15 = partial removal of mineral soil (MS) to 15 cm above seasonal water table, PR-5 = partial removal of MS to 4–6 cm above seasonal water table, PR-0-D/W = partial removal of MS to surface elevation of surrounding fen reference ecosystem (uneven ground relief with microforms dry (D) and wet (W), PR-0-E = partial removal of MS to near the surrounding fen reference ecosystem (even ground relief), CR = complete removal of mineral soil (MS). Reference ecosystem (REF): SRF = shrubby extreme-rich fen; TRF = treed rich fen, BOG = wooded bog.
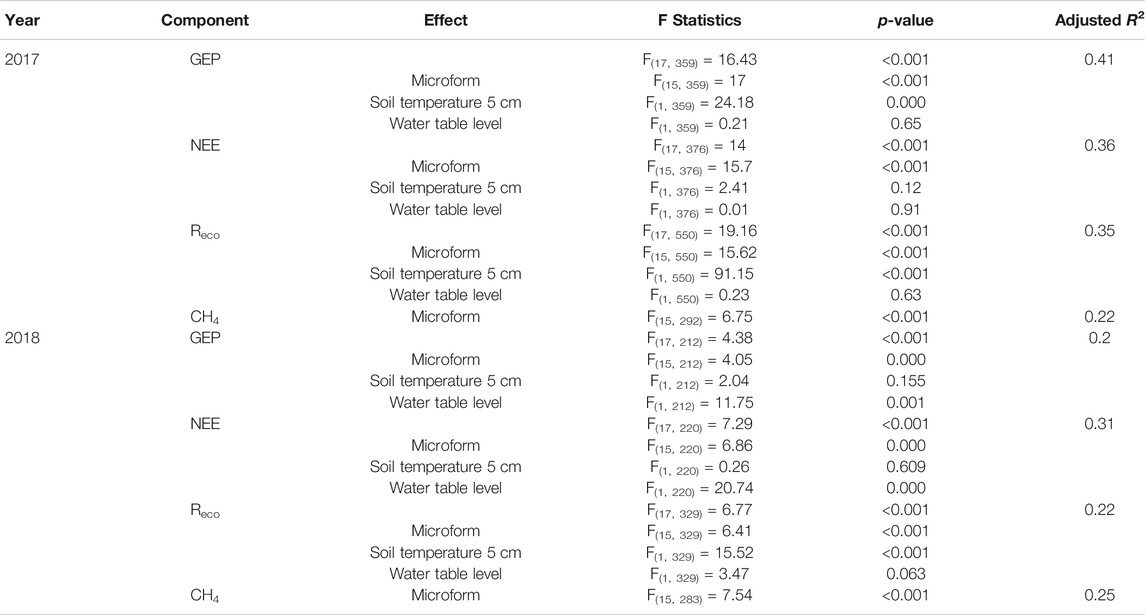
TABLE 5. Statistical results of ANOVAs for fluxes in 2017 and 2018.
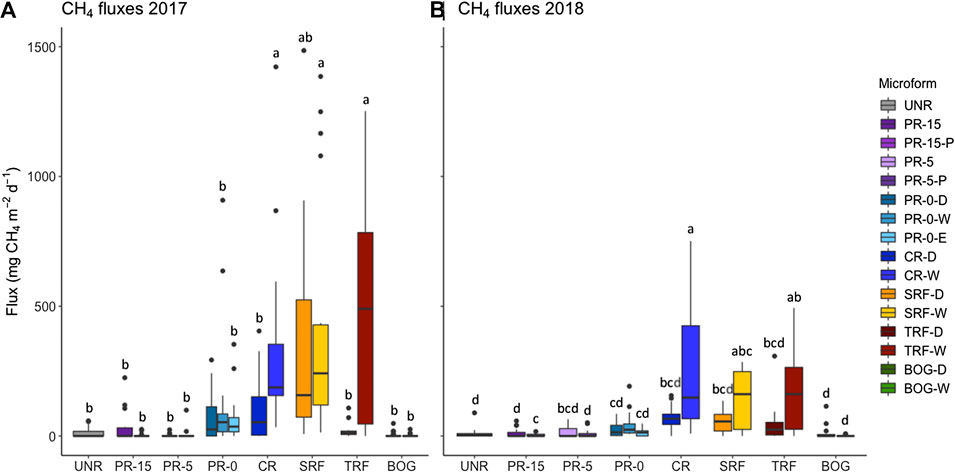
FIGURE 7. Measurements of mean methane fluxes (mg CH4 m−2 d−1) during the 107-days-monitoring seasons in 2017 (A) and in 2018 (B). Groups with the same letters (in separate years) are not significantly different. Microform showed a significant effect on CH4 fluxes in both monitoring years, 2017 (F(15, 292) = 6.75, p < 0.001, adj. R2 = 0.2) and 2018 (F(15, 283) = 7.54, p < 0.001, adj. R2 = 0.3).* Restored sectors: UNR = unrestored, PR-15 = partial removal of mineral soil (MS) to 15 cm above seasonal water table, PR-5 = partial removal of MS to 4–6 cm above seasonal water table, PR-0-D/W = partial removal of MS to surface elevation of surrounding fen reference ecosystem (uneven ground relief with microforms dry (D) and wet (W), PR-0-E = partial removal of MS to near the surrounding fen reference ecosystem (even ground relief), CR = complete removal of mineral soil (MS). Reference ecosystem (REF): SRF = shrubby extreme-rich fen; TRF = treed rich fen, BOG = wooded bog.
Methane emissions were especially high at all submerged and regularly flooded measurement plots that occurred at CR, SRF, TRF-W (Figure 7). The same trend can be noted for extremely wet plots close to the water table level, like PR-0 and PR-5. Microform showed a significant effect on CH4 fluxes (Figure 7). Microforms with highest water table level showed significant effects on CH4 fluxes, where highest averaged methane fluxes of 417 ± 476 mg CH4 m–2 d–1) in TRF-W, 398 ± 711 mg CH4 m–2 d–1 in CR-W, 354 ± 608 mg CH4 m–2 d–1 in SRF-W, and 199 ± 294 mg CH4 m–2 d–1 in SRF-D were observed. The lowest fluxes on the other hand were recorded at the driest sites with 7 ± 20 mg CH4 m–2 d–1 in BOG-D, 1 ± 5 mg CH4 m–2 d–1 in BOG-W, 2 ± 8 mg CH4 m–2 d–1 in PR-15-P, and 7 ± 19 mg CH4 m–2 d–1 in PR-5-P.
In particular CR-W was not comparable with the other restored sectors and behaved in a completely opposite manner, where specifically NEE and GEP in CR-W differed significantly from all other sectors. CH4 fluxes in CR-W and the reference fens showed similarities, whereas all other restored and unrestored sectors were comparable to the reference bog.
Both linear regression analyses to evaluate spatial variation in NEE and CH4 fluxes based on environmental variables, such as vegetation strata, water table level and soil temperature at 5 cm depth were found to be significant (Table 6). While for NEE the significant variables were soil temperature, shrub cover, and forb cover, the significant variables to predict CH4 fluxes were soil temperature at 5 cm, water table level, cover of ericaceous, and cover of sedges. The higher the cover of these plant functional types, the higher the emission rates observed in the respective sectors. Despite wetter and colder weather conditions in 2018, we did not observe a significant effect of climate on CH4 emissions. Compared to the first year, methane fluxes actually decreased by almost 45% in 2018. Furthermore, we cannot confirm any significant relation between NEE or CH4 fluxes and fen typical plant species.
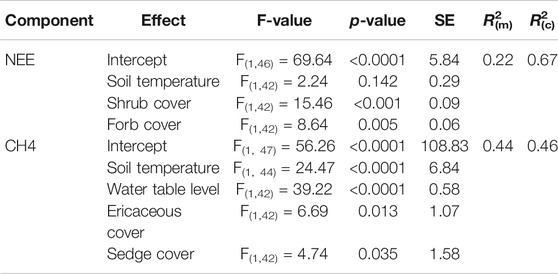
TABLE 6. Statistical results of multiple linear regressions to predict NEE and CH4 fluxes in 2017 and 2018, based on soil temperature (at 5 cm depth), cover of vegetation strata, and water table level. Marginal R2(m) shows the proportion of variance explained by the fixed factors alone, while the conditional R2(c) describes the proportion of variance explained by fixed factors and the random factor “plot”.
Modeled seasonal net ecosystem exchange revealed restored and REF sectors to be greater C sources in 2017 than in 2018 (Table 7). A cumulative two-year total C balance shows that C sinks have established in the restored sectors closest to the water table level, in PR-5, PR-0-D and PR-0-E, and CR-D, ranging from –625 to –67 g C m–2 (Table 8). On the contrary, very wet sectors with inundated conditions, such as PR-0-W, CR-W, and SRF acted as C sources with C emission up to 1,039 g C m–2. Very dry sectors, such as PR-15 and UNR also act as C sources.
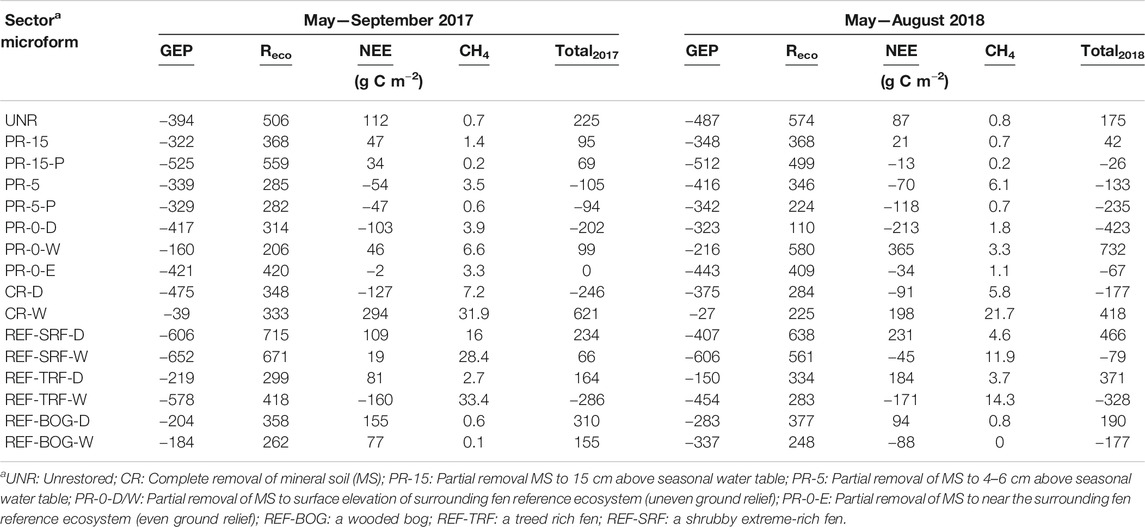
TABLE 7. Cumulative seasonal carbon fluxes of methane (CH4), and net ecosystem exchange (NEE) as a product of gross ecosystem production (GEP) and ecosystem respiration (Reco), for all monitoring sectorsa in 2017 and 2018. Both seasonal calculations were done for a time period of 107 days (17.5.2017–31.8.2017 and 22.5.2018–5.9.2018).
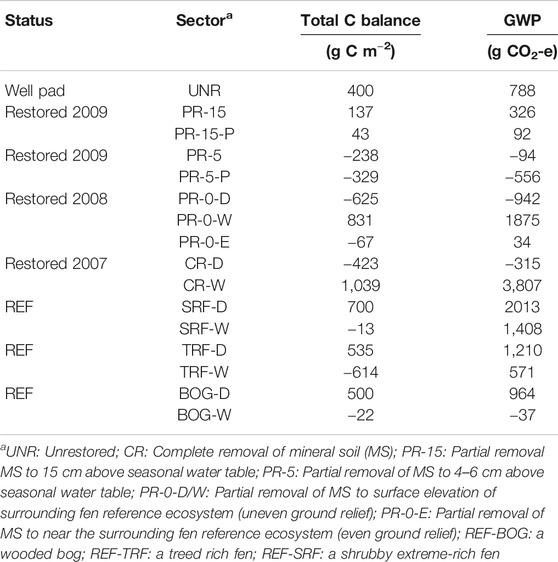
TABLE 8. Cumulative two-year total C balance and global warming potential (GWP) for two 107-days-research seasons in two consecutive years (17.5.2017–31.8.2017 and 22.5.2018–5.9.2018). Calculations of the total C balance include C fluxes of methane (CH4), and net ecosystem exchange (NEE) as a sum of gross ecosystem production (GEP) and ecosystem respiration (Reco).
Discussion
Reestablishing hydrological conditions has become the main goal in peatland restoration (Bonn et al., 2016). However, several studies report an increase of CH4 rates during the first years of rewetting of sites previously drained and used for peat extraction, due to higher methanogenesis activity (Jordan et al., 2016; Nugent 2019). Reported greenhouse gas fluxes of restored peatlands range from –90 to –30 g CO2-C m–2 d–1and 3.7–4.2 g CH4-C m–2 d–1 (Strack, Keith, and Xu 2014; Abdalla et al., 2016; Nugent et al., 2018). On the contrary, rates of NEE and CH4 for undisturbed peatlands in the Mixedwood region of the Canadian boreal forest range from –7.6 to –3.1 g CO2 m−2 d−1 and 3–65.8 mg CH4 m−2 d−1 (Webster et al., 2018).
Since complete removal of introduced oil sands well pad construction materials creates open water areas that are not representative of pre-disturbance conditions, we hypothesize that this technique would not be beneficial for peatland restoration efforts and would likely increase carbon emission rates. We further hypothesized that the emergence and a high abundance of fen typical plant species post-restoration, as well as biogeochemical attributes comparable to reference peatlands, would enable the return of net C uptake in restored sectors at rates similar to nearby reference peatlands.
Fen Typical Vegetation Not Improving C Uptake, Whilst Need for Shrub Species
Biogeochemical conditions, specifically nutrient rates, differed greatly between reference and restored sectors. Reference sectors were characterized by high ammonium, phosphate and iron concentrations and did not compare to any restored sector. The sulfur concentration of only one restored sector, PR-0-W, was comparable to the reference fen sectors, while sulfur concentration of all remaining restored sectors were very different than reference sectors. It is likely that the extremely high sulfur concentrations in PR-15 and PR-5 to sulfur compounds in the well-pad materials leaching through the root zone and being held in place by the clay layer (Himes 1998), used for infilling the well pad, which does not allow an exchange between the mineral clay and the peat layer underneath. This effect might be enhanced through decomposing organic matter at the surface, considering the high cover percentage of plant litter (63%) and the low water table level in both sectors. These processes would also explain the low pH in the same sectors despite the residual mineral soil (pH 3.4 in PR-15, pH 3.6 in PR-5) in the second drier year 2018. Indeed during drier conditions, H+ ions might have been produced and dissolved, acidifying the milieu (DeVries and Breeuwsma 1987).
Soil chemistry post-restoration is comparable to characteristic poor fen (pH <5.5 and EC <100 μS cm–1) and moderate-rich fen (pH 5.5–7 and EC 100–250 μS cm–1) conditions (Alberta Environment and Sustainable Resource Development (ESRD) 2015) that come with the acidic and moist environment. The exceptional high ECSoil values in PR-5 and PR-15 might be due to the remnants of various soil amendments, i.e., the application of commercial peat, field peat, slough hay, or woodchips, applied during the restoration work in 2007 (Vitt et al., 2011). We note, that the chemical conditions depicted for CR depicts conditions found in CR-D and no represent well CR-W, because soil sampling was not possible in deep water.
Despite the chemical differences at the restored well-pads, vegetation re-established among all restored sites. We observed a fen-like vegetation recovery in sectors that were most closely leveled with the water table level of the surrounding ecosystem. This effect was especially true of the moss layer. However, we could not confirm a higher abundance of fen typical plant species the closer the restored sectors are leveled to the water table level. We had expected to observe a gradient of low abundance of fen typical plant species in the sectors with a highest distance to the water table level, PR-15, to a high abundance of fen typical species in the sectors with the shortest distance and most even level to the water table level, PR-0-E. Indeed, the highest cover of fen typical species in restored sectors (64%) was observed in PR-0-E, but among the remaining sectors with partially and completely removed mineral soil, and even the unrestored sector, there was no difference in the fen typical species cover. Water table level is an important driver of vegetation re-establishment on residual mineral soil (Vitt et al., 2011; Howie et al., 2016), but it does not appear to be a crucial factor for fen typical plant species to distribute. While Halsey et al. (1998) consider the mineral soil’s larger grain size (i.e., glaciofluvial and eolian deposits) with high hydraulic conductivity to be an important driver for peatland development, our findings indicate that achieving an elevation similar to the surrounding peatland is likely sufficient for the establishment of typical fen plant communities.
Furthermore, we cannot confirm that the cover of fen typical plants improved the C sink function considerably. In fact, we found no significant relationship between the cover of fen typical plant and either CO2 or CH4 exchange. While the species composition in PR-0-E was most comparable to a reference fen ecosystem and the C sink function seems to have returned to this sector, CH4 fluxes were not drastically decreased. This might be due to the high cover of sedges (24%), such as Carex sp. and Typha latifolia, with their large aerenchymatic systems and abundant root biomass that are known to promote CO2 emissions and are more likely to enhance C emissions to the atmosphere rather than C uptake (Bellisario et al., 1999; Strack et al., 2016; Rupp et al., 2019). These species were also well-established in the sectors with partially removed mineral soil, PR-15, PR-5 and PR-0. Overall, it appeared that the presence of plant cover in general and the position of the water table level were the drivers of the net carbon balance observed in each restoration treatment.
On the contrary, other studies show that species identity, and especially the presence of Carex aquatilis was important for C sequestration at restored fens, specifically in combination with moss species (Hassanpour Fard et al., 2019; Murray et al., 2019). The floating moss carpet CR-D displays very well the positive effect of this combination of fen typical vegetation on C accumulation and greenhouse gas fluxes, where the total carbon emission rates of the emerging floating moss carpet in CR-D (>7.2 g C m–2 d–1) are almost 85% lower than in the open water sector CR-W. The development of the floating moss carpet in this sector was favored by proximity to the adjacent peatland with moss able to grow out from the edge of the open water area, but this result cannot be applied in case of the removal of an entire well pad of 1 ha where much of the area would be far from the edge. In that case, the development of vast shallow open water will cause wave development and too rough water movements for a moss carpet to establish (Blievernicht et al., 2007; Gaudig et al., 2013). At the same time the vegetation that developed in CR-D accommodated the second highest cover rate of fen typical plant species (7%), including species such as Carex aquatilis, C. diandra, Drepanocladus aduncus, D. polygamus, and Menyanthes trifoliata.
The highest C sink was found in PR-0-D, a sector defined by a vegetation community including shrub and sedge species. Fen typical plant species in this sector included Andromeda polifolia, Betula pumila, C. limosa, C. utriculata, Comarum palustre, Ptychostomum pseudotriquetrum. Opposed to herbaceous species, shrub species store C in their woody structures and in combination with their smaller root structure, emit lower rates of CO2 to the atmosphere (Rupp et al., 2019). Furthermore, because of their overwintering photosynthesizing leaves, shrubby and moss species have the advantage to begin C uptake early in the growing season before herbaceous plants species (Arndal et al., 2009). The regression analysis also indicated that shrubby plant species had an effect on NEE and CH4 fluxes. In sectors PR-0-D, CR-D, and PR-5-P, we observed the same trend of highest C uptake, compared to the other restored sectors that act as a source of C. Especially in these three sectors similar plant species composition had established, with high cover of C. aquatilis in combination with various shrub (PR-0-D) and moss (CR-D) species. However, we note that both REF fens TRF and SRF, despite a high cover of shrub species (31% and 32% shrub cover, respectively) in combination with high water table level (32% and 37% water cover respectively), were carbon sources. We note, however, that the tall overstory trees of both wooded reference sectors TRF and BOG were not included in our C flux measurements, which would contribute additional C uptake to the system. Furthermore, tree root respiration rates in TRF and BOG were not considered in our measurements and likely contributed to the Reco measured indicating that actual NEE needs to be adjusted according to previous research (Munir et al., 2017; Munir et al., 2015). report on tree root respiration rates in an ombrotrophic bog in Alberta ranging from 2 ± 0 g CO2-C m–2 in ambient hollows to 70 ± 6 g CO2-C m–2 in warmed hummocks. Several studies describe a strong relation between tree productivity and hydrology, where belowground production and root respiration rates were enhanced in drained conditions (Hanson et al., 2000; Hermle et al., 2010; Munir et al., 2017).
Despite the apparently importance of shrubs, the introduction of plant species in some sectors, even including Salix shrub species, does not seem to have specifically improved the C sequestration at the respective sectors. Considering the high percentage of bare soil in both PR-5 (22%) and PR-15 (16%), as compared to a maximum of 3% bare soil in PR-D/W, the re-vegetation effort does not seem to be more successful than natural revegetation (Prach and Hobbs 2008), which is favorable if landscape factors, such as water table and a nearby abundant species pool, are considered during the restoration process (Konvalinková and Prach 2014). This effect can be seen in the mean cover of fen typical species, such as Betula pumila, C. aquatilis, C. diandra, Comarum palustre, Campylium stellatum, Sphagnum warnstorfii, Tomentypnum nitens, being almost twice as high in PR-0 (43%) where no plants were introduced compared to PR-5 (24%) and PR-15 (22%) where planting occurred. The combination of shrub species and a stable water table at the soil surface, as can be found in PR-0-D, seems to provide best results in returning a C sink function to restored sectors, as well as establishing biogeochemical conditions comparable with REF fen sectors. This effect seems to have greater impact on C exchange, rather than the variable climatic conditions, since despite wetter and colder conditions during the second year, GEP rates were higher than in the previous year with lower precipitation rates and warmer temperatures (Strack et al., 2016).
Enhanced CH4 Emissions After Complete Well Pad Removal
Our third hypothesis that a complete well pad removal would enhance CH4 emissions was confirmed through highest emission rates observed in the permanent open water sector CR-W (21.7–31.9 g C m–2 d–1). Sectors PR-0-W, TRF-W and SRF, with water table level above ground surface, show comparable emissions rates of 11.9–33.4 g C m–2 d–1. While such high CH4 emission rates are normal in undisturbed fens with high water table (Waddington and Roulet 2000; Strack et al., 2006; Bienida et al., 2020), adjusted management practices are available to avoid unnecessary high emission rates in restored wetlands (Strack, Keith, and Xu 2014), just as it has been done in the drier managed microforms PR-0 (<3.9 g C m–2 d–1), PR-5 (<6.1 g C m–2 d–1), PR-15 (<1.4 g C m–2 d–1), which low emission rates endorse this argument. Considering the enormous global warming potential (GWP; Myhre et al., 2013) of the wet sectors of up to 3,807 g CO2-e in CR-W (Table 8), the drier managed sites ranging between –556 g CO2-e and 326 g CO2-e prove to be a powerful argument to pay attention to proper site management and hydrological adjustments. Furthermore, Günther et al. (2020) show that rewetting of drained peatlands should not be feared or avoided, because the positive effects of rewetting for restoration purposes outweighs the rather short-lived radiative forcing of CH4, as opposed to the long-lived impacts of CO2 emissions, when sites remain too dry, and the long-term benefits of recreating net carbon accumulating ecosystem through restoration.
Conclusion
After eight to eleven years following restoration, the rates of C exchange in the restored sectors were comparable with the rates of long-time established reference wetlands, although the soil and water chemistry still remained quite different due to the residual mineral soil layer. Regarding our results, we conclude that the C uptake in restored mineral wetlands is most similar to reference peatlands, when vegetation has established and particularly when regional wetland typical shrub species have colonized. The crucial base for vegetation communities to emerge is the proper hydrological management of the site, where the surface elevation should be evenly adjusted to the surrounding ecosystem and as close to the landscape surrounding water table level as possible. It appears that in order to have appropriate chemical fen conditions establish post-restoration, available plant organic matter needs to remain in anaerobic conditions and therefore the water table level is crucial to remain near the surface. However, the development of deep open water sectors is to be avoided at all times. As was observed in flooded conditions in PR-0-W where the water table is >30 cm above surface, and in the shallow open water sector CR-W, with a water table >77 cm above surface, hydrological conditions appeared to be less beneficial to fen plant establishment while driving carbon emissions, resulting in high rates of Reco and CH4 emissions. It is therefore crucial during future restoration work, to level any residual layers of remaining mineral soil with the adjacent peatland ecosystem, in order to obtain a seamless connection and create optimal hydrological conditions in the restored area. Re-introduction of (shrub) species can be neglected, if appropriate hydrological conditions are achieved and a source of peatland species is available in adjacent ecosystems.
The assessment of the biogeochemical conditions in these sectors should continue on a regular, long-term basis in order to monitor the effect of the developing fen vegetation and associated peat accumulation on the soil chemistry. Long-term monitoring is important to maintain in the context of peatland development, as these ecosystems may take several decades to centuries to establish. We again stress the importance of individual management adjustment of in-situ oil mining well pads.
Data Availability Statement
The raw data supporting the conclusions of this article will be made available by the authors, without undue reservation.
Author Contributions
MS and LR developed the experimental sampling design. ML performed the practical field research and prepared this manuscript. Statistical analysis were done by ML with support from MS. Supervision and critical feedback were provided by MS and LR at all times.
Funding
This research was funded by the Natural Sciences and Engineering Research Council of Canada Industrial Research Chair for Colleges Grant (CRDPJ 501619- 16) to LR, MS and B. Xu in collaboration with Imperial Oil Resources Ltd.
Conflict of Interest
Part of this research funding is from a NSERC‐industrial partnership program, with Esso Imperial Ltd who leased and operated the research sites. The company provided PPE, access and safety guidelines and measures on site, but did not have any contribution in the decision‐making for experimental set‐up and measurements, unless there were safety concerns interfering with the researcher's plan of action. Further, the company did not have any contribution in the preparation of the manuscript or the opinions and statements made in it.
Acknowledgments
We thank Bin Xu and his team at the NAIT Boreal Research Center in Peace River, Alberta, for their great technical support during field work, and especially Melanie Bird, whose smiles, motivation and organization were greatly appreciated. Special thanks to Brittany Whiteman and Aaron Gomes for keeping up the spirits and fun during long hours in the field and on the road, as well as to my supervisors and colleagues for their constant support, critical thinking and motivation. Many thanks to the two reviewers for much appreciated feedback on a previous version of the manuscript.
Supplementary Material
The Supplementary Material for this article can be found online at: https://www.frontiersin.org/articles/10.3389/feart.2020.557943/full#supplementary-material
References
Abdalla, M., Hastings, A., Truu, J., Espenberg, M., Mander, Ü., and Smith, P. (2016). “Emissions of methane from northern peatlands: a review of management impacts and implications for future management options,” in Ecology and evolution. Hoboken, NY: John Wiley and Sons.
Ahmad, S., Liu, H., Günther, A., Couwenberg, J., and Lennartz, B. (2020). Long-term rewetting of degraded peatlands restores hydrological buffer function. Sci. Total Environ. 749 (December), 141571. doi:10.1016/j.scitotenv.2020.141571
Alberta Environment and Sustainable Resource Development (ESRD) (2015). Alberta wetland classification system. Edmonton, AB: Water Policy Branch, Policy and Planning Division.
Alberta Queen’s Printer (1994). Environmental protection and enhancement act. Edmonton, AB: Alberta Queen’s Printer.
Arndal, M. F., Illeris, L., Michelsen, A., Albert, K., Tamstorf, M., and Hansen, B. U. (2009). Seasonal variation in gross ecosystem production, plant biomass, and carbon and nitrogen pools in five high arctic vegetation types. Arctic Antarct. Alpine Res. 41 (2), 164–173. doi:10.1657/1938-4246-41.2.164
Baird, A. J., Green, S. M., Brown, E., and Dooling, G. P. (2019). Modelling time-integrated fluxes of CO2 and CH4 in peatlands: a review. Mires Peat 24, 1–15. doi:10.19189/MaP.2019.DW.395
Bartoń, K. (2020). Version 1.43.17. MuMIn: multi-model inference. Available at: https://cran.r-project.org/package=MuMIn (Accessed April 15, 2020).
Beckingham, J. D., and Archibald, J. H. (1996). Field guide to ecosites of northern Alberta. Edmonton, AB: Northern Forestry Centre.
Bellisario, L. M., Bubier, J. L., Moore, T. R., and Chanton, J. P. (1999). Controls on CH4 emissions from a northern peatland. Global Biogeochem. Cycles 13 (1), 81–91. doi:10.1029/1998gb900021
Bienida, A., Daté, V., Andersen, R., Nwaishi, F., Price, J., Mahmood, M. S., et al. (2020). Methane emissions from fens in Alberta's boreal region: reference data for functional evaluation of restoration outcomes. Wetl. Ecol. Manag. 28 (4), 559–575. doi:10.1007/s11273-020-09715-2
Blievernicht, A., Feuerhahn, B., Grüneberg, H., Zander, M., and Ulrichs, C. (2007). “Torfmooskul- tivierung auf schwimmfähigen vegetationsträgern zur entwicklung eines nachhaltigen torfsubstitutes als substratrohstoff im erwerbsgartenbau.” in 45 Gartenbauwissenschaftliche Tagung. Vol. 26, Bundesverband der Hochschul-Absolventen/Ingenieure Gartenbau und Landschaftsarchitektur.
Bonn, A., Tim, A., Evans, M., Joosten, H., and Stoneman, R. (2016). “Peatland restoration and ecosystem services: an introduction,” in Peatland Restoration and ecosystem services: science, Policy and prcatice. Editors A. Bonne, T. Allott, M. Evans, H. Joosten, , and R. Stoneman, (Cambridge: British Ecological Society), 1–16.
Bubier, J., Crill, P., Mosedale, A., Steve, F., and Linder, E. (2003). Peatland responses to varying interannual moisture conditions as measured by automatic CO2 chambers. Global Biogeochem. Cycles 17 (2). doi:10.1029/2002gb001946
Caners, R. T., and Lieffers, V. J. (2014). Divergent pathways of successional recovery for in situ oil sands exploration drilling pads on wooded moderate-rich fens in Alberta, Canada. Restor. Ecol. 22 (5), 657–667. doi:10.1111/rec.12123
Cooper, D. J., Kaczynski, K. M., Sueltenfuss, J., Gaucherand, S., and Hazen, C. (2017). Mountain wetland restoration: the role of hydrologic regime and plant introductions after 15 years in the Colorado Rocky Mountains, U.S.A. Ecol. Eng. 101 (April), 46–59. doi:10.1016/j.ecoleng.2017.01.017
De Vries, W., and Breeuwsma, A. (1987). The relation between soil acidification and element cycling. Water Air Soil Pollut. 35 (3–4), 293–310. doi:10.1007/bf00290937
DeMendiburu, F. (2019). Version 1.3-3. Agricolae: statistical procedures for agricultural research. Available at: https://cran.r-project.org/package=agricolae (Accessed June 7, 2020).
Dinno, A. (2017). Version 1.1.5. Conover.test: conover-iman test of multiple comparisons using rank sums. Available at: https://cran.r-project.org/web/packages/conover.test/conover.test.pdf (Accessed October 30, 2017).
Dziuban, C. D., and Shirkey, E. C. (1974). When Is a Correlation Matrix Appropriate for Factor Analysis? Some Decision Rules. Psychol. Bull. 81 (6), 358–361. doi:10.1037/h0036316
Environment and Climate Change Canada (2019). Historical data—climate—environment and climate change Canada. Available at: https://climate.weather.gc.ca/historical_data/search_historic_data_e.html (Accessed November 2, 2019).
Environment and Parks (2017). Reclamation criteria for wellsites and associated facilities for peatlands. Edmonton, AB: Environment and Parks, 147.
Evans, C. D., Renou-Wilson, F., and Strack, M. (2016). The Role of Waterborne Carbon in the Greenhouse Gas Balance of Drained and Re-Wetted Peatlands. Aquat. Sci. 78 (3), 573–590. doi:10.1007/s00027-015-0447-y
Gaudig, G., Fengler, F., Ma, K., Prager, A., Schulz, J., Wichmann, S., et al. (2013). Sphagnum Farming in Germany—a Review of Progress. Sphagnum Growing 13 (08), 1–11.
Gauthier, M.-E., Rochefort, L., Nadeau, L., Hugron, S., and Xu, B. (2018). Testing the Moss Layer Transfer Technique on Mineral Well Pads Constructed in Peatlands. Wetl. Ecol. Manag. 26 (4), 475–487. doi:10.1007/s11273-017-9532-4
Gauthier, M.-E. (2014). Restoring peatland plant communities on mineral well pads. Québec, Canada: Université Laval.
Government of Alberta (2020). Oil sands facts and statistics. Available at: https://www.alberta.ca/oil-sands-facts-and-statistics.aspx (Accessed February 2020).
Government of Canada (2019). Canadian climate normals 1981–2010 station data—climate—environment and climate change Canada. Available at: https://climate.weather.gc.ca/climate_normals/results_1981_2010_e.html?stnID=2770&autofwd=1 (Accessed November 2019).
Graf, M. D. (2009). Literature review on the restoration of Alberta’s boreal wetlands affected by oil, gas and in situ oil sands development. Available at: http://www.biology.ualberta.ca/faculty/stan_boutin/ilm/uploads/footprint/Graf.20Wetland_Restoration_Review.20FINAL-Small.20File.pdf (Accessed July 2009).
Green, S. M., and Baird, A. J. (2012). A mesocosm study of the role of the sedge Eriophorum angustifolium in the efflux of methane-including that due to episodic ebullition-from peatlands. Plant Soil 351 (1–2), 207–218. doi:10.1007/s11104-011-0945-1
Günther, A., Barthelmes, A., Huth, V., Joosten, H., Jurasinski, G., Koebsch, F., et al. (2020). Prompt Rewetting of Drained Peatlands Reduces Climate Warming despite Methane Emissions. Nat. Commun. 11 (1), 1644. doi:10.1038/s41467-020-15499-z
Halsey, L. A., Vitt, D. H., and Bauer, I. E. (1998). Peatland Initiation during the Holocene in Continental Western Canada. Climatic Change 40, 315–342. doi:10.1023/a:1005425124749
Hanson, P. J., Edwards, N. T., Garten, C. T., and Andrews, J. A. (2000). Separating Root and Soil Microbial Contributions to Soil Respiration: A Review of Methods and Observations. Biogeochemistry 48, 115–146. doi:10.1023/a:1006244819642
Hassanpour Fard, G., Elena, F., Bérubé, V., Rochefort, L., and Maria, S. (2019). Key species superpose the effect of species richness and species interaction on carbon fluxes in a restored minerotrophic peatland. Wetlands 40, 333–349. doi:10.1007/s13157-019-01176-5
Hemes, K. S., Chamberlain, S. D., Eichelmann, E., Knox, S. H., and Baldocchi, D. D. (2018). A biogeochemical compromise: the high methane cost of sequestering carbon in restored wetlands. Geophys. Res. Lett. 45 (12), 6081–6091. doi:10.1029/2018gl077747
Hermle, S., Lavigne, M. B., Bernier, P. Y., Bergeron, O., and Paré, D. (2010). Component Respiration, Ecosystem Respiration and Net Primary Production of a Mature Black Spruce Forest in Northern Quebec. Tree Physiol. 30 (4), 527–540. doi:10.1093/treephys/tpq002
Himes, F. L. (1998). “Nitrogen, Sulfur, and Phosphorus and the Sequestering of Carbon,” in Soil processes and the carbon cycle. Editors R. Lal, J. M. Kimble, R. F. Follett, and B. A. Stewart, (Boca Raton: CRC Press), 315–320.
Howie, S. A., van Meerveld, H. J., and Hebda, R. J. (2016). Regional patterns and controlling factors in plant species composition and diversity in Canadian lowland coastal bogs and laggs. Mires Peat 18, 1–23. doi:10.19189/MaP.2016.OMB.242
Imperial Oil Resources. (2007). Cold Lake operations wetlands reclamation trial program. Site specific reclamation plamn for Mahihkan H38 field pad (15-3-66-4W4M). Edmonton, Alberta: Alberta Environment
IUCN (International Union for Conservation of Nature 2017). Peatlands and climate change. Issues brief. Available at: https://www.iucn.org/sites/dev/files/peatlands_and_climate_change_issues_brief_final.pdf
Jordan, S., Stromgren, M., Fiedler, J., Lundin, L., Lode, E., and Nilsson, T. (2016). Ecosystem respiration, methane and nitrous oxide fluxes from ecotopes in a rewetted extracted peatland in Sweden. Mires Peat 17 (SI), 1–23. doi:10.19189/MaP.2016.OMB.224
Konvalinková, P., and Prach, K. (2014). Environmental factors determining spontaneous recovery of industrially mined peat bogs: a multi-site analysis. Ecol. Eng. 69, 38–45. doi:10.1016/j.ecoleng.2014.03.090
Koropchak, S., Vitt, D. H., Bloise, R., and Kelman Wieder, R. (2012). “Fundamental paradigms, foundation species selection, and early plant responses to peatland initiation on mineral soils,” in Restoration and reclamation of boreal ecosystems: attaining sustainable development. Editors D. H. Vitt, and J. Bhatti, (Cambridge University Press), 76–100.
Large, A. R. G., Mayes, W. M., Newson, M. D., and Parkin, G. (2007). Using long‐term monitoring of fen hydrology and vegetation to underpin wetland restoration strategies. Appl. Veg. Sci. 10 (3), 417–428. doi:10.1111/j.1654-109x.2007.tb00441.x
Lazcano, C., Robinson, C., Hassanpour, G., and Strack, M. (2018). Short-term effects of fen peatland restoration through the moss layer transfer technique on the soil CO2 and CH4 Efflux. Ecol. Eng. 125 (December), 149–158. doi:10.1016/j.ecoleng.2018.10.018
Lee, P., and Cheng, R. (2009). Bitumen and biocarbon land use conversions and loss of biological carbon due to bitumen operations in the boreal forests of Alberta, Canada. Edmonton, AB: Global Forest Watch Canada.
Leifeld, J., and Menichetti, L. (2018). The Underappreciated Potential of Peatlands in Global Climate Change Mitigation Strategies. Nat. Commun. 9 (1), 1071. doi:10.1038/s41467-018-03406-6
Lenth, R. (2019). Emmeans: estimated marginal means, aka least-squares means. Available at: https://cran.r-project.org/web/packages/emmeans/emmeans.pdf (Accessed October 25, 2020).
Lloyd, J., and Taylor, J. A. (1994). On the temperature dependence of soil respiration. Funct. Ecol. 8 (3), 315–323. doi:10.2307/2389824
Munir, T., Khadka, B., Xu, B., and Strack, M. (2017). Partitioning forest‐floor respiration into source based emissions in a boreal forested bog: responses to experimental drought. Forests 8 (3), 75. doi:10.3390/f8030075
Munir, T. M., Perkins, M., Kaing, E., and Strack, M. (2015). Carbon dioxide flux and net primary production of a boreal treed bog: responses to warming and water-table-lowering simulations of climate change. Biogeosciences 12 (4), 1091–1111. doi:10.5194/bg-12-1091-2015
Murray, K. R., Yi, M., Brummell, M. E., and Strack, M. (2019). The influence of Carex Aquatilis and Juncus Balticus on methane dynamics: a comparison with water sourced from a natural and a constructed fen. Ecol. Eng. 139 (August), 105585. doi:10.1016/j.ecoleng.2019.105585
Myhre, G., Drew, S., François-Marie, B., Collins, W., Jan, F., Huang, J., Koch, D., et al. (2013). “Anthropogenic and natural radiative forcing,” in climate change 2013: the physical science basis. Contribution of working group I to the fifth assessment Report of the intergovernmental Panel on climate change. Editors T. F. Stockner, D. Qin, G.-K. Plattner, M. Tignor, S. K. Allen, J. Boschung, et al. (Cambridge, UK: Cambridge University Press), 82.
Natural Regions Committee (2006). T/852. Natural regions and subregions of Alberta. Editors D. J. Downing, and W. W. Pettapiece, (Edmonton, AB: Government of Alberta).
Natural Resources Canada (2015). Alberta’s shale and tight resources. Canada: Natural Resources Canada. Available at: https://www.nrcan.gc.ca/our-natural-resources/energy-sources-distribution/clean-fossil-fuels/natural-gas/shale-and-tight-resources-canada/albertas-shale-and-tight-resources/17679 (Accessed July 15, 2015).
Nichols, J. E., and Peteet, D. M. (2019). Rapid expansion of Northern Peatlands and doubled estimate of carbon storage. Nat. Geosci. 12 (11), 917–921. doi:10.1038/s41561-019-0454-z
Nugent, K. A., Strachan, I. B., Strack, M., Roulet, N. T., and Rochefort, L. (2018). Multi-Year Net Ecosystem Carbon Balance of a Restored Peatland Reveals a Return to Carbon Sink. Global Change Biol. 24 (12), 5751–5768. doi:10.1111/gcb.14449
Nugent, Kelly. A. (2019). Carbon cycling at a post-extraction restored peatland: small-scale processes to global climate impacts. Quebec, Canada: McGill University.
Nwaishi, F., Petrone, R. M., Macrae, M. L., Price, J. S., Strack, M., and Andersen, R. (2016). Preliminary Assessment of Greenhouse Gas Emissions from a Constructed Fen on Post-Mining Landscape in the Athabasca Oil Sands Region, Alberta, Canada. Ecol. Eng. 95 (October), 119–128. doi:10.1016/j.ecoleng.2016.06.061
Pinheiro, J., Douglas, B., DebRoy, S., and Sarkar, D., and R Core Team (2019). Nlme: Linear and Nonlinear Mixed Effects Models. Available at: https://cran.r-project.org/package=nlme (Accessed October 24, 2019).
Prach, K., and Hobbs, R. J. (2008). Spontaneous Succession versus Technical Reclamation in the Restoration of Disturbed Sites. Restor. Ecol. 16 (3), 363–366. doi:10.1111/j.1526-100x.2008.00412.x
Price, J. S., Heathwaite, A. L., and Baird, A. J. (2003). Hydrological Processes in Abandoned and Restored Peatlands: An Overview of Management Approaches. Wetl. Ecol. Manag. 11, 65–83. doi:10.1023/a:1022046409485
Price, J. S., McLaren, R. G., and Rudolph, D. L. (2010). Landscape Restoration after Oil Sands Mining: Conceptual Design and Hydrological Modelling for Fen Reconstruction. Int. J. Min. Reclamat. Environ. 24 (2), 109–123. doi:10.1080/17480930902955724
Quinty, F., and Rochefort, L. (2003). Peatland restoration guide. 2nd Edn. Québec, Canada: Canadian Sphagnum Peat Moss Association, New Brunswick Department of Natural Resources and Energy.
R Core Team (2019). R: a language and environment for statistical computing. Vienna, Austria: R Foundation for Statistical Computing.
Rahman, A., Osko, T. J., Foote, L., and Bork, E. W. (2016). Comparison of site preparation and revegetation strategies within a sphagnum-dominated Peatland following removal of an oil well pad. Ecol. Restor. 34 (3), 225–235. doi:10.3368/er.34.3.225
Renou-Wilson, F., Barry, C., Müller, C., and Wilson, D. (2014). The impacts of drainage, nutrient status and management practice on the full carbon balance of grasslands on organic soils in a maritime temperate zone. Biogeosciences 11 (16), 4361–4379. doi:10.5194/bg-11-4361-2014
R. K. Wieder, and Vitt, (Editors) (2006). “Boreal Peatland ecosystems: with 73 figures, 6 in color, and 22 tables,” in Ecological studies. Berlin: Springer, 188.
Rochefort, M., Waddington, J. M., Rochefort, L., and Tuittila, E.-S. (2006). Response of vegetation and net ecosystem carbon dioxide exchange at different Peatland microforms following water table drawdown. J. Geophys. Res. Biogeosci. 111 (G2), 10. doi:10.1029/2005jg000145
Rupp, D., Kane, E. S., Dieleman, C., Keller, J. K., and Turetsky, M. (2019). Plant functional group effects on peat carbon cycling in a boreal rich fen. Biogeochemistry 144 (3), 305–327. doi:10.1007/s10533-019-00590-5
Saraswati, S., Petrone, R. M., Rahman, M. M., McDermid, G. J., Xu, B., and Strack, M. (2020). Hydrological effects of resource-access road crossings on boreal forested peatlands. J. Hydrol. 584 (May), 124748. doi:10.1016/j.jhydrol.2020.124748
Sobze, J.-M., Schoonmaker, A., and Rochefort, L. (2012). Wellsite pad removal and inversion: a peatland restoration pilot project. Canadian Reclamation 12 (1), 10–13.
Strack, M., Cagampan, J., Fard, G. H., Keith, A. M., Nugent, K. A., Rankin, T., Robinson, C., Strachan, I. B., et al. (2016). Controls on plot-scale growing season CO2 and CH4 fluxes in restored peatlands: do they differ from unrestored and natural sites? Mires Peat 17, 1–18. doi:10.19189/MaP.2015.OMB.216
Strack, M., Keith, A. M., and Xu, B. (2014). Growing season carbon dioxide and methane exchange at a restored peatland on the western boreal plain. Ecol. Eng. 64, 231–239. doi:10.1016/j.ecoleng.2013.12.013
Strack, M., Mwakanyamale, K., Fard, G. H., Bird, M., Bérubé, V., and Rochefort, L. (2017). Effect of plant functional type on methane dynamics in a restored minerotrophic peatland. Plant Soil 410 (1–2), 231–246. doi:10.1007/s11104-016-2999-6
Sundh, I., Mikkelä, C., Nilsson, M., and Svensson, B. H. (1995). Potential aerobic methane oxidation in a sphagnum-dominated peatland—controlling factors and relation to methane emission. Soil Bid. Biochem. 27, 829–837. doi:10.1016/0038-0717(94)00222-m
UNFCCC, UN Framwork Convention on Climate Change (2009). Kyoto protocol reference manual on accounting of emissions and assigned amount. Work. Pap. Available at: https://unfccc.int/resource/docs/publications/08_unfccc_kp_ref_manual.pdf (Accessed January 2020).
Vitt, Dale. H., Hayes, Ciara., and Kelman, Wieder. (2012). Reclamation of Decomissioned Oil and Gas Pads Constructed in Boreal Peatlands. Canadian Reclamation 2 (12), 12–18.
Vitt, D. H., Wieder, R. K., Xu, B., Kaskie, M., and Koropchak, S. (2011). Peatland establishment on mineral soils: effects of water level, amendments, and species after two growing seasons. Ecol. Eng. 37 (2), 354–363. doi:10.1016/j.ecoleng.2010.11.029
Waddington, J. M., and Roulet, N. T. (2000). Carbon balance of a boreal patterned peatland. Global Change Biol. 6 (1), 87–97. doi:10.1046/j.1365-2486.2000.00283.x
Webster, K. L., Bhatti, J. S., Thompson, D. K., Nelson, S. A., Shaw, C. H., Bona, K. A., et al. (2018). Spatially-integrated estimates of net ecosystem exchange and methane fluxes from Canadian Peatlands. Carbon Bal. Manag. 13 (1), 16. doi:10.1186/s13021-018-0105-5
Keywords: fen restoration, oil sands disturbances, mineral wetlands, seasonal net ecosystem exchange modeling, fluxes of carbon dioxide and methane
Citation: Lemmer M, Rochefort L and Strack M (2020) Greenhouse Gas Emissions Dynamics in Restored Fens After In-Situ Oil Sands Well Pad Disturbances of Canadian Boreal Peatlands. Front. Earth Sci. 8:557943. doi: 10.3389/feart.2020.557943
Received: 30 April 2020; Accepted: 22 October 2020;
Published: 30 November 2020.
Edited by:
Jianghua Wu, Memorial University of Newfoundland, CanadaReviewed by:
Ronny Lauerwald, Université Paris-Saclay, FranceGerald Jurasinski, University of Rostock, Germany
Copyright © 2020 Lemmer, Rochefort and Strack. This is an open-access article distributed under the terms of the Creative Commons Attribution License (CC BY). The use, distribution or reproduction in other forums is permitted, provided the original author(s) and the copyright owner(s) are credited and that the original publication in this journal is cited, in accordance with accepted academic practice. No use, distribution or reproduction is permitted which does not comply with these terms.
*Correspondence: Meike Lemmer, bWVpa2UubGVtbWVyLjFAdWxhdmFsLmNh