 Prapawadee Srisunthon1
 Sakonvan Chawchai2*
- 1Institute of Earth and Environmental Sciences, University of Freiburg, Freiburg, Germany
- 2MESA Research Unit, Department of Geology, The Faculty of Science, Chulalongkorn University, Bangkok, Thailand
Tropical peatlands are one of the largest reservoirs of terrestrial organic carbon. However, present-day tropical peat swamp forests are under threat by anthropogenic disturbances and have already been widely degraded. Anthropogenic pressures on peatland ecosystems have resulted in ecological and biogeochemical changes and the release of carbon to the atmosphere. In Southeast Asia, the conversion of peatlands to oil palm plantations has accelerated significantly during the last 2 decades. This research analyzed direct and indirect land-use changes (DLUC and ILUC) that have been associated with oil palm expansion and anthropogenic impacts in the Princess Sirindhorn Wildlife Sanctuary (PSWS), Narathiwat, southern Thailand. Our analysis is based on land-use and land-cover data of the Land Development of Thailand from two different periods: 2000–2009 and 2009–2016. For the purpose of comparison, the data were reclassified into 12 types of land use: oil palm, para rubber, paddy field, abandoned paddy field, orchard, other agriculture lands, wetlands and peatlands, mangrove, evergreen forest, water area, build-up area, and unused area. In addition, the area of net change due to DLUC and ILUC was calculated, and carbon stock changes were estimated from above- and below-ground biomass and soil organic carbon. The results show that the total oil palm plantation area has increased from 0.04% in 2000 to 6.84% in 2016, because of a Thai government policy promoting the use of biodiesel and increasing capacity of palm oil production in 2005. Paddy field, evergreen forest, wetlands, and peatlands were the main areas being replaced. The clearance of natural forest greatly increased in the period of 2000–2009. The ILUC indicates that the expansion of oil palm plantations invades other croplands (paddy field, para rubber, and orchard). The results demonstrate that the conversion of natural landscapes (evergreen forest, mangrove, wetlands, and peatlands) to oil palm plantations at Princess Sirindhorn Wildlife Sanctuary area had a negative effect, with carbon stock changes of 4 million Mg C during 2000–2016 (0.25 million Mg C/year). Given the significance of carbon stock changes arising from land-use changes, this research highlights the need for sustainable land-use management and long-term monitoring.
Introduction
Since the 14th century, when palm oil was introduced in Southeast Asia, it became a crucial feedstock in the region, because the production cost is lower than that of other oil crops (Mukherjee and Sovacool, 2014). Biodiesel made from palm oil is a suitable alternative to the fossil fuels required in various production processes, mainly in agriculture (Shuit et al., 2009). Due to the global need for energy security, the demand for palm oil has been increasing rapidly (Verstegen et al., 2016). However, numerous works on land-use and cover change (LUCC) in Southeast Asia have shown that the expansion of oil palm plantations has been threatening peatland areas, causing deforestation, especially in Malaysia, Indonesia, and Thailand (Page et al., 2006; Murdiyarso et al., 2010; Fuller et al., 2011; Medrilzam et al., 2014; Prabowo et al., 2017; Dib et al., 2018; Othman et al., 2018; Tarigan, 2018). The conversion and degradation of forest and peatland areas to oil palm plantations have several adverse environmental effects, such as the invasion of wildlife habitats (Corley, 2009; Evrendilek et al., 2011; Tonks et al., 2017), loss of biodiversity (Koh et al., 2011; Minayeva et al., 2017; Maimunah et al., 2018), hydrological changes (Gopal, 2013), elevated peat temperature by exposing peatland surfaces to direct sunlight (Sano et al., 2010), and loss of the near-surface reservoir of terrestrial organic carbon (Wüst et al., 2007). Furthermore, several studies indicated that the greenhouse gas (GHG) emission rate increased when forests and peatlands were replaced by oil palm plantations (Germer and Sauerborn, 2007; Fargione et al., 2008; Dewi et al., 2009; Croezen et al., 2010; de Souza et al., 2010; Carlson et al., 2012).
The unceasing growth of the oil palm plantation area in Southeast Asia not only is of concern in terms of the negative impact on natural habitats but also is a threat to traditional and food crops. Azhar et al. (2017) showed the consequences of transforming the agricultural landscape from cropland to oil palms, emphasizing the issue of “Food-vs-Energy.” To study the extent of the degradation of traditional crops by oil palm plantations, Wicke et al. (2011) and Koh et al. (2011) estimated the LUCC based on remote sensing data. Using direct land-use change (DLUC) can clarify land transformation in different time frames to examine the result of the land conversion, which is related to GHG emission and biomass loss (Koh et al., 2011; Wicke et al., 2011). However, it is still unclear what land-use type oil palm has replaced. Kim and Dale (2011) suggested that, to understand this characteristic, any new study should employ indirect land-use change (ILUC). Instead of simply studying land conversion, ILUC emphasizes that the types of land use that have been replaced by oil palm and also tracks whether that crop was planted again in a different location in the same area. A fundamental aspect of ILUC is the consideration of both the land area converted to oil palm plantation and the land area converted to other crop types that originally gave their space to oil palm. For example, oil palm was planted into the paddy field area. However, rice from the paddy field is still in demand as a food crop. Therefore, the rice is planted again in a different location. ILUC reflects types of land use before the rice was planted. The Council of the European Union (Cod, 2018) addressed the issue of intensifying ILUC, threatening natural ecosystems and high-carbon value areas, such as forests, wetlands, and peatlands, and instigating extra GHG emission. Therefore, the study of DLUC should be parallel to that of ILUC in order to gain an insight into which types of land use were replaced by oil palm (Saswattecha et al. 2016).
In 2005, the Thai government initiated a policy campaign to promote biodiesel production and an expansion of oil palm plantation areas (Unjan, 2015). The policy aims to enhance agriculture in rural areas, which can increase the opportunity for international export. According to the Office of Agriculture Economics, the policy proposed supports facilities from the field to market and encourages farmers and smallholders. The government distributed the palm seeds, supported initial funding, discounted the cost of fertilizer, established the center market to buy the palm fruit, and found the factory to produce biofuel within the area. The policy also considered the area of abandoned paddy fields and swamp converted to oil palm plantation area and gave a concession to smallholders for the investment (http://www.oae.go.th). In response to the policy change, Thailand has increased palm oil production from 1.9 million metric tons (MMT) in 2016 to 2.5 MMT in 2017 and reached 2.7 MMT in 2018 and 2.9 MMT in 2019 (Preechajarn, 2018). Based on the Alternative Energy Development Plan (AEDP) 2015–2036 to support oleochemical industrial production, Thailand endeavors to have an oil palm plantation area totaling 10.2 million rai (1,632,000 ha) with 29.5 million ton of palm fruit per year and 5.9 MMT of palm oil per year (CAER, 2017).
Southern Thailand is a target area for oil palm plantations, because of supportive weather conditions and manufacturing facilities for processing raw products (Thongrak et al., 2011; Mukherjee and Sovacool, 2014; Saswattecha et al., 2016). The Princess Sirindhorn Wildlife Sanctuary (PSWS) Wetland (Phru To Daeng peat swamp) is the largest wetland area in the country, located in Narathiwat Province, southern Thailand. As a recognized Ramsar Site (since 2001), the wetland is of international importance. The Ramsar Convention is an international treaty for the conservation and sustainable use of wetlands, emphasizing the importance of protecting wetland areas including seasonal-marshes, peat swamp forests, riverine swamps, mangroves, and peatlands (Ramsar, 2011; Gopal, 2013). Phru To Daeng peat swamp is well known for its tropical peatland ecology (Nowak, 2012) and as a habitat of diverse flora, fauna, and several endangered species (Darnsawasdi and Chitpong, 2002). The Phru To Daeng wetland area provides flood protection for the business district of Narathiwat Province by acting as a tidal marsh to store the runoff during the summer monsoon (Reungsri and Kanasut, 2017). Additionally, the swamp forest is a reservoir of terrestrial organic carbon and can also help to reduce erosion and the velocity of the overflow during the flood peak flow period.
Since the initiation of the Thai government’s long-term policy (25 years) aimed at expanding palm oil production, we hypothesize that there was an increase in the oil palm plantation area in Phru To Daeng peat swamp. This paper aims to examine land-use and cover change through DLUC and ILUC at PSWS or Phru To Daeng peat swamp. We focused on two watersheds, Bang Nara and Kolok (Figure 1), for monitoring the land conversion toward oil palm plantations. This study evaluated land-use data from two periods, 2000–2009 and 2009–2016, to gain insight about LUCC both before and after the establishment of the Thai government policy in 2005. ILUC can give insight into types of land use that were replaced most extensively and the likelihood that they may subsequently be moved to another location locally. In this study, the change of carbon stock (above and below ground) based on the change of LUCC types was calculated. The quantitative analysis is important for a better understanding of the global environmental impacts of oil palm expansion, in particular the effect of the expansion of oil palm plantation area into a tropical peatland and the resultant deforestation and carbon storage loss. Furthermore, this study can enhance public awareness of the cost of energy security associated with the loss of natural areas.
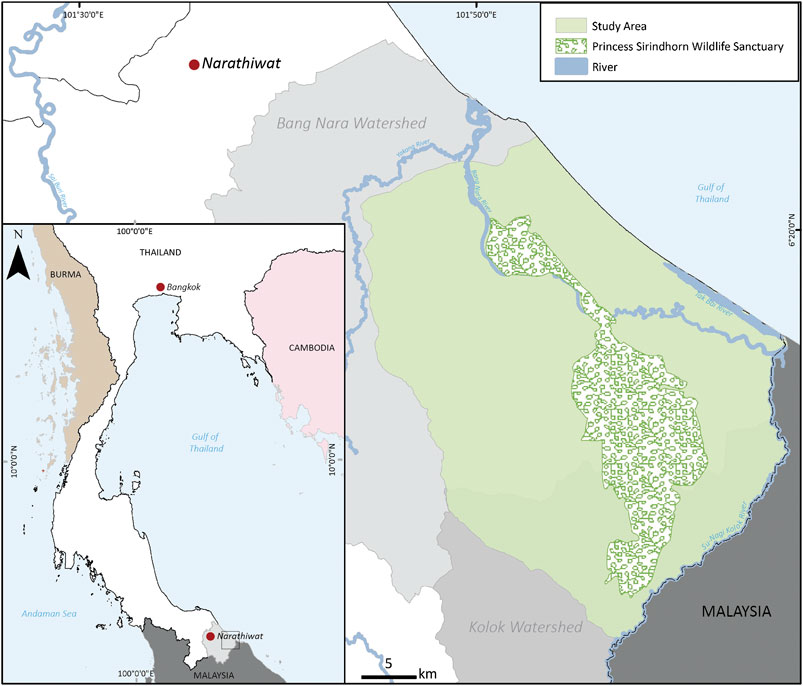
FIGURE 1. Location of the study area (green color) and PSWS or Phru To Daeng peat swamp in Narathiwat province, southern Thailand. The polygon of the wetland site was derived from Office of Wildlife Conservation, 2001.
Setting of the Study Area
PSWS or Phru To Daeng peat swamp is located between the Bang Nara and Kolok watersheds, which are part of the Southeast Watershed group on the east side of the Thai-Malay Peninsula (Figure 1). Phru To Daeng is the biggest swamp forest in the country and covers about 201 km2 (20,100 ha) (Ramsar, 2011) (Figure 1). The Phru To Daeng peat swamp area is always covered by stagnant water, influenced by tides from the Gulf of Thailand and monsoon rain. This area can be considered as a part of the lowland peat deposits. Based on hydrological data, the area receives water inflow from the Bang Nara river in the north, the Su-ngai Kolok river in the south, and the Takbai river in the east. A previous study investigated peat depth with a DGPS survey, and a contour map was drawn at the Bacho area (30 km2) in Narathiwat (north of the study site). The average thickness of the peat layer was about 1.1 m, and the total peat volume was about 0.05 km3 (Yoshino et al., 2002). The average decomposition rate of peat layers was about 3.8 cm per year, the average organic matter loss was 3.04 kg C/m2/year, and the emission rate of carbon as a carbon flux was 7.6 kg/m2/year (Yoshino et al., 2002).
The boundary of the study area has been delineated based on watersheds (Figure 1). Generally, the study area is dominated by natural lands, such as evergreen forests and wetlands. The crops planted are mostly para rubber, rice, and orchard, specifically coconut and durian. Built-up areas are spread over the entire area, especially in the northern and southern parts. The climate of the study site is influenced by monsoon from the Indian Ocean and South China Sea. During May–December, the area receives rainfall of more than 250 mm/month and about 75 mm/month during January–April, with an average total annual rainfall of 2,664 mm and average annual temperature of 27.2°C (Thai Meteorological Department (TMD)) (1988–2017).
Datasets and Methodology
Datasets
Bang Nara and Kolok watersheds (Figure 1) share the same characteristics, such as swamps, traditional crops, natural areas, and other land-use types. To delineate the watershed boundary, we employed a digital elevation model (SRTM 1) and contour lines from topographic maps (L7018) obtained from the Royal Thai Survey Department (RTSD) (Table 1). The result is shown as the green area in Figure 1.
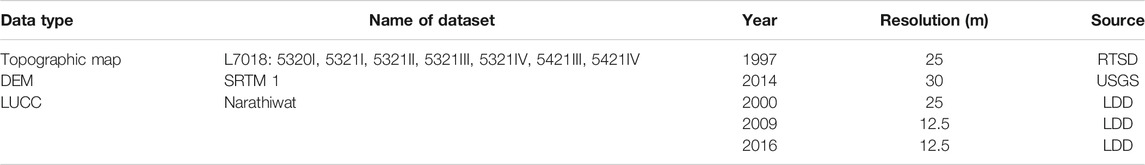
TABLE 1. Input data for the interpretation of land-use and cover change during 1997–2016.
The LUCC data for this research were generated by the LDD (Table 1), using remote sensing (satellite images) and “ground truth” to work out various details. The data from LDD are available for 2000, 2007, 2009, 2016, and 2018. For this study, the data sets from 2000, 2009, and 2016 were used. The data from 2007 have been omitted, because a disastrous flood destroyed the area and caused an increase of abandoned land, marsh, and inundated area. We also did not use the data from 2018, because cropland area types are not available.
The LUCC data in 2000 were interpreted from satellite images (Landsat five and Landsat seven TM). LUCC in 2009 and 2016 were derived from orthoimages (2 m) and satellite images (THEOS, Spot-5 and Landsat eight OLI). The LUCC data from 2000 to 2016 have been classified as Level 2 and divided into 116 types of land-use categories. We derived land-use data from LDD as a polygon shapefile (vector format). However, the data from each year have different cell sizes. Therefore, processing data are needed before further analysis in order to avoid the error in the calculation. Firstly, the shapefiles were converted to a raster format by using a tool from ArcGIS 10.5 called “polygon to raster.” As a raster format, the cell size was reclassified to 30 × 30 during the conversion process for further area calculation. Secondly, the definition of the land-use types from LDD in the attribute table was grouped and reclassified the land-use data to 12 types. Thirdly, the data were converted from raster to vector format by using a tool called “raster to polygon.” This polygon was available as a vector shapefile that contained the data of 12 types of land use. Finally, the attribute tool was used to calculate the geometry of each land-use type as an area in hectares (ha).
The land-use types in this analysis are 1) oil palm; 2) para rubber; 3) paddy field, which was still planted and harvested regularly for rice; 4) abandoned paddy field, which was not harvested anymore but was still owned by a farmer; 5) orchard area (mainly durian and coconut); 6) other agriculture lands (perennial crop, mine, farms, pastures, and aqua cultural land); 7) wetlands and peatlands (swamp forest, swamp, and marsh); 8) mangrove forest; 9) evergreen forest; (10) water area (irrigation pond, lake, canal, and river); 11) built-up area (transportation facility, village, institutional land, commercial, and factory area); 12) unused area (grassland, scrub, and beach), which is not owned by farmers and primarily belongs to the local authority. For further LUCC analysis and discussion, these land-use types have been grouped into three major categories: cropland, natural land, and others.
Direct and Indirect Land-Use Change
To monitor the dynamic of land-use change in the study area before and after the implementation of the 2005 policy to increase oil palm plantation areas, the data from LDD were divided into two periods, 2000–2009 and 2009–2016, and the effects from both DLUC and ILUC were examined. The spatial analysis was done using a clipping tool in analysis toolbox from ArcGIS 10.5.
DLUC takes place when the land is transformed into an energy crop (biofuel) (Plevin and Kammen, 2013; Van der Laan et al., 2015). In this study, DLUC refers to area changes caused by oil palm expansion (oil palm plantations replaced other land-use types). The values are shown as gross and net values. The gross value represents the area converted to oil palm plantation area in ha, while the net value is the gross value minus the area of oil palm plantations converted to other land-use types. For example, in 2000–2009, oil palm cultivation area has replaced 10 ha of para rubber plantation area and para rubber has replaced 2 ha of oil palm. Thus, the gross change is 10 ha and the net change is 8 ha. Therefore, DLUC not only indicates the growth of oil palm plantations in the area but also clarifies which types of land use have been converted to oil palm cultivation area.
ILUC considers the cropland displaced by energy crops. However, the croplands have been expanded to other areas in response to increased global demand (Marshall et al., 2011). In this study, ILUC was analyzed in the croplands of para rubber, paddy field, and orchard that have been replaced by oil palm plantations, but they were planted in different locations in the study area. All these crops (para rubber, paddy field, and orchard) have dominated the study area before the massive oil palm expansion and are always on demand in Thailand. The gross area refers to the total area converted into crops with high demand. To get the gross value, we used crops from the younger period clipped into land use in the older period. For example, we used the shapefile of para rubber from 2009 cut into land use from 2000. Thus, the results will be a gross value from ILUC of para rubber during the period of 2000–2009. The net area is the gross area minus the area of crops with high demand (para rubber, paddy field, and orchard) converted into different land-use categories. To get net value, we used crops from the older period clipped into land use in the younger period. For example, we used the shapefile of para rubber from 2000 cut into land use from 2009. The value from this process is considered as a net value from ILUC of para rubber during the period of 2000–2009. Then, we subtracted net from gross and consider only positive values as the ILUC effect.
Carbon Storage
The quantity of carbon storage was calculated following Eq. 1 from Agus et al. (2013). A review of the published literature on the above-ground biomass, below-ground biomass, and soil organic carbon in the Southeast Asian region was undertaken for each land-use type (Agus et al., 2013; van Beijma et al., 2018) (Table 2), because each land-use type differs in its capacity to store carbon from the atmosphere. For calculations of the carbon storage, a list of data has been compiled, and values of (CB + CD + CS) in Eq. 1 for this study (Table 2) were selected based on the proximity to the study site and/or similar environmental conditions. In this study, the area of the activity (A) has been classified into DLUC and ILUC, and the carbon storage change was calculated separately for each land-use type (Table 5). The data for actual peat coverage and thickness are not available for PSWS, as wetlands and peatlands are grouped together as a land-use type. The calculations herein are based on valid assumptions and criteria applied in similar cases (e.g., Verwer and van der Meer, 2010; van Beijma et al., 2018).
where ∆C = the sum of change in carbon stock in a unit of time, A = area of the activity (ha), CB = change in carbon stock in the living biomass (above- + below-ground biomass), CD = change in dead organic matter, especially dead vegetation (above- + below-ground biomass), CS = change in carbon stock in soil (soil organic carbon), and T = period of observation in years.
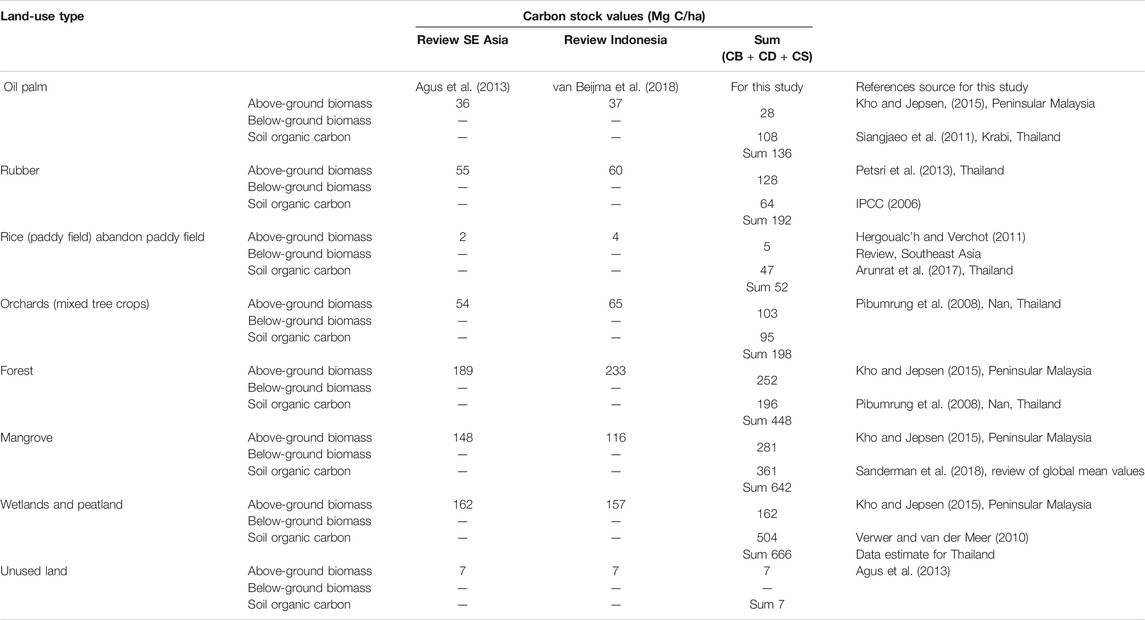
TABLE 2. Carbon stock values for each land-use type.
Results
Land-Use Change During 2000–2009 and 2009–2016
The total land-use area from 2000 to 2016 is illustrated in Figure 2 and Table 3. The analysis of total land use shows that only oil palm plantation areas increased continuously throughout 2000–2016 period. In the period from 2000 to 2009, the percentage of total oil palm plantation area had risen from 0.04 to 2.66% and from 2.66 to 6.84% during 2009–2016 (Table 3). Conversely, paddy fields have dramatically decreased from 13.91 to 9.62 and then to 6.92%, respectively, which corresponds to a reduction of approximately 50% during 2000–2016 (Figure 2A). The total area occupied by orchard and para rubber fluctuated, orchard increased by 2.49%, and para rubber decreased by 1.67% when comparing the year 2000–2016. Within the natural land category, mainly evergreen forest has been affected, particularly during 2000–2009, when the area of evergreen forest decreased from 15.32 to 7.22% (Table 3). At the same time, built-up areas increased by about 2.51%. The rest of the land-use types (other agriculture areas and water areas) showed slight changes during 2000–2009 but remained almost unchanged during 2009–2016.
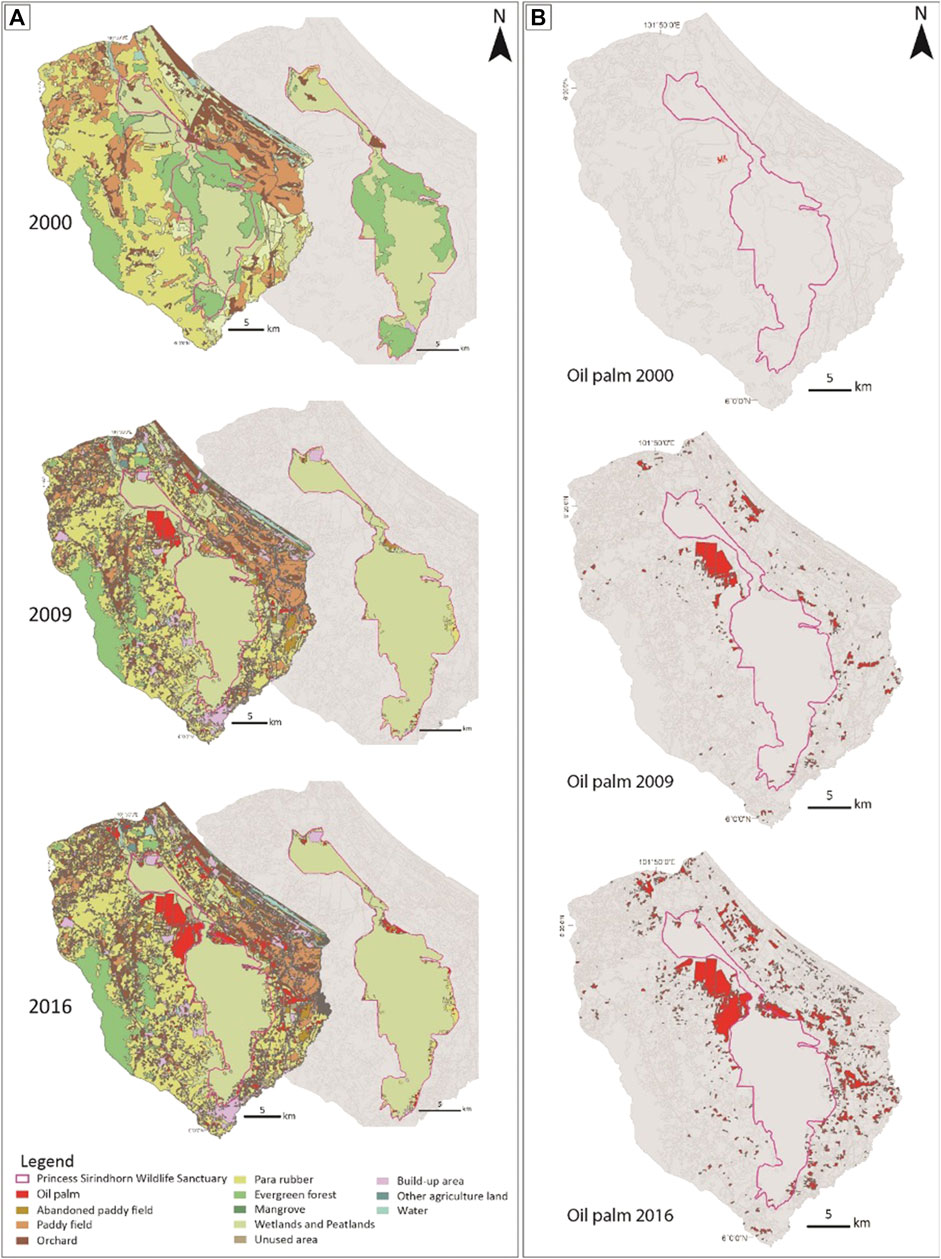
FIGURE 2. Map of LUCC from 2000–2016: (A) LUCC data of all land-use types in the study area and in PSWS comparing 2000, 2009, and 2016. (B) The total area of oil palm plantation areas comparing 2000, 2009, and 2016.
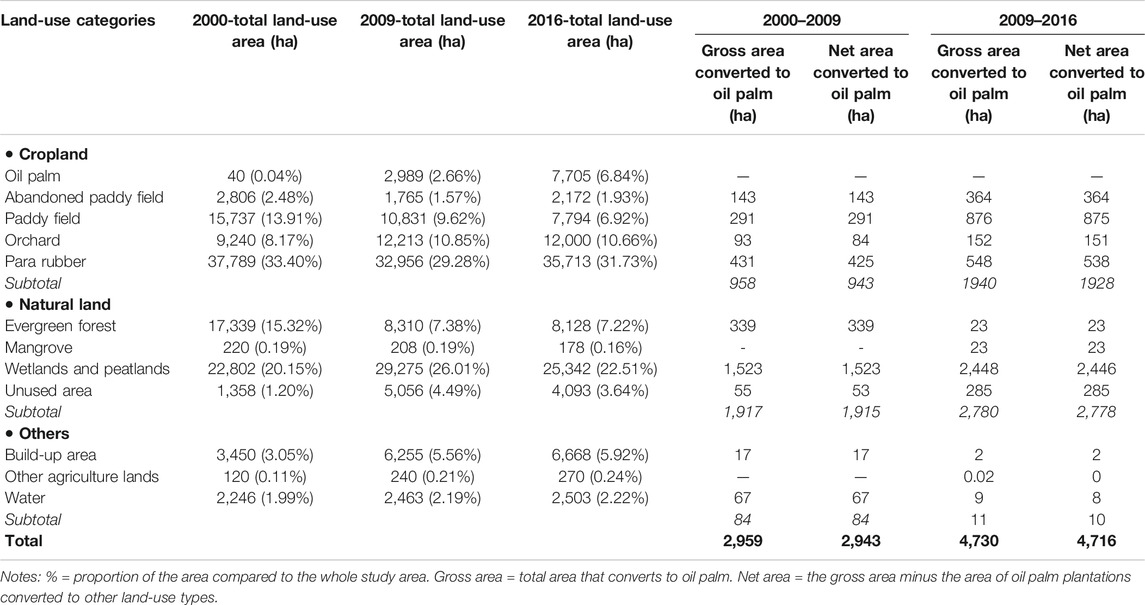
TABLE 3. Total area of land-use and cover change (LUCC) from 2000 to 2016 and DLUC from the expansion of oil palm plantation areas during the two periods, 2000–2009 and 2009–2016, focusing on the area of the PSWS (Phru To Daeng peat swamp), southern Thailand.
Direct Land-Use Change (DLUC)
The purpose of investigating DLUC was to gain more insight into the effect of expanding oil palm plantations into other areas, resulting in changes in land use. Furthermore, the results from DLUC stipulated the land-use types whose area has been mainly converted into oil palm plantations (Figures 2B, 3). In this analysis, we focused on the net area value change comparing two periods, 2000–2009 and 2009–2016 (Table 3).
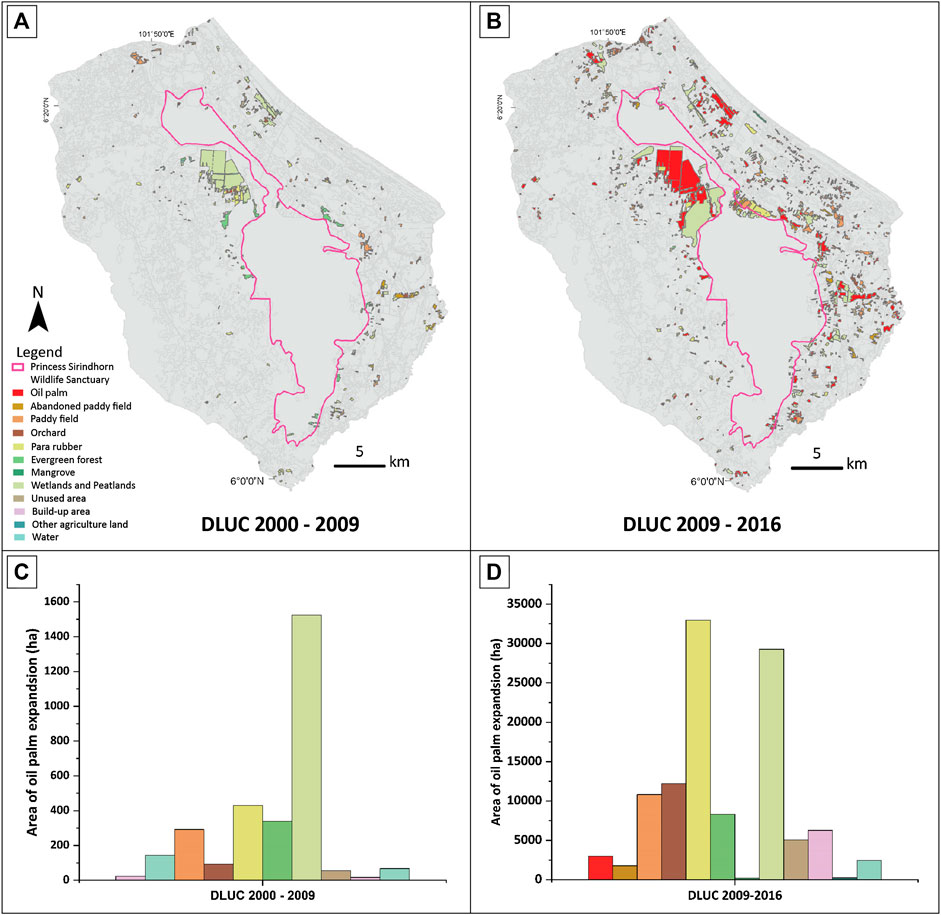
FIGURE 3. The polygon map of DLUC gross change in periods (A) 2000–2009 and (B) 2009–2016. See also Figure 2B for the land-use types before their conversion. The bar graphs were derived from the DLUC maps, showing the effect of oil palm expansion on each land-use type in periods (C) 2000–2009 and (D) 2009–2016.
During 2000–2009, abandoned paddy field, paddy field, evergreen forest, wetland and peatland, built-up area, and water area were converted to oil palm area (Table 3, Figures 2B, 3). The equal of gross and net value from those mentioned land-use types showed that all their area converts to oil palm and the same land-use types were not found in the different locations of the area. For example, 291 ha of paddy field was converted to oil palm, but no area from any land-use types was converted to the paddy field. For natural land, the total land-use area of evergreen forest had decreased in both periods in 2000–2009 and 2009–2016. Wetlands increased from 20 to 26% during the period 2000–2009, partially as a result of the megaflood in 2007 (www.thaiwater.net/current/flood_south_dec50). The study area reduced flooding in urban areas and increased the area of tidal marshes and abandoned areas locally.
During 2009–2016, the other land-use types (e.g., paddy field, orchard, and para rubber) were converted to oil palm plantations and were relocated to different locations. This can be seen from the net-change value, which is less than the gross-change value. However, the total area of wetlands and peatlands, unused areas, built-up areas, and water areas have increased from 2000 to 2009 due to the effect of flooding in 2007. From our analysis, the wetland was the largest area converted to oil palm plantations. During 2000–2009, 1,523 ha of the wetland was converted to oil palm. Approximately, 10% (2,446 ha) of the total wetland area had been converted to oil palm plantations during 2009–2016.
Indirect Land-Use Change (ILUC)
During 2000–2009, mainly wetlands were converted into paddy fields (Table 4 and Figure 4). Paddy fields only replaced abandoned paddy fields, and no other croplands had been converted (Table 4), whereas the results show a substantial ILUC effect from oil palm expansion on para rubber (Table 4). During 2000–2009, para rubber has replaced mainly paddy fields and abandoned paddy field areas. However, during 2009–2016, para rubber replaced all cropland types (abandoned paddy field, paddy field, and orchard). Para rubber expanded and invaded in cropland area and other land-use types within the natural land group, mainly in the wetland (1,128 ha or ∼5% of the total area of wetland in 2016). Moreover, para rubber has converted 3 ha of the water area (Table 4).
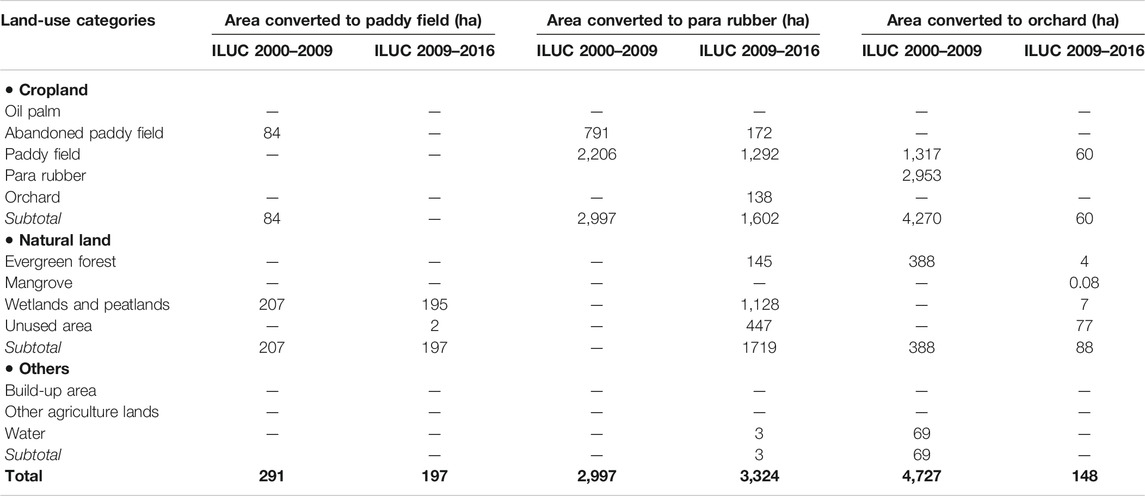
TABLE 4. Area of ILUC effect in the periods 2000–2009 and 2009–2016 due to the expansion area of oil palm plantation in paddy field, para rubber, and orchard.
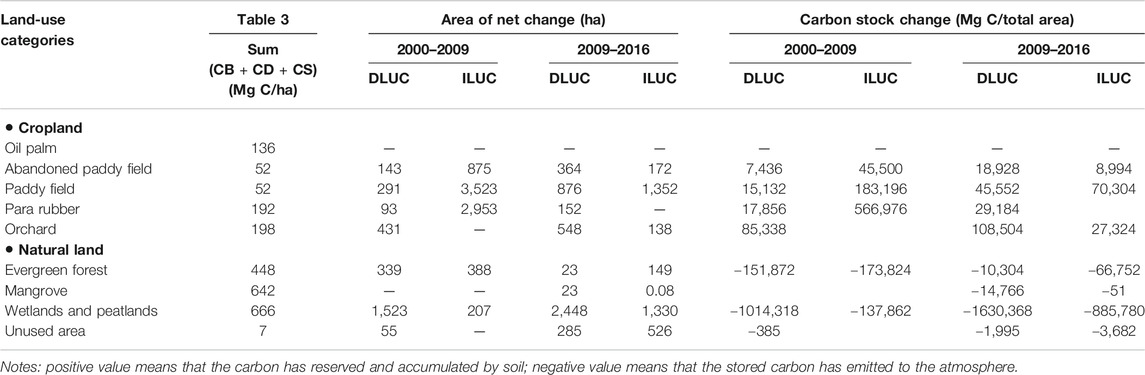
TABLE 5. Carbon storage derived from DLUC and ILUC.
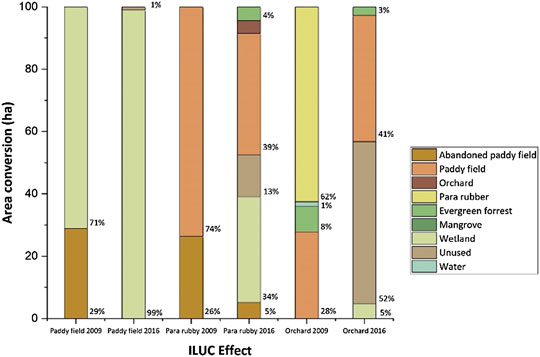
FIGURE 4. Cumulative bar graph showing ILUC effect in the period 2000–2009 and 2009–2016 due to the expansion area of oil palm plantations into paddy fields, para rubber, and orchard. The cumulative bars show the proportions of the converted land uses.
During 2000–2009, the total ILUC effect from orchard is 4,727 ha, which is much more than ILUC effect from para rubber and paddy field (Table 4). Furthermore, 1,317 ha of paddy field and 2,953 ha of para rubber (Table 4) were converted to orchard during the same period. However, the ILUC effect from orchard is lowest during the 2009–2016 period, compared with para rubber and paddy field. This indicates that orchard was in high demand in the area during the period 2000–2009. Still, para rubber was in high demand during 2009–2016. Our results show that the ILUC effect can be an indicator of the expansion of oil palm into other types of cropland (Figure 4). These can force paddy field, para rubber, and orchard to be relocated to somewhere else in the study area.
Carbon Storage
The carbon changes associated with land-use change were calculated based on Eq. 1 for two periods: 2000–2009 and 2009–2016 (Table 5). In this case, positive values mean that the carbon has accumulated in soil. In contrast, negative values mean that the stored carbon was emitted into the atmosphere. We define the carbon stock change in natural lands (Table 5) as a negative value because before land conversion they stored carbon in above- and below-ground biomass and in soil organic carbon. During 2000–2009, cropland (abandoned paddy field, paddy field, para rubber, and orchard) accumulated carbon at about 0.92 million Mg C, whereas natural land (evergreen forest, wetland, and peatlands) emitted carbon at about 1.5 million Mg C. Significant carbon emission values are observed in wetlands and peatlands. A similar trend is observed during 2009–2016: cropland accumulated 0.31 million Mg C, and natural land emitted 2.6 million Mg C. In summary, the carbon storage changes of natural land (evergreen forest, mangrove, wetlands and peatlands, and unused area) in the study area were about 4 million Mg C during 2000–2016. These changes are largely caused by the conversion of natural land to the other anthropogenic land-use types, in both DLUC and ILUC.
Discussions
Expansion of Oil Palm Through Direct and Indirect Land-Use Change
The main goal of this study was to find the impact of DLUC and ILUC from the expansion of oil palm plantation area on basins covering the Princess Sirindhorn Wildlife Sanctuary, southern Thailand. This area has a high potential for oil palm plantations due to the location and climate (Mukherjee and Sovacool, 2014). Given the appropriate conditions and the governmental provision, this area was considered as one of the best choices for the farmers to convert their land to oil palm fields.
Our analysis showed that the pattern of an expansion of biofuel crops into the agriculture land was the most effective in the DLUC result. The proportion of total land-use change indicated that oil palm plantation and built-up area affected the conversion of other land-use types, especially paddy field, evergreen forest, and wetland and peatlands. In the study area, the total area of the paddy field decreased considerably from 13.91% in 2000 to 6.92% in 2016. This result indicates that the area of paddy fields has continuously decreased, even though rice is a food crop and still in very high demand in Thailand. Furthermore, the net change in values of DLUC of paddy fields also indicates that most of the paddy field land was converted to oil palm area. This scenario is comparable with a case study by Saswattecha et al. (2016) of DLUC from oil palm expansion in Tapi River Basin, Thailand. In Tapi River Basin, paddy field area decreased from 0.65% in 2009 to 0.22% in 2012. Moreover, the total of net area from agriculture land that was converted to oil palm has increased more than 2 times, from 943 ha during 2000–2009 to 1928 ha during 2009–2016. A similar trend has been observed in Indonesia, where oil palm plantation areas converted from croplands have increased from 22.10% during 1995–2000 to 37.90% during 2010–2015 (Austin et al., 2017). In the case of Latin America, the study of Furumo and Aide (2017) showed that 79% of oil palm cultivation area (342,032 ha) was converted from croplands (e.g., banana). Therefore, it is a global trend that the majority of biofuel crops replace other agricultural lands, especially food and traditional crops. Apparently, oil palm not only occupied cropland areas but also tended to create a monoculture (Giam et al., 2015). This monoculture can lead to a lack of biodiversity and problems with food crop security.
Another land-use type that has a high impact from DLUC of oil palm expansion is wetland and peatlands. Even though the total area of wetland and peatlands has increased by about 2.36% during 2000–2016, the DLUC net value shows that 1,523 ha during 2000–2009 and 2,446 ha during 2009–2016 were converted to oil palm area. This scenario confirms that tropical peatland areas are threatened by the demand for palm oil and the policy of bioenergy security. Not only this study area but also many other places have been suffering from peatland deforestation. For example, 57% (1,594,900 ha) of the deforestation area in Kalimantan, Indonesia, was caused by oil palm expansion during 2000–2010 (Carlson et al., 2012). In the lowlands of Peninsular Malaysia, Borneo, and Sumatra, 6% (about 880,000 ha) of the total peatland area was converted to oil palm plantation area (Koh et al., 2011). The conversion of wetlands and peatlands area to oil palm is of high concern because it can reduce biodiversity, increase GHG emissions, and decrease carbon stocks in soil (Fitzherbert et al., 2008; van Beijma et al., 2018; Cooper et al., 2019).
Indirect land-use change (ILUC) has a long-term effect after the expansion of oil palm area, when bioenergy crops invade the cropland area. Crops, which are still in high demand (food or feed livestock), were planted in the new area and replaced natural land (Bowyer and Kretschmer, 2010). Based on the data from agricultural exports of Thailand, we investigated the area of paddy field, orchard, and para rubber to find the impact of ILUC after the oil palm cultivation area expanded. Our analysis showed that paddy field, orchard, and para rubber were converted mainly to cropland area group during 2000–2009. However, during 2009–2016, they were expanded both in the cropland area and in natural lands. These scenarios suggest that farmers, in the beginning, decided to change their land to biofuel crops. Nevertheless, they still need to plant rice, orchards, and para rubber, because they are still in demand. As a result, farmers decided to clear the natural lands, mostly wetlands and peatlands to extend the agricultural area.
Thai Government Policy Influences the Expansion of Oil Palm Plantation Area in Southern Thailand
We hypothesized that the 2005 Thai government policy was the main driver for the expansion of the oil palm plantation area in the study region and in southern Thailand. This policy supported the farmers and smallholders to convert their land to oil palm fields. Also, the main goal of the policy was to increase the plantation area, enhance farming income for rural areas, produce agricultural products for international export, and improve energy security. As an upstream component of the supply chain, the farmers got funding in both training and financial support from the Thai government. Our analysis shows that the oil palm plantation field in this area increased from 0.04 to 6.84% within 16 years. In addition, the data from ILUC indicates that oil palm replaced other crops, such as para rubber and paddy fields even though they are a substantive cash crop of southern Thailand.
The Thai government policy not only supported the harvest sector but also created a supply chain from field to market. The supply chain of the Thailand oil palm industry can be classified into three sectors: cultivators, crude palm oil mills, and refineries. In the cultivators’ section, it was reported that nearly 0.24 million households involved in the cultivator sector which made 79% of oil palm fruit area were from small shareholders in 2020 (Sowcharoensuk, 2020). The government also created crude palm oil mills across the country to buy the palm fruit from small shareholders. Based on the data from the Department of Industrial Works, there are 149 mills situated across the country, and 83 oil palm mills are in the south of Thailand. For this study area, the nearest oil palm mills are located at Bacho cooperative estate in Bacho District, Narathiwat Province (about 10 km from the study area). This mill was started in 2009 and can operate 45-ton-FFB-per-hour (Frontier Engineering Consultants, 2011). Lastly, the government supports the refinery factories to produce biomass energy. Thailand is in third place in the global ranking for the export rate of crude oil palm, after Indonesia and Malaysia (Table 6, Figure 6), but Thailand produced a higher capacity of biodiesel. Data from the refiners in Thailand reported that the country had 538 kilotons (kT) of total biodiesel production, whereas 578 kT was produced in Indonesia and 200 kT in Malaysia (Mukherjee and Sovacool, 2014). This biodiesel created a B100, which can be used to blend with other gasoline types in various proportions.
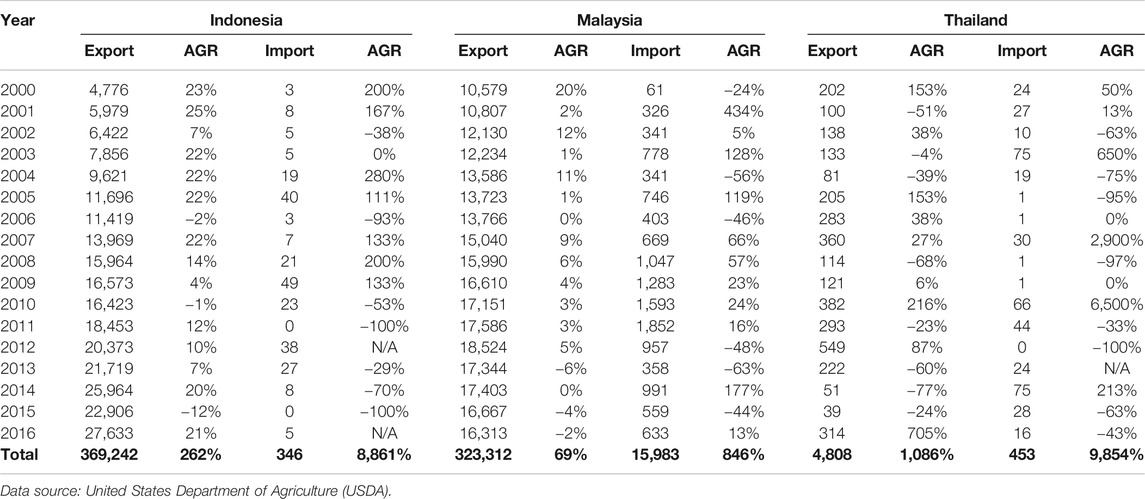
TABLE 6. Data on crude palm oil exports and imports from Indonesia, Malaysia, and Thailand (import and export unit x1,000 MT (Million Tons); AGR = Annual Growth Rate).
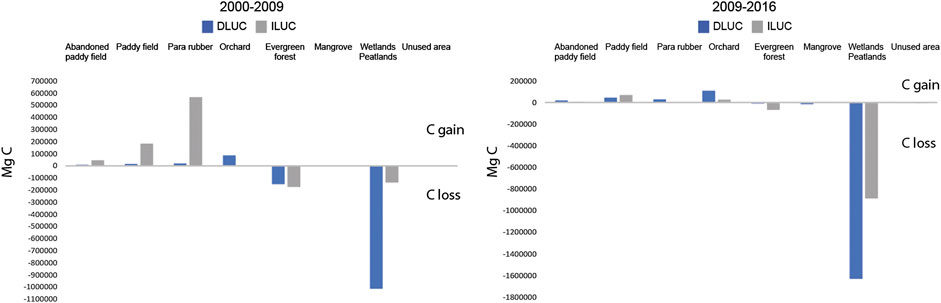
FIGURE 5. Bar graphs showing a summary of the net carbon gains and losses and how they differ across land-use change types during periods the 2000–2009 and 2009–2016.
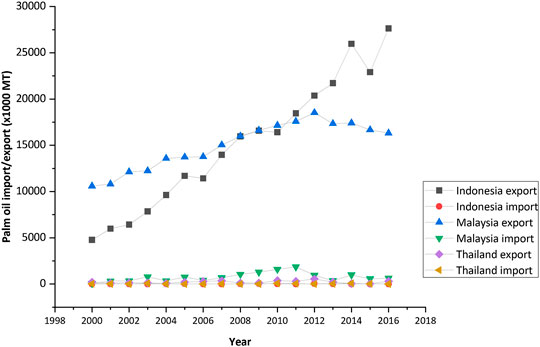
FIGURE 6. International imports and exports of crude palm oil (data source: United States Department of Agriculture).
Table 7 shows the overview of household and profits from the farming income of southern Thailand and of Narathiwat Province (the study area). Although the income from farming was lower than nonfarming, the household income, from both the total of southern Thailand and that of Narathiwat Province, was significantly increased after 2005. The farming income also slightly increased after 2005 and dropped during 2015–2017 due to the natural disaster. That income might increase due to oil palm and other major agriculture products (e.g., paddy and para rubber). From 2000 to 2018, the price of Jasmin rice and para rubber was much higher than oil palm (Figure 7), but the oil palm price was more stable than that of Jasmin rice and para rubber. Nevertheless, we can consider oil palm as one of the major cash crops, and it has created a new household income in the area. In terms of improving agriculture and creating jobs, the 2005 policy has reached its goals.
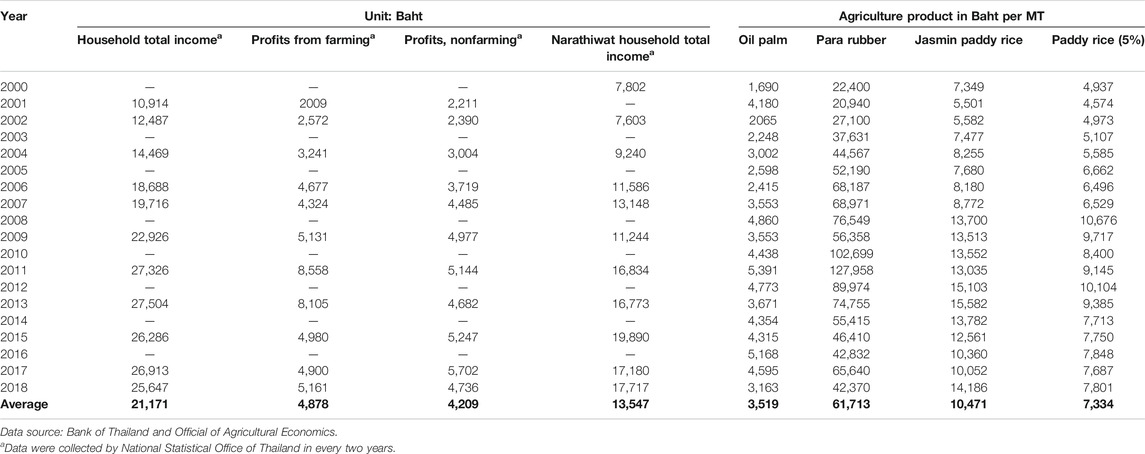
TABLE 7. Southern Thailand household income and agricultural product prices.
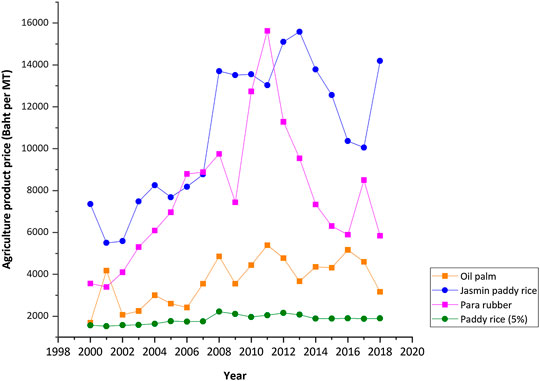
FIGURE 7. Annual price of main agriculture products (data source: Bank of Thailand and Official of Agricultural Economics).
From this study, we suggest that the 2005 policy for increasing oil palm products played a crucial role in land-use changes in the study area. However, it is obvious from export and import data that the 2005 policy was not very successful in competing in the world market for palm oil. The Thai government policy targeted only smallholders and farmers, so, the productivity of Thai palm oil was relatively low. According to Sowcharoensuk (2020), the majority of palm oil in Thailand came from smallholders, who have not more than 25 rai (4 ha) of cultivated land. But in Indonesia and Malaysia, the corporations owned more than 80% of oil palm plantations. In Indonesia, the government also proposed a support program to support smallholders, but the program was managed by some private companies (Zen et al., 2006). Euler et al. (2016) showed that the smallholders in Indonesia preferred to sign a contract with the private company and were motivated to increase the product due to the demands of the company. In contrast, the oil palm industry in Thailand was not managed at the large scale. Normally, the farmer harvested the crop and sold it locally, instead of directly selling to mills, because of the small size of the crop. Then, the mills sold the product to the government, and the Department of Internal Trade and Thailand Oil Palm Board took the responsibility to distribute the product to refineries and to export it to the global market.
Carbon Storage Change
A change of land-use types can lead to changes in biomass and soil organic carbon storage (Jaiarree et al., 2011; van Beijma et al., 2018). The DLUC and ILUC are associated with carbon storage changes (Hansen et al., 2014; Zhang et al., 2015; Saswattecha et al., 2016). Fargione et al. (2008) indicated that the conversion of natural land to oil palm plantation area can release a large amount of CO2 or create “carbon debt,” which takes 48 years to repay. In the Southeast Asian region, growth in palm oil production has been accompanied by the concern of carbon loss and greenhouse gas (GHG) emissions to the atmosphere arising from land-use change, primarily because of the conversion of tropical forests into plantations (Carlson, 2013).
In this study, the carbon changes associated with land-use change arising from palm oil production were estimated for two periods: 2000–2009 and 2009–2016 (Table 5). We consider only the above- and below-ground biomass and soil organic carbon changes due to the changes in land-use type. The carbon changes/emissions related to fire, degradation, and drainage were not considered due to their uncertainty. We define the carbon stock change (Table 5) from natural land (evergreen forest, mangrove, wetlands, and peatlands) as a negative value. This negative value indicates that the stored carbon was emitted to the atmosphere as a result of oil palm plantations. During 2000–2016, the carbon storage change of natural land in Phru To Daeng peat swamp area was about 4 million Mg C. These changes are largely caused by the conversion of natural land to the other anthropogenic land-use types, in both DLUC and ILUC. Biomass and organic soil from the natural land, especially wetlands and peatlands and mangrove, can act to store terrestrial carbon. DLUC change in peatlands involves drainage, which, in addition to direct carbon losses from peat oxidation, also leads to increased flux of dissolved organic carbon (Moore et al., 2013; Evans et al., 2014), some of which will transfer to the atmosphere as the greenhouse gases CO2 and CH4 (e.g., Jauhiainen and Silvennoinen, 2012; Moore et al., 2013). Also, organic soil in peatlands and wetlands can store more than 2.7 times the amount of carbon compared to the atmosphere (Schlesinger and Bernhardt, 2013). Therefore, the change in land-use type can lead to altered oxidation conditions in organic soil in peat and result in carbon flux-emission of CO2 to the atmosphere (Erasmi and Twele, 2009; van Beijma et al., 2018).
Conclusion
In the Southeast Asian region, growth in palm oil production has been accompanied by concern over the impact of carbon loss and greenhouse gas (GHG) emissions to the atmosphere arising from land-use change, particularly the conversion of tropical forests into oil palm plantations. To gain insight on land-use and cover change (LUCC) before and after the Thai government policy change in 2005 to increase oil palm plantation area, this study analyzed direct and indirect land-use change (DLUC and ILUC) in the periods 2000–2009 and 2009–2016 at the largest peat swamp in Thailand: Princess Sirindhorn Wildlife Sanctuary Wetland.
From 2000 to 2016, our analysis on LUCC shows that oil palm plantations and built-up areas have increased by 6.80 and 2.87%, respectively. Paddy field (−6.99%) and evergreen forest (−8.17%) were the main areas that were replaced. The ILUC results show a substantial effect of oil palm expansion on cropland (paddy field, para rubber, and orchard). During 2000–2009, mainly wetlands were converted into paddy fields. Para rubber replaced mainly paddy fields and abandoned paddy field areas. An area of 1,371 ha of paddy field and 2,953 ha of para rubber was converted to orchard during the same period. This indicates that orchard was still in high demand in the region. During 2009–2016, para rubber replaced areas of abandoned paddy field, paddy field, and orchard and invaded ∼5% of the total wetland and peatland area. These ILUC calculations show changes in the demand for cropland types. Para rubber was in higher demand than rice and orchard during 2009–2016.
The area of net change of DLUC and ILUC was calculated, and carbon stock changes were estimated from above- and below-ground biomass and soil organic carbon. The conversion of natural land-use type (evergreen forest, mangrove, wetlands, and peatlands) to oil palm plantations caused carbon stock changes of about 4 million Mg C in the area. Given the significant number of carbon stock changes arising from land-use changes, monitoring, and annual updates would be needed to capture rapid changes, such as deforestation (fire or logging) and plantation development.
Data Availability Statement
The datasets generated during and/or analysed during the current study are available from the corresponding author on reasonable request.
Author Contributions
PS and SC conceived the research project, performed data, experiments, and results, wrote the original draft, and made all figures. Both authors discussed the results and reviewed and edited the article.
Conflict of Interest
The authors declare that the research was conducted in the absence of any commercial or financial relationships that could be construed as a potential conflict of interest.
Acknowledgments
The authors would like to thank the Department of Land Development of Thailand for providing data. P. Srisunthorn acknowledges financial support from DAAD for her PhD study. S. Chawchai thanks Ratchadaphiseksomphot Endowment Fund (CU_GR_63_92_23_22), Alongkot Fanka for the information about Frontier in Earth Science for Southeast Asia, Komson Jantharasana for logistical support in data acquisition, Raphael Bissen for helpful discussion and proofreading, Sherilyn Fritz for the final proofreading, and the PAGES C-PEAT working group for encouragement and the initiation of the idea for this project.
Supplementary Material
The Supplementary Material for this article can be found online at: https://www.frontiersin.org/articles/10.3389/feart.2020.559868/full#supplementary-material.
References
Agus, F., Henson, I., Sahardjo, B., Harris, N., Van Noordwijk, M., and Killeen, T. (2013). Review of emission factors for assessment of CO2 emission from land use change to oil palm in Southeast Asia. Reports from the Technical Panels of the Second RSPO GHG Working Group. 7–31. Available at: http://apps.worldagroforestry.org/sea/Publications/files/report/RP0305-15.pdf (Accessed November 1, 2013).
Arunrat, N., Pumijumnong, N., and Hatano, R. (2017). Practices sustaining soil organic matter and rice yield in a tropical monsoon region. Soil Sci. Plant Nutr. 63 (3), 274–287. doi:10.1080/00380768.2017.1323546
Austin, K. G., Mosnier, A., Pirker, J., Mccallum, I., Fritz, S., and Kasibhatla, P. S. (2017). Shifting patterns of oil palm driven deforestation in Indonesia and implications for zero-deforestation commitments. Land Use Pol. 69, 41–48. doi:10.1016/j.landusepol.2017.08.036
Azhar, B., Saadun, N., Prideaux, M., and Lindenmayer, D. B. (2017). The global palm oil sector must change to save biodiversity and improve food security in the tropics. J. Environ. Manag. 203, 457–466. doi:10.1016/j.jenvman.2017.08.021
Bowyer, C., and Kretschmer, B. (2010). Anticipated indirect land use change associated with expanded use of biofuels and bioliquids in the EU—an analysis of the national renewable energy action plans. Institute for European Environmental Policy. 24. Available at: https://www.foeeurope.org/sites/default/files/publications/iluc_report_november20101.pdf (Accessed March 1, 2011).
CAER (2017). Study project for development of oleochemical industrial from palm oil. Bangkok, Thailand: Office of Industrial Economics, Ministry of Industry.
Carlson, B. (2013). Gabon’s Overlooked Carbon: a tropical forest study of coarse woody debris. Glob. Chang. Biol. 38. doi:10.1111/gcb.13453
Carlson, K. M., Curran, L. M., Asner, G. P., Pittman, A. M., Trigg, S. N., and Marion Adeney, J. (2012). Carbon emissions from forest conversion by Kalimantan oil palm plantations. Nat. Clim. Change. 3, 283–287. doi:10.1038/nclimate1702
Cod (2018). Proposal for a Directive of the European Parliament and of the Council on the promotion of the use of energy from renewable sources—analysis of the final compromise text with a view to agreement. Brussels, Belgium: Council of the European Union, 23.
Frontier Engineering Consultants (2011). Feasibility study for the production of palm oil-based biodiesel at Bacho cooperative estate in Narathiwat Province. Bangkok, Thailand.
Cooper, H. V., Vane, C. H., Evers, S., Aplin, P., Girkin, N. T., and Sjögersten, S. (2019). From peat swamp forest to oil palm plantations: the stability of tropical peatland carbon. Geoderma. 342, 109–117. doi:10.1016/j.geoderma.2019.02.021
Corley, R. H. V. (2009). How much palm oil do we need? Environ. Sci. Pol. 12, 134–139. doi:10.1016/j.envsci.2008.10.011
Croezen, H. J., Bergsma, G. C., Otten, M. B. J., and Valkengoed, M. P. J. V. (2010). Biofuels: indirect land use change and climate impact. Delft, Netherlands: CE Delft Available at: https://www.cedelft.eu/publicatie/biofuels:_indirect_land_use_change_and_climate_impact/1068 (Accessed June 1, 2010).
Darnsawasdi, R., and Chitpong, P. (2002). “Wetland systems in southern Thailand: the essential resources for sustainable regional development,” in Proceedings of a conference on sustainability of wetlands and water resources, Oxford, Mississippi, May 23–25 2002. Editors M. M. Holland, M. L. Warren, and J. A. Stanturf, 43–46.
de Souza, S. P., Pacca, S., de Ávila, M. T., and Borges, J. L. B. (2010). Greenhouse gas emissions and energy balance of palm oil biofuel. Renew. Energy. 35, 2552–2561. doi:10.1016/j.renene.2010.03.028
Dewi, S., Khasanah, N., Rahayu, S., Ekadinata, A., and Van Noordwijk, M. (2009). Carbon footprint of Indonesian palm oil production: a pilot study. Bogor, Indonesia: SEA Regional Office, World Agroforestry Centre—Icraf.
Dib, J. B., Alamsyah, Z., and Qaim, M. (2018). Land-use change and income inequality in rural Indonesia. For. Policy Econ. 94, 55–66. doi:10.1016/j.forpol.2018.06.01
IPCC (Intergovernmental Panel on Climate Change) (2006). IPCC guidelines for national greenhouse gas inventories. Prepared by The National Greenhouse Gas Inventories Programme. Editors H. S. Eggleston, L. Buendia, K. Miwa, T. Ngara, and K. Tanabe. (Japan: Institute for Global Environmental Strategies). Available at: https://www.ipcc.ch/report/2006-ipcc-guidelines-for-national-greenhouse-gas-inventories/ (Accessed 2006).
Erasmi, S., and Twele, A. (2009). Regional land cover mapping in the humid tropics using combined optical and SAR satellite data—a case study from Central Sulawesi, Indonesia. Int. J. Rem. Sens. 30, 2465–2478. doi:10.1080/01431160802552728
Euler, M., Schwarze, S., Siregar, H., and Qaim, M. (2016). Oil palm expansion among smallholder farmers in Sumatra, Indonesia. J. Agric. Econ. 67, 658–676. doi:10.1111/1477-9552.12163
Evans, C. D., Page, S. E., Jones, T., Moore, S., Gauci, V., Laiho, R., et al. (2014). Contrasting vulnerability of drained tropical and high‐latitude peatlands to fluvial loss of stored carbon. Global Biogeochem. Cycles. 28 (11), 1215–1234. doi:10.1002/2013gb004782
Evrendilek, F., Berberoglu, S., Karakaya, N., Cilek, A., Aslan, G., and Gungor, K. (2011). Historical spatiotemporal analysis of land-use/land-cover changes and carbon budget in a temperate peatland (Turkey) using remotely sensed data. Appl. Geogr. 31, 1166–1172. doi:10.1016/j.apgeog.2011.03.007
Fargione, J., Hill, J., Tilman, D., Polasky, S., and Hawthorne, P. (2008). Land clearing and the biofuel carbon debt. Science. 319, 1235–1238. doi:10.1126/science.1152747
Fitzherbert, E. B., Struebig, M. J., Morel, A., Danielsen, F., Bruhl, C. A., Donald, P. F., et al. (2008). How will oil palm expansion affect biodiversity? Trends Ecol. Evol. 23, 538–545. doi:10.1016/j.tree.2008.06.012
Fuller, D. O., Hardiono, M., and Meijaard, E. (2011). Deforestation projections for carbon-rich peat swamp forests of Central Kalimantan, Indonesia. Environ. Manag. 48, 436–447. doi:10.1007/s00267-011-9643-2
Furumo, P. R., and Aide, T. M. (2017). Characterizing commercial oil palm expansion in Latin America: land use change and trade. Environ. Res. Lett. 12, 024008. doi:10.1088/1748-9326/aa5892
Germer, J., and Sauerborn, J. (2007). Estimation of the impact of oil palm plantation establishment on greenhouse gas balance. Environ. Dev. Sustain. 10, 697–716. doi:10.1007/s10668-006-9080-1
Giam, X., Hadiaty, R. K., Tan, H. H., Parenti, L. R., Wowor, D., Sauri, S., et al. (2015). Mitigating the impact of oil-palm monoculture on freshwater fishes in Southeast Asia. Conserv. Biol. 29, 1357–1367. doi:10.1111/cobi.12483
Gopal, B. (2013). Future of wetlands in tropical and subtropical Asia, especially in the face of climate change. Aquat. Sci. 75, 39–61. doi:10.1007/s00027-011-0247-y
Hansen, S. B., Olsen, S. I., and Ujang, Z. (2014). Carbon balance impacts of land use changes related to the life cycle of Malaysian palm oil-derived biodiesel. Int. J. Life Cycle Assess. 19, 558–566. doi:10.1007/s11367-013-0672-3
Hergoualc’h, K., and Verchot, L. V. (2011). Stocks and fluxes of carbon associated with land use change in Southeast Asian tropical peatlands: a review. Global Biogeochem. Cycles. 25 (2), 13. doi:10.1029/2009gb003718
Jaiarree, S., Chidthaisong, A., Tangtham, N., Polprasert, C., Sarobol, E., and Tyler, S. C. (2011). Soil organic carbon loss and turnover resulting from forest conversion to maize fields in Eastern Thailand. Pedosphere. 21, 581–590. doi:10.1016/s1002-0160(11)60160-4
Jauhiainen, J., and Silvennoinen, H. (2012). Diffusion GHG fluxes at tropical peatland drainage canal water surfaces. Suo. 63 (3–4), 93–105.
Kho, L. K., and Jepsen, M. R. (2015). Carbon stock of oil palm plantations and tropical forests in Malaysia: a review. Singap. J. Trop. Geogr. 36 (2), 249–266. doi:10.1111/sjtg.12100
Kim, S., and Dale, B. E. (2011). Indirect land use change for biofuels: testing predictions and improving analytical methodologies. Biomass Bioenergy. 35, 3235–3240. doi:10.1016/j.biombioe.2011.04.039
Koh, L. P., Miettinen, J., Liew, S. C., and Ghazoul, J. (2011). Remotely sensed evidence of tropical peatland conversion to oil palm. Proc. Natl. Acad. Sci. U. S. A. 108, 5127–5132. doi:10.1073/pnas.1018776108
Maimunah, S., Rahman, S. A., Samsudin, Y. B., Artati, Y., Simamora, T. I., Andini, S., et al. (2018). Assessment of suitability of tree species for bioenergy production on burned and degraded peatlands in central Kalimantan, Indonesia. Land. 7, 115. doi:10.3390/land7040115
Marshall, E., Caswell, M., Malcolm, S., Motamed, M., Hrubovcak, J., Jones, C., et al. (2011). Measuring the indirect landuse change associated with increased biofuel feedstock production: a review of modeling efforts. Washington, DC: United States Department of Agriculture.
Medrilzam, M., Dargusch, P., Herbohn, J., and Smith, C. (2014). The socio-ecological drivers of forest degradation in part of the tropical peatlands of Central Kalimantan, Indonesia. Forestry: Int. J. Financ. Res. 87, 335–345. doi:10.1093/forestry/cpt033
Minayeva, T., Sirin, A., Kershaw, P., and Bragg, O. 2017). Arctic peatlands. Mires Peat. 19, 1–15. doi:10.1007/978-94-007-6173-5_109-2
Moore, S., Evans, C. D., Page, S. E., Garnett, M. H., Jones, T. G., Freeman, C., et al. (2013). Deep instability of deforested tropical peatlands revealed by fluvial organic carbon fluxes. Nature. 493 (7434), 660–663. doi:10.1038/nature11818
Mukherjee, I., and Sovacool, B. K. (2014). Palm oil-based biofuels and sustainability in southeast Asia: a review of Indonesia, Malaysia, and Thailand. Renew. Sustain. Energy Rev. 37, 1–12. doi:10.1016/j.rser.2014.05.001
Murdiyarso, D., Hergoualc’h, K., and Verchot, L. V. (2010). Opportunities for reducing greenhouse gas emissions in tropical peatlands. Proc. Natl. Acad. Sci. U. S. A. 107, 19655–19660. doi:10.1073/pnas.0911966107
Nowak, K. (2012). Mangrove and peat swamp forests: refuge habitats for primates and felids. Folia Primatol. 83, 361–376. doi:10.1159/000339810
Othman, M. A., Ash’aari, Z. H., Aris, A. Z., and Ramli, M. F. (2018). Tropical deforestation monitoring using NDVI from MODIS satellite: a case study in Pahang, Malaysia. IOP Conf. Ser. Earth Environ. Sci. 169. doi:10.1088/1755-1315/169/1/012047
Page, S. E., Rieley, J. O., and Wüst, R. (2006). “Chapter 7 lowland tropical peatlands of Southeast Asia,” in Peatlands—evolution and records of environmental and climate changes. Amsterdam, Netherlands: Elsevier B.V. 145–172.
Petsri, S., Chidthaisong, A., Pumijumnong, N., and Wachrinrat, C. (2013). Greenhouse gas emissions and carbon stock changes in rubber tree plantations in Thailand from 1990 to 2004. J. Clean. Prod. 52, 61–70. doi:10.1016/j.jclepro.2013.02.003
Pibumrung, P., Gajaseni, N., and Popan, A. (2008). Profiles of carbon stocks in forest, reforestation and agricultural land, Northern Thailand. J. For. Res. 19 (1), 11–18. doi:10.1007/s11676-008-0002-y
Plevin, R. J., and Kammen, D. M. (2013). “Indirect land use and greenhouse gas impacts of biofuels,” in Encyclopedia of biodiversity. 2nd Edn, Editor S. A. Levin (Waltham, MA: Academic Press), 293–297.
Prabowo, D., Maryudi, A., Senawi, , and Imron, M. A. (2017). Conversion of forests into oil palm plantations in West Kalimantan, Indonesia: insights from actors’ power and its dynamics. For. Policy Econ. 78, 32–39. doi:10.1016/j.forpol.2017.01.004
Preechajarn, S. (2018). Thailand—oilseeds and products annual. Washington, DC: USDA Foreign Agricultural Service.
Ramsar (2011). Principles and guidelines for wetland restoration resolution. Gland, Switzerland: Ramsar Convention Bureau. VIII.16.
Reungsri, W., and Kanasut, J. (2017). “Phru to Daeng water management for flood mitigation in Golok river basin (in Thai),” in 10th Thaicid national symposium, Nonthaburi, Thailand, February 22, 2017.
Sanderman, J., Hengl, T., Fiske, G., Solvik, K., Adame, M. F., Benson, L., et al. (2018). A global map of mangrove forest soil carbon at 30 m spatial resolution. Environ. Res. Lett. 13 (5), 055002. doi:10.1088/1748-9326/aabe1c
Sano, E. E., Rosa, R., Brito, J. L. S., and Ferreira, L. G. (2010). Land cover mapping of the tropical savanna region in Brazil. Environ. Monit. Assess. 166, 113–124. doi:10.1007/s10661-009-0988-4
Saswattecha, K., Hein, L., Kroeze, C., and Jawjit, W. (2016). Effects of oil palm expansion through direct and indirect land use change in Tapi river basin, Thailand. Int. J. Biodivers. Sci. Ecosyst. Serv. Manag. 12, 1–23. doi:10.1080/21513732.2016.1193560
Schlesinger, W. H., and Bernhardt, E. S. (2013). Biogeochemistry: an analysis of global change. Cambridge, MA: Academic Press.
Shuit, S. H., Tan, K. T., Lee, K. T., and Kamaruddin, A. H. (2009). Oil palm biomass as a sustainable energy source: a Malaysian case study. Energy. 34, 1225–1235. doi:10.1016/j.energy.2009.05.008
Siangjaeo, S., Gheewala, S. H., Unnanon, K., and Chidthaisong, A. (2011). Implications of land use change on the life cycle greenhouse gas emissions from palm biodiesel production in Thailand. Energy Sustain. Dev. 15 (1), 1–7. doi:10.1016/j.esd.2011.01.002
Tarigan, S. D. (2018). Land use changes and plantation crop development in selected provinces in Sumatra and Kalimantan. IOP Conf. Ser. Earth Environ. Sci. 149, 012013. doi:10.1088/1755-1315/149/1/012013
Thongrak, S., Kiatpathomchai, S., and Kaewrak, S. (2011). “Baseline study of the oil palm smallholders in the project areas,” in Project of sustainable palm oil production for bio-energy. Songkhla, Thailand: GIZ ThailandAvailable at: https://www.rspo.org/publications/download/f74b475b1317c97 (Accessed January 2011).
Tonks, A. J., Aplin, P., Beriro, D. J., Cooper, H., Evers, S., Vane, C. H., et al. (2017). Impacts of conversion of tropical peat swamp forest to oil palm plantation on peat organic chemistry, physical properties and carbon stocks. Geoderma. 289, 36–45. doi:10.1016/j.geoderma.2016.11.018
Unjan, R. (2015). Impact of area expansion policy of oil palm on food security in Thailand—a case study of Khuan Kreng peat swamp in Nakhon Si Thammarat, Phatthalung and Songknla Provinces. PhD thesis. Songkla (Thailand): Prince of Songkla University.
van Beijma, S., Chatterton, J., Page, S., Rawlings, C., Tiffin, R., and King, H. (2018). The challenges of using satellite data sets to assess historical land use change and associated greenhouse gas emissions: a case study of three Indonesian provinces. Carbon Manag. 9, 399–413. doi:10.1080/17583004.2018.1511383
Van Der Laan, C., Wicke, B., and Faaij, A. (2015). Strategies to mitigate indirect land use change: illustrated for palm oil production in North and East Kalimantan, Indonesia. Utrecht, (Netherlands): Copernicus Institute of Sustainable Development, Utrecht UniversityAvailable at: https://www.uu.nl/sites/default/files/van_der_laan_et_al_2015_-_iluc_mitigation_report.pdf (Accessed April 2015).
Verstegen, J. A., van der Hilst, F., Woltjer, G., Karssenberg, D., de Jong, S. M., and Faaij, A. P. C. (2016). What can and can’t we say about indirect land-use change in Brazil using an integrated economic - land-use change model? GCB Bioenergy. 8, 561–578. doi:10.1111/gcbb.12270
Verwer, C. C., and van der Meer, P. J. (2010). Report No.: 2108. Carbon pools in tropical peat forest: towards a reference value for forest biomass carbon in relatively undisturbed peat swamp forests in Southeast Asia. Wageningen (Netherlands): Alterra. Available at: https://edepot.wur.nl/160910 (Accessed December 2010).
Wicke, B., Sikkema, R., Dornburg, V., and Faaij, A. (2011). Exploring land use changes and the role of palm oil production in Indonesia and Malaysia. Land Use Policy. 28, 193–206. doi:10.1016/j.landusepol.2010.06.001
Wüst, R., Rieley, J., Page, S., Van Der Kaars, S., and Wang, W.-M. (2007). Peatland evolution in Southeast Asia during the last 35,000 cal years: implications for evaluating their carbon storage potential.
Yoshino, K., Nagano, T., Ishida, T., Ishioka, Y., and Sirichuaychoo, W. (2002). Distribution od peat depth in tropical peat swamp area in Narathiwat of the southern part of Thailand: building an ecological environmental GIS database for monitoring carbon balance. Rural Environ. Eng. 43, 13–22.
Zen, Z., Barlow, C., and Gondowarsito, R. (2006). Oil palm in Indonesian socio-economic improvement: a review of options. Canberra (Australia): Australian National University.
Keywords: tropical peatland, land-use and cover change, carbon storage, peat swamp forests, palm oil
Citation: Srisunthon P and Chawchai S (2020) Land-Use Changes and the Effects of Oil Palm Expansion on a Peatland in Southern Thailand. Front. Earth Sci. 8:559868. doi: 10.3389/feart.2020.559868
Received: 07 May 2020; Accepted: 23 October 2020;
Published: 24 November 2020.
Edited by:
Basilios Tsikouras, Universiti Brunei Darussalam, BruneiReviewed by:
Milad Janalipour, K.N.Toosi University of Technology, IranStavros Kalaitzidis, University of Patras, Greece
Copyright © 2020 Srisunthon and Chawchai. This is an open-access article distributed under the terms of the Creative Commons Attribution License (CC BY). The use, distribution or reproduction in other forums is permitted, provided the original author(s) and the copyright owner(s) are credited and that the original publication in this journal is cited, in accordance with accepted academic practice. No use, distribution or reproduction is permitted which does not comply with these terms.
*Correspondence: Sakonvan Chawchai, c2Frb252YW4uY0BjaHVsYS5hYy50aA==