 J. B Keane
 S. Toet2
 P. Weslien
 J. E. Stockdale
- 1Department of Animal and Plant Sciences, The University of Sheffield, Sheffield, United Kingdom
- 2Department of Environment and Geography, University of York, York, United Kingdom
- 3Department of Biology, University of York, York, United Kingdom
- 4Department of Earth Sciences, University of Gothenburg, Gothenburg, Sweden
Globally peatlands store 500 Gt carbon (C), with northern blanket bogs accumulating 23 g C m−2 y−1 due to cool wet conditions. As a sink of carbon dioxide (CO2) peat bogs slow anthropogenic climate change, but warming climate increases the likelihood of drought which may reduce net ecosystem exchange (NEE) and increase soil respiration, tipping C sinks to sources. High water tables make bogs a globally important source of methane (CH4), another greenhouse gas (GHG) with a global warming potential (GWP) 34 times that of CO2. Warming may increase CH4 emissions, but drying may cause a reduction. Predicted species composition changes may also influence GHG balance, due to different traits such as erenchyma, e.g., Eriophorum vaginatum (eriophorum) and non-aerenchymatous species, e.g., Calluna vulgaris (heather). To understand how these ecosystems will respond to climate change, it is vital to measure GHG responses to drought at the species level. An automated chamber system, SkyLine2D, measured NEE and CH4 fluxes near-continuously from an ombrotrophic fen from August 2017 to September 2019. Four ecotypes were identified: sphagnum (Sphagnum spp), eriophorum, heather and water, hypothesizing that fluxes would significantly differ between ecotypes. The 2018 drought allowed comparison of fluxes between drought and non-drought years (May to September), and their recovery the following year. Methane emissions differed between ecotypes (p < 0.02), ordered high to low: eriophorum > sphagnum > water > heather, ranging from 23 to 8 mg CH4-C m−2 d−1. Daily NEE was similar between ecotypes (p > 0.7), but under 2018 drought conditions all ecotypes were greater sources of CO2 compared to 2019, losing 1.14 g and 0.24 g CO2-C m−2 d−1 respectively (p < 0.001). CH4 emissions were ca. 40% higher during 2018 than 2019, 17 mg compared to 12 mg CH4-C m−2 d−1 (p < 0.0001), and fluxes exhibited hysteresis with water table depth. A lag of 84–88 days was observed between rising water table and increased CH4 emissions. A significant interaction between ecotype and year showed fluxes from open water did not return to pre-drought levels. Our findings suggest that short-term drought may lead to a net increase in C emissions from northern wetlands.
Introduction
Peatlands are found across the northern hemisphere and are a globally important store of approximately 500 Gt carbon (C) (Yu, 2012). These ecosystems have accumulated ca. 23 g C m−2 y−1 following the last ice age through peat formation from undecomposed organic material due to the prevailing cool wet conditions (Billett et al., 2010). As a sink of carbon dioxide (CO2) they act as an important brake on anthropogenic climate change (Strack and Waddington, 2008). Due to the anaerobic conditions caused by high water tables, these bogs are also a major source of methane (CH4) (IPCC, 2014), an important greenhouse gas (GHG) with a global warming potential (GWP) 34 times that of CO2 (IPCC, 2014).
In the warming climate, rainfall is predicted to become more variable, increasing the likelihood of drought in these landscapes (Arneth et al., 2019). Simulated drought has been shown to decrease the productivity of the common blanket bog species, sphagnum mosses (Sphagnum spp.) (Lees et al., 2019), eriophorum (Eriophorum vaginatum) (Buttler et al., 2015) and heather (Calluna vulgaris) (Ritson et al., 2017). Such a reduction in primary productivity, alongside increased soil respiration (Rs) due to warming (Bond-Lamberty et al., 2004) will, by definition, lead to reduced net ecosystem exchange (NEE) of CO2 (reduced C uptake) and might cause these important C sinks to become sources.
It is further expected that the changing climate will alter the species composition of northern wetlands (Robroek et al., 2017), which may also have an influence on the GHG balance of these systems. A key functional trait of some blanket bog species, including eriophorum, is erenchyma which have been shown to increase (Greenup et al., 2000) and decrease CH4 emissions (Dinsmore et al., 2009). Additionally, pools of water within wetlands are known to be ‘hotspots’ of CH4 emissions (Cooper et al., 2014) and the depth of water table within blanket bog has been shown to have a significant effect on GHG emissions (Dinsmore et al., 2009). Thus, in order to understand how northern peatlands will respond to climate change it is vital to understand how drought will affect the GHG balance at the species-ecotype level. Measuring GHG fluxes at a spatial resolution suitable to achieve this has often been conducted using manual chambers (e.g., Kutzbach et al., 2004; Juszczak and Augustin 2013; Rigney et al., 2018; Rey-Sanchez et al., 2019), but it has been demonstrated that GHGs may exhibit unusual diurnal variation (Keane and Ineson, 2017; Jarveoja et al., 2020), and particularly CH4, may be released in rapid pulses following changes to water table depth (Dinsmore et al., 2009). Since such pulses may contribute a large proportion of the annual GHG flux, it is essential to monitor at a suitable frequency to detect rapid changes in flux dynamics. We therefore used an automated chamber system, SkyLine2D, to measure CO2 and CH4 fluxes quasi-continuously from an ombrotrophic blanket peat bog.
The peatland had been surveyed prior to the study period, and had identified four general ecotypes present, consisting of different functional types: sphagnum, eriophorum, heather and open water. Water depth of the pools was up to ca. 20 cm over sediment and some moss. During the drought period the substrate was exposed when the water table dropped. We followed the fluxes of CO2 and CH4 within the fen over the course of 27 months, starting in August 2017, to investigate how GHG fluxes differed between areas dominated by different ecotypes. Since peatland pools are known to be important sources of CH4 (Waddington and Roulet, 1996; Pelletier et al., 2014), we hypothesized that CH4 fluxes would be highest from the open water and, due to erenchymatous tissue, eriophorum (Greenup et al., 2000; McNamara et al., 2008), and would be lowest from the heather, which prefers drier tussocks. A second hypothesis was that we would detect differences in NEE between ecotypes: faster growth rates of eriophorum and heather (Milne et al., 2002) compared to sphagnum (Bengtsson et al., 2016) would suggest that photosynthesis would be greater in these two ecotypes, though their preference for drier conditions could also lead to greater Rs, countering C uptake. By measuring NEE, we were able to determine the net C balance of these two GHGs, and to investigate their relative contribution toward a net sink or source in this landscape. The study period included the two full growing seasons of 2018 and 2019, very distinct years in which a prolonged drought period (2018) was followed by a year of more typical conditions, enabling observation of response and recovery of the ecosystem GHG balance to the very dry and warm summer conditions that are predicted to occur more often over the coming decades.
Materials and Methods
Site Description
All work was undertaken at Mycklemossen, an ombrotrophic mire ca. 100 km north of Gothenburg, Sweden (58.36732626 N, 12.16856373 E, ca. 75 m asl). The site is part of the Skogaryd research catchment, which has been monitored since 2013. Mycklemossen is a hemi-boreal bog-like fen, vegetated predominantly by heather (Calluna vulgaris), sphagnum moss (Sphagnum spp.) and sedges (Eriophorum vaginatum) and during typical conditions the water table is high enough so that there are areas of open water within the mire year-round. In 2018 the mire experienced drought conditions, receiving less rainfall, higher temperatures and more solar radiation than in 2019 (Table 1).
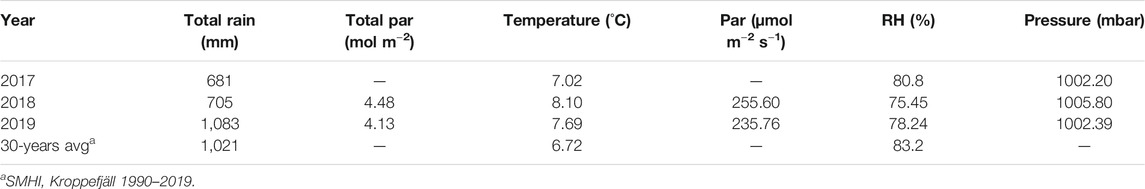
TABLE 1. Summary of meteorological conditions at Mycklemossen in 2017, 2018, 2019, and 1990–2019. Values are annual means unless otherwise stated.
Experimental Design
In January 2017 a transect within the mire, comprising all the vegetation types, was selected and marked out. Spatial blocks were defined along the transect, and within each block replicate points were identified at random and classified as either sedge (eriophorum n = 6), heather (calluna n = 6), sphagnum (sphagnum n = 6) or open water (water n = 6). At each of the 24 measurement points a PVC collar (inner diameter 20 cm, height 10 cm) was inserted ∼2 cm below the soil surface, or into the sediment at the water positions.
GHG Flux Measurements
Surface GHG fluxes were measured along the transect using SkyLine2D, an automated chamber system designed and built at the University of York. For a full description of the SkyLine2D system, see Keane et al. (2018). Briefly, the equipment comprised a single, clear cylindrical chamber (Perspex, inner diameter 20 cm, height 40 cm), suspended from a motorized trolley, programmed to traverse on parallel ropes ca. 2 m above the transect. The ropes were anchored from a vertical aluminum mast at one end and a tree at the other (Figure 1). The system was programmed to repeatedly visit the pre-selected positions on the transect, where the chamber was lowered to sit on a collar to complete a gas flux measurement over a period of 4 min. Upon completion of the programmed chamber closure, the system raised the chamber and moved to the next position to repeat the process. The time taken to complete a full cycle was approximately 2.5 h, which allowed each chamber to be measured ca. 10 times per day.
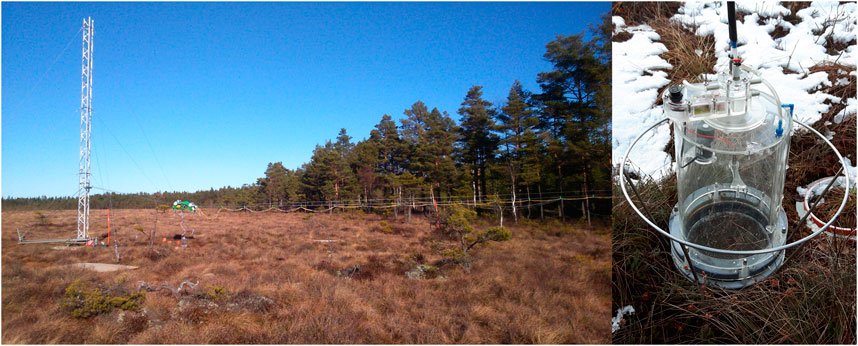
FIGURE 1. The SkyLine2D system used for GHG measurements at the Mycklemossen field site.
The headspace gas from within the chamber was circulated in series through a Licor infrared gas analyser (IRGA, LI-8100, Licor, NE, United States) to measure CO2 and a cavity ringdown laser (CRD, LGR U-GGA-91, Los Gatos Research, CA United States) to measure both CO2 and CH4. The chamber design does not include a fan for mixing based upon previous tests: a comparison of fluxes measured with and without a fan and sampling the headspace from the full height profile of the chamber detected no significant differences (Keane et al., 2018), indicating that the flow of the analyser was sufficient to achieve complete mixing of the chamber (see Supplementary Material). Data from both analysers were recorded on a data logger (CR1000x, Campbell Scientific, UT USA). Fluxes of CO2 and CH4 were calculated using linear regression to determine the rate of change of gas concentrations; a deadband of at least 20 s was allowed for the chamber headspace to mix and a window of 90 s was used for CO2 and 240 s used for CH4. Fluxes were adjusted for area, air temperature and gas volume (Mosier, 1989). Further adjustment was made to the CO2 fluxes during daylight hours based upon the light response curve to account for attenuation of light by the chamber material, after Heinemeyer et al. (2013).
Environmental Variables
Air temperature and relative humidity were measured by a HC2S3 sensor (Rotronic, Switzerland) mounted in a ventilated radiation shield at 1.5 m height. Incoming and reflected short- and longwave radiation were measured by a NR01 net radiometer (Hukseflux, the Netherlands) at 3 m height. Precipitation was measured by a tipping bucket rain gauge (SBS500H, Campbell Scientific, United Kingdom). Soil variables including soil temperature (107 thermistors, Campbell Scientific, United Kingdom) and ground water level (CS450, Campbell Scientific, UT United States) were measured at three different locations, representing dry, wet and intermediate conditions, characterized by heather, sphagnum and intermediate vegetation respectively. Soil temperatures were measured at 2, 6, 12, 18, 30, and 60 cm depth at each profile. All meteorological variables were measured at 1 Hz and recorded as 30United Statesmin averages on a data logger (CR1000, Campbell Scientific, UT United States).
Data Processing
All data manipulation, analyses and figures were produced using SAS 9.4 (SAS Institute, CA United States). GHG flux data (for both CO2 and CH4) were quality controlled in the first instance using the R2 statistic of the CO2 flux measurement, with values < 0.9 discarded. Measurements passing this threshold were then assessed using the output statistics from the regression calculation of CH4 fluxes, where regressions with a p value < 0.05 were accepted, while those that did not were treated as zero flux. Data outliers were defined as those ±1.96 standard errors of the mean flux value for each collar and were excluded from the analyses. Data were further filtered to account for overestimation of fluxes during still atmospheric nighttime conditions (Lai et al., 2012; Koskinen et al., 2014). Using the procedure outlined in Jarveoja et al. (2020), fluxes where the mean CO2 concentration for the 20 s period before and after chamber closure dropped by more than 25 ppm where discounted. This led to 329 fluxes being excluded. Differences of NEE and CH4 fluxes between ecotypes and years were investigated using linear mixed effects models, using the differences of least square means as post hoc tests on significant effects. Cumulative fluxes were calculated using trapezoidal integration. Regression models were constructed for the daily means of fluxes and environmental measurements, first testing drivers of individual years, then pooling the data from all years. Further analysis of CH4 fluxes was undertaken by construction of forward stepwise multiple regression models of daily mean flux and daily means of environmental variables.
Results
CO2 Fluxes
NEE of CO2 was characterized by positive and negative (net uptake from the atmosphere) fluxes of CO2 across all ecotypes (Figure 2). The largest range of fluxes was seen during July and August of all 3 years, where photosynthesis was strongest during the daytime and ecosystem respiration during the night-time (Figure 2). A seasonal trend was seen across all years, with fluxes increasing through the spring and decreasing again during autumn. In August 2017, daily mean NEE was negative in both sphagnum and water ecotypes but positive in both August 2018 and 2019. From October 2017 until the end of that year, NEE reduced in daily range and tended toward a daily mean of zero. 2018 was characterized by a reduction in negative CO2 fluxes (Figure 2). Daily mean NEE was almost exclusively positive for all ecotypes in 2018, and by October was again tending toward a net zero flux. The following year NEE was more typical, with daily mean negative fluxes seen across all ecotypes during late April and May 2019. NEE was much more strongly negative during July and August 2019 than in 2018, although the daily mean flux for all ecotypes was positive during this period, most clearly in sphagnum and intermediate ecotypes. Fluxes reduced and trended toward zero by October 2019.
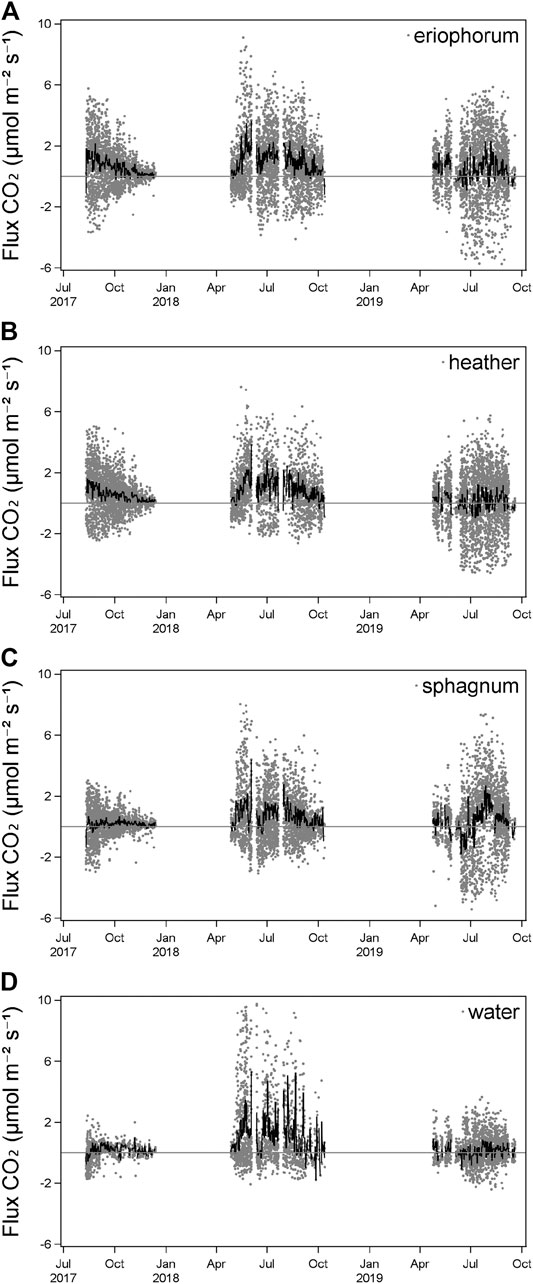
FIGURE 2. Individual chamber measurements of NEE (gray points) and daily mean (n = 6, black line) of each ecotype.
CH4 Fluxes
All fluxes of CH4 recorded were positive at this site, indicating net release to the atmosphere. A strong seasonal pattern of CH4 fluxes was observed across all years, with highest fluxes occurring during July and August, for all ecotypes (Figure 3), where fluxes in excess of 100 nmol m−2 s−1 were seen from the open water and sphagnum.
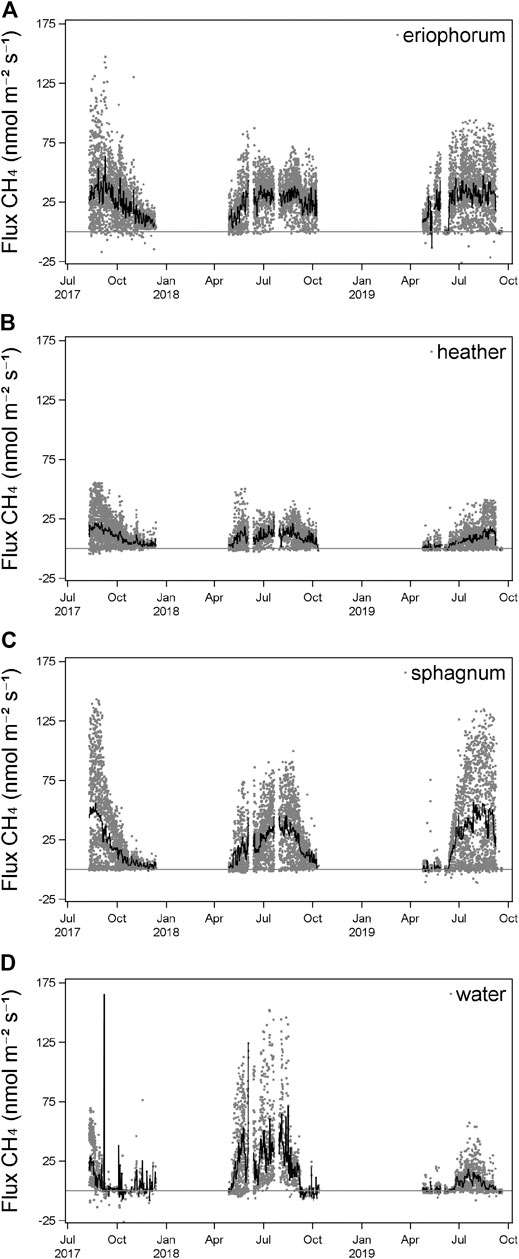
FIGURE 3. Individual chamber measurements of CH4 (gray points) and daily mean (n = 6, black line) of each ecotype.
Cumulative Fluxes
Flux measurements began in autumn 2017 toward the end of that year’s growing season. This is reflected in the positive cumulative flux of CO2 (Figure 4) for all ecotypes that year. In 2018, from the start of April, the accumulated flux of CO2 was positive and never dropped below zero for any ecotype, indicating a loss of carbon from the mire that year. This was in contrast with 2019, when the cumulative NEE was negative until day 200 for sphagnum, and net zero was also within the measurement uncertainty for heather, water and eriophorum (Figure 4). All ecotypes proceeded to be a source of CO2 in the second half of the year in 2019, with the most positive flux observed in the eriophorum and the intermediate, with heather, sphagnum and water all remaining close to carbon neutral. There were no significant differences in the daily total CO2 flux between ecotypes, F = 0.19, p > 0.9 (Figure 5). Across all ecotypes, there was a net loss of 1.13 g CO2-C m−2 d−1 in 2018 which was significantly greater than C losses of 0.24 g CO2-C m−2 d−1 in 2019, F = 112.24, p < 0.001.
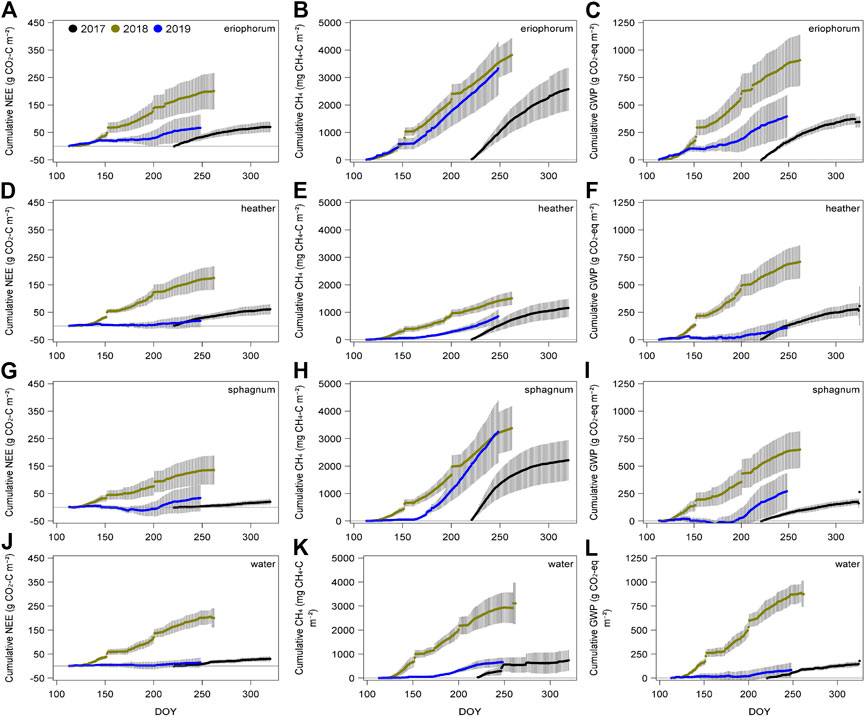
FIGURE 4. Mean daily cumulative fluxes of CO2 (A,D,G,J), CH4 (B,E,H,K) and aggregated CO2 and CH4 in terms of global warming potential (IPCC, 2013, C,F,I,L) for each ecotype (n 6, ± 1 SE) for 2017 (black line), 2018 (olive line) and 2019 (blue line).
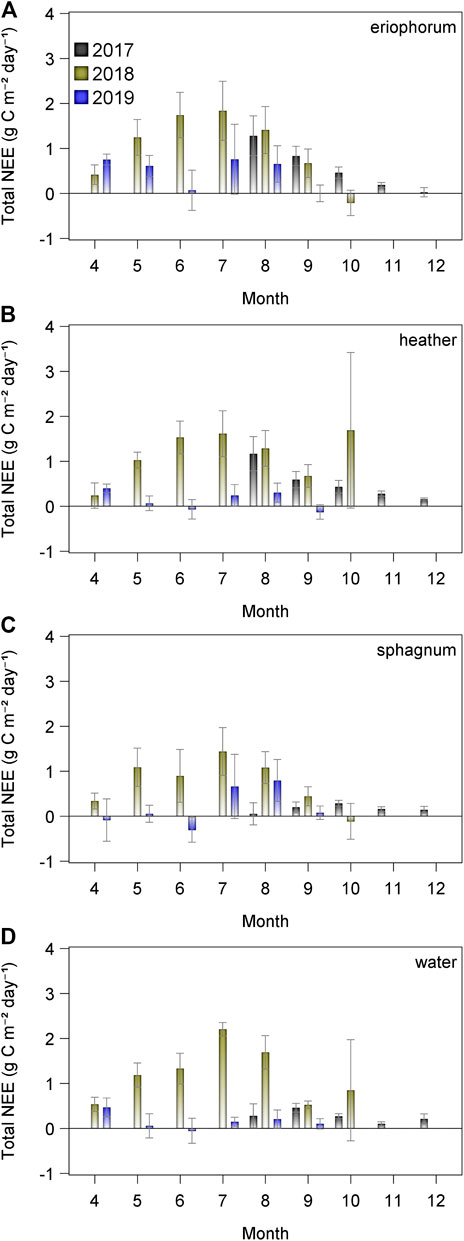
FIGURE 5. Total monthly flux of CO2 from each ecotype (n = 6, ± 1SE) for 2017 (black), 2018 (olive) and 2019 (blue).
Over the entire study period, there was a significant effect of ecotype on the daily CH4 fluxes, F = 3.05, p = 0.03, with the highest mean emissions of 23 mg CH4-C m−2 d−1 observed in the eriophorum (Figure 6), differing from all other ecotypes except sphagnum (16 mg CH4-C m−2 d−1); the next highest flux was seen from the water (10 mg CH4-C m−2 d−1), then heather (8 mg CH4-C m−2 d−1). Emissions of CH4 were ca. 40% higher during the drought of 2018 (17 mg CH4-C m−2 d−1) than in 2019 (12 mg CH4-C m−2 d−1), F = 34.93, p < 0.0001, however, there were significant interactions between year and month (F = 4.50, p < 0.001), ecotype and year (F = 6.74, p < 0.001) and ecotype, year and month (F = 2.12, p < 0.02). Post hoc tests reveal that, despite CH4 emissions being higher during spring of 2018, in the late summer, fluxes declined and were lower than in 2019, especially in the high flux ecotypes of eriophorum and sphagnum (Figures 6A,C).
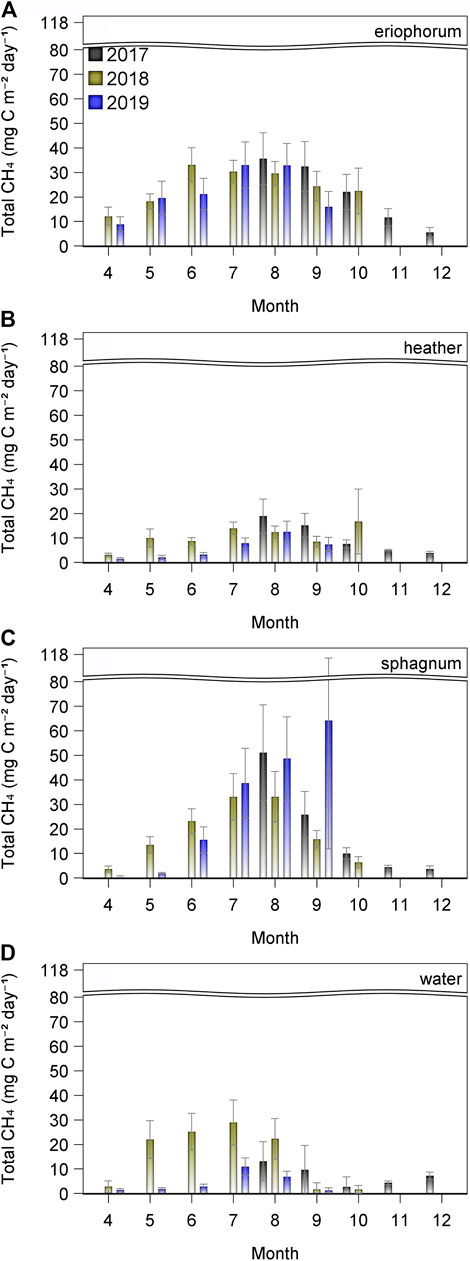
FIGURE 6. Total monthly flux of CH4 from each ecotype (n = 6, ± 1SE) for 2017 (black), 2018 (olive) and 2019 (blue).
Net Greenhouse Gas Balance
The total global warming potential (GWP) was calculated at the end of the summer (defined as day 240) for both 2018 and 2019. Annual GWP did not significantly differ between ecotypes, F = 0.51 p < 0.7, in 2018 ranging from a high of 823 g CO2-eq m−2 in eriophorum and a low of 649 g CO2-eq m−2 in the heather; this was in contrast with 2019, where the range of 370 g CO2-eq m−2 in the eriophorum to 74 g CO2-eq m−2 in the water (Figure 4, right hand column) was significantly higher than in 2018, F = 47.66, p < 0.001. This difference was driven by the change in the proportion of net CO2 fluxes to the CH4 emissions, with non-significant increases in the contribution of CH4 fluxes to the total GWP seen from 2018 to 2019 from 31% in 2018 to 81% in eriophorum, and in sphagnum from 26 to 150%.
Environmental Controls
A warm dry spring in 2018 was characterized by high temperatures during May, with air temperature frequently approaching 30°C, which in turn saw a sharp rise in soil temperature from close to zero at the end of April to 15°C a couple of weeks later (Figure 7). This continued throughout June and July, which alongside periods of weeks without rain caused the water table to drop below 40 cm (Figure 7). These drought conditions started in the second half of 2017 and persisted for 18 months. Relative to the thirty-year average, air temperature was + 1.38°C, rainfall – 378 mm (ca. 35%) and relative humidity was 8% (Table 1). In contrast, rainfall was much more evenly spread during 2019, with 62 mm more rain than the thirty-year average, and the water table remained closer to the surface, except for a few weeks during August.
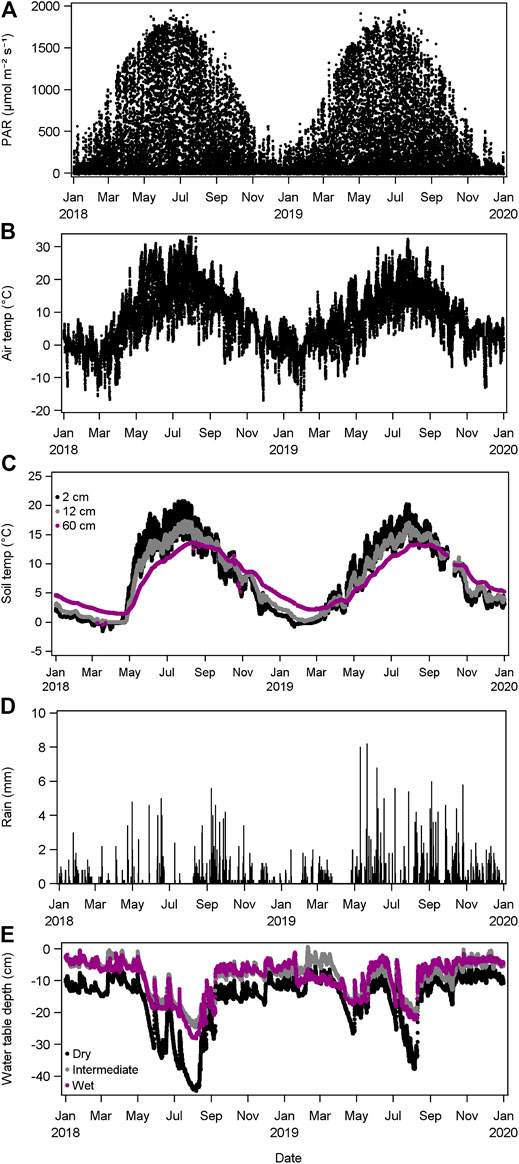
FIGURE 7. Environmental variables measured at the study site during 2018–2019. (A) Photosynthetically active radiation; (B) air temperature; (C) Soil temperature at 2 cm, 12 cm and 60 cm; (D) rainfall; (E) water table depth measured at three locations.
Sub-diel variation of NEE was best explained by radiation (Supplementary Figure S2), but daily fluxes displayed positive relationships with air temperature in all ecotypes except water, ranging from R2 = 0.16 (sphagnum) to R2 = 0.08 (heather); daily variation from water ecotypes was positively related to relative humidity (R2 = 0.12).
Relationships between daily CH4 fluxes and environmental variables were also closely related to soil temperature, ranging from strong relationships in sphagnum (R2 = 0.69), eriophorum (R2 = 0.37), and heather (R2 = 0.38), with much weaker, but significant relationships in water (R2 = 0.11) (Figure 8A). The depth at which soil temperature had the strongest effect differed between ecotypes, with temperature at 12 cm controlling sphagnum fluxes, 18 cm in eriophorum and heather and 60 cm in mix and water ecotypes.
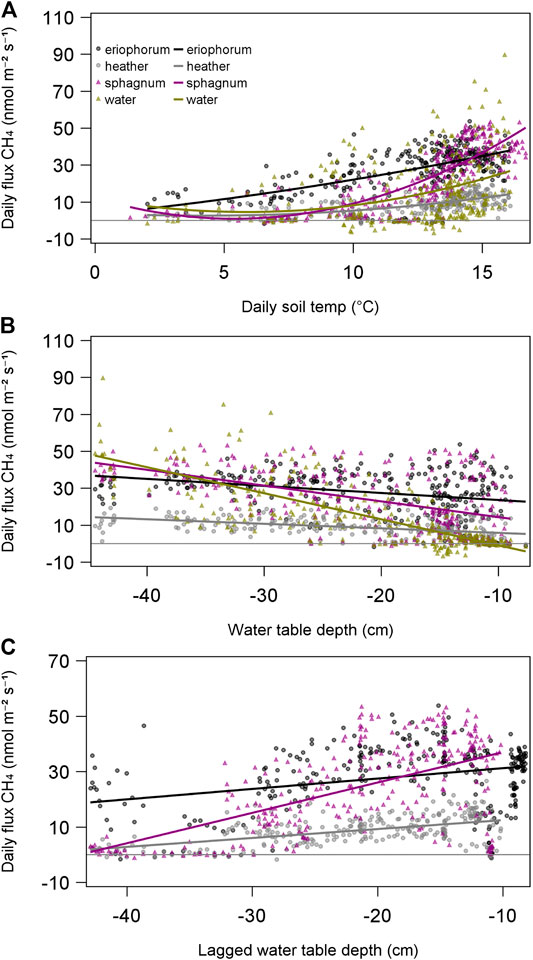
FIGURE 8. Effect of soil temperature (A) and water table (B) on daily mean CH4 flux from each ecotype. Hysteresis of CH4 flux response to water is illustrated by the negative relationship of fluxes to concurrent measurements of water table depth. A delayed response is apparent when fluxes are regressed against a lagged running average of water table depth (except in the open water ecotype), with the lag varying between 84 days (eriophorum) and 86 days (sphagnum) (C).
Concurrent measurements of water table depth displayed negative relationships with CH4 emissions from all ecotypes (Figure 8B), with the strongest effect seen in the water ecotype (R2 = 0.53), and the weakest seen in eriophorum (R2 = 0.09). It might be expected to see relationships of CH4 emission with water table, since methanogenesis would be expected to take place in anaerobic conditions. Only by looking at delayed responses of fluxes to water table did a positive effect become apparent, in all ecotypes with the exception of water, which remained a negative relationship (Figure 8C). The delay of the response of CH4 flux to water table depth, i.e. the lag at which the strongest relationship was seen, was around three months for all ecotypes, eriophorum (84 days, R2 = 0.42), heather (86 days, R2 = 0.42), sphagnum (86 days, R2 = 0.51) except water (zero days, R2 = 0.30).
Using the all the measured environmental variables, multiple regression analyses revealed that soil temperature and lagged water table depth were the two most important drivers of CH4 fluxes from eriophorum (R2 = 0.37), heather (R2 = 0.46) and sphagnum (R2 = 0.73), but the story was less clear in water, where concurrent water table depth and relative humidity were important drivers (R2 = 0.60) (Table 2).
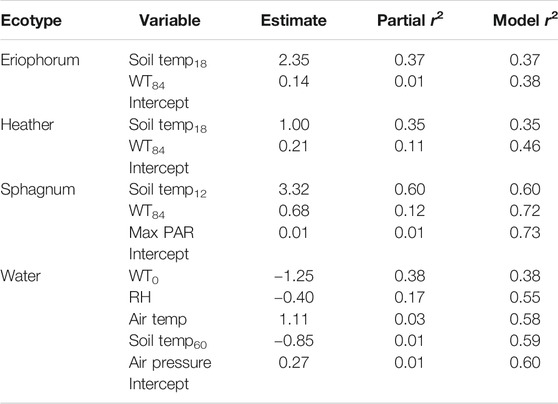
TABLE 2. Multiple regression models of significant (p < 0.05) environmental variables on CH4 fluxes. Subscripts for soil temperature indicate depth and for water table number of lagged days.
Discussion
Drought conditions in 2018 saw GHG emissions from a hemiboreal bog increase, ensuring that this important landscape was a greater net C source that year. The GHG increase was driven largely by a decline in photosynthesis, with NEE remaining positive during 2018 compared to 2019. This decline in C uptake by the vegetation might have been expected to be offset by a decline in CH4 emissions under drier conditions. However, due to a delayed response to water table depth, CH4 fluxes did not fall until the second half of summer 2018, ensuring that the GHG balance was higher than in 2019, under more typical conditions. In fact, the rapid warming of soil during May 2018 drove a pulse of CH4 not seen the subsequent year. The annual fluxes reported here of 3,000–4,000 mg CH4-C from eriophorum, sphagnum and water (in 2018) approximate closely to the median emissions reported across all northern peatlands of 3,300–6,300 mg CH4-C (Abdalla et al., 2016), and the monthly averages from sphagnum and eriophorum were similar to the growing season fluxes reported elsewhere (Roulet et al., 1992; Grondahl et al., 2008; Dinsmore et al., 2017). Mean summertime emissions of five times the magnitude that we report have been observed from sphagnum lawns (Kettunen et al., 1996) where the water table was consistently above 5 cm year-round.
Effect of Ecotype on GHG Fluxes
As we hypothesized, the lowest average CH4 emissions were seen from heather, and the greatest from eriophorum, which is known to be erenchymatous (Smirnoff and Crawford, 1983; Camill, 1999) and develop deep rooting systems to the full depth of the active layer (Wein, 1973). This physiology facilitates the transport of CH4 formed at depth in the peat to be transported directly to the atmosphere, by-passing erobic upper layers of the soil in which CH4 oxidizing microbes can reduce net CH4 emissions (Raghoebarsing et al., 2005; Kip et al., 2010; Rahman et al., 2011). Our finding is consistent with previous studies which have shown that eriophorum cover is directly correlated to the magnitude of CH4 fluxes (McNamara et al., 2008; Cooper et al.,2014). In this current study, sphagnum and water ecotypes were also associated with high CH4 emissions, which were the wettest of the ecotypes and indicative of conditions favoring CH4 production. Sphagnum cover is associated with areas of CH4 emission in peat soils (Roura-Carol and Freeman, 1999; Dinsmore et al., 2017), often forming floating mats on ground water surface. The ecotype with the lowest CH4 emissions was heather, consistent with previous work (Grondahl et al., 2008); heather dominated the driest areas of the bog, where it would be expected to see a combination of lowest CH4 formation and highest CH4 oxidation, due to the erobic conditions.
Effect of Drought on GHG Fluxes and Balance
The biggest effect of the drought in 2018 was an increase in net CO2 emissions. Although photosynthesis is controlled by radiation, the warmer, drier conditions of 2018 stimulated increased respiration so that CO2 losses exceeded uptake. Light response curves indicated that photosynthesis was lower during the drought of 2018 (Supplementary Figure S2) and that it saturated at lower light levels than under the more usual conditions of 2019. A lower water table in 2018 increased the oxygenation of the soil profile, exposing much of the accumulated organic matter to erobic decomposition. The extent of the water table drop was such that, for most of 2018, the areas which were covered by open water during the establishment of the study dried out and exposed the underlying peat and vegetation. Under more typical conditions of 2019, most ecotypes reverted to C sinks until late in the year when photosynthesis declined due to reduced hours of daylight. With the exception of eriophorum, at the end of the growing season net zero CO2 flux was within the error term of the cumulative NEE. However, once the winter CO2 and CH4 fluxes have been considered, the site was still a net C source under more typical conditions. While this may be unusual for other similar wetlands, which are commonly seen to be C sinks (Campbell et al., 2019; Mazzola et al., 2020; Mehtatalo et al., 2020; Rinne et al., 2020), it is not unusual for this site under 30-years average climatic conditions (Rinne et al., 2020).
The most important driver of CH4 fluxes at this site was soil temperature, with the warmer spring of 2018 driving an increase in fluxes. While water table was also significantly related to CH4 emissions, it appeared to be a delayed effect rather than an instantaneous one, with contemporaneous water table depth appearing to have a negative effect on CH4 emissions. Superficially this was a surprise, since CH4 emissions are greatest in wetter organic soil ecosystems (e.g., Roulet et al., 1992; Levy et al., 2012), and the wettest areas within such ecosystems (Macdonald et al., 1996; Dinsmore et al., 2017). However, a negative relationship between water table depth and CH4 emission has been reported several times from ecosystems similar to the current study site (Kettunen et al., 1996; McNamara et al., 2008; Dinsmore et al., 2009), though the reasons for such a relationship appear to be poorly understood. However, an explanation may lie in a lag between CH4 emissions and increasing water table, which has been described previously, though the lag is generally less than two weeks (Goodrich et al., 2015; Chamberlain et al., 2016). Several factors may contribute to such a lag: drying of the peat profile will reduce the methanogen population (Tian et al., 2012) and the severity of dieback is related to the strength of drought conditions (Estop-Aragones et al., 2013); during drought, the C substrates for methanogenesis are exposed to erobic conditions, leading to rapid decomposition (Goodrich et al., 2015), thus it can take time to replenish substrate once the water table rises; another consequence of erobic drought conditions is that alternative electron acceptors can build up in the peat (Knorr et al., 2009) and the preferential use of these over acetate and CO2 following rewetting slows the rate of CH4 production (Yavitt and Seidmann-Zager, 2006). While the lag described in the present study is larger than commonly reported, it is not inconceivable that a combination of depleted substrate, reduced methanogen population and alternative electron acceptors persisted for the lag period we report. A theoretical explanation for such a negative effect of water table on CH4 flux was provided by Stockdale et al. (2012) in which the author proposes a delay between water table depth and emission, which has further been supported experimentally in manipulated microcosms where a four-month delay was seen before CH4 emissions increased (Stockdale et al., 2014). This timescale is similar to the delay of 84–88 days between water table and CH4 fluxes observed from the terrestrial ecotypes at the current study site.
A further possible explanation for the delayed response of fluxes to water table is that the effect of temperature was a much stronger influence. It is clear that soil temperature was the most important factor controlling CH4 emissions. In wetlands, under anaerobic conditions, methanogenesis is known to be directly dependent on temperature and substrate availability (Segers, 1998), and microcosm experiments have shown CH4 emissions to increase from sphagnum under elevated temperatures (van Winden et al., 2012). Given that CH4 flux is the balance between microbial production and oxidation of CH4, identifying a single driver is challenging and perhaps misguided. Hotspots of CH4 production are known to occur at suitable microsites within peat soil profiles (Laing et al., 2010) and we suggest that our data indicate that, despite water table dropping as low as 40 cm below the vegetation-air interface, there remained sufficient anaerobic microsites within the soil profile to sustain methanogenesis at all times. This would be further supported by the highest fluxes from eriophorum, whose deep roots (Bliss, 2000) will likely have remained below the water table even during the driest periods. The rapidly warming soil temperatures of May 2018 increased the rate of microbial activity at such sites within the peat and also coincided with increasing photosynthetic activity of the aboveground vegetation and the resultant supply of substrate for CH4 production. If the rate of CH4 production was greater than oxidation, this would result in increased emissions. In the low flux ecotypes, the effect of water table was less important.
Implications for Hemiboreal Wetlands Under Future Climate
The significant interaction of CH4 emissions between ecotype and year demonstrated how common bog species differed in their response to drought conditions. Recovery of CH4 fluxes from sphagnum and eriophorum late in 2019 contrasted with the suppressed emissions from heather and in particular, open water. Under predicted changes to climate, it is likely that precipitation patterns in the northern hemisphere will alter, so that periods without rain are interspersed by more intense rainfall events, in a drought-deluge pattern (Arneth et al., 2019). It has been known for 25 years that sphagnum-dominated wetland C sinks are at risk from drought (Alm et al., 1999) and the current study has shown that, through the influence of both temperature and water table, drought increased net CO2 emissions while warm temperatures maintain high CH4 fluxes across all ecotypes in such ecosystems. What will be critical for the carbon balance is the duration of drought periods. If intermittent deluges of rain are enough to maintain a water table within the rooting zone of vegetation such as eriophorum, it is likely that CH4 emissions will remain high. The desiccation of aboveground biomass will reduce CO2 uptake which will inevitably reduce the build-up of organic material. If the water table drops for more prolonged periods, then CH4 emissions would be expected to decline due to a combination of factors: increased eration of the soil profile will halt methanogenesis and increase methane oxidation; erobic respiration of existing organic material will reduce the substrate available for methanogenesis; reduced primary productivity will slow the delivery of new organic material. Persistence of drought conditions over several growing seasons may alter the species composition of the ecosystem, which in turn may influence the C balance of the system. For example, it is known that permanent water table lowering will kill Eriophorum vaginatum (Wein, 1973) and sphagnum species, the ecotypes associated with the highest CH4 fluxes in this study. However, although temperature and precipitation are the key drivers of species turnover in these ecosystems, wetlands may be resilient to climate change as individual species are replaced with others possessing similar traits (Robroek et al., 2017; Jassey and Signarbieux, 2019; Lamentowicz et al., 2019). Such functional redundancy may buffer wetlands as a C sink, and there are instances of southern hemisphere wetlands persisting as C sinks despite undergoing drought (Goodrich et al., 2017). Inevitably, there will be a tipping point beyond which a succession is seen from wetland C sink to a drier landscape with increased vascular plant abundance (Swindles et al., 2019). A GWP approach to assessing the C balance of peatlands may be oversimplistic, since an annual account of GHG emissions does not consider the previous cooling effect of centuries of C sequestration following peat formation (Frolking et al., 2006; Frolking and Roulet, 2007). However, it is useful to consider the future consequences of a sustained shift in C dynamics, particularly a transition from a net CO2 sink, or an increased C source in the case of the current study site. Our study has shown that a 0.5°C rise in annual temperature, and a 35% reduction in annual rainfall led to C losses of up to 1 kg CO2-eq m−2 y−1, and with 10–12 million ha of blanket bog globally (O’Brien et al., 2007), vast stores of C within these landscapes may well act as a climate feedback, before a new equilibrium is reached as a grass dominated landscape.
Conclusion
Anthropogenic climate change is likely to create conditions under which hemiboreal blanket bogs increase their C emissions, creating a positive feedback, ultimately exhausting the C stored in these ecosystems. Achieving net zero emissions may well maintain peatlands as a C sink helping to mitigate climate change. However, under a ‘business as usual’ scenario, years like 2018 will become more prevalent and if we fail to keep global heating to 2°C, northern wetlands will be a key driver of future climate change.
Data Availability Statement
The raw data supporting the conclusions of this article will be made available by the authors, without undue reservation.
Author Contributions
JK, PI, LK, and PW designed the experiment set up the study. PW and LK had responsibility of the study site and JK and ST also contributed to maintenance of the experiment. PW and JK processed the data and conducted the analyses, and all authors contributed to the writing and editing of the manuscript.
Funding
This work was funded by an EU Cost Action (COST-STSM-ECOST-STSM-ES1308–080216–068955), Swedish Infrastructure for Ecosystem Science (SITES), who provided access to the Skogaryd Research Catchment and the Natural and Environmental Research Council (NE/P008690/1).
Conflict of Interest
The authors declare that the research was conducted in the absence of any commercial or financial relationships that could be construed as a potential conflict of interest.
Acknowledgments
We thank David Allbrand, Johanna Pihlblad, Steve Howarth, and Mark Bentley for their technical support.
Supplementary Material
The Supplementary Material for this article can be found online at: https://www.frontiersin.org/articles/10.3389/feart.2020.562401/full#supplementary-material.
References
Abdalla, M., Hastings, A., Truu, J., Espenberg, M., Mander, Ü., and Smith, P. (2016). Emissions of methane from Northern Peatlands: a review of management impacts and implications for future management options. Ecol. Evol. 6, 7080–7102. doi:10.1002/ece3.2469
Alm, J., Schulman, L., Walden, J., Nykanen, H., Martikainen, P. J., and Silvola, J. (1999). Carbon balance of a boreal bog during a year with an exceptionally dry summer. Ecology. 80, 161–174. doi:10.2307/176987
Arneth, A., Barbosa, H., Benton, T., Calvin, K., Calvo, E., Connors, S., et al. (2019). Technical report, intergovernmental panel on climate change. IPCC special report on climate change, desertification, land degradation, sustainable land management, food security, and greenhouse gas fluxes in terrestrial ecosystems.
Bengtsson, F., Granath, G., and Rydin, H. (2016). Photosynthesis, growth, and decay traits in Sphagnum - a multispecies comparison. Ecol. Evol. 6, 3325–3341. doi:10.1002/ece3.2119
Billett, M. F., Charman, D. J., Clark, J. M., Evans, C. D., Evans, M. G., Ostle, N. J., et al. (2010). Carbon balance of UK Peatlands: current state of knowledge and future research challenges. Clim. Res. 45, 13–29. doi:10.3354/cr00903
Bliss, L. C. (1998). Arctic tundra and polar desert biome. In North American Terrestrial Vegetation. Editors M. G. Barbour, and W. D. Billings (Cambridge, United Kingdom).
Bond-Lamberty, B., Wang, C. K., and Gower, S. T. (2004). A global relationship between the heterotrophic and autotrophic components of soil respiration?. Global Change Biol. 10, 1756–1766. doi:10.1111/j.1365-2486.2004.00816.x
Buttler, A., Robroek, B. J. M., Laggoun-Defarge, F., Jassey, V. E. J., Pochelon, C., Bernard, G., et al. (2015). Experimental warming interacts with soil moisture to discriminate plant responses in an ombrotrophic Peatland. J. Veg. Sci. 26, 964–974. doi:10.1111/jvs.12296
Camill, P. (1999). Patterns of boreal permafrost Peatland vegetation across environmental gradients sensitive to climate warming. Can. J. Bot. -Revue Canadienne De Botanique. 77, 721–733. doi:10.1139/b99-008
Campbell, D. I., Clarkson, B. R., Wall, A. M., Schipper, L. A., and Ratcliffe, J. L. (2019). Water table fluctuations control CO2 exchange in wet and dry bogs through different mechanisms. Sci. Total Environ. 655, 1037–1046. doi:10.1016/j.scitotenv.2018.11.151
Chamberlain, S. D., Gomez-Casanovas, N., Walter, M. T., Boughton, E. H., Bernacchi, C. J., DeLucia, E. H., et al. (2016). Influence of transient flooding on methane fluxes from subtropical pastures. J. Geophys. Res. Biogeosci. 121, 965–977. doi:10.1002/2015JG003283
Cooper, M. D. A., Evans, C. D., Zielinski, P., Levy, P. E., Gray, A., Peacock, M., et al. (2014). Infilled ditches are hotspots of landscape methane flux following Peatland Re-wetting. Ecosystems. 17, 1227–1241. doi:10.1007/s10021-014-9791-3
Dinsmore, K. J., Drewer, J., Levy, P. E., George, C., Lohila, A., Aurela, M., et al. (2017). Growing season CH4 and N2O fluxes from a subarctic landscape in northern Finland; from chamber to landscape scale. Biogeosciences. 14, 799–815. doi:10.5194/bg-14-799-2017
Dinsmore, K. J., Skiba, U. M., Billett, M. F., and Rees, R. M. (2009). Effect of water table on greenhouse gas emissions from Peatland mesocosms. Plant Soil. 318, 229–242. doi:10.1007/s11104-008-9832-9
Estop-Aragones, C., Knorr, K. H., and Blodau, C. (2013). Belowground in situ redox dynamics and methanogenesis recovery in a degraded fen during dry-wet cycles and flooding. Biogeosciences. 10, 421–436. doi:10.5194/bg-10-421-2013
Frolking, S., and Roulet, N. T. (2007). Holocene radiative forcing impact of Northern Peatland carbon accumulation and methane emissions. Global Change Biol. 13, 1079–1088. doi:10.1111/j.1365-2486.2007.01339.x
Frolking, S., Roulet, N., and Fuglestvedt, J. (2006). How Northern Peatlands influence the Earth’s radiative budget: sustained methane emission versus sustained carbon sequestration. J. Geophys. Res. Biogeosci. 111, G01008. doi:10.1029/2005JG000091
Goodrich, J. P., Campbell, D. I., Roulet, N. T., Clearwater, M. J., and Schipper, L. A. (2015). Overriding control of methane flux temporal variability by water table dynamics in a Southern Hemisphere, raised bog. J. Geophys. Res. Biogeosci. 120, 819–831. doi:10.1002/2014JG002844
Goodrich, J. P., Campbell, D. I., and Schipper, L. A. (2017). Southern Hemisphere bog persists as a strong carbon sink during droughts. Biogeosciences. 14, 4563–4576. doi:10.5194/bg-14-4563-2017
Greenup, A. L., Bradford, M. A., McNamara, N. P., Ineson, P., and Lee, J. A. (2000). The role of Eriophorum vaginatum in CH4 flux from an ombrotrophic peatland. Plant Soil. 227, 265–272. doi:10.1023/a:1026573727311
Grondahl, L., Friborg, T., Christensen, T. R., Ekberg, A., Elberling, B., Illeris, L., et al. (2008). Spatial and inter-annual variability of trace gas fluxes in a heterogeneous high-arctic landscape. Adv. Ecol. Res. 40 (40), 473–498. doi:10.1016/s0065-2504(07)00020-7
Heinemeyer, A., Gornall, J., Baxter, R., Huntley, B., and Ineson, P. (2013). Evaluating the carbon balance estimate from an automated ground-level flux chamber system in artificial grass mesocosms. Ecol. Evol. 3, 4998–5010. doi:10.1002/ece3.879
IPCC (2014). Climate change 2014: synthesis report. Contribution of working groups I, II and III to the fifth assessment report of the intergovernmental panel on climate change [core writing team. Editors R. K. Pachauri, and L. A. Meyer (Geneva, Switzerland: IPCC), 151.
Jarveoja, J., Nilsson, M. B., Crill, P. M., and Peichl, M. (2020). Bimodal diel pattern in peatland ecosystem respiration rebuts uniform temperature response. Nat. Commun. 11, 4255. doi:10.1038/s41467-020-18027-1
Jassey, V. E. J., and Signarbieux, C. (2019). Effects of climate warming on Sphagnum photosynthesis in peatlands depend on peat moisture and species-specific anatomical traits. Global Change Biol. 25, 3859–3870. doi:10.1111/gcb.14788
Juszczak, R., and Augustin, J. (2013). Exchange of the greenhouse gases methane and nitrous oxide between the atmosphere and a temperate Peatland in Central Europe. Wetlands. 33, 895–907. doi:10.1007/s13157-013-0448-3
Keane, J. B., and Ineson, P. (2017). Technical note: differences in the diurnal pattern of soil respiration under adjacent Miscanthus x giganteus and barley crops reveal potential flaws in accepted sampling strategies. Biogeosciences. 14, 1181–1187. doi:10.5194/bg-14-1181-2017
Keane, J. B., Ineson, P., Vallack, H. W., Blei, E., Bentley, M., Howarth, S., et al. (2018). Greenhouse gas emissions from the energy crop oilseed rape (Brassica napus); the role of photosynthetically active radiation in diurnal N2O flux variation. Global Change Biol. Bioenergy. 10, 306–319. doi:10.1111/gcbb.12491
Kettunen, A., Kaitala, V., Alm, J., Silvola, J., Nykanen, H., and Martikainen, P. J. (1996). Cross-correlation analysis of the dynamics of methane emissions from a boreal Peatland. Global Biogeochem. Cycles. 10, 457–471. doi:10.1029/96gb01609
Kip, N., van Winden, J. F., Pan, Y., Bodrossy, L., Reichart, G. J., Smolders, A. J. P., et al. (2010). Global prevalence of methane oxidation by symbiotic bacteria in peat-moss ecosystems. Nat. Geosci. 3, 617–621. doi:10.1038/ngeo939
Knorr, K. H., Lischeid, G., and Blodau, C. (2009). Dynamics of redox processes in a minerotrophic fen exposed to a water table manipulation. Geoderma. 153, 379–392. doi:10.1016/j.geoderma.2009.08.023
Koskinen, M., Minkkinen, K., Ojanen, P., Kamarainen, M., Laurila, T., and Lohila, A. (2014). Measurements of CO2 exchange with an automated chamber system throughout the year: challenges in measuring night-time respiration on porous peat soil. Biogeosciences. 11, 347–363. doi:10.5194/bg-11-347-2014
Kutzbach, L., Wagner, D., and Pfeiffer, E. M. (2004). Effect of microrelief and vegetation on methane emission from wet polygonal tundra, Lena Delta, Northern Siberia. Biogeochemistry. 3, 341–362. doi:10.1023/B:BIOG.0000031053.81520
Lai, D. Y. F., Roulet, N. T., Humphreys, E. R., Moore, T. R., and Dalva, M. (2012). The effect of atmospheric turbulence and chamber deployment period on autochamber CO2 and CH4 flux measurements in an ombrotrophic peatland. Biogeosciences. 9, 3305–3322. 10.5194/bgd-9-1439-2012
Laing, C. G., Shreeve, T. G., and Pearce, D. M. E. (2010). The fine scale variability of dissolved methane in surface peat cores. Soil Biol. Biochem. 42, 1320–1328. doi:10.1016/j.soilbio.2010.03.015
Lamentowicz, M., Gałka, M., Marcisz, K., Słowiński, M., Kajukało-Drygalska, K., Dayras, M. D., et al. (2019). Unveiling tipping points in long-term ecological records from Sphagnum-dominated Peatlands. Biol. Lett. 15, 20190043. doi:10.1098/rsbl.2019.0043
Lees, K. J., Clark, J. M., Quaife, T., Khomik, M., and Artz, R. R. E. (2019). Changes in carbon flux and spectral reflectance of Sphagnum mosses as a result of simulated drought. Ecohydrology. 12, e2123. doi:10.1002/eco.2123
Levy, P. E., Burden, A., Cooper, M. D. A., Dinsmore, K. J., Drewer, J., Evans, C., et al. (2012). Methane emissions from soils: synthesis and analysis of a large UK data set. Global Change Biol. 18, 1657–1669. doi:10.1111/j.1365-2486.2011.02616.x
Macdonald, J. A., Skiba, U., Sheppard, L. J., Hargreaves, K. J., Smith, K. A., and Fowler, D. (1996). Soil environmental variables affecting the flux of methane from a range of forest, moorland and agricultural soils. Biogeochemistry. 34, 113–132. doi:10.1007/BF00000898
Mazzola, V., Perks, M. P., Smith, J., Yeluripati, J., and Xenakis, G. (2020). Seasonal patterns of greenhouse gas emissions from a forest‐to‐bog restored site in northern Scotland: influence of microtopography and vegetation on carbon dioxide and methane dynamics. Eur. J. Soil Sci. doi:10.1111/ejss.13050
McNamara, N. P., Plant, T., Oakley, S., Ward, S., Wood, C., and Ostle, N. (2008). Gully hotspot contribution to landscape methane (CH4) and carbon dioxide (CO2) fluxes in a Northern Peatland. Sci. Total Environ. 404, 354–360. doi:10.1016/j.scitotenv.2008.03.015
Mehtatalo, L., Alekseychik, P., Uljas, S., Mammarella, I., Korrensalo, A., Mehtätalo, L., et al. (2020). Varying vegetation composition, respiration and photosynthesis decrease temporal variability of the CO2 sink in a boreal bog. Ecosystems. 23, 842–858. doi:10.1007/s10021-019-00434-1
Milne, J. A., Pakeman, R. J., Kirkham, F. W., Jones, I. P., and Hossell, J. E. (2002). Biomass production of upland vegetation types in England and Wales. Grass Forage Sci. 57, 373–388. doi:10.1046/j.1365-2494.2002.00339.x
Mosier, A. R. (1989). Chamber and isotope techniques. In exchange of trace gases between terrestrial ecosystems and the atmosphere. Life sciences research report 47. Editors G. P. Robertson, D. S Schimel, and M. O. Andreae (Berlin, Germany) 175–187.
O’Brien, H., Labadz, J. C., and Butcher, D. P. (2007). Review of blanket bog management and restoration. London: Nottingham Trent University research rep.(BD1241Defra.
Pelletier, L., Strachan, I. B., Garneau, M., and Roulet, N. T. (2014). Carbon release from boreal peatland open water pools: implication for the contemporary C exchange. J. Geophys. Res. Biogeosci. 119, 207–222. doi:10.1002/2013JG002423
Raghoebarsing, A. A., Smolders, A. J., Schmid, M. C., Rijpstra, W. I., Wolters-Arts, M., Derksen, J., et al. (2005). Methanotrophic symbionts provide carbon for photosynthesis in peat bogs. Nature. 436, 1153–1156. doi:10.1038/nature03802
Rahman, M. T., Crombie, A., Chen, Y., Stralis-Pavese, N., Bodrossy, L., Meir, P., et al. (2011). Environmental distribution and abundance of the facultative methanotroph Methylocella. ISME J. 5, 1061–1066. doi:10.1038/ismej.2010.190
Rey-Sanchez, C., Bohrer, G., Slater, J., Li, Y. F., Grau-Andres, R., Hao, Y. S., et al. (2019). The ratio of methanogens to methanotrophs and water-level dynamics drive methane transfer velocity in a temperate kettle-hole peat bog. Biogeosciences. 16, 3207–3231. doi:10.5194/bg-16-3207-2019
Rigney, C., Wilson, D., Renou-Wilson, F., Muller, C., Moser, G., and Byrne, K. A. (2018). Greenhouse gas emissions from two rewetted peatlands previously managed for forestry. Mires Peat. 21, 23. doi:10.19189/MaP.2017.OMB.314
Rinne, J., Tuovinen, J. P., Klemedtsson, L., Aurela, M., Holst, J., Lohila, A., et al. (2020). Effect of the 2018 European drought on methane and carbon dioxide exchange of northern mire ecosystems. Philos. Trans. R. Soc. B. 375, 20190517. 10.1098/rstb.2019.0517
Ritson, J. P., Brazier, R. E., Graham, N. J. D., Freeman, C., Templeton, M. R., and Clark, J. M. (2017). The effect of drought on dissolved organic carbon (DOC) release from peatland soil and vegetation sources. Biogeosciences. 14, 2891–2902. doi:10.5194/bg-14-2891-2017
Robroek, B. J. M., Jassey, V. E. J., Payne, R. J., Martí, M., Bragazza, L., Bleeker, A., et al. (2017). Taxonomic and functional turnover are decoupled in European peat bogs. Nat. Commun. 8, 1161. doi:10.1038/s41467-017-01350-5
Roulet, N. T., Ash, R., and Moore, T. R. (1992). Low boreal wetlands as a source of atmospheric methane. J. Geophys. Res. Atmos. 94, 3739–3749. doi:10.1029/91jd03109
Roura-Carol, M., and Freeman, C. (1999). Methane release from peat soils: effects of Sphagnum and Juncus. Soil Biol. Biochem. 31, 323–325. doi:10.1016/s0038-0717(98)00125-4
Segers, R. (1998). Methane production and methane consumption: a review of processes underlying wetland methane fluxes. Biogeochemistry. 41 (1), 23–51. doi:10.1023/a:1005929032764
Smirnoff, N., and Crawford, R. M. M. (1983). Variation in the structure and response to flooding of root aerenchyma in some wetland plants. Ann. Bot. 51, 237–249. doi:10.1093/oxfordjournals.aob.a086462
Stockdale, J. E., Stockdale, J., Toet, S., Lukac, M., Milcu, A., and Ineson, P. (2012). Scaling up of methane flux: a case study in the UK uplands. PhD Thesis, UK: University of York.
Stockdale, J. E., Toet, S., Lukac, M., Milcu, A., and Ineson, P. (2014). The hysteretic response 620 of peatland methane fluxes: an improved approch to identify the factors controlling methane 621 flux. Paper presented at the EGU General Assembly Conference Abstracts.
Strack, M., and Waddington, J. M. (2008). Spatiotemporal variability in peatland subsurface methane dynamics. J. Geophys. Res. Biogeosci. 113, 12. doi:10.1029/2007jg000472
Swindles, G. T., Morris, P. J., Mullan, D. J., Payne, R. J., Roland, T. P., Amesbury, M. J., et al. (2019). Widespread drying of European peatlands in recent centuries. Nat. Geosci. 12, 922–928. doi:10.1038/s41561-019-0462-z
Tian, J. Q., Zhu, Y. B., Kang, X. M., Dong, X. Z., Li, W., Chen, H., et al. (2012). Effects of drought on the archaeal community in soil of the Zoige wetlands of the Qinghai-Tibetan plateau. Eur. J. Soil Biol. 52, 84–90. doi:10.1016/j.ejsobi.2012.07.003
van Winden, J. F., Reichart, G. J., McNamara, N. P., Benthien, A., and Damsté, J. S. (2012). Temperature-induced increase in methane release from peat bogs: a mesocosm experiment. Plos One. 7, e39614. doi:10.1371/journal.pone.0039614
Waddington, J. M., and Roulet, N. T. (1996). Atmosphere-wetland carbon exchanges: scale dependency of CO2 and CH4 exchange on the developmental topography of a Peatland. Global Biogeochem. Cycles. 10, 233–245. doi:10.1029/95GB03871
Wein, R. W. (1973). Biological flora of the British Isles- Eriophorum vaginatum L. J. Ecol. 61, 601–615. doi:10.2307/2259047
Yavitt, J. B., and Seidmann-Zager, M. (2006). Methanogenic conditions in northern peat soils. Geomicrobiol. J. 23, 119–127. doi:10.1080/01490450500533957
Keywords: drought, blanket bog (peatland), carbon, methane, CO2, greenhouse gas, climate change
Citation: Keane JB, Toet S, Ineson P, Weslien P, Stockdale JE and Klemedtsson L (2021) Carbon Dioxide and Methane Flux Response and Recovery From Drought in a Hemiboreal Ombrotrophic Fen. Front. Earth Sci. 8:562401. doi: 10.3389/feart.2020.562401
Received: 15 May 2020; Accepted: 16 December 2020;
Published: 21 January 2021.
Edited by:
Ligang Xu, Nanjing Institute of Geography and Limnology (CAS), ChinaCopyright © 2021 Keane, Toet, Ineson, Weslien, Stockdale and Klemedtsson. This is an open-access article distributed under the terms of the Creative Commons Attribution License (CC BY). The use, distribution or reproduction in other forums is permitted, provided the original author(s) and the copyright owner(s) are credited and that the original publication in this journal is cited, in accordance with accepted academic practice. No use, distribution or reproduction is permitted which does not comply with these terms.
*Correspondence: J. B Keane, YmVuLmtlYW5lQHNoZWZmaWVsZC5hYy51aw==