 Yolanda C. Lin
 Susanna F. Jenkins
 Jun Rui Chow1
 Sébastien Biass
 David Lallemant
- 1Asian School of the Environment, Nanyang Technological University, Singapore, Singapore
- 2Department of Geography and Environmental Studies, University of New Mexico, Albuquerque, NM, United States
- 3Earth Observatory of Singapore, Nanyang Technological University, Singapore, Singapore
- 4Risk Management Solutions, London, United Kingdom
Disaster risk research’s reliance on past events has proved inadequate when it comes to extreme events. This shortcoming stems from limited records (for example, due to the vast differences in timescales between geological processes and human records) and the dynamic nature of all three components of risk–drivers of change in hazard (e.g., climate change), exposure (e.g., urban growth), and vulnerability (e.g., aging infrastructure). This paper provides a framework for modeling key unrealized events through downward counterfactual changes for consideration in future risk modeling and assessment. Past disasters are typically viewed as fixed events, and the resulting lessons-learned are inherently limited by this definition; downward counterfactual thought provides a means to harvest additional insights and capture a larger consequence space. As such, we have identified a need for a guiding framework in order to incorporate downward counterfactual thought in the context of disaster risk modeling applied to both natural and anthropogenic hazards. The downward counterfactual framework relies first on identifying a past event, which may or may not have been considered a major disaster. After an event has been identified, historical parameters from the past event are relaxed in order to identify small changes that result in downward, worsening consequences. This can be continued for multiple changes until an end-of-search criteria is reached. The framework is especially relevant for regions that may have a sparse past catalog, either due to limited data or limited occurrences of natural hazards. As such, the framework is demonstrated in the context of Singapore, a city-nation that has historically had limited recorded natural hazards events, through five case studies on past anthropogenic, environmental, seismic, volcanic, and storm hazard events. This framework can help harness lessons-learned from unrealized disasters to support a more resilient future through informed policies and plans.
Introduction
Current policies, risk management practices, emergency preparedness, and scientific research interests are all shaped by past events–in many cases, past disasters [e.g., following an earthquake (Wilkinson et al., 2014) or after a major storm (Jha et al., 2016)]. However, our past experiences and existing data may not prepare us for the context of extreme uncertainty, in which low probability events, evolving hazards, emergent hazards, and a changing landscape of exposure and vulnerability have the potential to severely affect our natural, built, and social environments.
In modeling natural hazards, the research community’s aim is often to replicate past events as closely as possible and identify how likely that event is to occur again. Probabilistic approaches go beyond this by considering a credible range of future events, but the basis of these probabilities is nonetheless drawn from a past event catalog. We especially lack a guided way to explore the events that we have never seen before, and are therefore ruled out as “impossible”–until they prove possible and take their toll in damages and losses.
Often, in reality, there are hints and clues to the possibility of such low-probability, long recurrence interval events from those in the past. An example of this is the 2011 Tohoku earthquake and tsunami in Japan, where there had been decades of growing evidence from tsunami deposits that an earthquake and resulting tsunami beyond the design standard’s maximum credible earthquake (M8.2) was possible (Minoura and Nakaya, 1991; Minoura et al., 2001; Sawai et al., 2012).
Other times, perhaps because they lacked consequence in a past instance, many near-miss events are excluded from our modern record of risk, introducing bias in our understanding of potential losses. For example, at M6.7, the 1971 San Fernando earthquake in the United States was a surprisingly large event at that point in history. The consequences of this event included: 64 deaths, 2,543 injuries, and $553 million USD of damages (Reich, 1996). Though already a costly disaster, this event could have been even more devastating. Exactly a year before, the Van Norman dam was nearly full at 6.5 billion gallons of water, but in 1971 it was just half full at 3.6 billion gallons of water. According to a study from the University of California, Los Angeles, the 1971 earthquake damaged the top 30 feet of the dam, and if this earthquake had occurred a year earlier, the dam may have failed and consequently claimed between 71,600 and 123,400 lives (Ayyaswamy et al., 1974; Reich, 1996). California has had a relatively safe last 60 years of earthquakes, with just about 200 direct deaths due to earthquakes (Woo et al., 2017), but this 60 years record could have easily been different.
In addition to the realized events of the past, future risks pose additional, extreme, uncertainties in a changing world. With climate change, hazards themselves–extreme temperatures, unprecedented storm frequencies, and more–are creating emergent, unfamiliar threats that communities have never experienced before (e.g., Shepherd et al., 2018). Simultaneously, some of the most vulnerable populations are subject to increasing risk from rapid urban growth in hazard-prone regions (e.g., Mestav Sarica et al., 2020).
Current risk analysis falls short of addressing these forms of extreme uncertainty, so we propose a framework to identify unexpected events for the purpose of building resilience in an increasingly dynamic and uncertain world. In particular, we propose to build upon recent downward counterfactual thought in natural hazards and risk literature (e.g., Woo et al., 2017; Aspinall and Woo, 2019; Woo, 2019) for the purpose of a more robust risk analysis and disaster planning and preparedness. Downward counterfactual thought, an analysis of what might have been worse compared to what has actually transpired, according to experts in psychology, is more challenging than its optimistic foil, upward counterfactual thought, where one re-imagines a better outcome than the one that has transpired (Roese, 1997). As described in the case of the 1971 San Fernando earthquake, downward counterfactual thoughts can provide valuable insight to the full realm of potential consequences. Past disasters are typically viewed as fixed events, and the resulting lessons-learned are inherently limited by this definition; downward counterfactual thought provides a means to harvest additional insights and capture a larger consequence space. It provides an avenue to build our learning not only from what has occurred, but also from what could have occurred. As such, we have identified a need for a guiding framework in order to incorporate downward counterfactual thought in the context of disaster risk modeling applied to both natural and technological or anthropogenic hazards.
We identify Singapore as a compelling case for examination due to its limited historical record of past disasters, and its particular concern for resilience due to its status as a city-state on a small island. In a previous study, the authors found just thiry-nine events between 1950 and present day (2020) that constitute a disaster based on the quantitative definition for disaster as used in the Emergency Events Database (EM-DAT), a prominent, publicaly available international disaster database (Lin et al., In Review; CRED, 2020). For comparison, the EM-DAT database has nine records for the same time frame (CRED, 2020). Even though Southeast Asia faces high exposure to natural hazards of almost every kind–including earthquakes, typhoons, and volcanic eruptions–Singapore, at the physical and economic center of the region, is regularly identified as one of the safest places to live in the world (Mousavizadeh et al., 2016; The Economist, 2017). Although Singapore is largely sheltered from these hazards, it remains vulnerable to lower probability, natural hazard events, especially as an extremely dense, urban island-city-state.
Anticipating such events in other parts of the world has typically involved expert-based speculation about what may occur in the future, or rigid reliance upon what has happened in the past. Without an extensive past record, Singapore is a prime candidate for the use of this downward counterfactual approach for risk analysis and disaster planning.
This work describes a downward counterfactual approach to address the need to re-examine past events in order to have a more complete understanding of potential consequences from technological and natural hazard events, and move away from reliance on the purely historical past events catalog. We begin with an overview of the methodology in Downward Counterfactual Framework for Risk Analysis. We then present five downward counterfactual case studies in Case studies, exercising this framework on past hazard events affecting Singapore, including civil emergency, haze, near field earthquake, volcanic ash exposure, and tropical cyclone hazards. Following a description of the case studies, we discuss in Insights from Unrealized Events the potential for contributing new insights through the application of this framework, as well as opportunities and challenges in implementing this framework. We offer conclusions regarding this downward counterfactual framework and modeling unrealized disasters in Conclusion.
Downward Counterfactual Framework for Risk Analysis
The proposed downward counterfactual framework to uncover unrealized, unexpected events has six key steps, described below and in Figure 1. This work builds on key downward counterfactual risk literature, specifically as it is described in Woo (2019). In previous descriptions of a downward counterfactual search, the process was as follows: one could imagine what would make an event worse by some amount–say 10%–and then find at least one pathway toward that increased consequence. This is then repeated until all possibilities are exhausted. As a conceptual model, this is an effective way to engage in downward counterfactual thinking. Applied to existing hazard models, this can quickly overwhelm the available computational resources. The proposed framework incorporates two new aspects to the previous literature: explicit definition for acceptable moves in Step 2, and definition and implementation for an end-of-search criteria (Step 3 and Step 6) for cases when it is not necessary to completely exhaust the downward consequence model space.
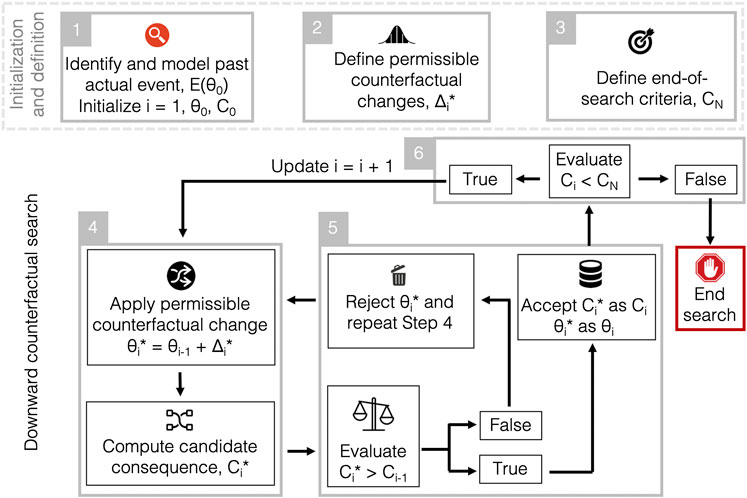
FIGURE 1. Downward Counterfactual Framework to transform past events into unrealized disasters. The framework begins with a definition of
Step 1: Identify a Past Factual Event as the Downward Counterfactual Search Seed
First, we identify a factual, historic event,
Step 2: Define Acceptable Changes to Historic Parameters
In Step 2, we define acceptable changes from the original events (i.e., acceptable candidates,
Step 3: Define an End-Of-Search Criteria
We impose an end-of-search criteria, such that the search does not continue indefinitely. Again, as with defining acceptable changes to historic parameters, this is intended to support the believability of the resulting downward counterfactual scenarios, as well to maintain computationally feasible searches from a modeling perspective. For example, the end-of-search criteria imposed in two of the example case studies is the breach of a standard or policy (e.g., the no-fly volcanic ash concentration threshold for airplanes). The end-of-search criteria is quantified in terms of its consequence measure (e.g., grams of volcanic ash per cubic meter). The framework is intended to be flexible in accommodating differing needs from diverse stake holders. Other possible end-of-search criteria may include lives lost or economic loss. For flexibility, the criteria may also be more subjective, such as identifying a scenario or hazard event that has not been considered before. In some cases, the modeler may be interested in exploring the whole acceptable downward space to find the most extreme case possible within acceptable changes defined in Step 2. In other cases, some critical threshold is warranted. This could be due to limited computational resources or a saturation of consequences at some particular threshold (e.g., collapse of a building or closure of airspace).
Step 4: Relaxing Modeling Assumptions and Historic Parameters
At the first counterfactual step
Search Mechanisms
In the psychology literature, there are three main mechanisms with which to engage in counterfactual thought, as defined in prominent counterfactual literature (e.g., Roese, 1994, 1997; Roese et al., 1999). They include:
• Upwards vs. downwards: As described above, upwards thought re-imagines a past event as somehow better than it turned out. Downwards thought, on the other hand, alters past parameters to achieve a worse outcome.
• Additive vs. subtractive: An additive thought introduces a new element to the past–for instance, the addition of a seawall to prevent flooding. Subtractive thought takes away something in the past event, such as the removal of an early warning alarm.
• Self vs. other: A counterfactual thought may seek to alter one’s own past actions (self), or alter some external entity’s past action (other). In the context of this study, we use self to refer to the collective society and governance which is exposed to a hazard, and the other to reflect the parameters of the past hazard event.
Both additive vs. subtractive and self vs. other search mechanisms can be either upwards or downwards. In this work, we focus specifically on the downwards mechanism, but will also make use of the additive and subtractive mechanism to further describe downward counterfactual changes.
Search Categories
To aid in the description of downward counterfactual realizations of past events, we define ten categories that can be used to describe small changes from original events, listed and defined below. These categories are not necessarily mutually exclusive nor is this list exhaustive.
• Geographical shift: A geographical shift in hazard could have drastic effects on the consequence of the hazard event since this changes the population and assets exposed to the hazard, which may have varying levels of vulnerability.
• Energy release (and rate of release): A sustained, lower-energy event can result in drastically different consequences than an accelerated, high-intensity event. A change in energy release may result in a downward counterfactual.
• Time change: A shift of minutes or years are both insignificant compared to the geophysical timescales of most natural hazards. As demonstrated by the 1971 San Fernando earthquake and the near-miss dam failure, it is critical to explore potential losses for a representative range of time changes to better capture the scale of consequences.
• Cascading events: Some hazards such as earthquakes can trigger secondary events, like landslides, liquefaction, and tsunamis, from which losses may be even greater than directly from the primary hazard. The following cascade of events derives potential from its physical characteristics but there is variability in their exact realized expression and thus constitute a critical search category in the downward re-imagination of a past event. Computational models also may not always capture the phenomenon due to incomplete information. Cascading events may include instances such as health outbreak following the onset of a natural hazard.
• Coinciding events: Some hazard events happen to coincide in space and time with other hazard events, thereby straining available resources, or exacerbating effects from independent events. When exploring the downward counterfactual space, a coinciding event could either be added or removed from the past event of interest in order to achieve a downward counterfactual situation.
• Human error: A miscalculation, disruption to service, or other human-generated action could stall an otherwise successful response and recovery plan.
• Human decision making: Especially for technological hazards, human decision making is a key player in the creation and execution of a hazard event (such as a cyber attack). Meanwhile, the absence of informed decision-making in the aftermath of a natural hazard event can also lead to downward outcomes when applying counterfactual thought. The choice to apply or deploy technological inventions is included in this category.
• Socio-political factors: Socio-political factors can amplify, dampen, or otherwise affect the way human-decision making, human-error, and other human-driven actions take effect or reach efficacy. By altering socio-political factors, in particular the subtraction of a mitigating factor, a downward counterfactual can help reveal the best-practices for disaster resilience.
• Environmental status and change: Changes in the environmental systems can have significant impacts on outcomes. For example, remodeling a past tsunami with current or projected sea-level due to climate change, or the removal of certain ecosystems, could change resulting impacts.
• Exposure: The people and assets exposed to hazards is a dynamic dimensions. Population growth and urban expansion are two examples of changing exposure.
Step 5: Compare the Historic Consequence (or Last Accepted Consequence)
Compare the historic consequence (or last accepted consequence) with the unrealized, counterfactual consequence to assess whether it has met the downward criteria that the candidate consequence is higher than the previous consequence in the chain (
Step 6: Criteria to Continue Downward Counterfactual Search
At Step 6, we check whether the last downward counterfactual change meets the end-of-search criteria (that is, if
Case studies
We present five case studies to explore unrealized downward counterfactual events, summarized in Table 1. Two case studies are based on past realized disasters (Hotel New World Building Collapse in 1986 Hotel New World Building Collapse and Haze in Southeast Asia in Haze in Southeast Asia); we use these to illustrate how downward counterfactual thinking may be applied in situations that are already considered catastrophic. The other three case studies are based on past near-misses (Intraplate earthquake in Intraplate Earthquake Event, Eruption of Mt. Pinatubo in Mt. Pinatubo Eruption (1991), and Tropical Cyclone Vamei in Tropical Cyclone Vamei (2001)); these near-miss case studies show how unrealized disasters warrant inclusion in the disaster preparedness planning process despite their past outcomes, in order to be fully prepared for the uncertainties of future risk.
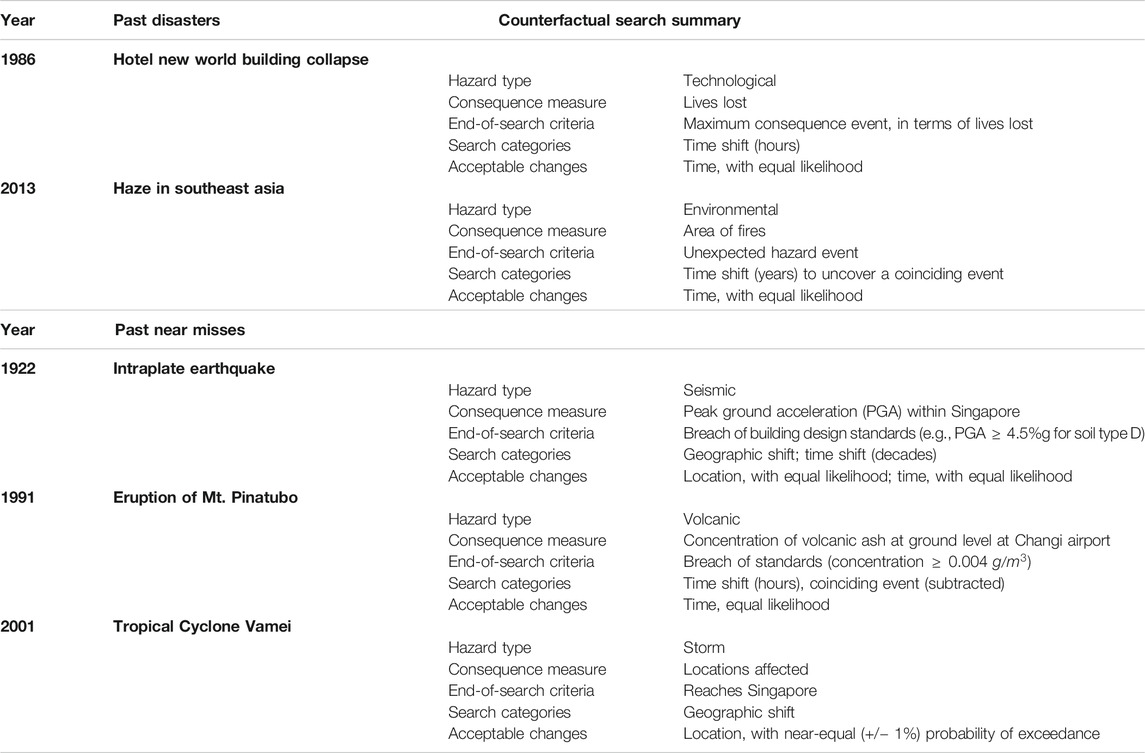
TABLE 1. Summary of past events and near miss downward counterfactual search case studies in this paper.
1986 Hotel New World Building Collapse
The Hotel New World building collapse in 1986 is the worst building collapse in Singapore’s history, and one of the largest single loss-of-life events in its history as a country. On March 15, 1986 at 11:25 am, the six-story building (officially named the Lian Lak Building but often referred to as Hotel New World) suddenly collapsed (Thean et al., 1987). This event was chosen for its prominence as a past disaster in Singapore: it is the only event that is consistently included in global disaster databases for Singapore (Lin et al., In Review). Fifty people were trapped in the rubble at the time of collapse, and over the next few days, seventeen were rescued, and thirty-three lives were lost. The building housed a basement garage, a bank on the first floor, a reportedly popular nightclub and restaurant on the second floor, and a 67-room hotel on the remaining stories. The resulting inquiry found that the building had been designed by unqualified persons, and that an excess of 100-tonnes of live load had been added to the building after construction (Thean et al., 1987). Ultimately, though, it was determined that the original structural loads had not accounted for the dead load (the weight of the structure itself). There had been several signs of structural failure leading up to the collapse, including signs of newly formed diagonal cracks and sounds of cracking from columns; however, the building was not evacuated. At the time, rescue forces were under prepared to respond in a disaster of this scale. Following this collapse, several changes were made to Singapore’s building design and construction regulations through the Building Control Act of 1989, including independent verification of structural calculations (Neale, 2001).
A Downward Counterfactual Shift in Time
As identified in Step, 1, the starting event can be defined by the collapse time of 11:25 AM on March 15, 1986 (
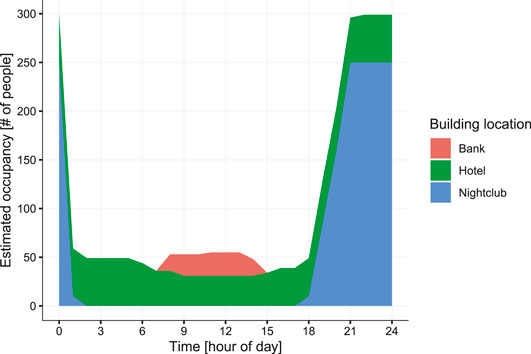
FIGURE 2. Hotel New World estimated occupancy by hour for the day of collapse based on typical occupancy for building use and type (García Kerdan et al., 2015), as well as original estimates and accounts of persons reported missing (New York Times, 1986; National Geographic, 2005).
Haze in Southeast Asia
Haze can pose serious health and economic risks to impacted communities. In Singapore, severe haze episodes arise from the compound conditions of wildfires and/or human-caused fires, dry conditions (exacerbated by the periodic warming of sea surface temperatures of El Niño years, which can cause drought, food insecurity, and more), and prevailing wind patterns (Forsyth, 2014). Haze is also a transboundary issue between the countries of Southeast Asia, and can strain or even threaten diplomatic relations between countries (Forsyth, 2014). Smoke haze carries particulate matter that can increase acute health issues such as asthma, pulmonary infection, and eye and skin irritation, as well as other health impacts (Lai and Tan, 2015). The presence of haze particulates also limits visibility, which can result in restricted land, air, and marine transportation (Heil and Goldammer, 2001). Overall, haze can impact the economy through healthcare costs, short-term tourism effects, travel disruptions, and production losses. Though Singapore has a longer history of haze dating back to the 1970s, Singapore saw its first extreme haze disaster in 1997, and this was followed again in 2013 and 2015. Of the significant haze events, the June 2013 episode was unusual in that it was decoupled from an El Niño Year. In this year, wildfires spread through Indonesia’s nearby island of Sumatra, creating one of the worst haze episodes in Singapore. The 3-h moving average PSI hit 401 (“hazardous” is 201–500; 500 is the index ceiling), and the 24-h moving average was reported at 246 (Velasco and Rastan, 2015). The 2013 event is estimated to have cost around 70 million SGD (50 million 2015 USD) due to decrease in tourism and closure of outdoor venues (Lee, 2015). In terms of economic impact, this is modest compared to other haze events, which have been estimated to have cost 300 million USD (1997) and over 1 billion USD in 2015 (Quah and Mun, 2019). However, it is significant for its unexpected timing and extreme intensity.
A Downward Counterfactual Shift in Time to Create a Coinciding Event
In Step 1, we identify that the 2013 haze event was decoupled from an El Niño year, and the cause of the event is largely attributed to human activity, which could have happened in a later time. Thus, we define in Step 2 a delay in years as an acceptable change (
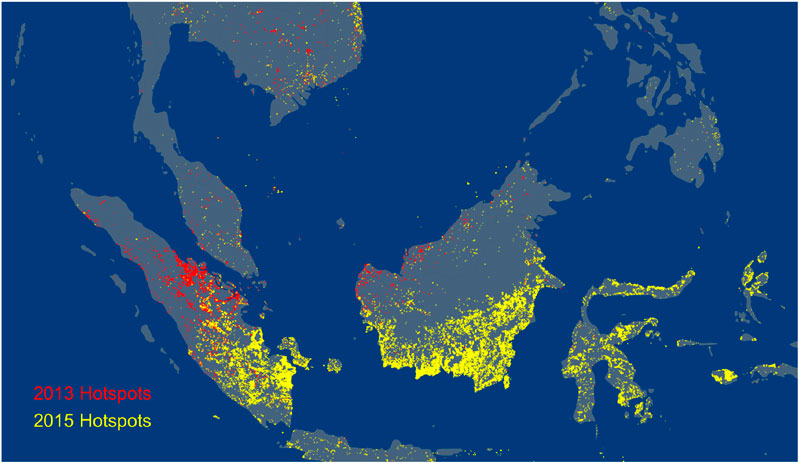
FIGURE 3. Fire hotspots from NASA FIRMS MODIS Active Fire Detections satellite data for June 2013 (in red) and September-October 2015 in yellow) (NASA FIRMS, 2019).
Intraplate Earthquake Event
Earthquakes most often occur due to relative motion between tectonic plates at tectonic boundaries known as faults. Plate tectonics theory is estimated to explain the basis of over 95% of the global seismic energy release (Talwani, 2014). However, intraplate earthquakes are far less understood, though these events occur around the world. These earthquakes away from the plate boundary are particularly difficult to anticipate, and as a result, can cause staggering damage and loss of life. Some examples of past devastating earthquakes include the 2001 Bhuj earthquake in India, with over a million structures damaged and destroyed (Mistry et al., 2001) and the loss of 13,805 lives (Ray, 2004), and Tangshan in China (1976), with over 240,000 deaths, millions of injuries, and destruction of an entire city (Talwani, 2014).
Singapore is regarded as a low to moderate seismic hazard region (Petersen et al., 2004; Li and Pan, 2007), and as recently as 2013 introduced its first seismic provisions to address hazard from large far-field earthquakes, motivated by the 2004 Indian Ocean earthquake, though these provisions only apply to new buildings. Assessment of the earthquake hazard in peninsular Malaysia and Singapore is highly uncertain due to a lack of ground motion prediction equations for this region (Petersen et al., 2004). One of the most common building designs in Singapore is a reinforced concrete high-rise building design, often with an open “void deck” on the first floor allowing for pedestrian traffic and shops, but also making these buildings vulnerable to soft story behavior in the event of an earthquake (Li and Pan, 2007). While there have been significant contributions in understanding the vulnerability of Singaporean’s building stock to extremely large, far-field earthquakes (Li and Pan, 2007), the vulnerability of Singapore from near-field earthquakes has not been studied extensively. Yet, as introduced earlier, intraplate earthquakes are not well understood, and when they occur, can be especially devastating due to a lack of seismic provisions in the local building standards (e.g., Ambraseys et al., 1994). This case study is a first-step toward better understanding the near-field earthquake risk of Singapore.
Singapore is located near the center of the Sunda Plate, a minor tectonic plate formerly considered as part of the Eurasian Plate. Within this plate, the USGS Earthquake Catalog for Stable Continental Regions (SRC) (2004) has record of just two events centrally located on this plate: 1) a M4.6 (located at coordinates 12.4503°N, 107.3692°E) and 2) a M6.5 at coordinates (located at coordinates 7.8137°N, 105.9438°E), both records logged as shallow events. Martin et al. (2018) has uncovered two widely felt earthquakes in Singapore originating from southern peninsular Malaysia in 1922 based on historic reports, though these are not included in the USGS SRC Catalog.
Lacking specific event parameters for a near-field Singapore event, we use the event parameters from SRC database for the smaller of the two events (M4.6) with the rupture placed at a randomly selected location within the southern peninsular Malaysia as our past event seed to begin the downward counterfactual analysis. As a note, the second event’s validity has been questioned (Ebel, 2009), and while we have not removed it from Figure 4, we have chosen not to base our past event on the latter. Additionally, while intraplate events are rare, intraplate events above M6 are even more so. Thus, we have chosen to focus on a more likely, but still unexpected, earthquake magnitude.
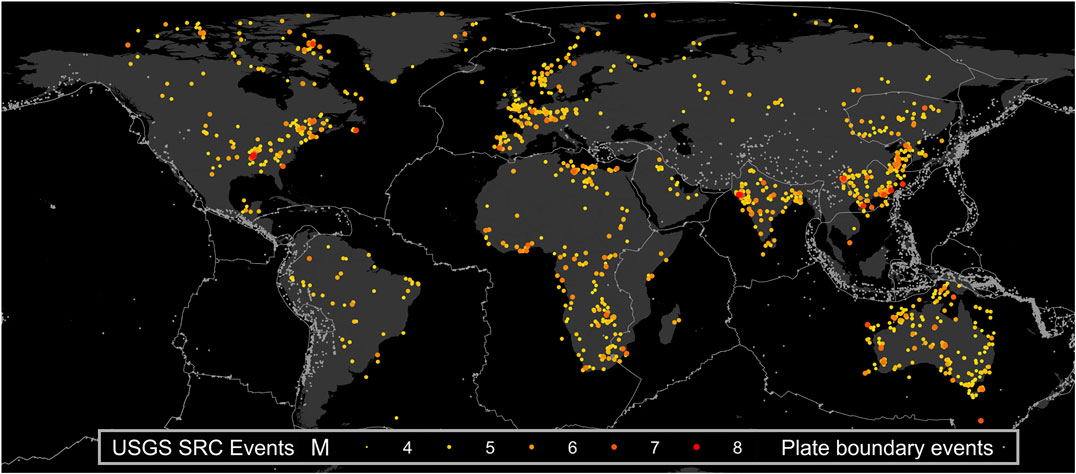
FIGURE 4. Intraplate events from the Stable Continental Regions database from the USGS (495–2002) (USGS, 2004). Plate boundaries from Bird (2003), with M6+ plate boundary earthquake events from the USGS Earthquake Catalog from 1950 to 2019 in gray to show range of continental plate boundary widths (USGS, 2019).
A Downward Counterfactual Shift in Geographic Location and Time
We describe the historic event (Step 1) with a few key parameters
The modeled ground shaking (
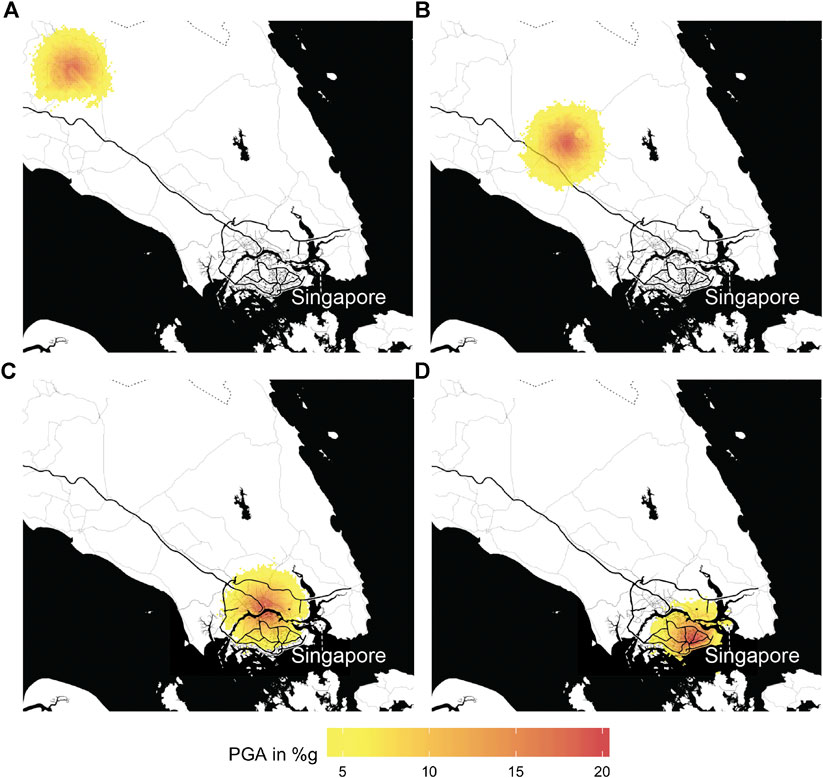
FIGURE 5. (A) Results of the simulated Peak Ground Acceleration (PGA) of a hypothetical earthquake parameters (M4.6, depth 10 km) in southern Malaysia at 2.33oN, 102.90oE, based on evidence of an event in this region in 1922. This is the counterfactual seed event. The color legend is shown for all PGA values that exceed current design level PGA 4.5%g for ground type D, a common ground type in Singapore. We define any location where the simulated PGA exceeds this threshold as the region that could be affected by such an event. The color scale is the same in all four subfigures. (B) The same earthquake parameters at a counterfactual location of 1.98oN, 103.30oE. This counterfactual earthquake is closer to Singapore but not yet affecting Singapore. (C) Another counterfactual location of 1.48oN, 103.80oE. This counterfactual event is located in Johor Bahru, Malaysia, and the potentially affected region spans most of Singapore. (D) The final counterfactual event in this chain, where the event has shifted directly under Singapore at 1.33oN, 103.9oE. The intensity of ground shaking is the highest in this counterfactual. Each scenario is modeled in ShakeMap (Worden et al., 2017); figure made with ggmap package in R (Kahle and Wickham, 2013).
For this model of an unrealized hazard, we apply two counterfactual changes: 1) a shift in time to the present day and 2) multiple geographical shifts throughout peninsular Malaysia. The shift in time dramatically increases the number of people potentially affected by the hazard. In 1921, the then-British Colony of Singapore recorded a population of 418,300 (Yeoh, 2003). This number has since grown dramatically to the present-day (2019) population of 5.7 million people in the city-state of Singapore (Department of Statistics Singapore, 2019). Along with the increase in population comes an increase in exposure to a potential seismic hazard event, which can greatly increase the potential consequence from an earthquake. Next, we explore the geographical shifts defined in Step 2 to computer the corresponding consequence measure (i.e., PGA at the reference location).
The first shift,
At
At
By exploring downward counterfactual realizations of intraplate earthquakes, we identify that an earthquake near Singapore could have significant damaging consequences. The current analysis is limited by a lack of validated ground motion prediction equations for near-field, shallow events in this region, so there is a high level of uncertainty in the present results. This analysis provides motivation for further studies to investigate the effects of damage from a near-field, moderate event to Singapore. More generally, this analysis also suggests that cities in regions that are not considered earthquake-prone still benefit from performing a downward counterfactual analysis of an unrealized moderate intraplate earthquake event such as this one, and ask themselves explicitly if that is a risk they are willing to incur.
Mt. Pinatubo Eruption (1991)
The 1991 eruption of Mt. Pinatubo is one of the largest eruptions in the last century. The climactic eruption of Mt. Pinatubo, located on the island of Luzon in the Philippines, began on June 15, 1991, at about 1340 local time and lasted for up to 10 h (Paladio-Melosantos et al., 1996; Tahira et al., 1996). Satellite images showed that a Plinian plume of up to 40 km high was generated (Holasek et al., 1996). Coincidentally, Typhoon Yunya made landfall over central Luzon about 5.5 h before the start of eruption and exited Luzon about 4.5 h after the start of eruption (Oswalt et al., 1996). Thus, the occurrence of Typhoon Yunya altered the atmospheric conditions during the eruption and hence affected ash dispersal. Previous authors suggested that the strong cyclonic winds and high plume height contributed to the extensive dispersal of ash that affected the airspaces of Southeast Asia region (Casadevall et al., 1996; Paladio-Melosantos et al., 1996). Volcanic ash was observed in Singapore, over 2,000 km away, where photographic records show cars coated with thin layers of volcanic ash. Additionally, an aircraft on the Singapore–Osaka line encountered ash clouds, resulting in damage to some of its engines (Casadevall et al., 1996).
Among all volcanic hazards, volcanic ash is the most widespread with potential impacts infrastructure, health, agriculture production and aviation (Jenkins et al., 2014; Guffanti and Tupper, 2015). The 2010 eruption of Eyjafjallajökull volcano in Iceland revealed the disruptive power of distal fine ash on the aviation sector, with the eruption resulting in a total of US$5.0 billion dollars lost from April 14, 2010 through May 24, 2010 (Oxford Economics, 2010). This amount includes economic contributions due to delayed or canceled flights, productivity losses from workers unable to reach their destinations, visitor spending losses, and disruptions to international trade.
The deposition of ashfall in Singapore could be considered a very low probability event, as it resulted from the unlikely combination of a very large eruption with high plume heights coinciding exactly in time with a typhoon. However, the influence of Typhoon Yunya on the far-field ash dispersal has never been formally quantified, and new studies suggest that the height at which the bulk of the ash was emitted in the atmosphere was actually around 20 km, ∼15 km lower than the top of the plume as identified from satellite imagery and that used for previous eruption reconstructions (e.g., Fero et al., 2009). Thus, we use our framework to determine whether the removal of the coinciding typhoon could result in a downward counterfactual event.
A Downward Counterfactual Shift in Time
First, we identify the event of the 1991 Mt. Pinatubo eruption as the counterfactual seed event. We use the downward counterfactual approach to explore possible other outcomes on Singapore following this eruption and to investigate the influence of Typhoon Yunya on the far-range dispersal of volcanic ash. Specifically, we are interested in assessing whether the typhoon enhanced ashfall on Singapore or rather impeded it, in which case more ashfall could have occurred. We use the most likely eruption source parameters inferred from recent literature as input to the 3D numerical model FALL3D 7.2 (Folch et al., 2009). Atmospheric conditions are retrieved from the ERA-Interim Reanalysis dataset of the European Center for Medium–Range Weather Forecasts (ECMWF; Dee et al., 2011). Next, we define acceptable changes to the historic parameters. In this case, we allow changes in time, within a week of the eruption. Given that the volcano had shown signs of unrest for months previous to the eruption, this shift in time does not change the likelihood of the eruption. The consequence measure is defined as the concentration of volcanic ash at ground level, and the end-of-search criteria is a breach of the aviation standards for air travel (
Results from relaxing historic parameters show a significant change in the spatial distribution of ash, as shown in Figure 6A (With-Typhoon condition,
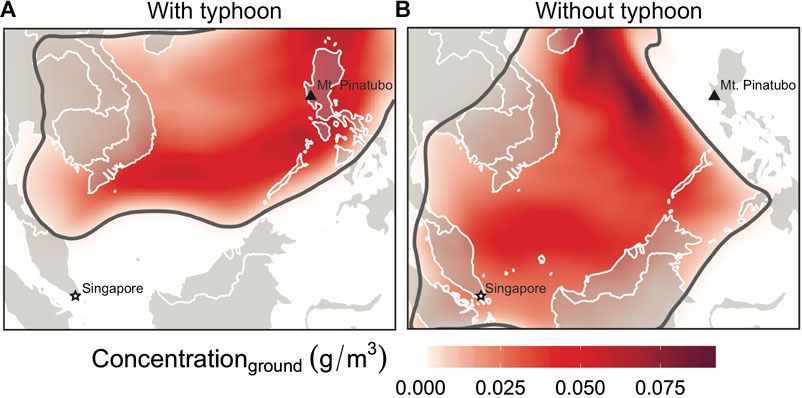
FIGURE 6. Ash distribution at ground level at the end of each scenario (A) with the coinciding typhoon and (B) without the coinciding typhoon. The base layer is a map of Southeast Asia, with land shown in gray, and Singapore’s location is marked with a black star. The dark gray line identifies the boundary of modern-day no-fly concentrations of 0.004 g per cubic meter as defined in Zehner (2012).
This comparison suggests that a shift of a matter of days–in the span of months that the volcano had shown signs of unrest–could have drastically changed consequences for the island-nation of Singapore and many other countries. We also assess a 6 h shift in eruption start time to compare the sensitivity of possible realizations for the Without-Typhoon condition. When we shift the volcanic eruption start time by just another 6 h prior, we again observe significant differences in ash concentration at ground level (Figure 7), with peak ash concentration increasing by over 25% in Singapore at Changi Airport.
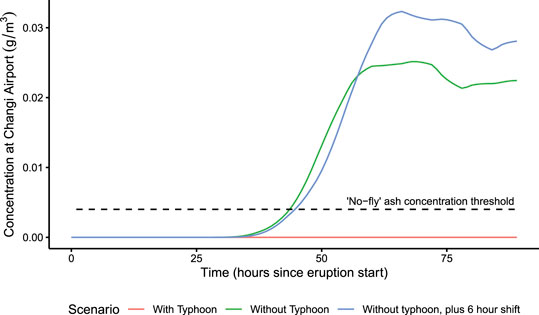
FIGURE 7. Variation in ground-level ash concentration at Changi Airport for three scenarios: the realized With-Typhoon condition, a counterfactual Without Typhoon condition, and the same Without Typhoon condition shifted and additional 6 h in time. The no-fly concentration of 0.004 g per cubic meter as defined in Zehner (2012) is indicated by the black dashed line.
Mt. Pinatubo is just one of the many volcanoes that comprise the so-called “ring of fire” that surrounds Singapore. While Mt. Pinatubo is situated about 2,400 km away, the closest volcano is only 400 km away. Furthermore, Singapore is an extremely dense nation that relies heavily on the movement of people, goods, and services by air, and the shutdown of Changi airport and its airspace would impact not just the well-being of Singapore but the entire region of Southeast Asia, and would likely create cascading bottlenecks beyond Southeast Asia, such as for Australia and New Zealand. In addition to the airport, transit and life within Singapore may be severely impacted, as the capacity for volcanic ash for rail travel or air conditioning units has yet to be quantified. For the businesses and individuals who do have air conditioning and filtration systems installed, some affects may be averted by storing extra filters on hand. In case of mass-demand for new physical components on an island-city-state, there may be significant delays to obtaining enough replacement components in time to mitigate potential health impacts. As not all buildings, including healthcare facilities, are equipped with air conditioning and air filtration systems throughout their interior, we also anticipate that a volcanic ash episode in Singapore would disproportionately affect those who are already in more economically vulnerable situations. Another example of this imbalanced impact is the fact that those who may rely heavily on public transit could also be particularly affected relative to those who can afford to own a private vehicle, as rail travel may be impacted by volcanic ash and any public transit is more likely to expose an individual to open, unfiltered air.
Tropical Cyclone Vamei (2001)
On December 27, 2001, Tropical Cyclone (TC) Vamei made history as the first recorded cyclone to have formed within 3° of the equator, with its lowest latitude recorded at 1.4° (JTWC, 2002). Naval ship observations recorded sustained winds within the eyewall of 75 knots (139 km/h), and gusts of up to 105 knots (194 km/h). TC Vamei made landfall in southeastern Malaysia, just 60 km northeast of Singapore. In neighboring Johor and Pahang States of Malaysia, there was significant flooding and mudslides. Over 17,000 people were evacuated, and there were reports of five deaths (Johnson and Chang, 2007).
Before this event, a tropical cyclone at such low latitudes was thought to be impossible due to a negligible Coriolis force, and many researchers have studied the reasons for this surprising formation. Chambers and Li (2007) suggest that there may be other cyclogenesis events in the past that have simply been missed, as Vamei was captured only with proximity of navy ships and data from the relatively recent launch (1997) of the Tropical Rainfall Measuring Mission. Chang (2003) estimates this event could occur about once every 100–400 years. Due to the potential for strong cold surges in the South China Sea relative to other regions along the equator, they also believe that if another event were to occur in this proximity to the equator, it would most likely take place in the South China Sea again.
A Downward Counterfactual Shift in Geographic Location
At its southernmost record, TC Vamei traveled from east to west at a latitude of 1.4°N (
This case could be extended in multiple ways depending on the interest of the modeler or stakeholder, if additional data and appropriate models were available. For example, all reported wind speeds (for gusts and for sustained winds) exceed the building code standards set forward by the British Standard, and the more current Eurocodes for building design, both which have been used in Singapore. The economic losses of the actual event are estimated to have been around 13.7 million 2001 Malaysian Ringgot (about 3.6 million 2001 USD) (Chang, 2011). However the downward counterfactual unrealized event of a typhoon heading farther south to Singapore could amount to extended delays in air traffic disruption due to damage to airport facilities. It could also result in possible building damage, especially to vulnerable glass facades common throughout the downtown district. These would both greatly affect the cost of this event, since the buildings are not designed with typhoon speed winds in consideration. Furthermore, while Malaysia evacuated 17,000 people from the landfall region, Singapore’s ability to move residents away from a severely impacted region would be more challenging due to its high density population with limited pathways to relocate residents, since it is an dense, largely-urban island-country.
Chang (2011) estimates an event like this to occur once in 100–400 years, which equates to 0.25–1% probability of exceedance in given year (p). However, over the course of a typical property lease in Singapore of 99 years, the probability of an event this close to the equator (anywhere in the world but likely in the South China Sea) occurring at least once is actually 22–63% (i.e., the probability of the event occurring at least once in t-years is equal to 1 minus the probability of the event not occurring at all in that time period:
Insights from Unrealized Events
In attempting to recreate past events exactly, we often overlook the opportunity to explore the many alternatives that might have happened. Sometimes, we explore these possibilities only unintentionally, on the way to reproducing the past occurrence exactly as it had happened; these intermediate results are typically not presented in the final results. These near-true scenarios, however, provide valuable learning opportunities for places that have a limited history with disasters associated with either technological, anthropogenic, or natural hazards. This methodology can be further extended to explore downstream effects, such as damages, losses, recovery, and other stages of pre- and post-disaster risk analysis. Analysis of this dimension presents its own challenges–computationally, to search over multiple variables with potentially large data sets and large uncertainties; from a discipline perspective, to cross through the hazard science and reach through to the impacts and consequences that build the fabric of a city or community.
This approach sets deterministic modeling within a probabilistic context. A past event is first identified to serve as the basis of analysis. This past event serves as the “seed” for the subsequent counterfactual search. The search applies small changes to a given parameter value (small being defined by the difference in probability from the previous parameter value and the proposed parameter value), with each change resulting in a downward result (i.e., larger losses). These changes may be drawn from a number of categories, as identified in Search Categories. In the presented case studies, we applied such changes to develop plausible high-consequence downward counterfactual scenarios.
In some cases, a quantitative consequence analysis is not possible due to a lack of data. By performing a downward counterfactual search on these events with proxies for those consequences (identified by the consequence measure), this framework can help identify areas of research that require further investigation. In other words, a downward counterfactual search can help identify priorities for disaster preparedness and areas of future research where data are currently unavailable or under-available.
Counterfactual thinking may also be applicable in celebrating the positive decisions made in the past that have mitigated losses (an application of the “human decision making” search category) (Rabonza et al., 2020 in review). This approach may also be expanded to the consequential and deeply uncertain context of multi-hazard risk, where single-hazard models fall short of properly assessing impact and risk from mutli-hazard contexts such as consecutive disasters (Ruiter et al., 2020). This could also be used as a means to build collective memory even of an unrealized disaster. Collective memory is the ability to keep awareness high within the community around any particular event (e.g., Viglione et al., 2014). Yet, a near-miss event may never enter the collective memory because it had no direct consequences. As risk perception is heavily affected by personal experience and level of trust in authorities, how a near-miss event is discussed afterward can greatly affect public risk perception (Wachinger et al., 2013), and this downward counterfactual framework may provide one approach to guide this conversation.
The proposed framework facilitates modeling unrealized disasters through downward counterfactual analysis. In Step 4, an acceptable counterfactual change is applied to seek a downward counterfactual event. It is currently left to the particular researcher to decide which permissible change is applied, and in what order. This could be determined through a stochastic approach, algorithmic approach, or expert opinion. This offers both flexibility in the framework, as well as a challenge to implementation as each downward counterfactual search will require careful consideration regarding this decision.
While this framework has been described and demonstrated, a remaining challenge in the greater field of disaster mitigation is to convince stakeholders to take low probability, high consequence events seriously. Future work is needed to assess whether this framework shows promise in aiding risk communication, as a means to overcome difficult human biases that hinder disaster preparedness and mitigation.
Since the events used in this method are rooted in history and has a traceable set of clearly categorized and quantified “nudges” that transform the historical event to the downward counterfactual black swan, this could be applicable in scenario development for emergency preparedness settings. Compared to presenting a hypothetical scenario based in the future, the downward counterfactual provides a more complete context for stakeholders to understand potentially relevant downward risks, and connect to their own experience or experiences in their community.
Conclusion
Current disaster risk modeling methods are insufficient in capturing surprising, low-probability, and/or emergent events. We propose a downward counterfactual analysis framework to help overcome human bias to discount long-term probabilities and tendency to focus on more optimistic outcomes.
In five case studies, we show how to apply downward counterfactual analysis to discover unrealized events based on five past events in Singapore’s history. In each one, we demonstrate how a past event has the potential to provide insight into other unrealized events. By focusing on expanding a single case study to understand all of its possible manifestations, both realized and unrealized, a vivid account of an unrealized event can be achieved on the basis of a realized event, and changed only in specific equal- or near-equal- probability changes. The resulting unrealized events then provide the opportunity to enact proactive change, based on the unrealized lessons-learned. We offer examples of these lessons in each of the case studies to show how a worst-case past event, such as the Hotel New World, could have been much worse with a modest shift in time of 12 h. We also show how some past events were near misses for the city-state of Singapore, such as the 1991 Mt. Pinatubo eruption, and why volcanic ash should still be considered as a potential risk for Singapore. From these lessons learned, we offer suggestions for areas of further research (e.g., further research into near-field intraplate earthquake events), to possible revisions in preparedness plans on an individual level (e.g., having extra air filters on hand).
This framework has been developed with the hope that we need not experience every version of a disaster to learn how to build more resilient communities and cities moving forward. Rather than allow potential lessons-learned to fade into history, the application of this framework in concert with more conventional risk analysis can enable communities to take a more detailed perspective into the true risk they face from natural and technological hazards.
Data Availability Statement
The datasets generated for this study can be found in DR-NTU, the Digital Repository of NTU at https://doi.org/10.21979/N9/MVCHXR.
Author Contributions
YL, DL, SJ, and GW contributed conception and design of the study; YL wrote the first draft of the manuscript with contribution from JC and input from SJ and DL; YCL, JC, and SB performed analysis for case studies. All authors contributed to manuscript revision, read, and approved the submitted version.
Funding
YL, DL, and SJ received funding support from the National Research Foundation, Prime Minister’s Office, Singapore (NRF) under award number NRF2018-SR2001-007, and YL and DL were additionally supported by NRF through award number NRF-NRFF2018-06. JC was supported by the CN Yang Scholars’ Program of Nanyang Technological University. This research is partly supported by the National Research Foundation Singapore and the Singapore Ministry of Education under the Research Centers of Excellence initiative through the Earth Observatory of Singapore. This work comprises Earth Observatory of Singapore contribution number 307.
Conflict of Interest
The authors declare that the research was conducted in the absence of any commercial or financial relationships that could be construed as a potential conflict of interest.
Acknowledgments
We would like to acknowledge the participants of the Counterfactual Black Swans Workshop in 2019 in Singapore, hosted by YL, SJ, and DL, where many of these ideas were discussed and developed (https://disaster-analytics.com/projects/blackswans). We appreciate their time and input to this work, and availability to participate in the workshop. We would also like to thank the developers of USGS ShakeMap, including David Wald, Bruce Worden, and Eric Thompson, for their support in using their software as part of this work. We are grateful for helpful discussions on the background of each of these past events and on risk in Singapore through conversations with Stacey Martin, Adam Switzer, Chung-Han Chan, Mikinori Kuwata, and Janice Lee. We acknowledge the use of data and imagery from LANCE FIRMS operated by NASA’s Earth Science Data and Information System (ESDIS) with funding provided by NASA Headquarters.
References
Ambraseys, N. N., Melville, C. P., and Adams, R. D. (1994). The seismicity of Egypt, Arabia and the Red sea: a historical review. Cambridge, United Kingdom: Cambridge University Press, 204.
Aspinall, W., and Woo, G. (2019). Counterfactual analysis of runaway volcanic explosions. Front. Earth Sci. 7, 222. doi:10.3389/feart.2019.00222
Ayyaswamy, P., Hauss, B., Hseih, T., Moscati, A., Hicks, T., and Okrent, D. (1974). Estimates of the risks associated with dam failure. Los Angeles, CA: California University School of Engineering and Applied Science. Technical Report.
Bird, P. (2003). An updated digital model of plate boundaries. Geochem. Geophys. Geosyst. 4, 1027. doi:10.1029/2001GC000252
Casadevall, T. J., Delos Reyes, P., and Schneider, D. J. (1996). “The 1991 Pinatubo eruptions and their effects on aircraft operations,” Fire and Mud: eruptions and lahars of Mount Pinatub. Quezon City, Philippines: Philippine Institute of Volcanology and Seismology, 625–636.
Chambers, C. R. S., and Li, T. (2007). Simulation of formation of a near-equatorial typhoon Vamei (2001). Meteorol. Atmos. Phys. 98, 67–80. doi:10.1007/s00703-006-0229-0
Chang, C.-H. (2011). Preparedness and storm hazards in a global warming world: lessons from Southeast Asia. Nat. Hazards. 56, 667–679. doi:10.1007/s11069-010-9581-y
Chang, C.-P. (2003). Typhoon Vamei: an equatorial tropical cyclone formation. Geophys. Res. Lett. 30, 1150. doi:10.1029/2002GL016365
CRED (2020). Data from: EM-DAT: the emergency events database - Université catholique de Louvain (UCL)-CRED, D. Guha-Sapir - www.emdat.be, Brussels, Belgium.
Crossette, B. (1986). After 36 hours, 2 are rescued from the ruins in Singapore. The New York Times, A, March, 17.
Dee, D. P., Uppala, S. M., Simmons, A. J., Berrisford, P., Poli, P., Kobayashi, S., et al. (2011). The ERA-Interim reanalysis: configuration and performance of the data assimilation system. Q. J. R. Meteorol. Soc. 137, 553–597. doi:10.1002/qj.828
Department of Statistics Singapore (2019). Population trends 2019. Government of Singapore. Technical Report.
Ebel, J. E. (2009). Analysis of aftershock and foreshock activity in stable continental regions: implications for aftershock forecasting and the hazard of strong earthquakes. Seismol. Res. Lett. 80, 1062–1068. doi:10.1785/gssrl.80.6.1062
Fero, J., Carey, S. N., and Merrill, J. T. (2009). Simulating the dispersal of tephra from the 1991 Pinatubo eruption: implications for the formation of widespread ash layers. J. Volcanol. Geoth. Res. 186, 120–131. doi:10.1016/j.jvolgeores.2009.03.011
Folch, A., Costa, A., and Macedonio, G. (2009). FALL3D: a computational model for transport and deposition of volcanic ash. Comput. Geosci. 35, 1334–1342. doi:10.1016/j.cageo.2008.08.008
Forsyth, T. (2014). Public concerns about transboundary haze: a comparison of Indonesia, Singapore, and Malaysia. Global Environ. Change. 25, 76–86. doi:10.1016/j.gloenvcha.2014.01.013
García Kerdan, I., Morillón Gálvez, D., Raslan, R., and Ruyssevelt, P. (2015). Modelling the energy and exergy utilisation of the Mexican non-domestic sector: a study by climatic regions. Energy Pol. 77, 191–206. doi:10.1016/j.enpol.2014.10.024
Guffanti, M., and Tupper, A. (2015). “Volcanic ash hazards and aviation risk,” in Volcanic hazards, risks, and disasters. Editor P. Papale (Amsterdam, Netherlands: Elsevier), 87–108.
Heil, A., and Goldammer, J. G. (2001). Smoke-haze pollution: a review of the 1997 episode in Southeast Asia. Reg. Environ. Change. 2, 24–37. doi:10.1007/s101130100021
Holasek, R. E., Self, S., and Woods, A. W. (1996). Satellite observations and interpretation of the 1991 Mount Pinatubo eruption plumes. J. Geophys. Res. 101, 27635–27655. doi:10.1029/96JB01179
Jenkins, S. F., Spence, R. J. S., Fonseca, J. F. B. D., Solidum, R. U., and Wilson, T. M. (2014). Volcanic risk assessment: quantifying physical vulnerability in the built environment. J. Volcanol. Geoth. Res. 276, 105–120. doi:10.1016/j.jvolgeores.2014.03.002
Jha, A., Basu, R., and Basu, A. (2016). Studying policy changes in disaster management in India: a tale of two cyclones. Disaster Med. Public Health Prep. 10, 42–46. doi:10.1017/dmp.2015.116. Publisher
Johnson, R. H., and Chang, C.-P. (2007). Winter vortex: a quarter-century and beyond. American Meteorological Society. Technical Report. Available at: (Accessed July 1, 2019).
JTWC (2002). 2001 annual tropical cyclone report. Joint Typhoon Warning Center. Technical Report. Available at: (Accessed February 9, 2020).
Kahle, D., and Wickham, H. (2013). Ggmap: spatial visualization with ggplot2. R J. 5, 144–161. doi:10.32614/rj-2013-014
Knapp, K., Diamond, H., Kossin, J., Kruk, M., and Schreck, C. (2018). Data from: International best track archive for climate stewardship (IBTrACS) project, Version 4. doi:10.25921/82ty-9e16. (Accessed November 06, 2019).
Knapp, K. R., Kruk, M. C., Levinson, D. H., Diamond, H. J., and Neumann, C. J. (2010). The international best track archive for climate stewardship (IBTrACS). Bull. Am. Meteorol. Soc. 91, 363–376. doi:10.1175/2009BAMS2755.1
Lai, A. Y.-H., and Tan, S. L. (2015). “Impact of disasters and disaster risk management in Singapore: a case study of Singapore’s experience in fighting the sars epidemic,” in Resilience and recovery in Asian disasters: community ties, market mechanisms, and governance, risk, governance, and Society. Tokyo, Japan: Springer, Vol. 18.
Lee, M. K. (2015). Haze in Singapore: a problem dating back 40 years. The Straits Times, October, 2.
Li, B., and Pan, T.-C. (2007). Seismic behavior of non-seismically detailed reinforced concrete structural systems and components - what have we been learning?. J. Earthq. Tsunami. 1, 139–159. doi:10.1142/S1793431107000092
Lin, Y. C., Khan, F., Jenkins, S., and Lallemant, D. (In Review). Filling the disaster data gap: lessons from cataloging Singapore’s past disasters. Int. J. Disaster Risk Reduct.
Martin, S. S., Locati, M., and Sieh, K. (2018). “Gempa nusantara: a new digital database of felt intensity for historical earthquakes in the Indonesian archipelago,” in 2018 Seismology of the Americas Meeting. (Seismological Research Letters), 884.
Mestav Sarica, G., Zhu, T., and Pan, T.-C. (2020). Spatio-temporal dynamics in seismic exposure of asian megacities: past, present and future. Environ. Res. Lett. 15, 094092. doi:10.1088/1748-9326/ababc7
Minoura, K., Imamura, F., Sugawara, D., Kono, Y., and Iwashita, T. (2001). The 869 Jogan tsunami deposit and recurrence interval of large-scale tsunami on the Pacific coast of northeast Japan. J. Nat. Disaster Sci. 23, 83–88.
Minoura, K., and Nakaya, S. (1991). Traces of tsunami preserved in inter-tidal lacustrine and marsh deposits: some examples from northeast Japan. J. Geol. 99, 265–287. doi:10.1086/629488
Mistry, R., Dong, W., and Shah, H. (2001). Interdisciplinary observations on the January 2001 Bhuj, Gujarat earthquake. World Seismic Safety Initiative, 146.
Mousavizadeh, A., Maltby, H., Caruana-Galizia, P., Xue, F., Gernelli, G., Bradley, M., et al. (2016). The legatum prosperity index. London, United Kingdom: The Legatum Institute Foundation.
NASA FIRMS (2019). Data from: MODIS active fire Detections extracted from MCD14ML distributed by NASA FIRMS. Available at: https://earthdata.nasa.gov/firms. (Accessed October 03, 2019).
National Geographic (2005). Seconds from disaster: hotel collapse Singapore (national geographic channel) Season 2, Episode 9, September, 27.
Neale, B. (2001). “Forensic engineering: the investigation of failures,” in Proceedings of the second international conference on forensic engineering organized by the institution of civil engineers and held, London, United Kingdom, November 12–13, 2001 (Thomas Telford).
Oswalt, J., Nichols, W., and O’Hara, J. (1996). “Meteorological observations of the 1991 mount pinatubo eruption,” in Fire and mud: eruptions and lahars of mount pinatubo. Quezon City, Philippines: Philippine Institute of Volcanology and Seismology, 625–636.
Oxford Economics (2010). The economic impacts of air travel restrictions due to volcanic ash. Technical Report.
Paladio-Melosantos, M. L. O., Solidum, R. U., Scott, W. E., Quiambao, R. B., Umbal, J. V., Rodolfo, K. S., et al. (1996). “Tephra falls of the 1991 eruptions of Mount Pinatubo,”in Fire and mud: eruptions and lahars of Mount Pinatubo, Philippines. Seattle, WA: University of Washington Press, Vol. 28
Petersen, M. D., Dewey, J., Hartzell, S., Mueller, C., Harmsen, S., Frankel, A., et al. (2004). Probabilistic seismic hazard analysis for Sumatra, Indonesia and across the southern Malaysian peninsula. Tectonophysics 390, 141–158. doi:10.1016/j.tecto.2004.03.026
Quah, E., and Mun, C. W. (2019). What the 2015 haze cost Singapore: $1.83 billion. The Straits Times, September 17, Available at: https://www.straitstimes.com/opinion/what-the-2015-haze-cost-spore-183-billion.
Rabonza, M. L., Lin, Y. C., and Lallemant, D. (2020). “Celebrating successful earthquake risk reduction through counterfactual probabilistic analysis,” in the 17th World Conference on Earthquake Engineering, Sendai, Japan, September 13–18, 2020.
Roese, N. J. (1994). The functional basis of counterfactual thinking. J. Pers. Soc. Psychol. 66, 805. doi:10.1037/0022-3514.66.5.805
Roese, N. J. (1997). Counterfactual thinking. Psychol. Bull. 121, 133. doi:10.1037/0033-2909.121.1.133
Roese, N. J., Hur, T., and Pennington, G. L. (1999). Counterfactual thinking and regulatory focus: implications for action versus inaction and sufficiency versus necessity. J. Pers. Soc. Psychol. 77, 1109. doi:10.1037/0022-3514.77.6.1109
Ruiter, M. C., Couasnon, A., Homberg, M. J. C., Daniell, J. E., Gill, J. C., and Ward, P. J. (2020). Why we can no longer ignore consecutive disasters. Earth's Future. 8, 1–19. doi:10.1029/2019EF001425
Sawai, Y., Namegaya, Y., Okamura, Y., Satake, K., and Shishikura, M. (2012). Challenges of anticipating the 2011 Tohoku earthquake and tsunami using coastal geology. Geophys. Res. Lett. 39, L21309. doi:10.1029/2012GL053692
Shepherd, T. G., Boyd, E., Calel, R. A., Chapman, S. C., Dessai, S., Dima-West, I. M., et al. (2018). Storylines: an alternative approach to representing uncertainty in physical aspects of climate change. Climatic Change. 151, 555–571. doi:10.1007/s10584-018-2317-9
Swafford, L., and Stein, S. (2007). “Limitations of the short earthquake record for seismicity and seismic hazard studies,” in Continental intraplate earthquakes: science, hazard, and policy issues. Boulder, CO: Geological Society of America, 402.
Tahira, M., Nomura, M., Sawada, Y., and Kamo, K. (1996). “Infrasonic and acoustic-gravity waves generated by the Mount Pinatubo eruption of June 15, 1991,” in Fire and mud: eruptions and lahars of Mount Pinatub. Quezon City, Philippines: Philippine Institute of Volcanology and Seismology, 601–614.
The Economist (2017). Safe cities index 2017: Security in a rapidly urbanizing world. The Economist. Available at: https://safecities.economist.com/safe-cities-index-2017/.
Thean, J. L. P., Vijiaratnam, A., Lee, S., and Broms, B. B. (1987). Report of the inquiry into the collapse of hotel new world. Government of Singapore.
USGS (2004). Data from: Earthquake catalog for stable continental regions. Available at: https://earthquake.usgs.gov/data/scr_catalog.php. (Accessed May 28, 2019).
USGS (2019). Data from: Earthquake catalog. Available at: https://earthquake.usgs.gov/earthquakes/search/ (Accessed September 26, 2019).
Velasco, E., and Rastan, S. (2015). Air quality in Singapore during the 2013 smoke-haze episode over the Strait of Malacca: lessons learned. Sus. Cities Soc. 17, 122–131. doi:10.1016/j.scs.2015.04.006
Viglione, A., Di Baldassarre, G., Brandimarte, L., Kuil, L., Carr, G., Salinas, J. L., et al. (2014). Insights from socio-hydrology modelling on dealing with flood risk–roles of collective memory, risk-taking attitude and trust. J. Hydrol. 518, 71–82. doi:10.1016/j.jhydrol.2014.01.018
Wachinger, G., Renn, O., Begg, C., and Kuhlicke, C. (2013). The risk perception paradox-implications for governance and communication of natural hazards. Risk Anal. 33, 1049–1065. doi:10.1111/j.1539-6924.2012.01942.x
Wilkinson, S., Rotimi, J. O. B., and Mannakarra, S. (2014). “Legislation changes following earthquake disasters,” in Encyclopedia of earthquake engineering.Editors M. Beer, I. A. Kougioumtzoglou, E. Patelli, and I. S.-K. Au (Berlin, Heidelberg: Springer Berlin Heidelberg), 1–10.
Woo, G. (2019). Downward counterfactual search for extreme events. Front. Earth Sci. 7, 340. doi:10.3389/feart.2019.00340
Woo, G., Maynard, T., and Seria, J. (2017). Reimagining history: Counterfactual risk analysis. Emerging risk report. Available at: https://www.lloyds.com/news-and-risk-insight/risk-reports/library/understanding-risk/reimagining-history.
Worden, C. B., Thompson, E., Hearne, M., and Wald, D. J. (2017). ShakeMap V4 Manual: technical manual, user’s guide, and software guide, U. S. Geological Survey, 1–156.
Yeoh, B. S. (2003). Contesting space in colonial Singapore. Honolulu, Hawaii: University of Hawaii Press, 380.
Keywords: risk framework, sensitivity analysis, counterfactual thought experiments, scenario development, horizon scanning
Citation: Lin YC, Jenkins SF, Chow JR, Biass S, Woo G and Lallemant D (2020) Modeling Downward Counterfactual Events: Unrealized Disasters and why they Matter. Front. Earth Sci. 8:575048. doi: 10.3389/feart.2020.575048
Received: 22 June 2020; Accepted: 11 September 2020;
Published: 06 November 2020.
Edited by:
Carmine Galasso, University College London, United KingdomReviewed by:
Flavia De Luca, University of Bristol, United KingdomGemma Cremen, University College London, United Kingdom
Copyright © 2020 Lin, Jenkins, Chow, Biass, Woo and Lallemant. This is an open-access article distributed under the terms of the Creative Commons Attribution License (CC BY). The use, distribution or reproduction in other forums is permitted, provided the original author(s) and the copyright owner(s) are credited and that the original publication in this journal is cited, in accordance with accepted academic practice. No use, distribution or reproduction is permitted which does not comply with these terms.
*Correspondence: Yolanda C. Lin, eWNsQHVubS5lZHU=