 Fiia Nurminen1*
 Paolo Boncio1,2
 Francesco Visini3
 Bruno Pace1,2
 Alessandro Valentini1
 Stéphane Baize4
 Oona Scotti4
- 1DiSPUTer, University “G. d’Annunzio” of Chieti-Pescara, Chieti, Italy
- 2CRUST—Centro inteRUniversitario per l’analisi SismoTettonica tridimensionale con applicazioni territoriali, Chieti, Italy
- 3INGV—Istituto Nazionale di Geofisica e Vulcanologia, Sezione di Pisa, Pisa, Italy
- 4IRSN—Institut de Radioprotection et de Sûreté Nucléaire, Fontenay-aux-Roses, France
Probabilistic fault displacement hazard analysis provides a systematic approach to estimate the likelihood of occurrence and expected amount of surface displacement during an earthquake on-fault (principal fault rupturing) and off-fault (distributed rupturing). The methodology is based on four key parameters describing the probability of occurrence and the spatial distribution of the displacement both on and off-fault. In this work we concentrate on off-fault rupturing, and develop an original probability model for the occurrence of distributed ruptures and for the expected displacement distribution based on the compilation and reappraisal of surface ruptures from 15 historical crustal earthquakes of reverse kinematics, with magnitudes ranging from Mw 4.9 to 7.9. We introduce a new ranking scheme to distinguish principal faults (rank 1) from simple distributed ruptures (rank 2), primary distributed ruptures (rank 1.5), bending-moment (rank 21) and flexural-slip (rank 22) and triggered faulting (rank 3). We then used the rank 2 distributed ruptures with distances from the principal fault ranging from 5 to 1,500 m. To minimize bias due to the incomplete nature of the database, we propose a “slicing” approach as an alternative to the “gridding” approach. The parameters obtained from slicing are then is then combined with Monte Carlo simulations to model the dependence of the probability of occurrence and exceedance with the dimensions and position of the site of interest with respect to the principal fault, both along and across strike. We applied the probability model to a case-study in Finland to illustrate the applicability of the method given the limited extend of the available dataset. We finally suggest that probabilistic fault displacement hazard model will benefit by evaluating spatial distribution of distributed rupture in the light of spatial completeness of the input data, structural complexity and physics observables of the causative fault.
Introduction
Probabilistic fault displacement hazard analysis (PFDHA) is a method developed for characterizing the expected amount and distribution of co-seismic fault displacement at the surface. In a PFDHA, the probability of exceeding a certain amount of displacement at a site is represented as a function of the earthquake magnitude frequency distribution, the ensuing probability of surface rupturing, and distribution of distances from the fault trace to the site. The key element in surface rupturing analysis is the differentiation between the principal fault rupturing (PF), and distributed rupturing (DR). PF is the fault plane along which the energy releases during the seismic event; DR (also known as secondary rupturing) refers to all the other surface ruptures, often less continuous, occurring away from PF. The PFDHA methodology was developed for normal faulting environments by the working group of Youngs et al. (2003) and developed further for strike-slip faults by Petersen et al. (2011). For the case of reverse faults, Moss and Ross (2011) worked specifically on PF data whereas Takao et al. (2013) worked on both strike-slip and reverse faults but using data only from Japanese earthquakes. In depth analysis of the DR data for reverse faulting earthquakes has not received much attention from the scientific community. The present work is a first step toward filling this gap.
In the following, this article describes the construction of the database of surface ruptures for reverse faulting earthquakes, the methodology used for obtaining the empirical parameters, and the mathematical approach used to model the occurrence and displacement distribution of DR based on the database. In the final part, the new regression parameters are applied to model the distributed surface rupturing hazard along the Suasselkä post-glacial fault (PGF) situated in Lapland, Northern Finland. It is a several tens of kilometres long reverse fault along which several geological and geophysical research projects are ongoing. This fault was chosen as an example case because the Suasselkä PGF may be considered still active today (Ojala et al., 2019a) and thus a potential source of a surface rupturing earthquake.
Constructing the Database and Ranking the Observations
The work initiated by developing a database of surface faulting data of well documented reverse faulting earthquakes. The displacement parameters and the spatial distribution of surface faulting were analyzed from georeferenced maps and published datasets. Following the SURE database architecture (Baize et al., 2019), we built a database of surface rupturing displacement reported in publications for 15 historical medium-large reverse earthquakes of moment magnitude from Mw 4.9 to Mw 7.9, occurred between 1970 and 2019. The selected events were all studied with an acceptable accuracy on site, and there are good quality displacement data and mapped fault traces available. All the displacement measurements and fault orientation parameters reported by the first-hand authors were entered in the database as published. Although displacement data available is not uniform, all the published information was entered as it was published introducing the least interpretation possible. The events, their key parameters used in this study, and the referenced documents used are listed in Table 1.

TABLE 1. Reverse earthquakes included in the database.
The ruptures in the database were distinguished between principal fault rupture (PF) and DR following the definition of Youngs et al. (2003) where the PF tend to have rather continuous fault traces hosting the major displacements, whereas DR are characterized often by shorter, discontinuous traces of smaller displacement in respect to the PF. However, in order to be able to clearly identify and possibly exclude data affected by structural complexities in the derivation of PFDHA empirical regressions, several sub-ranking categories for DR are also proposed beyond the classical PF and DRs categories (Figure 1). Distinguishing between these is seen as important due to the different mechanisms behind them (Boncio et al., 2018). Consequently, for the generalized analysis, we are able to exclude the complex-type DR, that are likely related to the local structural setting, namely the occurrence of active folding related to the earthquake as illustrated in Figure 1. In the simplest case, rupturing along PF (rank 1) provokes spontaneous and discontinuous rupturing beyond this PF with a displacement significantly smaller which is referred to as “simple DR” (rank 2). By this we mean the rupturing occurred as a direct response to the surface rupturing along the PF in unpredictable locations. In favorable conditions, surface rupturing may take place also on pre-existing faults connected to the PF at depth along so called “primary DR” (rank 1.5), or along a disconnected, distant triggered fault (rank 3). Primary DRs may actually host significant displacement, and their surface traces are often relatively continuous. Triggered surface faulting takes place typically along pre-existing fault at a remarkable distance from the PF, but the surface fault is usually rather discontinuous. Furthermore, reverse faulting may lead to bending-moment (rank 21) and flexural-slip (rank 22) DR as defined by Philip and Megharoui (1983) and Yeats (1986); both of these being highly influenced by the specific geological structures favoring this type of faulting (especially active folding in relation to earthquake faults). The database contents by earthquake and fault ranking are listed in Supplementary Table S2.
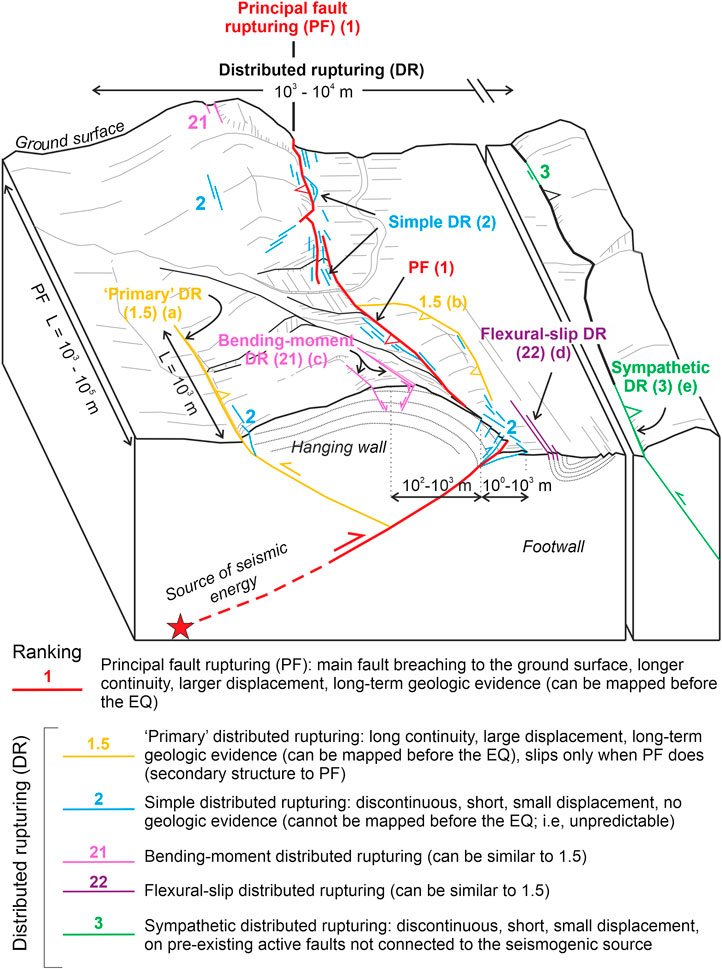
FIGURE 1. Schematic illustration of fault ranking for reverse faults. Principal fault rupture (1) is the surface expression of the fault responsible for the earthquake, the other fault types being various kind of off-fault rupturing. Primary distributed rupturing (1.5) refers to the pre-existing faults that are connected to the principal fault in depth. These, however, rupture only together with the PF. Simple distributed rupturing (2) is the most general case of off-faulting, referring to the surface rupturing on unpredictable locations (not pre-existing faulting, or hidden small pre-existing faults). Bending-moment (21) and flexural-slip (22) rupturing are both responses to large scale folding. Sympathetic rupturing (3) occurs along a pre-existing fault that is triggered usually for rather discontinuous rupturing. Complex DR inspired by (a) Tsauton back-thrust and (b) Tsauton frontal synthetic splay of Chi Chi 1999 rupture (Ota et al., 2007); (c) central zone (normal faults at extrados of folds in the hanging wall of the main thrust), (d) northern zone (bedding plane slips in the sub-vertical limb of a footwall syncline), and (e) distant ruptures east of central zone of El Asnam 1980 rupture (Philip and Meghraoui, 1983). See Supplementary Figure S1 for examples of rupture ranking.
The dataset is based on empirical field work, and the locations of the earthquakes and their surface deformation zones vary from very urbanized to hardly reachable mountain areas. During field survey after a surface-rupturing earthquake, geological investigations mainly focus on tracing and measuring PFs. Moreover, surface extension and spatial density of the DR are not always uniform along the ruptures of the corresponding PF and there is a large variability among the 15 earthquakes. We can attribute the variability in the database to a) the spatial completeness of data available, or b) physical reasons. For example, the spatial completeness can be affected by some areas not being accessible for field surveying, or the surface extension of the PF was too large to map all the DRs in detail. Also, the length of the DRs is a subject of mapping accuracy and interpretation. For example, in areas like San Fernando (urban area), many DRs are measured along the streets, thus rupture length ∼ street width, and single traces are drawn discontinuous under buildings and similar obstacles. Physical elements that may have caused bias in the data coverage are due to DR formation being favored in correspondence to geometrical complexities connected to the PF or reflect the co-seismic patches at depth. For addressing the issue of likely incompleteness of the DR mapping, we developed an approach that generalizes the probability of DR occurrence along the strike of PF by making no assumption of the completeness of the database; we call this approach “slicing” and it is explained more in detail in the following chapter. Later, we balance this probability with the ratio of the total length of DR with respect to the PF length for each earthquake.
Figure 2 shows the length distribution of the DR segments, and the number of DR segments per earthquake for hanging wall and footwall separately. When considering “all types” DR, the distribution of the rupture lengths in the hanging wall and footwall ranges from 1 to 3,665 m and 1 to 2,155 m, respectively, (Figures 2A,B); the mean length on hanging wall is 82.2 and 184.1 m on the footwall, and the 16th to 84th percentiles are 11.6–130.3 m on hanging wall, and 12.4–310.3 m on the footwall. Peaks in the simple DR length distributions are in the range of 2–25 m, the mean being 66.5 m for the hanging wall and 106.3 m for the footwall, and the 16th to 84th percentiles are 6.7 and 73.7 m for hanging wall, and 8.8 and 181.7 m for the footwall. The distribution of the number of DR segments per earthquake when considering only the simple DR, in the hanging wall and footwall ranges, respectively, from 1 to 270 and from 1 to 41, the mean being 52 for the hanging wall and 9 for the footwall, and the 16th to 84th percentiles are 7 and 109 for hanging wall and 1 and 15 for the footwall (Figures 2C,D). The distributions in length and number of DRs and their spatial distribution are based on the maps published by the field working groups handled with the lowest level of interpretation possible.
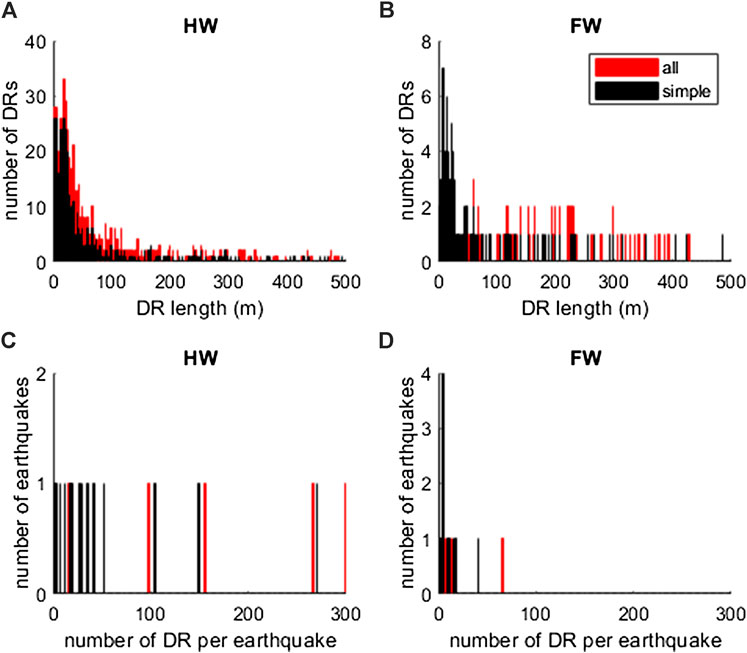
FIGURE 2. Number of distributed ruptures and associated DR lengths on hanging wall (A) and footwall (B) sides. For the sake of readability the DR lengths shown in histogram are cut in first 500 m of length, the maximum DR length being 3,665 m on hanging wall, and on footwall 1,480 m when considering only simple type DR, and 2,156 m when considering all types of DR. The graphs below show the number of DRs per earthquake on hanging wall (C) and footwall (D). All types of DR plotted on red, simple types of DR (only ranking 2) being a subset of “all” plotted on black.
The shapefiles of the surface ruptures and displacement data including the fault ranking of the 15 reverse earthquakes used in this work are included in the Supplementary Table S1 and will be part of the next SURE database release. Data and results from this work contribute also to the Fault Displacement Hazard Initiative (FDHI) working group (Sarmiento et al., 2019; https://www.risksciences.ucla.edu/nhr3/fdhi/home).
Methodology for Probabilistic Fault Displacement Hazard Analysis
PFDHA begins similarly to the traditional probabilistic seismic hazard assessment with seismic source identification, and characterization of the earthquake frequency and distance distributions, but instead of ground motion distribution, continues with calculating the conditional probability of exceeding a displacement d (Youngs et al., 2003). Thus, for obtaining this conditional probability of exceeding a certain displacement level at a given distance from the PF, we need empirical attenuation relationships from the historical surface rupturing earthquakes describing the probability of DR occurrence and the displacement distribution as a function of the distance from the PF. Previous works (e.g., Moss and Ross, 2011) have analyzed the PF faulting parameters for reverse faulting earthquakes, whereas in this work the emphasis is on obtaining the probability distribution and expected displacement of distributed rupturing. The methodology used for obtaining these parameters is described in the following.
In the approaches based on gridding (Youngs et al., 2003; Petersen et al., 2011), the probability of DR occurrence, also referred to as off-fault displacement to distinguish it from on-fault rupturing for PF, is calculated for a given cell area located off the PF. The probability of a DR to pass through the site of interest is a function of the distance from the PF trace and of the surface area occupied by the site of interest. The grid approach to evaluate the probability of having a nonzero displacement within the area of interest is based on the rate of the observed number of cells with at least one rupture over the entire number of cells at the same distance from the PF. Logistic regression model was used by Youngs et al. (2003) to compute the conditional probability of distributed rupturing occurring at a point, using a functional forma that incorporates the observed trends of decreasing frequency with increasing distance, increased density with increasing magnitude and lower frequency and faster decrease in frequency with increasing distance on the footwall than on the hanging wall side. According to the PFDHA methodology (Youngs et al., 2003; Petersen et al., 2011), the rate (λ) at which the displacement (d) on a site at a distance >0 from a PF exceeds a specified level (x, with x > 0) is conducted by solving the equation:
where
(1) α(m) is the annual rate of occurrence of an earthquake with magnitude m.
(2) P [D > 0 | m] is the probability of having surface rupture on the PF, given that an earthquake with magnitude m occurred on the fault.
(3) P [d > 0 | r, G] represents the probabilities of having a nonzero displacement at a distance r from the PF, as a function of a vector (G) that include magnitude and that can additionally include the dimension of the site of interest and the expected total length of DRs.
In this paper we introduce the “slicing” method, more of which in the following chapter, in which the term P [d > 0 | r, G] is divided in two terms: P [d > 0 | r, m] and P [d > 0 | r, dim, F]. The former represents the probability of having a DR occurrence in a slice, being a function of the distance from the PF, with no regards of the dimensions of the site of interest. The latter expresses the conditional probability of having a DR within the site, given the occurrence of DR at the given distance. This term is a function of the dimensions of the site (dim), and of the fraction (F) of total DR length in respect to the length of the PF at the distance r, and
(4) P [d > = x | s, m, DN] is the probability that the DR displacement exceeds a given value (x), given r, m and DN., where DN is the displacement expected at a particular position along the strike of the PF (to account for the variability in rupture location and displacement on the PF) and s represents the closest distance to that position from the DR.
For the purpose of this work, we assume that an earthquake with magnitude m produces surface faulting on the PF, and we focus on the third and fourth terms of Eq. 1 which require analyzing the spatial distribution of DR, deriving the most suitable measure of the displacement components along DR from the data collected in the database, estimating the probability of DR and finally estimating the probability of exceedance of a target level of displacement.
Measurements From the Database: Distance Parameter r
We introduce here a new method called “slicing” for the analysis of the spatial distribution of DR. In the “slicing” approach, the area off the PF is divided in 10 m wide slices parallel to the PF strike. Slices containing at least a part of a DR segment are counted considering the distance from the PF (Figure 3). In practice, we first calculate the distance from DRs to the PFs by resampling the DRs and PF traces, filling in any gaps in coordinate data vectors greater than a defined 10 m tolerance apart in either dimension. We then calculate the minimum DRs to PF point-to-point distance. This point-to-point distance we name “r” (Figure 4A). According to the ranking introduced in Figure 1, we calculate the distance r for a DR of
(1) rank 2 with respect to rupture traces of rank 1 or 1.5, whichever the closest;
(2) rank 1.5 with respect to rupture traces of rank 1; and
(3) rank 21, 22, or 3 with respect to rupture traces of rank 1.
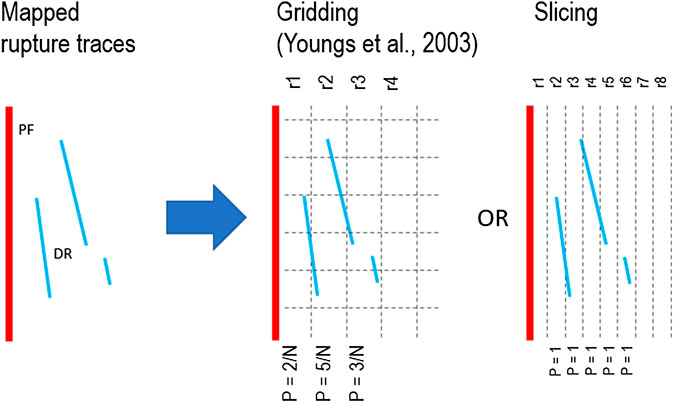
FIGURE 3. Principle of “slicing” in comparison to gridding. From the map view the occurrence of the distributed ruptures (blue lines) is analyzed in a cell (gridding) or within a slice (slicing) parallel to the principal fault (red line). The approach used for obtaining the probability of DR occurrence in slicing is independent of the fault-normal division into grids, and the completeness of the rupture tracing.
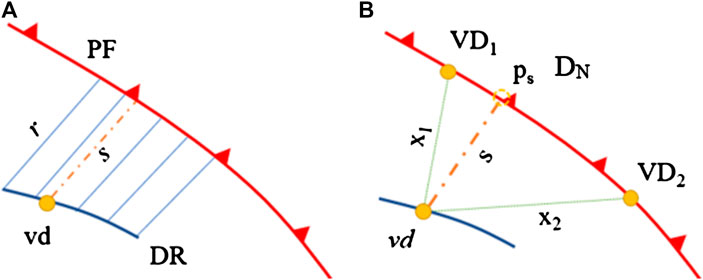
FIGURE 4. The measurements obtained from the georeferenced maps and displacement data of each earthquake in the dataset distinguishing the principal fault (PF; red line) and distributed ruptures (DR; thick blue line). (A) The definition of the distances “r” and “s,” and (B) ps is the nearest point of the PF to the vd. The DN at ps is calculated considering VD1, VD2 and the corresponding distances. See text for details.
The width and interval of the slice, as well as the resampling tolerance are chosen, so as to reflect the resolution of the original maps used and still provide sufficient precision for the modeling.
The frequency–distance distributions of DRs is computed as the sum of slices intercepting at least a partial DR segment, normalized to the total number of the events. When the data of all earthquakes in the database are brought together, for each slice of distance r we can have a value ranging from 0 (none of the earthquakes has a rupture within the slice) to the total number of the events (all the earthquakes have at least a part of a DR segment intercepting the slice). This count is divided by the number of earthquakes to obtain the frequency. In Figure 5 we grouped the earthquakes according to the magnitude: 1) Mw 5 ≤ M < Mw 6 (including Mw 4.9 Le Teil earthquake), 2) Mw 6 ≤ M < Mw 7, and 3) M ≥ Mw 7. Notice however, that the number of earthquakes per class of magnitude is small: 5, 6, and 4, respectively. The list of measurements r, their length, and the ranking of the DR as well as the ranking of the corresponding primary trace (1 or 1.5) are given in Supplementary Table S3.
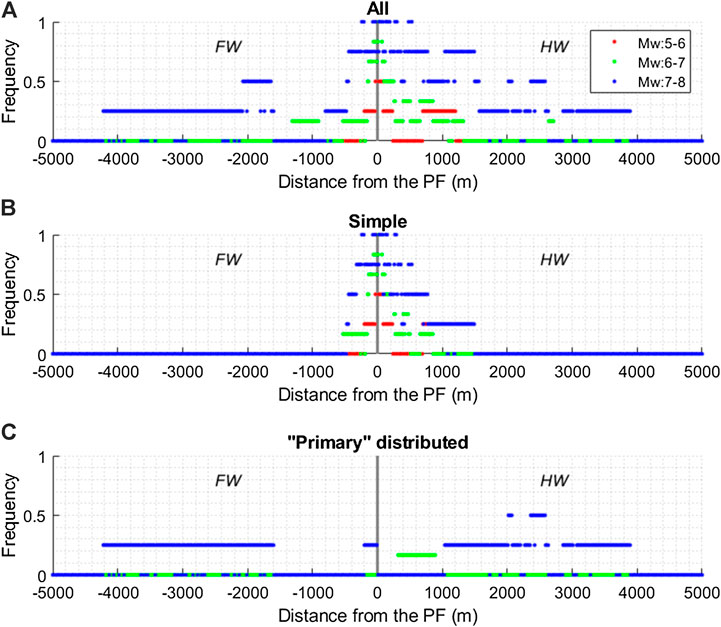
FIGURE 5. Frequency of distributed rupturing as a function of the distance r from the PF for three classes of magnitude considering (A) all types of DR, (B) only simple DR (ranking 2), or (C) only “Primary” distributed rupturing (ranking 1.5) on footwall (FW) and hanging wall (HW) sides.
Unlike the previous approaches utilizing gridding (Youngs et al., 2003; Petersen et al., 2011), the “slicing” method does not contain an assumption on the completeness of the database along the PF strike. We implicitly accept the very likely situation that not all the area is studied with the same precision in the field, as some parts can be hard if not impossible to reach. On the other hand, it is also likely that distributed rupturing does not occur homogenously along the PF strike due to the physical factors, such as subterranean structures and material distribution, and the mechanics of the process. This will be accounted for when we introduce in the analysis an estimate of the relative coverage of the DR mapping with respect to the PF length, as will be shown later.
Measurements From the Database: Vertical Displacement and the Distance Parameter s
In situ measurements are performed and reported in different ways from one study to another. The field conditions (visibility, accessibility, presence of displaced, and matching features) impact on the possibility to measure the displacement, and the available slip components might not be uniform. In some, but not all cases, it is possible to derive all the slip components from available data. However, this is not always possible, and therefore some blanks remain in the database. For example, the net displacement (ND), which represents the best the total deformation caused by the earthquake, can be calculated as a vector sum of the vertical displacement (VD) and the two horizontal slip components (fault-parallel, and fault-normal slip), or obtained by utilizing the fault dip angle if not all the vectors are known. Fault attitude (strike, slip) is usually well documented along the PF, but the DR can have different orientations with respect to the PF, and the assumptions of dip angles cannot be justified especially if not reported for the DR trace in consideration. Thus, obtaining rigorous ND based on reproducible mathematical methods is not equally correct when it comes to DR, as the DR slip parameters are rarely reported with a high level of detail.
Given that in the database the vertical slip component, VD for PF, and vd for DR, is the measure most often available for the surface ruptures of reverse faulting earthquakes, we decided to use this measure off displacement as a reference metric for the following analysis. This seems a reasonable choice as it is the most representative component of dip slip ruptures. Some distributed rupturing of the earthquakes considered in this work acted like normal faults near the surface, vertical slip measured in the field being opposite to the PF, but was considered here in absolute values. The database contains 234 measures of vd, most of them (53%) belonging to rank 2 DR, and 30% to 1.5 rank DR. The further analysis is limited to the “simple” DR (rank 2), to avoid biases due to folding-related or triggered DRs. Notice that the vertical slip values of the “primary” DR (rank 1.5) will be used in some cases later on for vd in the case where a rank 2 DR is closer to a rank 1.5 DR than to the PF.
For the analysis of the spatial distribution of the vertical slip measured along the distributed surface ruptures, we utilize the nearest distance from the point of measurement to the corresponding primary trace, calling this distance s (Figure 4A). The difference of s in respect to r is that s is computed exactly and exclusively for the point on DR with an associated measure of vertical throw, whereas r is calculated by resampling the coordinates of the DR segments. For a sufficiently dense resampling procedure, s is a sub-sample of r.
The displacement measured or expected at a particular position along the strike of the PF (DN) could be obtained from slip profiling, but composing a profile is not a trivial procedure when faced with discontinuous fault traces and other geometrical complexities, such as overlapping branches and splays. Therefore, having the database of displacement points on both DR and PF, we propose an alternative method in which for each DR displacement point the parameter DN is derived from the two nearest measured displacement points on PF (Figure 4B). DN is defined by the two nearest vertical displacement values VD along the PF, inversely weighted by their distance to the point of vd. DN is calculated for each point of vertical displacement along a DR as following:
where VD1 and VD2 are the nearest vertical displacement values along the corresponding primary trace (rank 1 or 1.5), and x1 and x2 are the corresponding distances from the point of vd to the points of VD. In some cases, the nearest point used to calculate the s (ps in Figure 4B) is attributed to a segment different from the points of displacement along the PF used for calculating the DN. In Supplementary Table S4, we list the coordinates of the VD1, VD2 and the end points of segments x1, x2, and s.
In Figure 6, we show the vd of rank 2 DR with respect to their distance from the rank 1 and rank 1.5 ruptures. Figure 6 allows discussion of the spatial completeness of the vd with respect to the distance from the PF, in fact, for distances longer than few hundreds of meters both on the hanging wall and footwall, only large vd are mapped. A likely explanation is the difficulty of distinguishing DR of small dimension at large distances from the PF, and this must be kept in mind when using the empirical data.
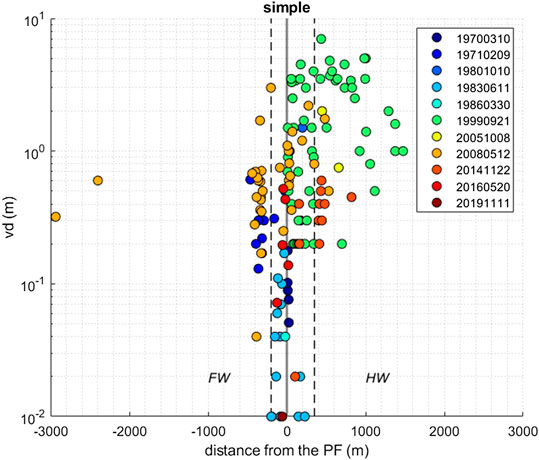
FIGURE 6. Analysis of the spatial distribution of the vertical displacement, vd, observations of simple DR (ranking 2) by earthquake in respect to the distance from the principal fault on hanging wall (HW) and on footwall (FW) sides. Dashed lines on FW and HW, in 200 and 350 m distance respectively, indicate the zone in which the database contains the largest variability of the values and can be assumed to be the most complete respect to the total DR occurred in reality.
Probability of Distributed Rupturing
In this section we analyze the probability of DR first in a general situation, and then at a site with specific size in a defined distance r from the PF.
Probability of a Distributed Rupturing Occurrence in a Slice
For the analysis of DR probability parameters (third term in Eq. 1), the distinction between PF and DR must be clearly defined. First of all, we establish a threshold distance within which all the ruptures are considered to be part of the PF. In this work the chosen distance is 5 m on both hanging wall and footwall sides, defining a 10 m wide PF zone. Utilizing this type of buffer zone seems reasonable also in respect to the observations in the field, where the surface material may not result in one well-defined, fully continuous principal fault trace. Indeed reverse faulting in areas with loose cover material induce often a broad flexural scarp, rather than a clear-cut scarp (e.g., Kelson et al., 2001; Yu et al., 2010). All the little and discontinuous ruptures within a distance inferior to 5 m to the PF were excluded from the further analysis of DR probabilities.
The “slicing” approach allows us to pose a simple question for each earthquake: “What is the probability to have at least one distributed surface rupture within a slice?” We then compute the occurrence of DRs in a slice for all the 15 earthquakes in the database, which means we are assuming the occurrence being independent from the position of the site along the PF strike. Subsequently, we apply a multinomial logistic model, which allows the analysis of various uncategorized variables, and that computes the relative risk of being in either the presence or absence of a DR from any given fault using a linear combination of predictor variables. Consequently, the probability of each outcome is expressed as a nonlinear function of n predictor variables:
where Pj is the probability of an outcome being in category j, and n is the number of predictor variables. We focus on simple distributed rupturing, ranking category 2. The data we collected are organized into a two column matrix with the magnitude of the causative events and the classes of distance from the PF. The response is a vector of 1/0, with 1 where we have at least a partial rank 2 DR and 0 where no rank 2 DR have been mapped. The global predictor matrix has 7.000 inputs, given by 15 earthquakes and 500 slices, which are centralized at distances from 5 to 5,005 m from the PF. In our case, Eq. 3 is
where Pf is the probability of an outcome being in category “at least a partial rank 2 DR” with respect to the reference category of “no rank 2 DR,” and X1 and X2 are the earthquake magnitude and distance from the PF, respectively. The coefficients for Eq. 4 are given in Table 2.
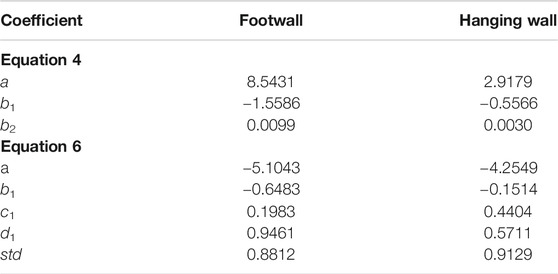
TABLE 2. Coefficients for Eqs 4 and 6.
Figure 7 shows the predicted probabilities for the multinomial logistic regression model with predictors, X1 and X2, and the coefficient estimates, b1 and b2, for hanging wall and footwall. The probability curves are shown for three magnitude Mw 5.5, Mw 6.5, and Mw 7.5. For a visual comparison, in Figure 6 we also show the frequency–distance distributions for the three classes of magnitude: Mw 5 ≤ M < Mw 6, Mw 6 ≤ M < Mw 7, and M ≥ Mw 7. The number of the earthquakes is relatively small in each class of magnitude, but we can see clear differences between the classes due to which the division is considered reasonable anyway.
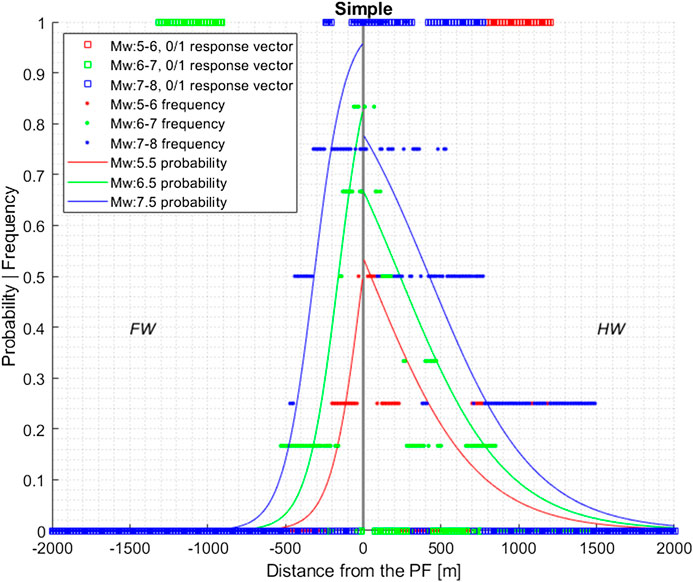
FIGURE 7. Logistic regression of the distributed rupturing in the database indicating the probability of observing at least a partial distributed rupture (DR) as a function of distance from a principal fault (PF) on hanging wall (HW) and footwall (FW) sides. The squares show the response to the logistic regression of rupturing either occurring (1) or not occurring (0) at a given distance. The points show the DR frequency in respect to the total number of events int each Mw class, and the lines indicate the probability of at least a partial DR at a given distance.
Probability of Distributed Rupturing Occurrence at the Site
Distributed rupturing does not occur homogenously and continuously along the surface trace of the principal fault. To estimate the probability of surface rupture occurrence at a site located at a distance from the PF we adopted a Monte Carlo approach. We discretized a space of length equal to the length of the PF in i sections of an arbitrary length of 1 m. Each section represents the possible center of a DR at a given distance off the PF. Next, we propose to calculate the number of secondary DR of given length considering the statistics of the database shown in Figure 2. Unfortunately, concerning the DR length statistics, the database does not allow to infer any relation between number and dimension of the surface ruptures relative to the parameters of the PF, such as magnitude or fault length.
Concerning the total length of DRs expected for a given PF length, we use the ratio observed in Figure 8. For each slice, for each earthquake, we computed the sum of the lengths of the DR traces, and normalized this sum to the length of the PF; this measure being the ratio F. The gray curves in Figure 8 represent the fit of the maximum ratio at each distance (thick curve above) and the fit of the entire dataset (thin curve below). The rapid decay observed at a distance of ∼100 m from the PF both on hanging wall and footwall sides could be related to some physical reasons, but the bias in the data available does not allow to be confident in any particular extrapolation, and it could be, possibly, still related to the completeness of the database. For this reason, we consider a threshold distance of ∼100 m as a (soft) border between high to low ratio of DR in respect to the length of PF. Instead of considering either of the fit directly, we simplify the analysis by using two values of F at two ranges of distance from the PF based vaguely on the maximum ratio. For a distance <100 m, we can assume that the expected length of the total DR will cover a fraction F of 0.03 of the length of the PF on hanging wall, and F of 0.007 on footwall. For a larger distance than 100 m, we assume F of 0.007 on hanging wall, and F of 0.004 on footwall. The range of applicability of these values in terms of distance from the PF is based on the reach of the database, being 500 m on footwall, and 1,500 m on hanging wall.
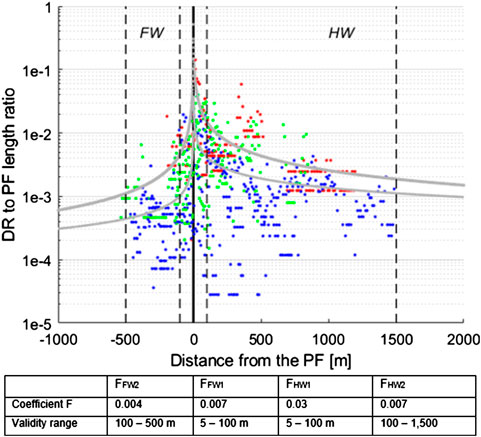
FIGURE 8. Fraction of DRs lengths to PF lengths, and power fit as a function of distance from the PF: thicker fit to maximum value; thinner fit to “all” values, and the fixed values of coefficient F and their applicability range. The events in the database are grouped according to their magnitude as previously; Mw 5–6 plotted in red, Mw 6–7 in green, and Mw 7–8 in blue. The dashed lines show the validity ranges in which the various coefficients F listed in the table are valid; the subscript of the coefficient F indicates the side on hanging wall (HW) or on footwall (FW) side, and order of the coefficient counted from the PF (1 or 2). Only simple type of DR considered (rank 2 DR).
Given the total length of DRs and the range of individual length, we can derive the range of the expected number of DR. For example, for a 30 km long PF, at a 25 m-wide site located at a distance greater than 100 m from the PF, we expect the total length of the DR being 210 m (30 km × 0.007). Assuming that the individual length of a DR ranges between the 16th and 84th percentiles of the observations, respectively of 7 and 74 m, we calculated the number of expected DR segments to be in the range of 3 (210/74) to 30 (210/7).
We then run 104 simulations, and for each simulation we
(a) extract the number (N) of ruptures between the minimum-maximum number, by assuming a uniform distribution,
(b) deduce the length of each DR by dividing the total length of DR by N,
(c) extract the N positions of the center of the surface ruptures from the i sampled centers,
(d) build the surface ruptures, by distributing the length of individual DR symmetrically in respect to their center, and
(e) verify if at least a rupture is located inside the site.
Figure 9 illustrates an example of this Monte Carlo approach. In particular, Figure 9 is a zoom of a 30 km fault for a site with a dimension parallel to the PF of 25 m, located at 500–525 m distance perpendicular to the PF. Note that the y-axis in Figure 9 serves to stack the simulations (only the first 100 of the total of 104 are shown). The PF is shown as a red line on the bottom of the figure, whereas DRs are represented by the black lines parallel to the PF. To simplify the reading of the figure, the width of the site is represented by the blue lines, projected along the y-axis. The number of favourable cases (at least a partial rupture) is obtained by counting the number of at least one DR intersecting the site, i.e., how many times there is at least a partial black brick between the blue dotted lines. The total cases are the number of simulations.
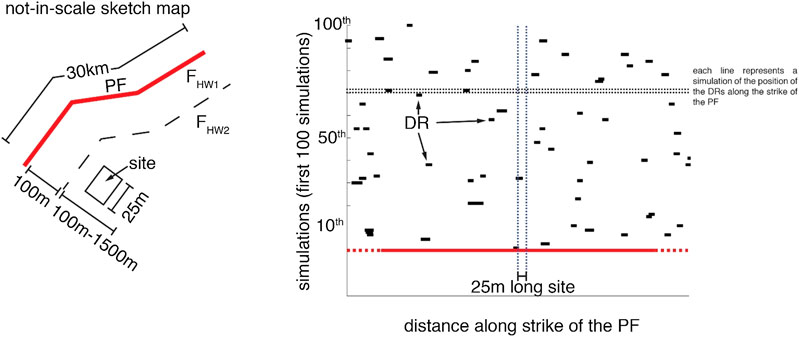
FIGURE 9. A site of 25 m width situated on hanging wall in 100–1,500 m distance from a 30 km long principal fault (PF) and the first 100 simulations of the existence of distributed surface ruptures (DR) at the site. Each line on simulation plot represents a simulation of positioning DRs along the PF strike, and the vertical dotted blue lines indicate the site of 25 m width in respect to the total length of the PF (red line).
The conditional probability of DR occurrence within the site of interest P [d > 0 | r, dim, F], that is a function of the distance r from the PF, of the dimension (dim) of the site, and of the length of the DR (that is the fraction F of the PF length), is then
Because of the sampling interval of the distance from the DRs to the PF (10 m), we assume that the probability P represents the probability for even a partial DR occurrence at a site with a dimension perpendicular to the PF of 10 m. This accuracy seems adequate to most engineering solutions the modeling may serve. The code is available in the Supplementary Material of this paper.
Probability of Exceedance of Displacement Levels
The probability of exceedance of a level of displacement is obtained by analyzing the correlation between the amount of displacement on DR vs. the distance from the PF, magnitude of the earthquakes and displacement on the PF. For this part, we use the distance parameter s, that indicates the distance from a point with a measured vertical surface slip along a DR to the nearest PF trace (Figure 4B). This distance is connected to the data point on DR in consideration.
Previous authors (Youngs et al., 2003; Petersen et al., 2011) chose the single value option to account for the magnitude of the event. Normalization to the maximum displacement (MD) is a commonly used approach, and it is easily available value for every event. However, it does not consider the variability of the slip along the PF trace, which can be remarkable in large events with long surface rupture length (SRL) breaching varying surface conditions. An alternative option, adopted in this work, is to estimate the distributed displacement values by the amount of slip at the corresponding location along the PF, i.e., at (or very near) the other end of the s measurement line. This choice lets us correlate the off-fault displacement to the estimated local slip along the PF and associated slip patches in depth.
For the systematic analysis of the database, only the equal type of data could be confronted, thus the DN should be derived from the similar slip parameters as the slip on DR considered. This approach considers only existing data; for the datapoints on DR with reported vertical slip parameter the two nearest points along PF with reported vertical displacement (VD) are considered for calculating the parameter of expected displacement (not necessarily any two nearest points, if no VD available). This procedure allows us to account for the variability in rupture location and displacement along the PF.
To evaluate the expected mean value of vd for rank 2 DR, we performed a regression analysis on vd and DN, magnitude and distance s from the PF. Basing on the analysis of the spatial completeness of our database (Figure 6), we limited our analysis to a subset of data consisting of 48 vd mapped at distances of 5–350 m on the hanging wall and of 21 vd mapped at distances of 5–200 m on the footwall side, derived from 11 of the 15 earthquakes, with magnitudes from Mw 4.9 to Mw 7.9.
Figures 10A,B show the natural logarithm of vd in respect to the natural logarithm of distance s from the PF, the natural logarithm of DN and magnitude, respectively for hanging wall and footwall. We can observe a weak correlation of vd with the distance both for hanging wall and footwall, and a linear correlation with DN and magnitude. A possible reason for the weak correlation of vd with the distance from the PF is the short distances we are analyzing, and we do not expect a rapid decay in the first hundreds of meters. On the other hand, it is worth noting that we are correlating vd with an epicentral distance from the surface trace of the PF, and that we are ignoring possible important parameters as, for example, the dip of the fault, the distribution of the co-seismic slip at depth, the structural complexities of the principal faults (e.g., bends, gaps). All the distances in the database were measured from the georeferenced maps, in a 2D map view. Though this ignores the changes in the topography and the fault dip, potentially biasing the actual distances between the fault planes in steep slope regions, we do not expect excessive mistakes in fault displacement hazard analyses when performed equally on a map basis. The statistical processing of datasets is expected to smooth the potential errors by covering a wide range of geometrical arrangements between topography and fault dip.
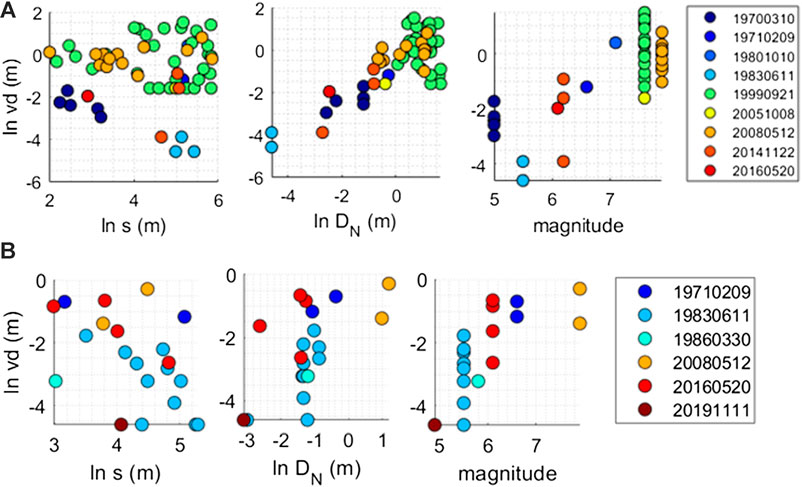
FIGURE 10. Relationship between vertical displacement ln (vd) and i) distance from the PF, ln (s), ii) ln DN, and iii) magnitude, Mw for (A) hanging wall and (B) footwall.
The functional form of the equation used for the regression is
where Y is the median expectation of vd, a is the constant term, s, DN, and m are, respectively, the epicentral distance, the normalization factor derived from the vertical displacement of the PF, and moment magnitude. The values of the coefficients a, b1, c1 and d1, for hanging wall and footwall, and the residual standard deviations, are presented in Table 2. Supplementary Figures S2A,B show the residual plots for the regression of Eq. 6 plotted to the distance from the PF. Even if the selected distances both on hanging wall and on footwall represent the reach we assume the empirical dataset is the most complete, there is quite large deviation in the vertical slip values.
We extrapolated the results from the analysis based on the near PF data also to distances greater than 200 and 350 m on footwall and hanging wall, respectively. Especially the large events may result vd greater than the model would suggest, and in general the empirical dataset contains more observations greater than the median, and greater the observations at short distances. This is somewhat counterintuitive but is likely due to the collection of the data in the fields, and it is possible that a certain distance from the PF only the DRs with largest vertical throw were observed and mapped.
Finally, in Figure 11, we show the probability of exceeding of vertical displacements at a site located at 500 m distance from the PF. We model the probability using a 3 sigma truncated distribution for two scenarios with Mw 7 and Mw 7.4, and with the maximum vertical throw expected on the PF, respectively of 2.3 and 3.85 m. The curves show the probability for each scenario for the site located either on hanging wall (solid lines), or on footwall (dashed lines).
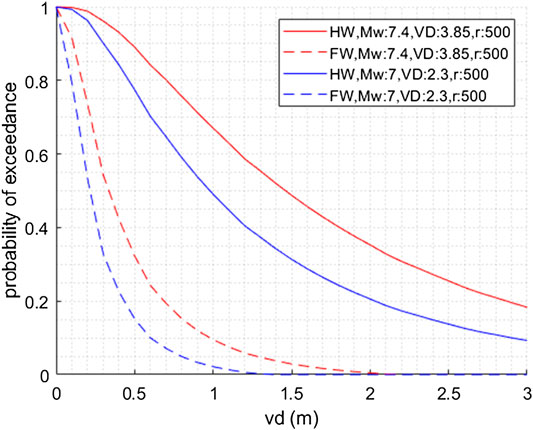
FIGURE 11. Curves for the probability of exceedance for given vertical displacement levels for hanging wall (HW; solid lines) and footwall (FW; dashed lines) for Mw 7 (blue lines) and Mw 7.4 (red lines) at a site in 500 m distance from the PF.
Case Study
In this work, we focused our attention on the development of new approaches to PFDHA by analyzing the hazard related to DR only, ignoring the probability of surface rupturing and slip distribution along PF. To appreciate the value of this new approach, we computed fault-displacement hazard curves for two scenario events, assuming a surface rupturing on PF along its total length. The probability of DR occurrence and displacement levels are estimated here for a site located on the hanging wall of our test case fault, at a distance from the PF greater than 100 m and for a characteristic earthquake scenario for which the Mw is derived from the total rupture length. Matlab codes used for this case study are provided in the Supplementary Material.
Suasselkä Post-Glacial Fault
Northern Fennoscandia is characterized by large NE-SW orientated postglacial faults (PGF), which were generated in recent times (i.e., the last tens of thousands of years, during the Latest Pleistocene to Holocene) in response to NW-SE compressional stress (Lagerbäck and Sundh, 2008; Ojala et al., 2019b; Olesen et al., 2020). The PGFs of the area are mainly very steep (45°–70°), and often associated with old pre-existing faults. According to Craig et al. (2016), the reverse-faulting earthquakes causing the large observed scarps were a response, like the coeval rapid uplift, to the Weichselian ice cap melting: those large events, with estimated magnitude from 7 up to 8 (see, e.g., Sutinen et al., 2014), happened at a time of extensional strain rate field. Surface geodetical measurements (i.e., GNSS) provide velocity field that strongly suggests current extension and rapid uplift (6.5 mm/year in the area of concern, according to the National Land Survey of Finland, 2018), whereas focal mechanisms show that compressional regime seems to be prevailing around the Scandinavian PGFs (Heidbach et al., 2018). Also the recent Mw 4.6 shallow earthquake that hit the Kiruna mine area in Sweden (May 18, 2020), ∼25 km east of the Pärvie PGF, shows a reverse focal mechanism as well on a steeply eastward dipping NNE-SSW striking fault.
Hence, we argue that the compressional environment that generated the PGF scarps is still active in the region. This is consistent with the recent findings of the Suasselkä fault complex, the longest PGF situated in Northern Finland. The drill core sampling of the fault proved that the ancient deformation zone has reactivated various times in the past, and the alteration of the Quaternary deposits indicates that the reactivation has continued until recent times (Sutinen et al., 2014). Radiocarbon datings indicate three seismic episodes in the area, the most recent being 1–3 ky ago (Ojala et al., 2019b). In Suasselkä PGF complex, Ojala et al. (2019a) identified four fault systems composed of 37 isolated segments, segment lengths varying between 150 and 7,500 m, and estimated moment magnitudes ranging from Mw 5.5 to 8.1 based on the rupture length and coseismic displacement considering the fault segments separately, and together as an entire complex. The nearest instrumentally observed earthquake to the Suasselkä fault complex took place in 2008 (Mw 0.9) (Ojala et al., 2019b) and, in a general consideration, the recent strike-slip to reverse seismic activity has been very moderate in terms of magnitudes To provide an insight on potential large earthquakes that may occur on this fault, we estimate their moment magnitude based on the PGF length and the scaling relationships. The most recent studies of Suasselkä PGF complex based on the LiDAR data and detailed field studies of the area (see Ojala et al., 2019a; Ojala et al., 2019b) result in SRL estimates longer than the previous assessments based mainly on visual inspection of the area (e.g., Paananen, 1987). The total SRL calculated between the fault complex end points is 72 km; doing so, we assume that the mapped segments are connected into a single crustal fault at depth.
Example of Probabilistic Fault Displacement Hazard Analysis: Scenarios 1 and 2
In this work, the PFDHA modeling is applied to a hypothetical site of 10 m width × 20 m length (length = perpendicular to PF strike) situated on the hanging wall of the Suasselkä fault with the closest side at the distance of 500 m from the PF surface trace. The modeling is done for two possible scenarios: 1) rupturing of the northern half of the complex (i.e., Suaspalo, Suasoja, and Nilimaa faults), and 2) rupturing of the entire Suasselkä complex (Figure 12). We use the expected maximum vertical displacement of the scenario event on Suasselkä fault for transforming the attenuation parameters to the expected displacement values on DR, and thus the results are applicable in the section of the PF trace where the maximum displacement can be expected to occur. We are not making specific assumptions for the location of the maximum displacement along the PF strike. The magnitude is obtained taking an average of Wells and Coppersmith (1994) and Wesnousky (2008) equations for magnitude vs. SRL. The Moss and Ross (2011) empirical relationship is then used to calculate MD from magnitude, and then its vertical component (MDv) from fault dip. For scenario (1) the used Mw is 7.0, MD 2.37 m, and MDv 2.30 m (dip 75°; Ojala et al., 2019b). For scenario (2) the used parameters are Mw 7.4, MD 3.99 m, and MDv 3.85 m.
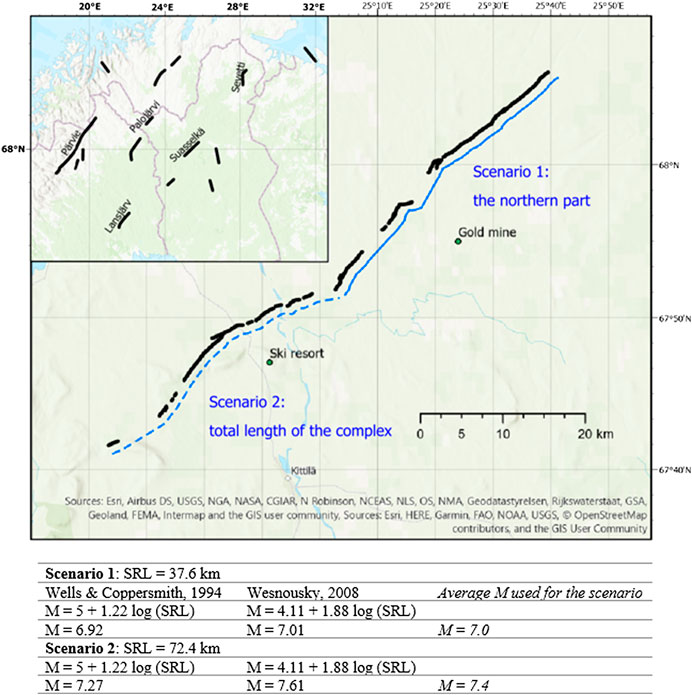
FIGURE 12. Suasselkä post-glacial fault as mapped by Ojala et al. (2019a, 2019b). SE block is the upthrown side. The northern section (Scenario 1) consists of Suaspalo, Suasoja and Nilimaa systems, the expected surface rupture length (SRL) for an earthquake rupturing the entire northern section is 37.6 km. The length of the entire Suasselkä post-glacial fault complex is 72.4 km (Scenario 2).
Scenario 1
The probabilities of having a rank 2 DR occurrence (Eq. 4) within the site of interest, extending from 500 to 520 m from the Suasselkä fault, are calculated at distances r1 and r2 from the PF of 505 and 515 m, respectively, on the hanging wall. The obtained probabilities are 0.408 (r1 = 505 m) and 0.401 (r2 = 515 m). The probability of having a DR occurrence in at least one of the two r, is 1 – (1–0.408) (1–0.401), and it is equal to 0.645. The probability of a rank 2 DR occurrence at the site is computed via Monte Carlo simulations (Scenario 2 section). It is independent from the distance r, and it is equal to 0.0182. Considering the size of the site under investigation (10 m width × 20 m length), the probability of DR occurrence is 1 – (1 – 0.0182)2 and is equal to 0.0361. The conditional probability of exceedance is shown in Figure 13.
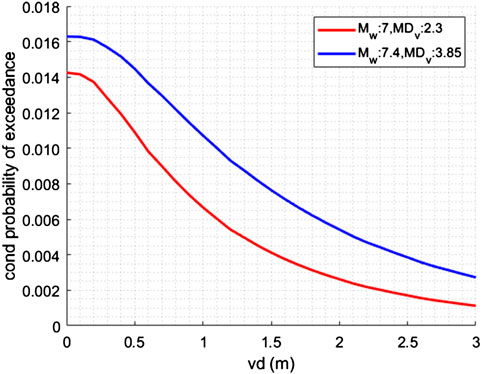
FIGURE 13. Conditional probability of exceeding a vertical displacement, vd, on a distributed rupture at a distance r = 510 m from the principal fault (PF) on hanging wall side for two modeled scenarios on Suasselkä fault: scenario 1 of Mw 7 and maximum vertical displacement on PF (MDv) of 2.3 m (red), and scenario 2 of Mw 7.4 with a MDv of 3.85 m (blue).
Scenario 2
The probabilities of having a rank 2 DR occurrence (Eq. 4) on the hanging wall at distances r1 of 505 m and r2 of 515 m from the PF are, respectively, 0.496 and 0.489. The probability of having a DR occurrence in at least one of the two r, is 1 – (1–0.496) (1–0.489), and it is equal to ∼0.7425. The probability of a rank 2 DR occurrence at the site, computed via Monte Carlo simulations, independent from the distance r, is equal to 0.02. For the site of interest (10 m width × 20 m length), the probability of DR occurrence at the site is 1 1 (1 – 0.02)2 and is equal to 0.0361. The conditional probability of exceedance is shown in Figure 13.
Discussion
The dataset used contains all the available surface rupture information of reverse faulting earthquakes published in the literature. The challenge regarding the homogenization of different types of the data in a single dataset is not new (Wells and Coppersmith, 1994). The first goal of such a study is to recognize the most accurate measure to consider for each earthquake. Displacement data used here covers 50 years of data collection and earthquakes in very different geological contexts, the type of data available varies from event to another, but also within an event depending on geologic and geographic conditions. The resolution of the maps and data provided by the field research groups have an impact on the resolution of this study. When working with datasets published by various study groups, the challenge lays also in bringing together different data formats and fault traces mapped at different scales. When it comes to the normalization parameter for displacement, common parameters of maximum displacement (MD) and average displacement (AD) along the PF are not reported in a homogenous way in the reference literature, especially the latter having more variety in its definition. The integral-based average considering the displacement distribution along the whole PF length would be the ideal factor describing the movement along the total PF rupture, but it is rarely provided and hardly obtained from the non-continuous data available. Here we propose to estimate DN locally for each point in the database, which seems to be reasonably close to the slip profile-based approach but is remarkably faster to execute using the point-based database of surface displacement.
For a more reliable analysis, a standardized method for field work could diminish the uncertainty of further calculations and increase the accuracy of the future hazard analysis. Also, there is an evident need for harmonized nomenclature when it comes to the fault displacement vectors and angles between them. Efforts have been made in the direction on harmonizing databases of surface rupturing data and the analysis done here is in accordance with the SURE structure (Baize et al., 2019), thus the parameters used in modeling can be updated as data is added into the database. Detailed field working of DR orientations and sub-surface structures will also help in more accurate ranking of the DR.
The variety of features observed in DR has led us to an in-depth analysis of their physical origin. This type of analysis has not been done in previous studies likely due to the relatively simpler nature of DR associated with strike-slip or normal faulting environments. The rank 2 DR in our database occur relatively close to the PF whereas rank >2 DR can occur at much greater distances. The occurrence of the more complex type of DRs (rank > 2) depends largely on the local structural geology, on the presence of pre-existing faults prone to be triggered (sympathetic faults), or large scale folding of hundreds of meters to kilometers in wavelength (possibly the origin of bending-moment or flexural-slip faulting). Following this analysis, we propose here to focus only on the rank 2 DR, which implies that our probability models can only be applied at short distances from PF. Extrapolation to distances greater than ∼1 km from the PF should be considered with caution. Future studies will need to provide probability models that can account for rank >2 DRs for those sites that are potentially affected by bending moments or pre-existing structures.
Completeness issues on the spatial extent of the compile database have led us to propose an alternative approach to estimate the probability of DR at a given distance from the PF. The procedural enhancements introduced here in general aim at reducing the need of user interpretation. For example, for the DR distribution analysis by “slicing” is seen more independent from the field work, and it does not require analyzing the reason for the “blank” areas with no DRs on the surface rupturing maps.
A second issue regards the data collection procedure which becomes increasingly biased for distances greater than 200 and 350 m (footwall, hanging wall) from the PF. Indeed, extrapolating the displacement prediction equation to greater distances results in vd values lower than the values in the database. This is somewhat counterintuitive but is likely due to the collection of the data in the fields, and it is possible that a certain distance from the PF only the DRs with largest vertical throw were observed and mapped. Those, the equation we developed here are robust within few hundred meters from the PF, and extrapolation beyond these ranges need to be carefully considered.
To better understand the physical parameters controlling vd, it is worth noting the existence of several other factors in addition to the epicentral distance we are using here. For example, in the future one could introduce the dip of the fault and the distribution of the co-seismic slip at depth that can be found in the SRCMOD database (Mai and Thingbaijam, 2014), or the structural complexities of the principal faults (e.g., bends, gaps).
Conclusions
Surface displacement data of 15 well-studied reverse earthquakes were gathered in an uniform database and used to derive empirical parameters used for describing the probabilities and expected levels of surface displacement in future events. The focus of this work was dedicated to enhancing the methodology for obtaining the parameters for distributed surface rupturing to be used in PFDHA on crustal reverse faulting tectonic regime.
Ranking of the distributed rupturing according to their complexity allows us to filter out the DR connected to the local structural setting in order to come up with parameters for modeling the simple, non-predictable DR that may take place anywhere along the strike of the PF, and on any reverse faulting earthquake where no structural complexities are expected.
In this work, we introduce the “slicing” methodology for analyzing the spatial distribution of DR to account for completeness issues of the empirical database. We divide the area off the PF in slices parallel to the PF strike and consider the slices containing at least a partial DR segment in order to generalize the probability and to avoid the bias occurring from the variability in the field mapping conditions that may cause either over or under sampling.
Vertical displacement data of various earthquakes are brought together obtaining a new approach to estimate the vertical displacement on the principal fault at the position nearest to the distributed rupture along which the vertical throw parameter is measured. The approach introduced here considers the alterations in the slip along the principal fault, and is derived directly from the point based database without slip profiling.
We combined empirical regressions and Monte Carlo simulations for calculating the probability of DR at the site at a chosen distance from the PF, and to estimate the probability of exceedance of the chosen vertical displacement level. To show the developed methodology, we provide Matlab codes applied to chosen scenario events along Suasselkä PGF.
Data Availability Statement
All datasets presented in this study are included in the article/Supplementary Material.
Author Contributions
FN compiled the database of reverse faulting earthquakes and carried out the implementation. PB and SB provided the geological expert opinion. FV, BP, AV, and OS performed the numerical simulations. All authors discussed the results and contributed to the final manuscript.
Conflict of Interest
The authors declare that the research was conducted in the absence of any commercial or financial relationships that could be construed as a potential conflict of interest.
Supplementary Material
The Supplementary Material for this article can be found online at: https://www.frontiersin.org/articles/10.3389/feart.2020.581605/full#supplementary-material
Glossary
DN expected vertical displacement calculated for each vd from the two nearest VD
DR distributed (also called off-fault) rupturing: surface ruptures that are not direct surface expressions of PF faulting
F fraction of total DR length in respect to the length of the PF of the corresponding earthquake
FDHI fault displacement hazard Initiative
ND net displacement
PF principal (also called primary) fault rupturing; the fault along which the seismic energy releases in the seismic event
PFDHA probabilistic fault displacement hazard analysis
PGF post-glacial fault
ps the nearest point on the PF trace from the point of vd on DR to which the distance s is measured
r a distance vector from DR trace to the nearest PF trace
s a distance vector from a point along DR with displacement to the nearest PF trace
SRL surface rupture length
SURE a worldwide and unified database of surface ruptures
VD vertical displacement on PF
vd vertical displacement on DR
VDL vertical displacement level
References
Angelier, J., Lee, J.-C., Chu, H.-T., and Hu, J.-C. (2003). Reconstruction of fault slip of the September 21st, 1999, Taiwan earthquake in the asphalted surface of a car park, and co-seismic slip partitioning. J. Struct. Geol. 25, 345–350. doi:10.1016/s0191-8141(02)00038-x
Avouac, J.-P., Ayoub, F., Leprince, S., Konca, O., and Helmberger, D. V. (2006). The 2006 Mw 7.6 Kashmir earthquake: sub-pixel correlation of ASTER images and seismic waveforms analysis. Earth Planet Sci. Lett. 249, 514–528. doi:10.1016/j.epsl.2006.06.025
Baize, S., Nurminen, F., Sarmiento, A., Dawson, T., Takao, M., Scotti, O., et al. (2019). A worldwide and unified database of surface ruptures (SURE) for fault displacement hazard analyses. Seismol Res. Lett. 91, 499–520. doi:10.1785/0220190144 2019
Bilham, R., and Yu, T.-T. (2000). The morphology of thrust faulting in the 21 September 1999, Chichi, Taiwan earthquake. J. Asian Earth Sci. 18, 351–367. doi:10.1016/s1367-9120(99)00071-1
Boncio, P., Liberi, F., Caldarella, M., and Nurminen, F.-C. (2018). Width of surface rupture zone for thrust earthquakes: implications for earthquake fault zoning. Nat. Hazards Earth Syst. Sci. 18, 241–256. doi:10.5194/nhess-18-241-2018
Bowman, J. R., and Barlow, B. C. (1991). Surveys of the fault scarp of the 1986 marryat creek, south Australia, earthquake. Canberra, AU: [Australian] Bureau of mineral Resources, geology and Geophysics, BMR Record 1991/190, 12.
Central Geological Survey, MOEA (2017). Available at: MOEA at http://gis.moeacgs.gov.tw/gwh/gsb97-1/sys8/index.cfm (Accessed October, 2017).
Chen, G. H., Xu, X. W., Zheng, R. Z., Yu, G. H., Li, F., Li, C. X., et al. (2008). Quantitative analysis of the co-seismic surface rupture of the 2008 Wenchuan earthquake, sichuan, China along the Beichuan Yingxiu fault. Seismol. Geol. 30, 723–738 [in Chinese with English abstract].
Chen, W. C., Chu, H. T., and Lai, T. C. (2000). Surface ruptures of the chi-chi earthquake in the shihgang dam area, Special issue for the Chi-Chi earthquake, 1999, Central geological survey, MOEA, Taipei, Taiwan. Spec. Publ. 12, 41–62 [in Chinese with English abstract].
Craig, T. J., Calais, E., Fleitout, L., Bollinger, L., and Scotti, O. (2016). Evidence for the release of long-term tectonic strain stored in continental interiors through intraplate earthquakes. Geophys. Res. Lett. 43, 6826. doi:10.1002/2016GL069359
Crone, A. J., Machette, M. N., and Bowman, J. R. (1992). Geologic investigations of the 1988 Tennant Creek, Australia, earthquakes– implications for paleoseismicity in stable continental regions. Denver, CO: US Geological Survey, Bull. 2032-A, 51.
Fredrich, J., McCaffrey, R., and Denham, D. (1988). Source parameters of seven large Australian earthquakes determined by body waveform inversion. Geophys. J. Int. 95, 1–13. doi:10.1111/j.1365-246x.1988.tb00446.x
Gordon, F. R., and Lewis, J. D. (1980). The Meckering and Calingiri earthquakes October 1968 and March 1970. B. Geol. Survey of Western Australia. 126.169–188
Haessler, H., Deschamps, A., Dufumier, H., Fuenzalida, H., and Cisternas, A. (1992). The rupture process of the Armenian earthquake from broad-band teleseismic body wave records. Geophys. J. Int. 109, 151–161. doi:10.1111/j.1365-246x.1992.tb00085.x
Heidbach, O., Rajabi, M., Cui, X., Fuchs, K., Müller, B., Reinecker, J., et al. (2018). The world stress map database release 2016: crustal stress pattern across scales. Tectonophysics 744, 484–498. doi:10.1016/j.tecto.2018.07.007
Huang, C., Chan, Y.-C., Hu, J.-C., Angelier, J., and Lee, J.-C. (2008). Detailed surface co-seismic displacement of the 1999 Chi-Chi earthquake in western Taiwan and implication of fault geometry in the shallow subsurface. J. Struct. Geol. 30, 1167–1176. doi:10.1016/j.jsg.2008.06.001
Huang, W. J., Chen, Z. Y., Liu, S. Y., Lin, Y. H., Lin, C. W., and Chang, H. C. (2000). Surface deformation models of the 1999 Chi–Chi earthquake between Tachiachi and Toupienkengchi, central Taiwan, Special Issue for the Chi-Chi Earthquake, 1999, Central Geological Survey, MOEA, Taipei, Taiwan, Special Publication, 12, pp. 63–87. (in Chinese with English abstract).
Ishimura, D., Okada, S., Niwa, Y., and Toda, S. (2015). The surface rupture of the 22 November 2014 Nagano-ken-hokubu earthquake (Mw 6.2), along the Kamishiro fault, Japan, Active Fault Res. 43, 95–108. [in Japanese, with English abstract].
Ishimura, D., Toda, S., Mukoyama, S., Homma, S. i., Yamaguchi, K., and Takahashi, N. (2019). 3D surface displacement and surface ruptures associated with the 2014 Mw 6.2 Nagano earthquake using differential Lidar. Bull. Seismol. Soc. Am. 109 (2), 780–796. doi:10.1785/0120180020
Kamb, B., Silver, L. T., Abrams, M. J., Carter, B. A., Jordan, T. H., and Minster, J. B. (1971). Pattern of faulting and nature of fault movement in the San Fernando earthquake in the San Fernando, California, earthquake of February 9, 1971. Washington, United States: US Geological Survey, Vol. 733, 41–54.
Kaneda, H., Nakata, T., Tsutsumi, H., Kondo, H., Sugito, N., Awata, Y., et al. (2008). Surface rupture of the 2005 Kashmir, Pakistan, Earthquake and its active tectonic implications. Bull. Seismol. Soc. Am. 98, 521–557. doi:10.1785/0120070073
Kelson, K. I., Kang, K. H., Page, W. D., Lee, C. T., and Cluff, L. S. (2001). Representative styles of deformation along the Chelungpu Fault from the 1999 Chi-Chi (Taiwan) earthquake: geomorphic characteristic and responses of man-made structures. B.Seismol. Soc. Am. 91, 930–952. 10.1785/0120000741
Kelson, K. I., Koehler, R. D., Kang, K.-H., Bray, J. D., and Cluff, L. S. (2003). Surface deformation produced by the 1999 Chichi (Taiwan) earthquake and interactions with built structures. Walnut Creek, CA: William Lettis and Associates, Award No. 01HQ-GR-0122, 21.
King, T. R., Quigley, M., and Clark, D. (2019). Surface-rupturing historical earthquakes in Australia and their environmental effects: new insights from Re-analyses of observational data. Geosciences 9, 408. doi:10.3390/geosciences9100408
King, T. R., Quigley, M. C., and Clark, D. (2018). Earthquake environmental effects produced by the Mw 6.1, 20th May 2016 Petermann earthquake, Australia. Tectonophysics 747–748, 357–372. doi:10.1016/j.tecto.2018.10.010
Kumahara, Y., and Nakata, T. (2007). Recognition of active faults generating the 2005 Pakistan earthquake based on interpretation of the CORONA satellite photographs. E - J. GEO. 2, 72–85 [in Japanese with English abstract]. doi:10.4157/ejgeo.2.72
Lagerbäck, R., and Sundh, M. (2008). Early Holocene faulting and paleoseismicity in northern Sweden. Sweden: Geological Survey of Sweden. ISSN 1103-3371, ISBN 978-91-7158-859-3.
Lee, J. C., Chen, Y. G., Sieh, K., Mueller, K., Chen, W. S., Chu, H. T., et al. (2001). A vertical exposure of the 1999 surface rupture of the Chelungpu Fault at Wufeng, Western Taiwan: structural and paleoseismic implications for an active thrust fault. Bull. Seismol. Soc. Am. 91 (5), 914–929.
Lee, Y.-H., Hsieh, M.-L., Lu, S.-D., Shih, T.-S., Wu, W.-Y., Sugiyama, Y., et al. (2003). Slip vectors of the surface rupture of the 1999 Chi-Chi earthquake, western Taiwan. J. Struct. Geol. 25, 1917–1931. doi:10.1016/s0191-8141(03)00039-7
Lee, Y.-H., Wu, K.-C., Rau, R.-J., Chen, H.-C., Lo, W., and Cheng, K.-C. (2010). Revealing coseismic displacements and the deformation zones of the 1999 Chi-Chi earthquake in the Tsaotung area, central Taiwan, using digital cadastral data. J. Geophys. Res. 115, B03419. doi:10.1029/2009JB006397
Lettis, W. R., Wells, D. L., and Baldwin, J. N. (1997). Empirical observations regarding reverse earthquakes, blind thrust faults, and quaternary deformation: are blind thrust faults truly blind? Bull. Seismol. Soc. Am. 87, 1171–1198.
Lin, A., Sano, M., Yan, B., and Wang, M. (2015). Co-seismic surface ruptures produced by the 2014 Mw 6.2 Nagano earthquake, along the Itoigawa–Shizuoka tectonic line, central Japan. Tectonophysics 656, 142–153. doi:10.1016/j.tecto.2015.06.018
Lin, W. H. (2000). On surface deformations from the Chi-Chi earthquake in the Shihkang and Chutzekeng areas, special issue for the Chi-Chi earthquake, 1999, Central Geological Survey, MOEA, Taipei, Taiwan. Spec. Publ. 12, 1–17. [in Chinese with English abstract].
Liu-Zeng, J., Sun, J., Wang, P., Hudnut, K. W., Ji, C., Zhang, Z., et al. (2012). Surface ruptures on the transverse Xiaoyudong fault: a significant segment boundary breached during the 2008 Wenchuan earthquake, China. Tectonophysics 580, 218–241. doi:10.1016/j.tecto.2012.09.024
Liu-Zeng, J., Sun, J., Zhang, Z., Wen, L., Xing, X., Hu, G., et al. (2010). Detailed mapping of surface rupture of the Wenchuan Ms 8.0 earthquake near Hongkou and seismotectonic implications. Quat. Sci. 30, 1–29 [in Chinese with English abstract].
Liu-Zeng, J., Zhang, Z., Wen, L., Tapponnier, P., Sun, J., Xing, X., et al. (2009). Co-seismic ruptures of the 12 May 2008, Ms 8.0 Wenchuan earthquake, Sichuan: east–west crustal shortening on oblique, parallel thrusts along the eastern edge of Tibet. Earth Planet Sci. Lett. 286, 355–370. doi:10.1016/j.epsl.2009.07.017
Machette, M. N., Crone, A. J., and Bowman, J. R. (1993). Geologic investigations of the 1986 Marry at Creek, Australia, earthquakes—implications for paleoseismicity in stable continental regions. Denver, CO: US Geological Survey, Bull. 2032-B, 29.
Mai, P. M., and Thingbaijam, K. K. S. (2014). SRCMOD: an online database of finite‐fault rupture models. Seismol Res. Lett. 85 (6), 1348–1357. doi:10.1785/0220140077
McCaffrey, R. (1989). Teleseismic investigation of the January 22, 1988 Tennant Creek, Australia, earthquakes. Geophys. Res. Lett. 16, 413–416. doi:10.1029/gl016i005p00413
Meghraoui, M., Jaegy, R., Lammali, K., and Albarède, F. (1988). Late Holocene earthquake sequences on the El Asnam (Algeria) thrust fault. Earth Planet Sci. Lett. 90, 187–203. doi:10.1016/0012-821x(88)90100-8
Moss, R. E. S., and Ross, Z. E. (2011). Probabilistic fault displacement hazard analysis for reverse faults. Bull. Seismol. Soc. Am. 101 (4), 1542–1553. doi:10.1785/0120100248
Ojala, A. E. K., Mattila, J., Ruskeeniemi, T., Markovaara-Koivisto, M., Palmu, J.-P., Nordbäck, N., et al. (2019a). Report 2019-1. Postglacial faults in Finland – a review of PGSdyn project results. Eurajoki, Finland: Posiva Oy, ISBN: 978-951-652-281-8, ISSN: 2343-4740.
Ojala, A. E. K., Mattila, J., Ruskeeniemi, T., Palmu, J.-P., Nordbäck, N., Kuva, J., et al. (2019b). Postglacial reactivation of the Suasselkä PGF complex in SW Finnish Lapland. Int. J. Earth Sci. 108, 1049–1065. doi:10.1007/s00531-019-01695-w
Okada, S., Ishimura, D., Niwa, Y., and Toda, S. (2015). The first surface rupturing earthquake in 20 years on a HERP active fault is not characteristic: the 2014 Mw 6.2 Nagano event along the northern Itoigawa–Shizuoka tectonic line. Seismol Res. Lett. 86, 1–14. doi:10.1785/0220150052
Olesen, O., Olsen, L., Gibbons, S. J., Ruud, B. O., Høgaas, F., Johansen, T. A., et al. (2020). Postglacial faulting in Norway—large magnitude earthquakes of late Holocene age. CambridgeEngland: Cambridge University Press.
Ota, Y., Watanabe, M., Suzuki, Y., Yanagida, M., Miyawaki, A., and Sawa, H. (2007). Style of the surface deformation by the 1999 Chichi earthquake at the central segment of Chelungpu fault, Taiwan, with special reference to the presence of the main and subsidiary faults and their progressive deformation in the Tsauton area. J. Asian Earth Sci. 31, 214–225. doi:10.1016/j.jseaes.2006.07.030
Paananen, M. (1987). Report YST. Venejärven, Ruostejärven, Suasseljän ja Pasmajärven postglasiaalisten siirrosten geofysikaalinen tutkimus. Espoo, Finland: Geological Survey of Finland.
Petersen, M. D., Dawson, T. E., Chen, R., Cao, T., Wills, C. J., Schwartz, D. P., et al. (2011). Fault displacement hazard for strike-slip faults. Bull. Seismol. Soc. Am. 101 (2), 805–825. doi:10.1785/0120100035
Philip, H., and Meghraoui, M. (1983). Structural analysis and interpretation of the surface deformation of the El Asnam earthquake of October 10, 1980, Tectonics 2, 17–49. doi:10.1029/tc002i001p00017
Philip, H., Rogozhin, E., Cisternas, A., Bousquet, J. C., Borisov, B., and Karakhanian, A. (1992). The Armenian earthquake of 1988 December 7: faulting and folding, neotectonics and palaeoseismicity. Geophys. J. Int. 110, 141–158. doi:10.1111/j.1365-246x.1992.tb00718.x
Rajendran, C. P., Rajendran, K., Unnikrishnan, K. R., and John, B. (1996). Palaeoseismic indicators in the rupture zone of the 1993 Killari (Latur) earthquake. Curr. Sci. India. 70, 385–390. Available at: https://www.jstor.org/stable/24097438 (Accessed March 10, 1996).
Ritz, J. F., Baize, S., Ferry, M., Larroque, C., Audin, L., Delouis, B., et al. (2020). Surface rupture and shallow fault reactivation during the 2019 Mw 4.9 Le Teil earthquake, France. Commun. Earth Environ. 1, 10.
Rymer, M. J., Kendrick, K. J., Lienkaemper, J. J., and Clark, M. M. (1990). “Surface rupture on the Nunez fault during the Coalinga earthquake sequence,” in The Coalinga, California, earthquake of May 2, 1983. Editors Rymer, M. J., and Ellsworth, W. L. (Denver, CO: US Geological Survey), 299–318, Prof. Paper 1487.
Sarmiento, A., Abrahamson, N., Baize, S., Bozorgnia, Y., Chen, R., Coppersmith, K. J., et al. (2019). “A new model database for next-generation fault displacement hazard analysis,” in SSA 2020 Annual Meeting, Albuquerque, New Mexico.
Seeber, L., Ekström, G., Jain, S. K., Murty, C. V. R., Chandak, N., and Armbruster, J. G. (1996). The 1993 Killari earthquake in central India: a new fault in Mesozoic basalt flows? J. Geophys. Res. 101, 8543–8560. doi:10.1029/95JB01865
Sutinen, R., Hyvönen, E., and Kukkonen, I. (2014). LiDAR detection of paleolandslides in the vicinity of the Suasselkä postglacial fault, Finnish Lapland. Int. J. Appl. Earth Obs. Geoinf. 27, 91–99. doi:10.1016/j.jag.2013.05.004
Takao, M., Tsuchiyama, J., Masashi, A., and Testushi, K. (2013). Application of probabilistic fault displacement hazard analysis in Japan. Jpn. Assoc. Earthquake Eng. 13 (1), 17–36. doi:10.5610/jaee.13.17
U.S. Geological Survey Staff (1971). Surface faulting, in The San Fernando, California, earthquake of February 9, 1971. Washington, United States: US Geological Survey, Vol. 733, 55–76.
Wang, H., Ran, Y., Chen, L., Shi, X., Liu, R., and Gomez, F. (2010). Determination of horizontal shortening and amount of reverse-faulting from trenching across the surface rupture of the 2008 Mw 7.9 Wenchuan earthquake, China, Tectonophysics, 491, 10–20. doi:10.1016/j.tecto.2010.03.019
Wells, D. L., and Coppersmith, K. J. (1994). New empirical relationship among magnitude, rupture length, rupture width, rupture area, and surface displacement. Bull. Seismol. Soc. Am. 84 (4), 974–1002.
Wesnousky, S. G. (2008). Displacement and geometrical characteristics of earthquake surface ruptures: issues and implications for seismic hazard analysis and the earthquake rupture process. Bull. Seismol. Soc. Am. 98, 1609–1632. doi:10.1785/0120070111
Xu, X., Wen, X., Ye, J., Ma, B., Chen, J., Zhou, R., et al. (2008). The Ms 8.0 Wenchuan earthquake surface ruptures and its seismogenic structure. Seismol. Geol. 30, 597–629 [in Chinese with English abstract].
Xu, X., Wen, X., Yu, G., Chen, G., Klinger, Y., Hubbard, J., et al. (2009). Co-seismic reverse- and oblique-slip surface faulting generated by the 2008 Mw 7.9 Wenchuan earthquake, China. Geology 37, 515–518. doi:10.1130/g25462a.1
Yeats, R. S. (1986). Active faults related to folding in: active tectonics: impact on society. Washington, United States: The National Academics Press Washington, 280. doi:10.17226/624
Yelding, G., Jackson, J. A., King, G. C. P., Sinvhal, H., VitaFinzi, C., and Wood, R. M. (1981). Relations between surface deformation, fault geometry, seismicity, and rupture characteristics during the El Asnam (Algeria) earthquake of the 10 October 1980. Earth Planet Sci. Lett. 56, 287–304. doi:10.1016/0012-821X(81)90135-7
Youngs, R. R., Arabasz, W. J., Anderson, R. E., Ramelli, A. R., Ake, J. P., Slemmons, D. B., et al. (2003). A methodology for probabilistic fault displacement hazard analysis (PFDHA). Earthq. Spectra. 19 (1), 191–219. doi:10.1193/1.1542891
Yu, G., Xu, X., Klinger, Y., Diao, G., Chen, G., Feng, X., et al. (2010). Fault-scarp features and cascading-rupture model for the Mw 7.9 Wenchuan earthquake, eastern Tibetan plateau, China. Bull. Seismol. Soc. Am. 100, 2590–2614. doi:10.1785/0120090255
Yu, G.-H., Xu, X.-W., Chen, G.-H., Guo, T.-T., Tan, X.-B., Yang, H., et al. (2009). Relationship between the localization of surface ruptures and building damages associated with the Wenchuan 8.0 earthquake. Chin. J. Geophys. 52, 1294–1311. doi:10.1002/cjg2.1455
Zhang, J. Y., Bo, J. S., Xu, G. D., and Huang, J. Y. (2012). Buildings setbacks research from surface-fault-rupture statistical analysis. Amministrare 204–208, 2410–2418. doi:10.4028/www.scientific.net/amm.204-208.2410
Zhang, Y., Shi, J., Sun, P., Yang, W., Yao, X., Zhang, C., et al. (2013). Surface ruptures induced by the Wenchuan earthquake: their influence widths and safety distances for construction sites. Eng. Geol. 166, 245–254. doi:10.1016/j.enggeo.2013.09.010
Zhang, Y. S., Sun, P., Shi, J. S., Yao, X., and Xiong, T. Y. (2010). Investigation of rupture influenced zones and their corresponding safe distances for reconstruction after 5.12 Wenchuan earthquake. Eng. Geol. 18, 312–319 [in Chinese with English abstract].
Zhou, Q., Xu, X., Yu, G., Chen, X., He, H., and Yin, G. (2010). Width distribution of the surface ruptures associated with the Wenchuan earthquake: implication for the setback zone of the seismogenic faults in post-earthquake reconstruction. Bull. Seismol. Soc. Am. 100, 2660–2668. doi:10.1785/0120090293
Keywords: probabilistic fault displacement hazard analysis, surface faulting, distributed rupturing, displacement regression, reverse earthquakes
Citation: Nurminen F, Boncio P, Visini F, Pace B, Valentini A, Baize S and Scotti O (2020) Probability of Occurrence and Displacement Regression of Distributed Surface Rupturing for Reverse Earthquakes. Front. Earth Sci. 8:581605. doi: 10.3389/feart.2020.581605
Received: 09 July 2020; Accepted: 17 September 2020;
Published: 27 October 2020.
Edited by:
Chong Xu, Ministry of Emergency Management, ChinaReviewed by:
Qi Yao, China Earthquake Networks Center, ChinaZhikun Ren, China Earthquake Administration, China
Gang Rao, Zhejiang University, China
Copyright © 2020 Nurminen, Boncio, Visini, Pace, Valentini, Baize and Scotti. This is an open-access article distributed under the terms of the Creative Commons Attribution License (CC BY). The use, distribution or reproduction in other forums is permitted, provided the original author(s) and the copyright owner(s) are credited and that the original publication in this journal is cited, in accordance with accepted academic practice. No use, distribution or reproduction is permitted which does not comply with these terms.
*Correspondence: Fiia Nurminen, ZmlpYS5udXJtaW5lbkB1bmljaC5pdA==