 Fanny Brun
 Désirée Treichler
 David Shean
 Walter W. Immerzeel
- 1Department of Physical Geography, Faculty of Geosciences, Utrecht University, Utrecht, Netherlands
- 2Université Grenoble Alpes, CNRS, IRD, Grenoble INP, IGE, Grenoble, France
- 3Department of Geosciences, University of Oslo, Oslo, Norway
- 4Department of Civil and Environmental Engineering, University of Washington, Seattle, WA, United States
The Tibetan plateau plays an essential role in the water supply to Asia’s large river systems and, as the largest and highest mountain plateau in the world, it drives the Asian monsoon and influences global atmospheric circulation patterns. The increase in the Tibetan plateau lake volume since the mid-1990s is well documented, however the drivers of lake growth remain largely unexplained. In this study we investigate changes in lake and glacier volumes, together with changes in precipitation and evapotranspiration at basin scale. We calculate the contribution of glacier mass loss to the lake volume increase for the period 1994–2015. We demonstrate that glacier mass loss does have a limited contribution to the lake volume increase (19
Introduction
Lakes are widespread features of the Tibetan plateau, with more than 1,000 lakes larger than 1 km2 (Zhang et al., 2017a). As these lakes are located mainly in endorheic basins, and are minimally influenced by human interventions, they are expected to be very sensitive to climate fluctuations. Most lakes have undergone a striking increase in area and volume since the mid-1990s (Lei et al., 2013; Song et al., 2013; Lei et al., 2014; Zhang et al., 2017a; Zhang et al., 2017b; Yao et al., 2018; Qiao et al., 2019b). Many recent studies assess changes in lake volume using remote sensing techniques, typically with a combination of optical satellite images, such as Landsat, and topographic data (e.g., Crétaux et al., 2011). The lake delineation is not always consistent among the different studies, and neither are the study periods, however all of them conclude that the lakes have gained mass at a pace of 6–9 Gt/yr from the mid-1990s to the mid-2010s. This increase in lake storage is confirmed by an increase in the total land water storage, as observed in Gravity Recovery and Climate Experiment (GRACE) data (Wang et al., 2016; Xiang et al., 2016; Zhang et al., 2017b; Yao et al., 2018; Loomis et al., 2019). During the same time period, the Tibetan glaciers have been losing mass (Gardner et al., 2013; Shean et al., 2020).
In order to explain these lake changes, two main hypotheses are presented in the literature: glacier mass loss and precipitation increase. Many studies estimated the glacier mass loss to be the primary contributor of lake expansion in Tibet (e.g., Yao et al., 2007). At the scale of one lake or catchment, glaciers were found to contribute between 10 and 75% to a given lake mass increase based on direct observations or modeling (Zhu et al., 2010; Song and Sheng, 2016; Tong et al., 2016; Li and Lin, 2017; Qiao and Zhu, 2017; Qiao et al., 2017; Zhou et al., 2019). This contribution could be 22–51% for the northwestern Tibetan plateau (Huang et al., 2011), and 60% for the whole plateau (Qiao et al., 2019a; Qiao et al., 2019b). The lake changes are also attributed to an increase in precipitation after approximately 1995, which is observed both in meteorological data (station data and reanalysis products) and indirectly through the greening of the Tibetan plateau (Zhang et al., 2017c; Yao et al., 2018; Treichler et al., 2019). Various observations favor the precipitation hypothesis. For instance, glacier-fed and non-glacier-fed lakes were found to follow the same relative area increase (Song et al., 2014), and the spatial pattern of lake volume increase does not match the pattern of glacier mass loss as revealed by the Ice, Cloud, and land Elevation Satellite (ICESat; Li et al., 2014; Treichler et al., 2019). However a quantitative estimate of the glacier contribution to lake mass increase at the scale of the Tibetan plateau is currently missing in the literature (Zhang et al., 2020b).
Due to harsh environment and low population density, direct measurements of precipitation and evaporation remain sparse over the plateau, and consequently their representativeness is questionable. Reanalysis and satellite-based precipitation datasets show a large spread in the amount and evolution of precipitation and evaporation over the Tibetan plateau (e.g., Yoon et al., 2019). As a consequence, it is more straightforward to test the glacier hypothesis instead of the precipitation hypothesis. Most previous studies quantified the glacier contribution at catchment scale, except two recent studies, which quantified it for the whole plateau (Zhang et al., 2017b; Qiao et al., 2019a). Qiao et al. (2019a) estimated the contribution based on the difference between glacier-fed and non glacier-fed lakes, but without considering glacier mass changes. Zhang et al. (2017b) relied on glacier mass change data from ICESat between 2003 and 2009, but these glacier mass changes might not be representative of the past few decades.
As a large part of the Tibetan plateau is endorheic, lake volume changes are a direct result of changes in the storage of snow and ice in respective watersheds, or a result of shifts in precipitation and evapotranspiration in the lake basins. Although previous work points to both glacier mass loss and precipitation shifts as possible explanations of lake growth, the evidence remains largely inconclusive. In this study, we use recently published comprehensive lake volume change data (Treichler et al., 2019) and glacier mass change data (Shean et al., 2020) in order to quantitatively assess the glacier contribution to endorheic Tibetan plateau lake mass increase for the early twenty-first century. Even though some ground-based measurements of lake and glacier changes are available (e.g., Yao et al., 2012; Lei et al., 2019), we decided to rely solely on the remote sensing estimates as they are the only measurements covering the whole Tibetan plateau in a comprehensive and consistent way. We then use multiple climate reanalysis datasets to assess whether the remaining lake volume increase can be explained by recent changes in precipitation excess (precipitation minus evapotranspiration (P − ET)).
Data and Methods
Lake and Glacier Mass Changes
Treichler et al. (2019) estimated Tibetan plateau lake volume change for over 1,300 lakes between 1990 and 2015. Here, we limit the analysis to a subset of lakes over Tibet interior endorheic basins (1,009 lakes covering 37,700 km2). The lake volume change estimate is based on time series of lake area derived from the Global Surface Water dataset (Pekel et al., 2016), which are converted to volume changes with empirical area-volume scaling relationships derived from the digital elevation model (DEM) shoreline extraction method for each lake (Treichler et al., 2019). We compute lake volume differences from the 1994 and 2015 lake volume data to maximize spatial coverage and time interval (Supplementary Figure S1). Most previous studies detected the onset of the lake volume increase in the mid-1990s (Zhang et al., 2017a; Qiao et al., 2019a). We calculate the lake volume change as the difference between the estimated volumes in year i and j, divided by
We validate the lake volume and level rate of change estimates against higher resolution lake level change data, which rely on laser and radar altimetry (Supplementary Text S1; Crétaux et al., 2011; Li et al., 2019). From this comparison, we determine an empirical relation between lake level change uncertainty and lake area of individual and recombined lakes (Supplementary Text S1 and Figures S2 and S3). As the lake level uncertainty decreases with increased lake area, we group the data into regions containing more than 1,000 km2 of lakes. We define 18 regions, hereafter named basins, based on the aggregation of neighboring endorheic basins from the HydroBASINS database (Lehner and Grill, 2013), until they contain more than 1,000 km2 of lakes (Table 1). Figure 1 shows the location of the 18 basins. The total lake mass change is calculated as the sum of individual lake mass change. To account for missing data in Treichler et al. (2019), we assume that unsurveyed lakes behaved like surveyed lakes in the same basin. For each basin, the total rate of lake mass change was calculated by attributing the basin area-weighted rate of level change to the lakes that were not surveyed, which represent 0–52.1% of the lake area per basin (Supplementary Figure S4). The uncertainty of the basin lake level change is calculated as a function of the lake area (Supplementary Equation S1), and multiplied by the total basin lake area to estimate lake mass change uncertainty in Gt/yr.
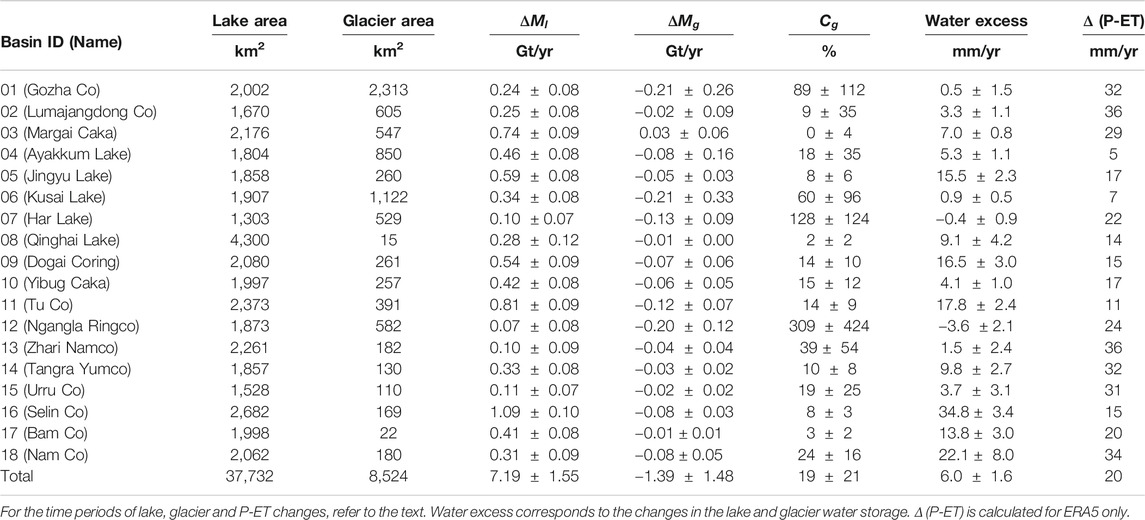
TABLE 1. Summary of basin characteristics and changes.
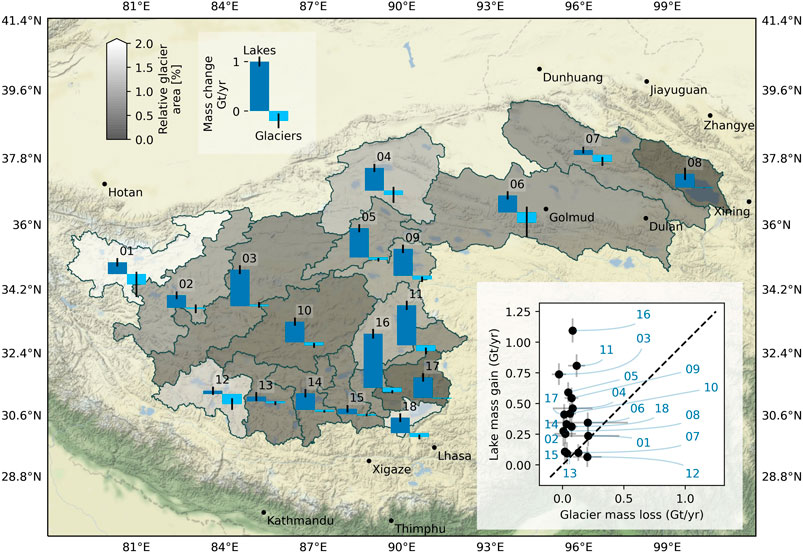
FIGURE 1. Lake and glacier mass change for the 18 endorheic basins considered in this study. The blue bars represent the total mass changes and the black lines represent uncertainties, with all bars plotted using the same scale. The basins are shaded according to the ratio between the glacier area and the basin area. The basemap is a terrain layer from Stamen (http://maps.stamen.com). The inset shows the lake mass gain as a function of the glacier mass loss for each basin (black dots), with basin number labels in blue.
We use glacier mass change data derived from high-resolution DEM time series for the period from 2000 to 2018 (Shean et al., 2020). The glacier mass change (
From
At the scale of the plateau, we evaluate both the lake and glacier mass change uncertainties as the sum of the uncertainties at the basin level:
where
Meteorological Data Used for Estimation of Precipitation and Evapotranspiration
Due to the poor accessibility and low population density there are a limited number of meteorological stations with accessible data for the inner Tibetan plateau (Supplementary Figure S5D). Consequently, we rely on spatially and temporally continuous reanalysis and/or satellite-based products to investigate recent changes in precipitation (P) and evapotranspiration (ET). There is no consensus about the best reanalysis data available for the entire plateau (Wang and Zeng, 2012; He et al., 2019; Yoon et al., 2019). To account for the uncertainty among different products, we consider several reanalysis products (Supplementary Table S3). We selected reanalysis products which include P and ET estimates for the period 1979–2015, in order to capture the climatology before the lake volume increase. Our final selection includes (Supplementary Table S3): ERA5 (Copernicus Climate Change Service, 2017), ERA-Interim (Dee et al., 2011), MERRA-2 (Gelaro et al., 2017), GLDAS-CLSM (Rodell et al., 2004), GLDAS-NOAH (Rodell et al., 2004). In addition, we use output from the Weather Research and Forecast (WRF) model, which are available for the inner Tibetan plateau (de Kok et al., 2020), named WRF20k hereafter. Additionally, we extracted P time series from the Frequent Rainfall Observations on GridS (FROGS) database (Roca et al., 2019), Climatologies at High resolution for the Earth’s Land Surface Areas (CHELSA) (Karger et al., 2017) and 108 meteorological stations from the China Meteorological Association (stations with less than 0.1% of missing data for the period 1979–2015, Supplementary Figure S5D). Within FROGS, we selected precipitation products that cover the period 1979 on-wards, regardless of their origin (Supplementary Table S3). The FROGS and CHELSA monthly time series were averaged to create the FROGS-ensemble. We also use ET estimates from the GLEAM v3.3a product (Martens et al., 2017). All sources used to estimate P and ET are described in Supplementary Table S3.
All the monthly aggregates of P and ET from gridded products are processed in the same way. Raster masks of the 18 basins at native resolution are created using Geospatial Data Abstraction software Library (GDAL). For each basin and product, we calculate a precipitation anomaly (
Even for the endorheic basins considered here,
where
Results
Lake and Glacier Changes
For the whole plateau, lakes and glaciers have contrasting temporal evolution (Figure 2). While glacier mass loss is relatively steady from 1990 to 2016 (Figure 2A), the lake mass increases from 1995 on-wards. Due to limited data availability in 1995, we assume that the beginning of the ongoing lake mass increase is 1994. The rate of lake mass increase slows around 2010 (Figure 2A).
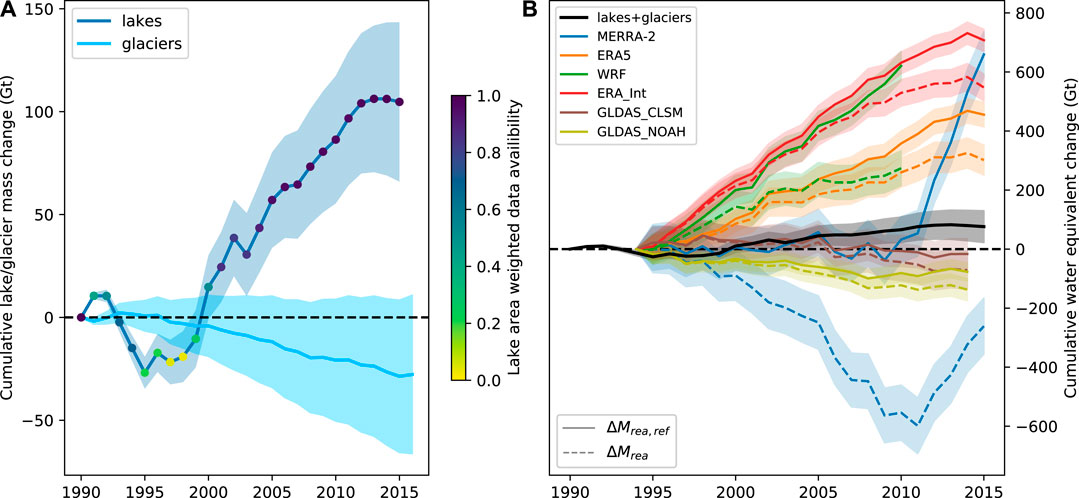
FIGURE 2. (A) Cumulative lake mass change and glacier mass loss for the whole inner Tibetan plateau. Cumulative lake changes are colorized by data availability. Glacier mass loss correspond to the data of Zemp et al. (2019) readjusted using the data of Shean et al. (2020), see Supplementary Text S2 for details. (B) Cumulative water equivalent change (
The total lake mass increase between 1994 and 2015 is 7.19
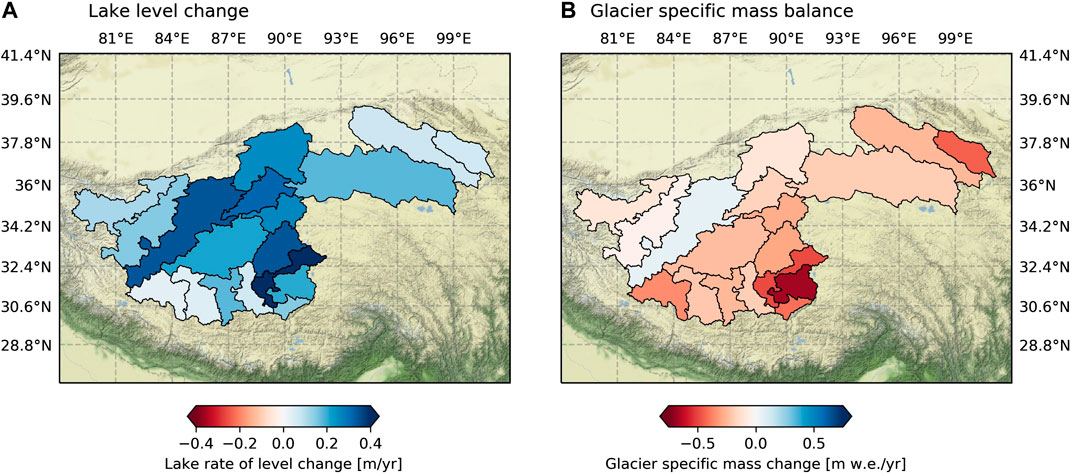
FIGURE 3. Lake level change rate (A) and specific glacier mass balance (B).
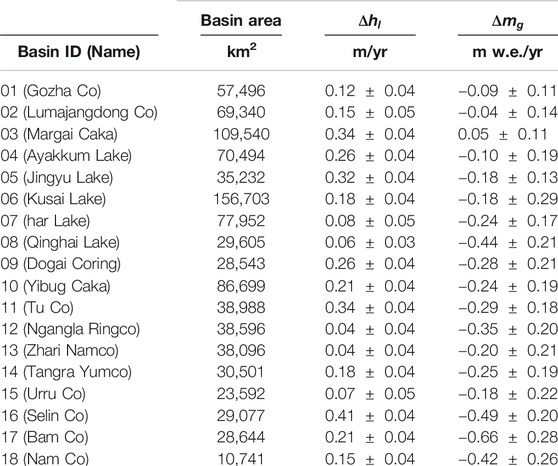
TABLE 2. Lake level change (
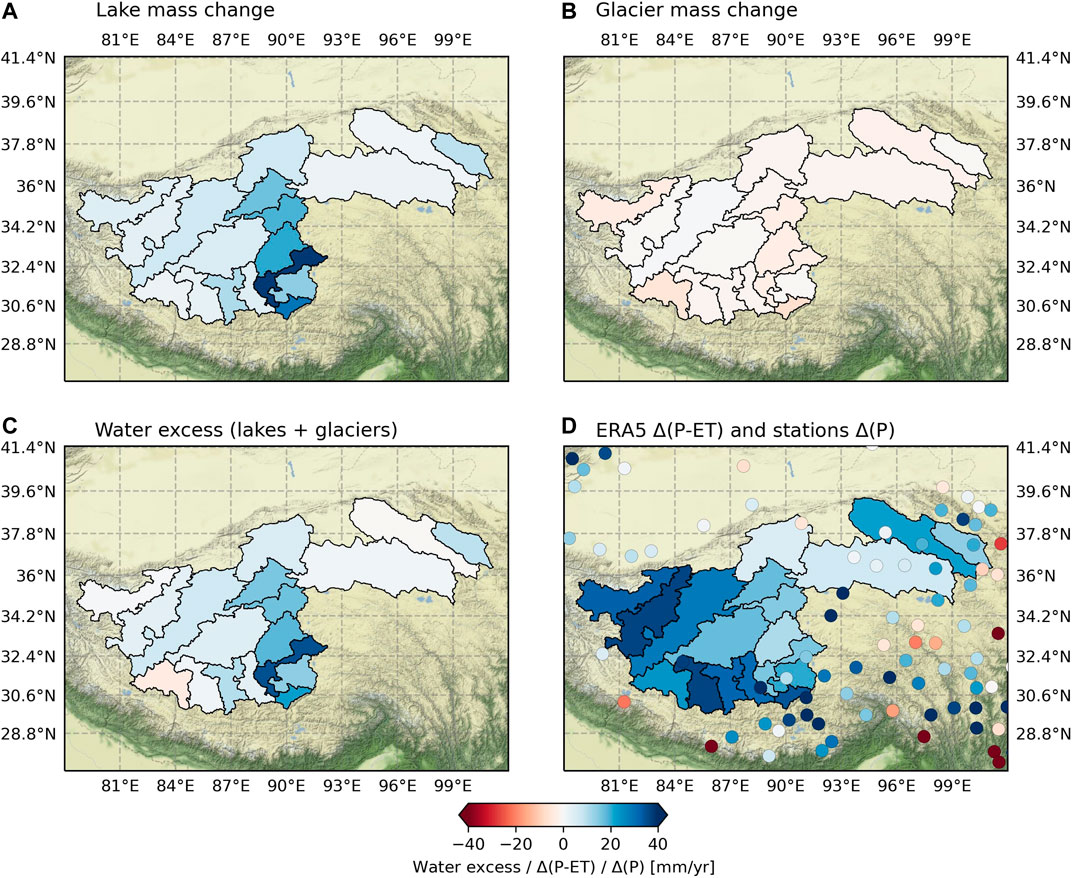
FIGURE 4. Lake (A), glacier (B) and lake + glacier (C) rate of mass change distributed over the basin area (in mm/yr).
The total water contribution from glacier mass change for the period 2000–2018 is −1.39
Water excess from lake and glacier changes together is largest on the southeastern inner Tibetan plateau (Figure 4C), with a maximum value of 34.8
The overall contribution of glaciers to lake mass increase for the entire plateau is estimated to be 19
Precipitation and Evapotranspiration Changes
The reanalysis products show large discrepancies, both in terms of climatology (Figure 5) and in terms of changes in P and ET (Figure 6). The plateau-wide annual precipitation ranges from 200 to 600 mm/yr depending on the reanalysis product considered (Figure 5). Five of the seven products show larger P and ET in the south (eastern), while MERRA-2 and GLDAS-CLSM shows the largest P and ET in basins 06–08 located in the northeastern part of the region (Figure 5). The plateau
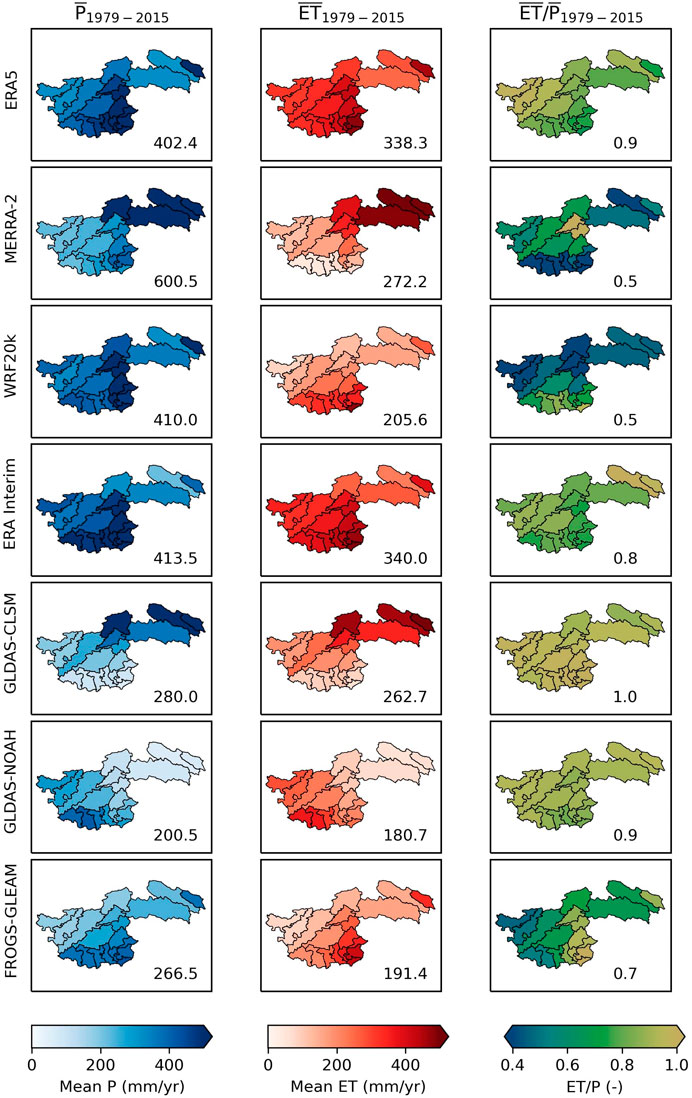
FIGURE 5. Mean P and ET for the period 1979–2015 for each reanalysis product (with the exception of WRF20k, which ends in 2010, and the GLDAS reanalysis which ends in 2014).
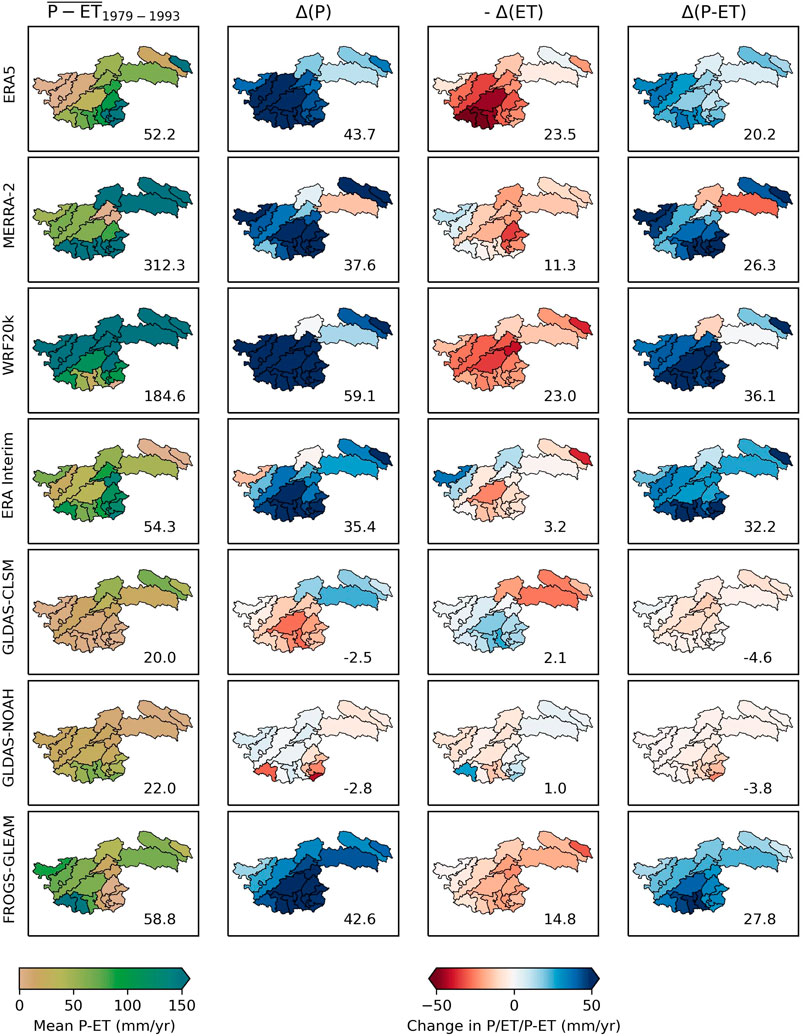
FIGURE 6. Mean (P-ET) for the period 1979–1993 for each reanalysis product.
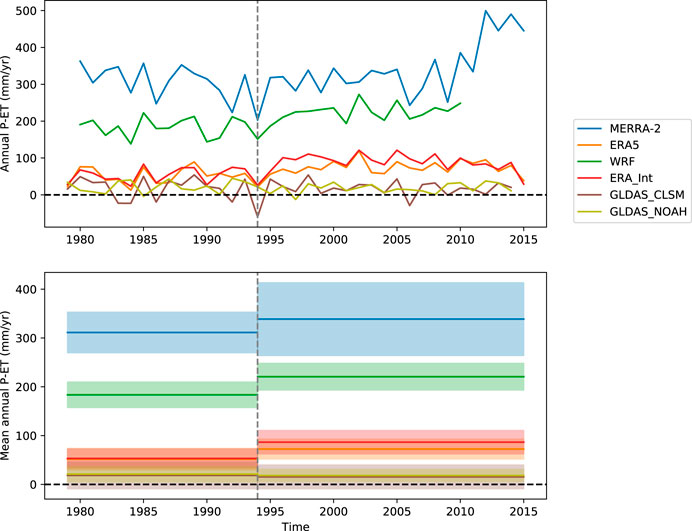
FIGURE 7. Annual P–ET for the six reanalysis (upper panel) and mean annual P–ET (lower panel) for the whole study area. The shaded areas in the lower panel show one standard deviation of the annual series of P–ET for the period considered.
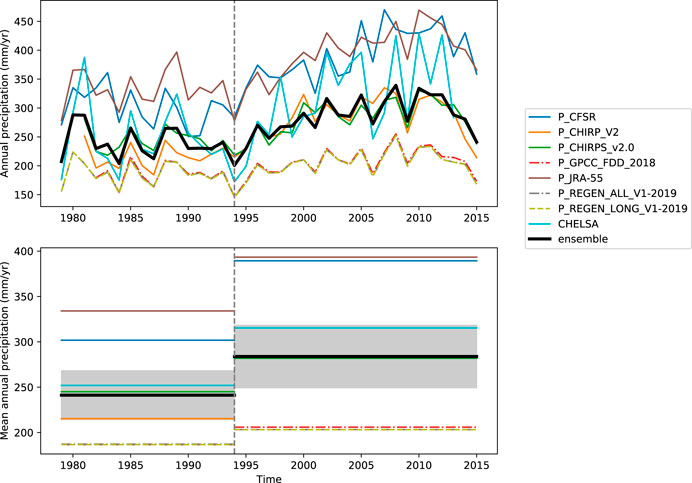
FIGURE 8. Annual precipitation (upper panel) and mean annual precipitation (lower panel) for the eight members of the FROGS ensemble and for the whole study area. The shaded area in the lower panel shows ± one standard deviation of the annual series of P ensemble for the period considered.
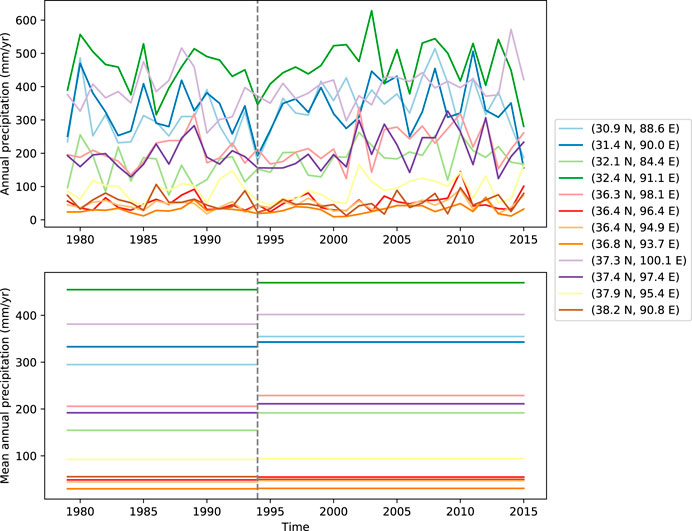
FIGURE 9. Annual precipitation (upper panel) and mean annual precipitation (lower panel) for the twelve China Meteorological Association stations located within the study region. Additionally, figure S7 shows the inter-annual variability of precipitation for each station.
In terms of cumulative water equivalent change, the reanalysis products show large discrepancies (Figure 2B). The four reanalysis products with positive
Discussion
Insufficient Glacier Mass Loss to Explain the Lake Mass Increase
Despite relatively large uncertainties in the glacier contribution to lake mass increase, the estimate of 19
Despite these large uncertainties, we can safely conclude that glacier mass loss is insufficient to explain the endorheic Tibetan plateau lake mass gain for the period 1994–2015. If the glaciers were fully responsible of the lake mass increase, it would imply a glacier specific mass balance of −0.89 m w. e./yr, which is much more negative than recent mass balance observations (Brun et al., 2017; Shean et al., 2020). However, the glacier contribution might increase or even dominate in the coming decades, as inner Tibet glaciers are expected to recede at increasing rates in the near future (Kraaijenbrink et al., 2017).
Link Between Meteorology and Increased Water Storage
As mentioned in the method section, this work relies on three assumptions: 1) no changes in groundwater and soil moisture storage, 2) no leakage to the deeper groundwater and 3) equilibrium of the water budget during the period 1979–1993. The hypothesis of constant groundwater and soil moisture storage is supported by published trends in terrestrial water storage measured by GRACE. These include both surface and sub-surface water storage changes, thus a difference between numbers calculated in this study and terrestrial water storage trends would be indicative of changes in groundwater or soil moisture storage. Terrestrial water storage trends for the inner plateau for the period 2003–2016 range from 5.1
The second hypothesis of no leakage to the deeper groundwater outside of the sub-basin is harder to justify. Very few estimates of the actual lake seepage are available, even though it could be a substantial contribution to lake water balance (Zhou et al., 2013). However, changes in seepage should be linked to changes in fault activities which, to our best knowledge, have not been reported for this study area. The third hypothesis of a balanced water budget during 1979–1993 is also challenging to validate due to the limited availability of remote sensing data in the past. Previous studies suggest that surface water storage was close to balance prior to 2000, with a lake mass change of −1.7 Gt/yr for the period 1976–1990 (Qiao et al., 2019b) and moderate glacier mass loss for the period 1970–2000 (Zhou et al., 2018; Zemp et al., 2019).
However, we find that none of the reanalysis products used here can fully explain the lake mass change, and therefore close the water budget of these endorheic basins. Reanalysis products are notoriously challenging to validate in mountainous areas, with few in situ observations (Palazzi et al., 2013; He et al., 2019), and large biases (Orsolini et al., 2019). On top of the discrepancies between reanalysis mean values for P and ET (Figure 6), we can question the ability of the reanalysis products to close the water budget in regions where evaporation from lakes is a large component of the water budget and is not taken into account in the reanalysis. To illustrate this, we calculate the lake evaporation needed to meet the mean (P-ET) value at the basin scale. We find lake-equivalent evaporation ranging from 440 to 8,350 mm/yr, with none of the reanalysis products matching the range of observed values from 600 to 1,300 mm/yr (Supplementary Figure S6; Ma et al., 2016; Wang et al., 2020). This is a very serious limitation for the water budget closure, in particular for MERRA-2 and WRF20k products that show unrealistically high lake-equivalent evaporation (Supplementary Figure S6). Overall, the precipitation minus evapotranspiration balance is extremely sensitive in arid environments. Many additional processes could alter this balance. For example, the recent greening of the plateau could have dramatically increased the transpiration, something that is not captured by the reanalysis products (Zhu et al., 2016; Zhang et al., 2017c). Also an increase in the permafrost active layer depth and thawing permafrost could lead to enhanced evapotranspiration (Wu and Zhang, 2010).
Significance of the Lake Level Changes in Light of Climate Variability
Lakes act as low-pass filters of climate variability (e.g., Hasselmann, 1976; Mason et al., 1994; Huybers et al., 2016). Large changes in closed lake level and area can occur over decadal timescales under a constant climate in response to year-to-year stochastic climate fluctuations (Huybers et al., 2016). Our study focuses on the water budget at basin scale, and consequently does not investigate individual lake responses. However, we find that at the scale of the plateau, the increased lake mass corresponds to a sustained water excess of 6.0
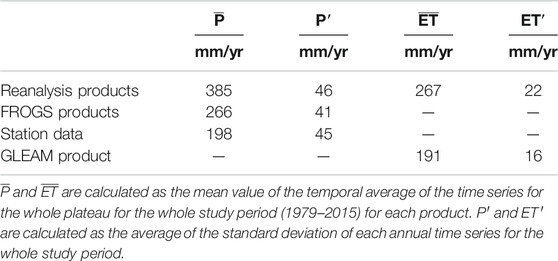
TABLE 3. Summary of the mean values and variability for P and ET for the whole plateau.
In a slightly more quantitative analysis, we calculate the response time (
where
Missing Processes
From this analysis, it is clear that glacier mass loss is not the main driver of the recent Tibetan lake volume increase. Most data sources (station data, the FROGS ensemble and four out of the six reanalysis products) point toward an increase in precipitation. However, the synoptic drivers for such changes are not clear, and could be linked to changes in the moisture sources (Gao et al., 2014) and/or to the influence of Westerlies (Mölg et al., 2017). There is a need to better identify these mechanisms. A better representation of evapotranspiration processes is also needed in reanalysis products. We still lack a comprehensive understanding of the Tibetan plateau water cycle in dry conditions, especially the role of snow and sublimation. In addition to total precipitation amount, the lake level changes might also respond to the intensity and frequency of the rainfall and snow fall and/or to changes in the precipitation seasonality. For instance, the increase in May precipitation observed in the south eastern edge of the plateau coincides with the location of the highest lake level increase (Zhang et al., 2017c). Consequently, the earlier onset on the South Asian monsoon might play an important role in lake volume increase (Liu et al., 2019).
Conclusion
By combining recent observations of lake and glacier mass change for the endorheic Tibetan plateau, we demonstrate that glacier mass loss has a relatively limited contribution of 19
Tibetan lakes are highly sensitive to changes in the water balance because they are sinks of large endorheic basins. Global-scale reanalysis and precipitation products show changes that are qualitatively, but not quantitatively, in agreement with the lake changes. Our results demonstrate the need for catchment-scale studies with local observations, to better understand the water budgets of the Tibetan plateau lakes.
Data Availability Statement
The raw data supporting the conclusions of this article will be made available by the authors, without undue reservation.
Author Contributions
FB and WI designed the study. DT and DS provided data. FB analyzed the data. FB led the writing of the manuscript and all authors contributed to the writing.
Funding
This project has received funding from the Strategic Priority Research Program of Chinese Academy of Sciences (Grant No. XDA20100300), the European Research Council (ERC) under the European Union Horizon 2020 Research and Innovation Program (Grant Agreement No. 676819) and The Netherlands Organization for Scientific Research (grant no. 016.181.308 and ALWOP.467). DS was supported by NASA award NNX16AQ88G. DT acknowledges funding from the FP7 Ideas: European Research Council (grant no. ICEMASS (320816)).
Conflict of Interest
The authors declare that the research was conducted in the absence of any commercial or financial relationships that could be construed as a potential conflict of interest.
The reviewer (FM and YZ) declared a past co-authorship with one of the authors (WI) to the handling editor.
Acknowledgments
We thank Guoqing Zhang for valuable comments on the manuscript and four anonymous reviewers for critical comments that improved the original manuscript. We thank the Scientific Editor Christoph Schneider and the Chief Editor Regine Hock for handling the manuscript and for their careful reading.
Supplementary Material
The Supplementary Material for this article can be found online at: https://www.frontiersin.org/articles/10.3389/feart.2020.582060/full#supplementary-material
References
Biskop, S., Maussion, F., Krause, P., and Fink, M. (2016). Differences in the water-balance components of four lakes in the southern-central Tibetan Plateau. Hydrol. Earth Syst. Sci. 20, 209–225. doi:10.5194/hess-20-209-2016
Brun, F., Berthier, E., Wagnon, P., Kääb, A., and Treichler, D. (2017). A spatially resolved estimate of High Mountain Asia glacier mass balances from 2000 to 2016. Nat. Geosci. 10, 668–673. doi:10.1038/ngeo2999
Copernicus Climate Change Service (2017). [Dataset] ERA5: fifth generation of ECMWF atmospheric reanalyses of the global climate. Accessed: April 2019.
Crétaux, J.-F., Jelinski, W., Calmant, S., Kouraev, A., Vuglinski, V., Bergé-Nguyen, M., et al. (2011). SOLS: a lake database to monitor in the Near Real Time water level and storage variations from remote sensing data. Adv. Space Res. 47, 1497–1507. doi:10.1016/j.asr.2011.01.004
de Kok, R. J., Kraaijenbrink, P. D. A., Tuinenburg, O. A., Bonekamp, P. N. J., and Immerzeel, W. W. (2020). Towards understanding the pattern of glacier mass balances in High Mountain Asia using regional climatic modelling. The Cryosphere. 14, 3215–3234. doi:10.5194/tc-14-3215-2020
Dee, D. P., Uppala, S. M., Simmons, A. J., Berrisford, P., Poli, P., Kobayashi, S., et al. (2011). The ERA-Interim reanalysis: configuration and performance of the data assimilation system. Q. J. R. Meteorol. Soc. 137, 553–597. doi:10.1002/qj.828
Gao, Y., Cuo, L., and Zhang, Y. (2014). Changes in moisture flux over the Tibetan plateau during 1979-2011 and possible mechanisms. J. Clim. 27, 1876–1893. doi:10.1175/JCLI-D-13-00321.1
Gardner, A. S., Moholdt, G., Cogley, J. G., Wouters, B., Arendt, A. A., Wahr, J., et al. (2013). A reconciled estimate of glacier contributions to sea level rise: 2003 to 2009. Science 340, 852–857. doi:10.1126/science.1234532
Gelaro, R., McCarty, W., Suárez, M. J., Todling, R., Molod, A., Takacs, L., et al. (2017). The modern-era retrospective analysis for research and applications, version 2 (MERRA-2). J. Clim. 30, 5419–5454. doi:10.1175/JCLI-D-16-0758.1
Hasselmann, K. (1976). Stochastic climate models Part I. Theory. Tellus 28, 473–485. doi:10.3402/tellusa.v28i6.11316
He, J., Zhang, F., Chen, X., Bao, X., Chen, D., Kim, H. M., et al. (2019). Development and evaluation of an ensemble-based data assimilation system for regional reanalysis over the Tibetan plateau and surrounding regions. J. Adv. Model. Earth Syst. 11, 2503–2522. doi:10.1029/2019MS001665
Huang, L., Liu, J., Shao, Q., and Liu, R. (2011). Changing inland lakes responding to climate warming in Northeastern Tibetan Plateau. Clim. Change. 109, 479–502. doi:10.1007/s10584-011-0032-x
Huybers, K., Rupper, S., and Roe, G. H. (2016). Response of closed basin lakes to interannual climate variability. Clim. Dynam. 46, 3709–3723. doi:10.1007/s00382-015-2798-4
Kääb, A., Treichler, D., Nuth, C., and Berthier, E. (2015). Brief communication: contending estimates of 2003-2008 glacier mass balance over the pamir–karakoram–himalaya. Cryosphere 9, 557–564. doi:10.5194/tc-9-557-2015
Karger, D. N., Conrad, O., Böhner, J., Kawohl, T., Kreft, H., Soria-Auza, R. W., et al. (2017). Climatologies at high resolution for the earth’s land surface areas. Sci. Data. 4, 170122. doi:10.1038/sdata.2017.122
Kraaijenbrink, P. D. A., Bierkens, M. F. P., Lutz, A. F., and Immerzeel, W. W. (2017). Impact of a global temperature rise of 1.5 degrees Celsius on Asia glaciers. Nature 549, 257–260. doi:10.1038/nature23878
Lehner, B., and Grill, G. (2013). Global river hydrography and network routing: baseline data and new approaches to study the world’s large river systems. Hydrol. Process. 27, 2171–2186. doi:10.1002/hyp.9740
Lei, Y., Yang, K., Wang, B., Sheng, Y., Bird, B. W., Zhang, G., et al. (2014). Response of inland lake dynamics over the Tibetan Plateau to climate change. Clim. Change. 125, 281–290. doi:10.1007/s10584-014-1175-3
Lei, Y., Yao, T., Bird, B. W., Yang, K., Zhai, J., and Sheng, Y. (2013). Coherent lake growth on the central Tibetan Plateau since the 1970s: characterization and attribution. J. Hydrol. 483, 61–67. doi:10.1016/j.jhydrol.2013.01.003
Lei, Y., Zhu, Y., Wang, B., Yao, T., Yang, K., Zhang, X., et al. (2019). Extreme lake level changes on the Tibetan plateau associated with the 2015/2016 el niño. Geophys. Res. Lett. 46, 5889–5898. doi:10.1029/2019GL081946
Li, G., and Lin, H. (2017). Recent decadal glacier mass balances over the Western Nyainqentanglha Mountains and the increase in their melting contribution to Nam Co Lake measured by differential bistatic SAR interferometry. Global Planet. Change. 149, 177–190. doi:10.1016/j.gloplacha.2016.12.018
Li, X., Long, D., Huang, Q., Han, P., Zhao, F., and Wada, Y. (2019). High-temporal-resolution water level and storage change data sets for lakes on the Tibetan Plateau during 2000–2017 using multiple altimetric missions and Landsat-derived lake shoreline positions. Earth Syst. Sci. Data. 11, 1603–1627. doi:10.5194/essd-11-1603-2019
Li, Y., Liao, J., Guo, H., Liu, Z., and Shen, G. (2014). Patterns and potential drivers of dramatic changes in Tibetan lakes, 1972–2010. PLoS One. 9, e111890. doi:10.1371/journal.pone.0111890
Lin, H., Li, G., Cuo, L., Hooper, A., and Ye, Q. (2017). A decreasing glacier mass balance gradient from the edge of the Upper Tarim Basin to the Karakoram during 2000–2014. Sci. Rep. 7, 6712. doi:10.1038/s41598-017-07133-8
Liu, Y., Chen, H., Zhang, G., Sun, J., and Wang, H. (2019). The advanced South Asian monsoon onset accelerates lake expansion over the Tibetan Plateau. Sci. Bull. 64, 1486–1489. doi:10.1016/j.scib.2019.08.011
Loomis, B. D., Richey, A. S., Arendt, A. A., Appana, R., Deweese, Y.-J. C., Forman, B. A., et al. (2019). Water storage trends in high mountain Asia. Front. Earth Sci. 7, 235. doi:10.3389/feart.2019.00235
Mölg, T., Maussion, F., Collier, E., Chiang, J. C. H., and Scherer, D. (2017). Prominent midlatitude circulation signature in high Asia’s surface climate during monsoon. J. Geophys. Res. 122, 12702–12712. doi:10.1002/2017JD027414
Ma, N., Szilagyi, J., Niu, G.-Y., Zhang, Y., Zhang, T., Wang, B., et al. (2016). Evaporation variability of Nam Co Lake in the Tibetan Plateau and its role in recent rapid lake expansion. J. Hydrol. 537, 27–35. doi:10.1016/j.jhydrol.2016.03.030
Martens, B., Miralles, D. G., Lievens, H., van der Schalie, R., de Jeu, R. A. M., Fernández-Prieto, D., et al. (2017). GLEAM v3: satellite-based land evaporation and root-zone soil moisture. Geosci. Model Dev. (GMD) 10, 1903–1925. doi:10.5194/gmd-10-1903-2017
Mason, I. M., Guzkowska, M. A. J., Rapley, C. G., and Street-Perrott, F. A. (1994). The response of lake levels and areas to climatic change. Clim. Change. 27, 161–197. doi:10.1007/BF01093590
Orsolini, Y., Wegmann, M., Dutra, E., Liu, B., Balsamo, G., Yang, K., et al. (2019). Evaluation of snow depth and snow cover over the Tibetan Plateau in global reanalyses using in situ and satellite remote sensing observations. The Cryosphere. 13, 2221–2239. doi:10.5194/tc-13-2221-2019
Palazzi, E., von Hardenberg, J., and Provenzale, A. (2013). Precipitation in the hindu-kush karakoram himalaya: observations and future scenarios. J. Geophys. Res. 118, 85–100. doi:10.1029/2012JD018697
Pekel, J.-F., Cottam, A., Gorelick, N., and Belward, A. S. (2016). High-resolution mapping of global surface water and its long-term changes. Nature 540, 418–422. doi:10.1038/nature20584
Phan, V. H., Lindenbergh, R. C., and Menenti, M. (2013). Geometric dependency of Tibetan lakes on glacial runoff. Hydrol. Earth Syst. Sci. 17, 4061–4077. doi:10.5194/hess-17-4061-2013
Qiao, B., and Zhu, L. (2017). Differences and cause analysis of changes in lakes of different supply types in the north-western Tibetan Plateau. Hydrol. Process. 31, 2752–2763. doi:10.1002/hyp.11215
Qiao, B., and Zhu, L. (2019). Difference and cause analysis of water storage changes for glacier-fed and non-glacier-fed lakes on the Tibetan Plateau. Sci. Total Environ. 693, 133399. doi:10.1016/j.scitotenv.2019.07.205
Qiao, B., Zhu, L., Wang, J., Ju, J., Ma, Q., and Liu, C. (2017). Estimation of lakes water storage and their changes on the northwestern Tibetan Plateau based on bathymetric and Landsat data and driving force analyses. Quatern. Int. 454, 56–67. doi:10.1016/j.quaint.2017.08.005
Qiao, B., Zhu, L., Wang, J., Ju, J., Ma, Q., Huang, L., et al. (2019a). Estimation of lake water storage and changes based on bathymetric data and altimetry data and the association with climate change in the central Tibetan Plateau. J. Hydrol. 578, 124052. doi:10.1016/j.jhydrol.2019.124052
Qiao, B., Zhu, L., and Yang, R. (2019b). Temporal-spatial differences in lake water storage changes and their links to climate change throughout the Tibetan Plateau. Rem. Sens. Environ. 222, 232–243.
10.1016/j.rse.2018.12.037CrossRef Full Text | Google Scholar
Roca, R., Alexander, L. V., Potter, G., Bador, M., Jucá, R., Contractor, S., et al. (2019). FROGS: a daily 1° × 1° gridded precipitation database of rain gauge, satellite and reanalysis products. Earth Syst. Sci. Data. 11, 1017–1035. doi:10.5194/essd-11-1017-2019
Rodell, M., Houser, P. R., Jambor, U., Gottschalck, J., Mitchell, K., Meng, C.-J., et al. (2004). The global land data assimilation system. Bull. Am. Meteorol. Soc. 85, 381–394. doi:10.1175/BAMS-85-3-381
Shean, D. E., Bhushan, S., Montesano, P., Rounce, D. R., Arendt, A., and Osmanoglu, B. (2020). A systematic, regional assessment of high mountain Asia glacier mass balance. Front. Earth Sci. 7, 363. doi:10.3389/feart.2019.00363
Smith, T., and Bookhagen, B. (2018). Changes in seasonal snow water equivalent distribution in High Mountain Asia (1987 to 2009). Science Advances. 4, e1701550. doi:10.1126/sciadv.1701550
Song, C., Huang, B., and Ke, L. (2013). Modeling and analysis of lake water storage changes on the Tibetan Plateau using multi-mission satellite data. Rem. Sens. Environ. 135, 25–35. doi:10.1016/j.rse.2013.03.013
Song, C., Huang, B., Richards, K., Ke, L., and Hien Phan, V. (2014). Accelerated lake expansion on the Tibetan Plateau in the 2000s: induced by glacial melting or other processes? Water Resour. Res. 50, 3170–3186. doi:10.1002/2013WR014724
Song, C., and Sheng, Y. (2016). Contrasting evolution patterns between glacier-fed and non-glacier-fed lakes in the Tanggula Mountains and climate cause analysis. Clim. Change. 135, 493–507. doi:10.1007/s10584-015-1578-9
Song, C., Sheng, Y., Zhan, S., Wang, J., Ke, L., and Liu, K. (2019). Impact of amplified evaporation due to lake expansion on the water budget across the inner Tibetan Plateau. Int. J. Climatol. 40, 2091–2105. doi:10.1002/joc.6320
Tong, K., Su, F., and Xu, B. (2016). Quantifying the contribution of glacier meltwater in the expansion of the largest lake in Tibet. J. Geophys. Res. 121, 11158–11173. doi:10.1002/2016JD025424
Treichler, D., Kääb, A., Salzmann, N., and Xu, C.-Y. (2019). Recent glacier and lake changes in High Mountain Asia and their relation to precipitation changes. Cryosphere 13, 2977–3005. doi:10.5194/tc-13-2977-2019
Wang, A., and Zeng, X. (2012). Evaluation of multireanalysis products with in situ observations over the Tibetan Plateau. J. Geophys. Res. 117, D05102. doi:10.1029/2011JD016553
Wang, B., Ma, Y., Su, Z., Wang, Y., and Ma, W. (2020). Quantifying the evaporation amounts of 75 high-elevation large dimictic lakes on the Tibetan Plateau. Science Advances. 6, eaay8558. doi:10.1126/sciadv.aay8558
Wang, J., Song, C., Reager, J. T., Yao, F., Famiglietti, J. S., Sheng, Y., et al. (2018). Recent global decline in endorheic basin water storages. Nat. Geosci. 11, 926–932. doi:10.1038/s41561-018-0265-7
Wang, Q., Yi, S., and Sun, W. (2016). The changing pattern of lake and its contribution to increased mass in the Tibetan Plateau derived from GRACE and ICESat data. Geophys. J. Int. 207, 528–541. doi:10.1093/gji/ggw293
Wu, Q., and Zhang, T. (2010). Changes in active layer thickness over the Qinghai-Tibetan Plateau from 1995 to 2007. J. Geophys. Res. 115, D09107. doi:10.1029/2009JD012974
Xiang, L., Wang, H., Steffen, H., Wu, P., Jia, L., Jiang, L., et al. (2016). Groundwater storage changes in the Tibetan Plateau and adjacent areas revealed from GRACE satellite gravity data. Earth Planet Sci. Lett. 449, 228–239. doi:10.1016/j.epsl.2016.06.002
Yao, F., Wang, J., Yang, K., Wang, C., Walter, B. A., and Crétaux, J.-F. (2018). Lake storage variation on the endorheic Tibetan Plateau and its attribution to climate change since the new millennium. Environ. Res. Lett. 13, 064011. doi:10.1088/1748-9326/aab5d3
Yao, T., Pu, J., Lu, A., Wang, Y., and Yu, W. (2007). Recent glacial retreat and its impact on hydrological processes on the Tibetan plateau, China, and surrounding regions. Arctic Antarct. Alpine Res. 39, 642–650. doi:10.1657/1523-0430(07-510)[YAO]2.0.CO;2
Yao, T., Thompson, L., Yang, W., Yu, W., Gao, Y., Guo, X., et al. (2012). Different glacier status with atmospheric circulations in Tibetan Plateau and surroundings. Nat. Clim. Change. 2, 663–667. doi:10.1038/nclimate1580
Yoon, Y., Kumar, S. V., Forman, B. A., Zaitchik, B. F., Kwon, Y., Qian, Y., et al. (2019). Evaluating the uncertainty of terrestrial water budget components over high mountain Asia. Front. Earth Sci. 7, 120. doi:10.3389/feart.2019.00120
Zemp, M., Huss, M., Thibert, E., Eckert, N., McNabb, R., Huber, J., et al. (2019). Global glacier mass changes and their contributions to sea-level rise from 1961 to 2016. Nature 568, 382–386. doi:10.1038/s41586-019-1071-0
Zhang, G., Chen, W., Li, G., Yang, W., Yi, S., and Luo, W. (2020a). Lake water and glacier mass gains in the northwestern Tibetan Plateau observed from multi-sensor remote sensing data: implication of an enhanced hydrological cycle. Rem. Sens. Environ. 237, 111554. doi:10.1016/j.rse.2019.111554
Zhang, G., Yao, T., Xie, H., Yang, K., Zhu, L., Shum, C., et al. (2020b). Response of Tibetan Plateau lakes to climate change: trends, patterns, and mechanisms. Earth Sci. Rev. 208, 103269. doi:10.1016/j.earscirev.2020.103269
Zhang, G., Yao, T., Piao, S., Bolch, T., Xie, H., Chen, D., et al. (2017a). Extensive and drastically different alpine lake changes on Asia’s high plateaus during the past four decades. Geophys. Res. Lett. 44, 252–260. doi:10.1002/2016GL072033
Zhang, G., Yao, T., Shum, C. K., Yi, S., Yang, K., Xie, H., et al. (2017b). Lake volume and groundwater storage variations in Tibetan Plateau’s endorheic basin. Geophys. Res. Lett. 44, 5550–5560. doi:10.1002/2017GL073773
Zhang, W., Zhou, T., and Zhang, L. (2017c). Wetting and greening Tibetan Plateau in early summer in recent decades. J. Geophys. Res. 122, 5808–5822. doi:10.1002/2017JD026468
Zhou, S., Kang, S., Chen, F., and Joswiak, D. R. (2013). Water balance observations reveal significant subsurface water seepage from Lake Nam Co, south-central Tibetan Plateau. J. Hydrol. 491, 89–99. doi:10.1016/j.jhydrol.2013.03.030
Zhou, Y., Hu, J., Li, Z., Li, J., Zhao, R., and Ding, X. (2019). Quantifying glacier mass change and its contribution to lake growths in central Kunlun during 2000–2015 from multi-source remote sensing data. J. Hydrol. 570, 38–50. doi:10.1016/j.jhydrol.2019.01.007
Zhou, Y., Li, Z., Li, J., Zhao, R., and Ding, X. (2018). Glacier mass balance in the Qinghai–Tibet Plateau and its surroundings from the mid-1970s to 2000 based on Hexagon KH-9 and SRTM DEMs. Rem. Sens. Environ. 210, 96–112. doi:10.1016/j.rse.2018.03.020
Zhu, L., Xie, M., and Wu, Y. (2010). Quantitative analysis of lake area variations and the influence factors from 1971 to 2004 in the Nam Co basin of the Tibetan Plateau. Chin. Sci. Bull. 55, 1294–1303. doi:10.1007/s11434-010-0015-8
Keywords: lakes, glaciers, reanalysis, tibetan plateau, precipitation, High mountain Asia
Citation: Brun F, Treichler D, Shean D and Immerzeel WW (2020) Limited Contribution of Glacier Mass Loss to the Recent Increase in Tibetan Plateau Lake Volume. Front. Earth Sci. 8:582060. doi: 10.3389/feart.2020.582060
Received: 10 July 2020; Accepted: 02 October 2020;
Published: 16 November 2020.
Edited by:
Christoph Schneider, Humboldt-Universität zu Berlin, GermanyReviewed by:
Fabien Maussion, University of Innsbruck, AustriaYinsheng Zhang, Institute of Tibetan Plateau Research (CAS), China
Liping Zhu, Institute of Tibetan Plateau Research (CAS), China
Jan Kropacek, Czech University of Life Sciences Prague, Czechia
Copyright ©2020 Brun, Treichler, Shean and Immerzeel. This is an open-access article distributed under the terms of the Creative Commons Attribution License (CC BY). The use, distribution or reproduction in other forums is permitted, provided the original author(s) and the copyright owner(s) are credited and that the original publication in this journal is cited, in accordance with accepted academic practice. No use, distribution or reproduction is permitted which does not comply with these terms.
*Correspondence: Fanny Brun, ZmFubnkuYnJ1bkB1bml2LWdyZW5vYmxlLWFscGVzLmZy