 Laura L. Lapham1*
 Scott R. Dallimore2
 Cédric Magen1Lillian C. Henderson1
 Leanne C. Powers1
 Michael Gonsior1Brittany Clark1Michelle Côté2Paul Fraser2
 Beth N. Orcutt3
- 1Chesapeake Biological Laboratory, University of Maryland Center for Environmental Science, Solomons, MD, United States
- 2Geological Survey of Canada, Natural Resources Canada, Sidney, BC, Canada
- 3Bigelow Laboratory for Ocean Sciences, East Boothbay, ME, United States
Permafrost sediments contain one of the largest reservoirs of organic carbon on Earth that is relatively stable when it remains frozen. As air temperatures increase, the shallow permafrost thaws which allows this organic matter to be converted into potent greenhouse gases such as methane (CH4) and carbon dioxide (CO2) through microbial processes. Along the Beaufort Sea coast in the vicinity of the Tuktoyaktuk Peninsula, Northwest Territories, Canada, warming air temperatures are causing the active layer above permafrost to deepen, and a number of active periglacial processes are causing rapid erosion of previously frozen permafrost. In this paper, we consider the biogeochemical consequences of these processes on the permafrost sediments found at Tuktoyaktuk Island. Our goals were to document the in situ carbon characteristics which can support microbial activity, and then consider rates of such activity if the permafrost material were to warm even further. Samples were collected from a 12 m permafrost core positioned on the top of the island adjacent to an eroding coastal bluff. Downcore CH4, total organic carbon and dissolved organic carbon (DOC) concentrations and stable carbon isotopes revealed variable in situ CH4 concentrations down core with a sub-surface peak just below the current active layer. The highest DOC concentrations were observed in the active layer. Controlled incubations of sediment from various depths were carried out from several depths anaerobically under thawed (5°C and 15°C) and under frozen (−20°C and −5°C) conditions. These incubations resulted in gross production rates of CH4 and CO2 that increased upon thawing, as expected, but also showed appreciable production rates under frozen conditions. This dataset presents the potential for sediments below the active layer to produce potent greenhouse gases, even under frozen conditions, which could be an important atmospheric source in the actively eroding coastal zone even prior to thawing.
Introduction
The Arctic coast of western North America and northern Eurasia is undergoing rapid change due to sea level rise, reduction in seasonal sea ice extent and accelerated rates of coastal erosion (AMAP, 2019). Air temperatures in these regions are increasing at a rate that surpasses the average global temperature increase (GISTEMP, 2019; Lenssen et al., 2019) and projections suggest that this trend will continue into the future (Christensen et al., 2013; AMAP, 2019; Bush and Lemmen, 2019). Permafrost that is widespread and ubiquitous to most Arctic settings is responding to this warming with changes in near surface processes, such as a thickening of the active layer (Biskaborn et al., 2019). Warming permafrost can lead to the release of previously stored dissolved organic carbon (DOC), which could act as a labile carbon source for microbial metabolisms. Microbial incubation studies where permafrost material is thawed to above freezing temperatures, have shown the potential for the formation of potent greenhouse gases, such as CH4 and CO2 (Treat et al., 2015; Schädel et al., 2016; Knoblauch et al., 2018). Understanding how temperature affects microbial production rates of these gases, under realistic temperature scenarios, is key to projecting the role permafrost may play in future climate change.
Incubation studies assessing the rates of microbial processes in Arctic soils often concentrate on these near-surface sediments and the top of permafrost as an area most vulnerable to thaw in the future (Elberling and Brandt, 2003; Treat et al., 2014; Treat et al., 2015). Yet, microbial processes could still occur deeper within the permafrost that ultimately end in the production of the same greenhouse gases (Wagner et al., 2007; Knoblauch et al., 2013). Microbial activity in the frozen state is certainly recognized and studies are moving toward understanding the mechanisms for specific processes, such as methanogenesis (Hultman et al., 2015; Nikrad et al., 2016). Studies specifically incubating frozen permafrost with isotope labeled substrates such as bicarbonate or acetate, show that these methanogens are actively producing radiative gases under frozen conditions (Rivkina et al., 2007). Such activity could occur in unfrozen water found in the permafrost (Romanovsky and Osterkamp, 2000), possibly as cryopegs (sodium-chloride brines) which remain liquid down to −11°C (Gilichinsky et al., 2005), although this remains unclear.
In response to climate warming, a changing mean annual ground surface temperature regime (Biskaborn et al., 2019) could manifest in greater microbial activity within the permafrost, even if temperatures remain below freezing. But warming temperatures are not the only factor. Frozen sediments at depth can also experience rapid thaw triggered from coastal erosion and landslides. In these cases, warming, or abrupt thaw (Turetsky et al., 2020), can occur from the top down, or from the sides of exposed cliff faces. If there are accumulated greenhouse gases within this newly exposed permafrost, it could be abruptly released to the atmosphere.
In this paper, we consider the biogeochemical consequences of warming (yet still frozen) and thawing (no longer frozen) of permafrost from an eroding coastal setting near Tuktoyaktuk, Northwest Territories (N.W.T.), Canada, on the Beaufort Sea coast. This area has experienced prolonged atmospheric warming and coastal erosion (Hynes et al., 2014). Based on previous permafrost studies, we hypothesize that there are active microbial processes occurring in these coastal sediments that generate CO2 and CH4 as permafrost is warmed in situ or exposed to rapid thawing by geomorphic processes such as coastal retreat, landslides or nearshore transgression. We characterize the baseline conditions of a 12 m permafrost core by measuring physical properties, in situ CH4 concentrations, and organic carbon quantity and quality. Laboratory incubation studies document CH4 and CO2 release from frozen permafrost core samples as the they are warmed at negative temperatures and after thawing.
Sample Collection and Methods
Geologic and Permafrost Setting
The study area (Figure 1) is part of the Tuktoyaktuk Coastlands physiographic region, which is characterized by thick occurrences of unconsolidated sediments (Rampton, 1988). The landscape is covered by a low arctic tundra vegetation with dwarf birch, willow, grasses and moss. The climate is characterized by long cold winters and short cool summers, with low precipitation. The Tuktoyaktuk area lies within the continuous permafrost zone, with permafrost thicknesses of ∼400 m (Hu et al., 2013). Ground ice, including ice lenses, ice wedges, and extensive bodies of massive ice, is common (Mackay and Dallimore, 1992). The only community in the area is the Hamlet of Tuktoyaktuk, which was originally an Inuvialuit seasonal harvesting site and was established as a harbor by the Hudson’s Bay Company in 1934. The Hamlet presently has a population of ∼900 people (Statistics Canada, 2017).
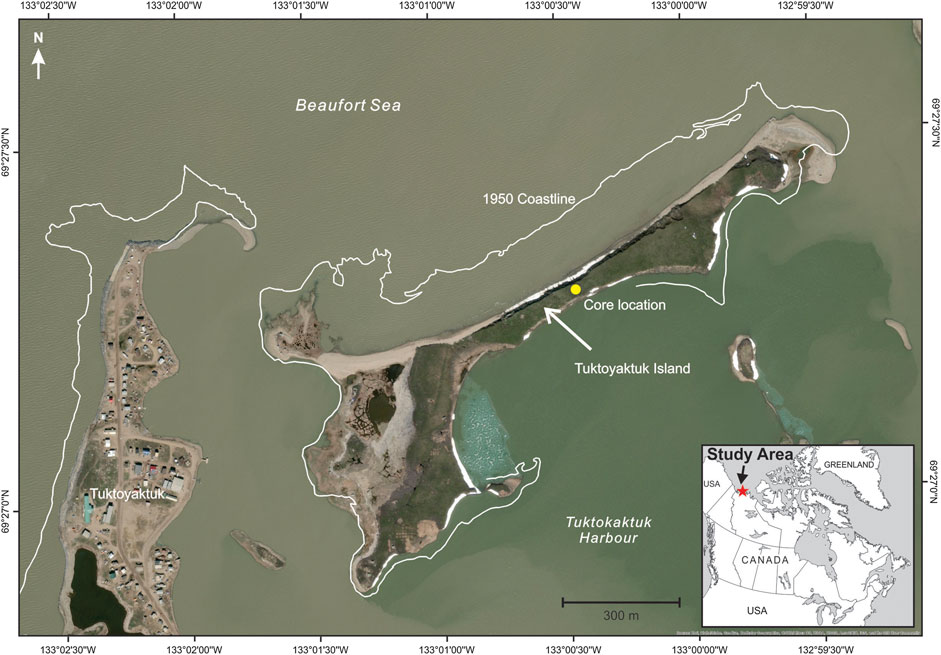
FIGURE 1. Location of 12 m borehole collected from Tuktoyaktuk, Northwest Territories, Canada (69.442°N, 133.031°W). The Hamlet of Tuktoyaktuk is marked on left.
The coastal environment of the Tuktoyaktuk area is experiencing relatively rapid coastal retreat. The seaward side of Tuktoyaktuk Island, located approximately 1 km from the Hamlet, has eroded at an average rate of ∼2.5 m/a since 1950 (Figure 1; Hynes et al., 2014). The majority of the erosion occurs during wind-induced storm surge events. Although storm surges can occur at any time of the year, the largest erosional impact is during the late summer and early fall when the Beaufort Sea coast is ice free, the dominant storm winds are from the northwest and fetch length is at its maximum (Manson and Solomon, 2007). Increases in mean annual air temperatures from approximately −11°C to −8.5°C have been recorded over the past 5 decades (Figure 2; GISTEMP, 2019). A linear fit to this trend gives an increase of 0.52°C/decade, about twice the global average for this same period (Hansen et al., 2010). Changing permafrost conditions are affecting building foundations and other infrastructure, storm surges are causing flooding, and accelerated coastal retreat is forcing the relocation of buildings (Gruben, 2018; Zingel, 2019).
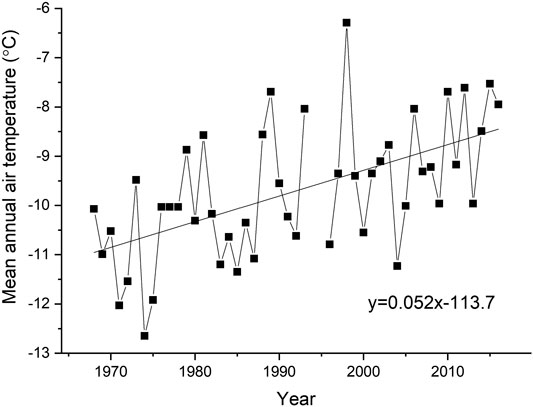
FIGURE 2. Mean annual air temperature at Tuktoyaktuk from 1968–2018. Linear fit shows positive slope of 0.052°C/year. Data from GISTEMP (2019).
Core Collection
The permafrost core utilized for our study was collected from a drilling program, conducted by the Geological Survey of Canada in March 2018, to document the properties of the eroding permafrost as a basis to assess the consequences of ongoing warming and erosion of Tuktoyaktuk Island (Figure 1). Four drill holes were completed using a CRREL core barrel (10 cm diameter, Midnight Sun Drilling, Whitehorse, CA, Figure 3A) for frozen sediments and a solid stem auger for unfrozen sediments. The CRREL core barrel was specifically designed to collect permafrost samples with minimal contamination or thermal disturbance to the core. The core samples utilized for this project (Figures 3B,C) were retrieved from a terrestrial borehole positioned at the surface of the Island, ∼6 m above sea level ∼30 m from the eroding coastal bluff (Figure 4A). In August 2018, a thermistor cable was installed in a borehole to measure ground temperatures. The thermistor sensor depths ranged from just below ground surface to a maximum depth of 14 m with a data logger (RBR XR-420, 8 channel) set to record temperatures hourly. In July 2019, the temperature data was recovered and presented here.
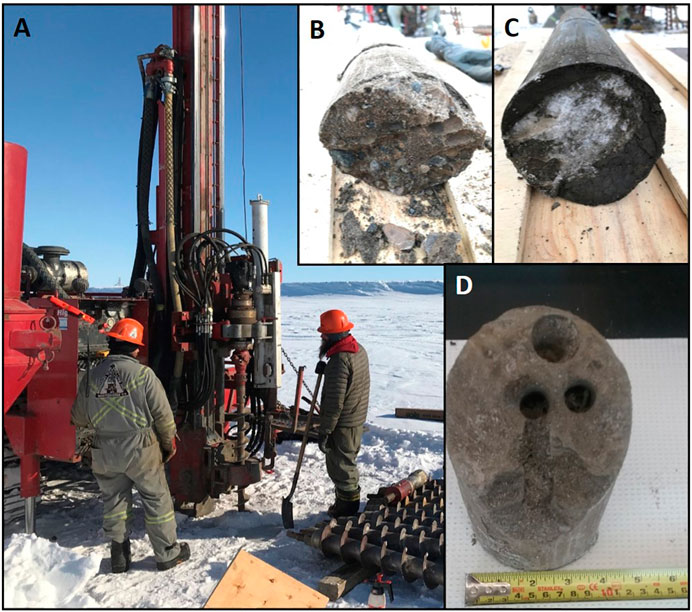
FIGURE 3. (A) Picture of field operations, (B) the surface sediments at this site consisted mainly of pebbly sands which were very slow to core, (C) deeper in the section some fine grained sediments with clasts and nodules of pure ground ice were encountered, and (D) a sub-section sampled for the analyses described in study. Pictures from Paul Fraser.
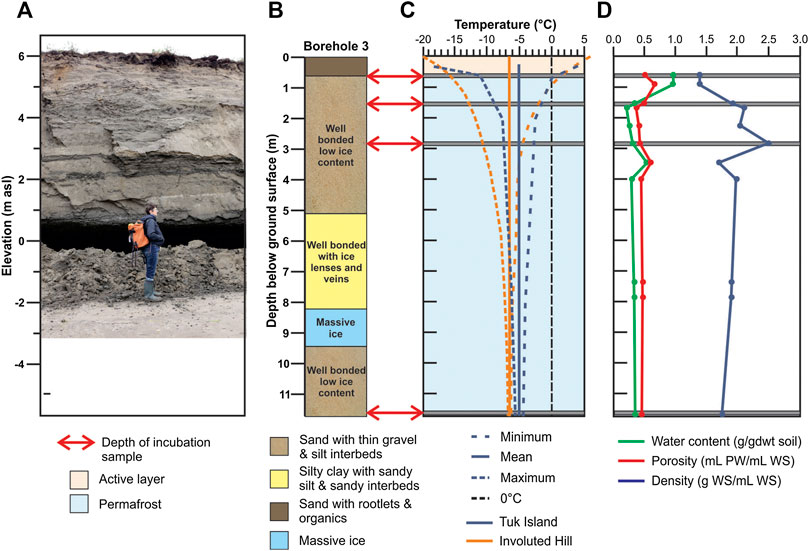
FIGURE 4. Down core physical properties. (A) Photograph of coastal exposure near field site. (B) Core description. Red arrows and gray bars indicate depths chosen for incubation experiments. (C) Permafrost annual temperature range presented in this study (blue line Tuk Island 2018-2019) and a close location (orange line Involuted Hill (IH88‐2) in 1995). (D) Physical properties measured of core: water content (green line), porosity (red line) and wet bulk density (blue line). PW = porewater, WS = wet sediment.
Samples used in this study were collected from 10 cm length whole round core sections selected from 10 depth intervals representing a range of in situ ground temperatures (0.6, 0.9, 1.5, 1.7, 2.2, 2.8, 3.4, 3.9, 7.8, and 11.6 m). The drilling was undertaken in March with air temperatures <−25°C and samples were stored in plastic bags and maintained at in situ air temperature until transportation to the Aurora Research Institute in Inuvik, N.W.T. Care was taken to minimize contamination by handling sediment sections with nitrile gloves. Cores were then transferred frozen to the Chesapeake Biological Laboratory (Solomons, MD, USA), and stored at −20°C until further analysis. Given the care to prevent contamination or warming during coring, storage and transport we assume that measured physical and geochemical parameters reasonably reflect in situ conditions of the subsurface permafrost.
Chemical and Physical Characterization of the Core
In situ CH4 Content
Within 1 month of collection, the 10 core sections were subsampled under frozen conditions by drill with a flame sterilized hole saw (3 cm long, 1.5 cm outer diameter) from the center of the section to obtain ∼3–6 g of undisturbed sediment (Figure 3D). Material was placed into pre-weighed 20 ml glass serum vials and capped with black butyl rubber stoppers and aluminum caps, in a manner similar to CH4 determination in marine sediments (Lapham et al., 2008). Vials were weighed to determine the mass of each sample, and basified to arrest further microbial activity (3 ml 1M potassium hydroxide). CH4 concentrations were determined via a headspace equilibration method, and 6 ml of headspace gas were injected into a gas chromatograph (SRI 8620 Multi Gas, thermal conductivity and flame ionization detectors, 3′ HaysepD and 6′ mol sieve 13X columns). Concentrations were corrected for solubility, as previously described in Magen et al. (2014), and analytical precision is 2%.
Physical Parameters
Fresh subsamples were drilled from each depth, in triplicate, to determine porosity, wet bulk density and gravimetric water content. Determinations were made on ∼6 ml of drilled sediment that was pre-weighed and then placed into a pre-weighed volumetric cylinder with ∼10 ml of prefiltered deionized water to determine the volume. The cylinder was then dried at 60°C until constant weight was obtained after seven days. Porosity, wet bulk density, and gravimetric water content was then calculated from these masses and volumes. Analytical accuracy was around 5%.
Organic Matter, Sulfate (SO42−) and Chloride (Cl−) Contents
After the physical parameter testing, the remaining sediment was ground and then treated with acid (1 M HCl) to remove carbonates and measured for total organic carbon (TOC) and organic nitrogen (TON) concentrations, as well as stable isotope ratios (δ13C-TOC, δ15N-TON). Aliquots of sediment were measured on an elemental analyzer (Costech elemental combustion system) interfaced to a Delta V Plus Isotope Ratio Mass Spectrometer (Thermo Scientific, Waltham, MA, USA). The δ13C and δ15N values were reported in ‰ vs VPDB and ‰ vs Air, respectively. Precision on the stable isotope measurement was ±0.1‰ for δ13C and 0.2‰ for δ15N. Carbon to nitrogen (C:N) ratios are also reported.
On a freshly drilled sediment sample, DOC concentrations were analyzed by placing sediment subcores in a 10 ml centrifuge tube and diluting with ∼3.5 ml milli-Q water. After centrifugation (3000 RPM, 30 min, 20°C, Sorvall® RT 6000D), the supernatant liquid was filtered using 0.2 µm pore size Whatman 25 mm GD/X syringe filters and diluted 1:2 with milli-Q water for DOC and optical property analyses. Samples were acidified to pH 2 with concentrated HCl (Sigma Aldrich 32%, pura) and analyzed on a total organic carbon analyzer (Shimadzu TOC-VCPH) using potassium hydrogen phthalate solution as DOC standards. Final DOC concentrations were corrected for dilutions and reported in volume of pore-water present at each depth. An aliquot of this water was then used to determine SO42− and Cl− concentrations on an ion chromatograph (IC, Dionex ICS1000) at 13.5 times dilution with milli-Q water. Concentrations were calculated from IC response compared to standard curve made from IAPSO seawater (35 ppt) and dilutions down to 0.35 ppt. Precision of the measurement was 3% for these samples. Final SO42− and Cl− concentrations are reported after correcting for two dilutions made during manipulations for DOC measurements.
Dissolved organic matter (DOM) optical properties were measured on the above diluted pore water samples (not acidified) by recording ultraviolet (UV)-visible (VIS) absorbance (A(λ)) spectra and excitation emission matrix (EEM) fluorescence spectra (Horiba Aqualog Spectrofluorometer). Excitation or A(λ) spectra were collected at 3 nm intervals between 240 and 700 nm and emission spectra were collected at fixed 3 nm intervals between 245 and 600 nm. Milli-Q water served as the absorbance and fluorescence blank and the water Raman peak (excitation = 350 nm) was measured to normalize all EEM data. Thus, fluorescence intensities are expressed in water Raman units (RU). EEM spectra were also corrected for Raleigh scattering following a method established previously (Zepp et al., 2004). Raw absorbance data was corrected for any offsets between pore water and the pure water blank or instrument drift by subtracting all spectra by their absorbance value at 700 nm. From the A(λ) spectra scans, we only report specific UV absorbance at 254 nm (SUVA254; m−1 L mg−1), which is the A (254) normalized to pathlength (m) and DOC concentration (mg L−1). A(254) is reported in Supplemental Figure 1. SUVA254 has been used as an indicator of DOM aromatic content (Weishaar et al., 2003) and thus the quality of the organic carbon (i.e., higher aromatic content indicating lower quality). The full EEM dataset was further examined for organic matter quality using Parallel Factor Analysis (PARAFAC) (Stedmon and Bro, 2008; Murphy et al., 2013). However, since this analysis is beyond the scope of this paper, the methods, results, and discussion associated with this analysis are presented in the supplemental material.
Anaerobic Incubations
Laboratory incubations lasting ∼6 weeks were carried out on sub-samples from four depths. For each depth, the incubations were conducted under anaerobic conditions at different temperatures, and compared to killed (basified) controls to determine if any abiotic processes contributed to CH4 release. The depths were chosen to document the range of sediment, permafrost and chemical characteristics down core: 0.6 m corresponded to the only sample at the base of the active layer, 1.5 m corresponded to a peak in CH4 concentrations, 2.8 m corresponded to a peak in DOC concentrations, and 11.6 m was the deepest sample collected which was near the depth of zero annual temperature amplitude.
For each incubation, approximately 6–9 g of freshly drilled sediment was placed into six pre-combusted (550°C) 10 ml glass serum vials and capped with black butyl rubber septa and aluminum cap. Vials were then flushed with nitrogen (UHP Airgas) to obtain an anaerobic headspace and placed back at −20°C. To obtain replication within treatments, to three of these vials, 3 ml of a 1M KOH solution was added to arrest microbial activity and referred to as the “killed control” (in triplicate). Since flushing the vials with nitrogen may have removed any in situ CH4, the killed controls act as a way to follow the diffusion of remaining CH4 to the headspace, which is an abiotic process. The remaining three vials were not amended with base and referred to as the “experimental treatment” to examine the gross potential of microbial production of CH4 and/or CO2 during the incubation (also done in triplicate). As the vials were devoid of oxygen, there was no electron acceptor for aerobic microbial CH4 oxidation, so the CH4 production rates should be considered a high-end for gross production potential, and not net rates expected under real-world conditions where oxygen would likely be present.
All vials were then placed in temperature-controlled chambers maintained at specific temperatures within 1°C. For 0.6 m, incubations were carried out at −20 and 15°C, to replicate natural range in temperature conditions in the active layer at this site (Figure 4). For 1.5 and 11.6 m, incubations were carried out at −20°C (coldest surface temperatures sediments experience), −5°C (average air temperature), and +5°C (to replicate modest warming comparable to other studies). For 2.8 m, incubations were carried out at the same frozen temperatures (−20 and -5°C); for the warm treatment, 15°C was chosen for comparison to other studies incubating active layer sediments (Treat et al., 2015). All treatment and temperature pairings were carried out in triplicate. During the incubation, vials were stored in the dark and upside down in a small tub of water (or ice) at their respective temperatures to prevent gases from escaping the septa (although independent experiments show this process would be minimal during the incubations (Magen et al., 2014)).
Time points were collected as discrete headspace samples, approximately once a week, to determine the CH4 and CO2 concentrations. To do this, 6 ml of nitrogen (UHP Airgas) was injected into the vial to displace 6 ml of the headspace, and this aliquot was injected onto the gas chromatograph described above. Vials never experienced an overpressure of gas. Sample areas were compared to certified standards (Airgas, 30 ppm CH4, 2000 ppm CO2) and converted to ppmv in the headspace. Analytical precision was 3%. CH4 concentrations were averaged between the three triplicates and reported as an average +/− standard deviation. Concentrations were then converted to cumulative production for CH4 and CO2 and reported as µmol CH4 or CO2 carbon per gram dry weight (µmol CH4−or CO2−C/gdw) and plotted against incubation time. To calculate a rate of CH4 generation on a per carbon basis, a line was fitted to the linear portion of the cumulative production time-series and converted to a per carbon basis by multiplying by the %TOC measured for each depth. It should be noted that while CO2 concentrations were measured in the killed controls, the values were expected to be 0 since base drives gaseous CO2 into the water phase. The results are still shown as a way to verify our basic assumptions.
Modeling Diffusion
When the sediment plugs are first placed in the vials and flushed with N2 gas, it is possible that CH4 dissolved in the sediment interstial spaces will diffuse out and be measured as an increase in CH4 concentrations over time due to the concentration gradient present at the beginning of the incubations. This theoretical diffusion can be estimated using a one-dimension model to calculate how much CH4 could diffuse from the sediment plug in the incubation vials to the headspace over the time of the incubations (Lapham et al., 2014). We used a diffusion coefficient of 8.6 × 10⁻⁶ cm2/sec for CH4, which is corrected for temperature, salinity, and pressure in the vials (Riley and Skirrow, 1975). We estimated salinity based on the Cl− concentrations reported in Organic Matter, Sulfate (SO42−) and Chloride (Cl−) Contents. The starting CH4 concentration was the in situ value we measured from the triplicate sub-sections (In situ CH4Content). The results of this model will thus be an overestimate, since CH4 was most likely lost in the vials during headspace flushing. We assumed the distance for diffusion was 3 cm, the distance in the vials.
Results
Physical and Chemical Parameters of in situ Permafrost
Cored sediments consisted of bedded glaciofluvial sands with interbeds of gravel and silt, thought to have been deposited during the waning stages of the late Wisconsinan glaciation (∼12,000 years before present; Rampton, 1988). The stratigraphy consisted of a near surface organic-rich interval (containing rootlets) that extended to ∼60 cm depth, ice-bonded fine sands with occasional pebble and silt-rich layers and intervals of massive ice with >80% excess ice by volume (Figure 4B). Thermistor data shows that sediment temperature fluctuates annually to a depth of ∼11.5 m, with a mean annual ground surface temperature of approximately −5°C. The active layer is interpreted to be within the upper 0.6 m based on where the maximum temperature crosses 0°C (Figure 4C). Similar ground temperature measurements from a nearby site (∼15 km east of Tuktoyaktuk 69.4736°N, 132.6285°W) carried out in 1995 (Dallimore et al., 1996; Figure 4C), show that mean annual ground temperatures may have increased 3–4°C in the past 25 years.
The in situ sediment physical properties varied with depth (Figure 4D) reflecting changes in the geology at the site (mainly grain size) and ground ice content. Permafrost sediment porosity averaged 0.48 ± 0.09 down core (Figure 4D). Gravimetric water content was ∼1.0 g/gdwt (grams dry weight) near the surface and at ∼2 m, decreased to ∼0.25 for the remainder of the core (Figure 4D). We observed an ice-rich interval at 3.5 m sediment depth (Figure 4B), which corresponded to an increase in both gravimetric water content and porosity. There was no indication of gas bubbles in the ice. Wet bulk density mirrored the other physical parameters (Figure 4D). Compared to unfrozen settings, the permafrost samples had very low bulk densities and high porosities, especially those with elevated ground ice content.
TOC concentrations (given in weight %) in the uppermost surface sample (∼0.6 m deep) was 2% in one replicate and 7% in the other two replicates, indicating heterogeneity of material in the active layer (Figure 5A). TOC then decreased to ∼0.5% by 1 m, exhibited a sub-surface peak at 2.8 m (3%) and decreased again to 0.5% for the remainder of the core. Similar to TOC, DOC concentrations were highest in the surface sample (60 mg/L) and exhibited a sub-surface peak of 25 mg/L at 2.8 m depth (Figure 5A). DOC concentrations remained at 11–17 mg/L for the remainder of the core. Specific UV absorbance SUVA254 values of the DOM throughout the core ranged from 1.3 to 8.9 m−1 L mg−1 (Figure 5A). The values were variable down core with two small sub-surface peaks which corresponded to the highest CH4 values (highest SUVA value of 8.9 ± 2.5 m−1) and the TOC/DOC sub-surface peak (4.3 ± 2.2 m−1 L mg−1).
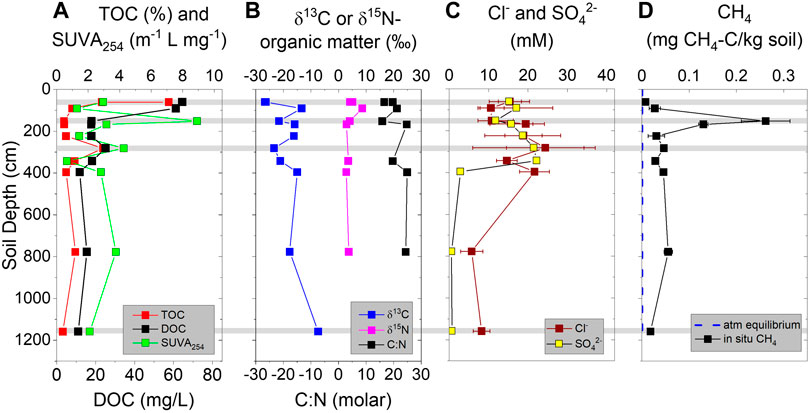
FIGURE 5. Downcore profiles from permafrost core: (A) Total organic carbon (TOC), SUVA254, and dissolved organic carbon (DOC). (B) Stable carbon and nitrogen isotopes of organic matter and C:N ratio. (C) Chloride and sulfate concentrations within thawed permafrost interstitial waters. (D) Methane concentrations (mg methane per kg wet soil) compared to concentrations equilibrated with two ppmv CH4 atmosphere (0.001 mg/kg soil). Gray horizontal bars indicate depths chosen for incubation experiments.
δ13C-TOC values ranged between −26.7 and −7.4‰ and average -18.6 ± 5.9‰ (Figure 5B). The highest δ13C-TOC value of −7.4‰ was found at the deepest depth. δ15N-TON values ranged between 2–5‰ for the whole core with a sub-surface peak of 8.6‰ at ∼1 m. TON concentrations were highest at the surface (0.4%) and decreased to 0.06% at 3.4 m and was undetected at our deepest depth (data not graphed). C:N values ranged between 15–24 for the whole core (Figure 5B). SO42− and Cl− concentrations were between 10 and 20 mM in the upper 3 m with large variability within replicate samples (Figure 5C), likely indicating variable ice concentrations in subsamples. Below 3 m, concentrations decreased to ∼2 mM SO42− and 6 mM Cl−.
CH4 concentrations in the core samples exhibited a sub-surface peak at ∼1.5 m of 0.28 mg CH4 per kg sediment (Figure 5D). Above this sub-surface peak, the two shallowest samples collected within or just below the modern active layer (0.6 and 0.9 m depth) had the lowest CH4 concentrations, despite having the highest TOC values. Beneath the sub-surface peak, CH4 concentrations decreased and became constant at ∼0.03 CH4 per kg sediment down to 11.6 m in the core (Figure 5D).
Incubation Results
Sediment incubations were carried out at four depths (0.6, 1.5, 2.8, and 11.6 m) that had varied in situ geochemistry and physical properties. As shown on Figure 4C, these depths also experience different seasonal permafrost temperature regimes. CH4 concentrations in the killed control treatments slightly increased over time for all the depths except 1.5 m, which decreased over time (data points in Figure 6). When a simple 1-D diffusion model was applied to the incubation results, for all depths except the 1.5 m, the slight increase was explained by simple diffusion of in situ CH4 out of the sediment plug upon incubation set-up (model lines in Figure 6). The results from these controls gave us confidence that any values above those measured in the killed controls could be interpreted as the gross potential for microbial CH4 production stimulated by the incubations.
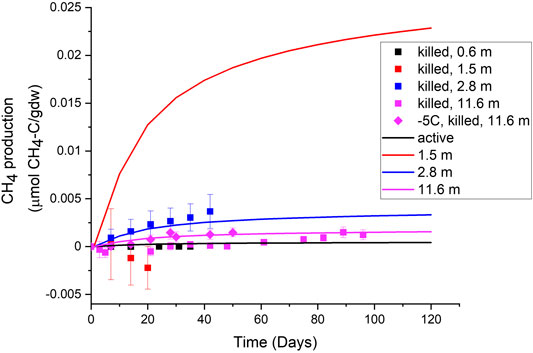
FIGURE 6. Methane production rates in killed controls (symbols), compared to modeled diffusion rates at 5°C starting with measured in situ concentrations (solid lines). The 1.5 m depth diffusion line is much higher because the in situ methane concentrations were also so much higher.
For all depths of the incubations, CH4 and CO2 concentrations increased over time in all treatments (including some of the frozen treatments; Figure 7). The gross production rates were faster at the higher temperatures than at the lower temperatures. The cumulative gross production rates increased linearly at first, indicative of the growth phase, and then plateaued, indicative of sustained production. The active layer incubation (i.e., 0.6 m) had the lowest CH4 production rates of any incubation at +15°C (0.0012 µmol CH4 per gdw, Figure 7A). At −20°C, the rate is 0.000012 µmol CH4 per gdw (Figure 7A). This active layer also had the highest CO2 production rates (Figure 7B), with the CO2:CH4 ratio reaching 10,000 at the end of the experiment (Figure 7C). The incubation of sediment with the highest in situ CH4 concentration (i.e., 1.5 m) exhibited the highest gross CH4 production rates of any incubation (0.15 µmol CH4 per gdw at 5°C and 0.03 µmol CH4 per gdw at −5°C; Figure 7D). The CO2 production rates in this sample were similar for the +5°C and −5°C treatments at about 3 µmol CO2 per gdw (Figure 7E), resulting in CO2:CH4 ratios less than 100 for all temperatures and a pattern where ratios were higher at the colder temperatures (Figure 7F). The incubation of sediment from the sub-surface organic carbon peak (i.e., 2.8 m) had the highest CO2 production rates at frozen temperatures compared to the other depths (averaging µmol CO2 per gdw at all temperatures, even in the 15°C treatment; Figure 7H). Gross potential CH4 production rates reached as high as 0.024 µmol CH4 per gdw at +15°C in this sample (Figure 7G). Rates decreased with colder temperatures but remained above the killed controls even at −20°C. The CO2:CH4 ratios in this sample showed a similar pattern as the above depth but were an order of magnitude higher (Figure 7I). In the deepest permafrost sediment incubation (i.e., 11.6 m), gross potential rates of CH4 production were near the diffusion line for the frozen temperatures, indicating no microbial production, and there was a ∼25 days lag phase before rates increased to 0.015 µmol CH4 per gdw in the 5°C incubation (Figure 7J). CO2 production rates were the lowest observed in the incubations (Figure 7K), resulting in CO2:CH4 ratios that showed no pattern with time (Figure 7L) and that were negative at times (data not shown). Negative ratios mean that CH4 production exceeded CO2 production.
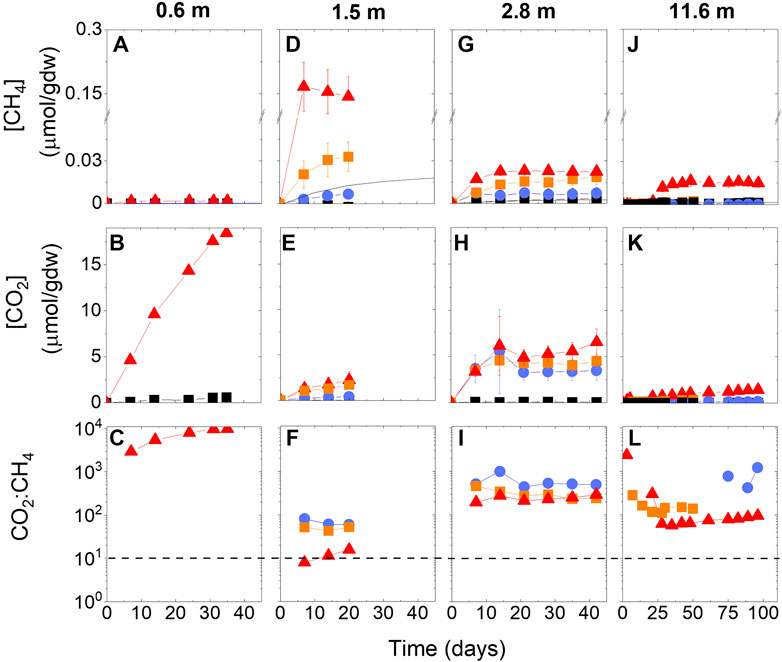
FIGURE 7. Cumulative CH4 and CO2 production rates and CO2:CH4 ratios from incubations at (A–C) 0.6 m, (D–F) 1.5 m, (G–I) 2.8 m, and (J–L) 11.6 m. Red triangles denote warmest treatment (either +15°C or +5°C), orange squares are −5°C, and blue circles are −20°C. Black squares are average of all killed controls across all temperatures. Black solid line in panel D denotes production rates as calculated from diffusion. Note x-axis for 11.6 m depth is different than other depths and y-axis scale is broken in CH4 production rates to show all data on one scale. The black dashed line in CO2:CH4 panels shows the 1:1 line. Error bars are standard deviation of triplicates.
Discussion
The main objective of this study was to assess microbial greenhouse gas dynamics associated with a permafrost type section that is presently experiencing the effects of climate warming and coastal erosion. The motivation derives from the fact that release of these gases may accelerate the pace of global warming, but the magnitude of gas release from settings typical of the geology of the Beaufort Sea coast is not well constrained. We carried out the study on a permafrost core drilled on Tuktoyaktuk Island, where increased ground temperatures are documented. The site also experiences event driven, coastal erosion primarily by undercutting of an eroding cliff face, which exposes frozen permafrost to relatively warm air temperatures resulting in rapid thawing. At current erosion rates, the core site presented here could be exposed to the sea in ∼12 years. Our experiments document significant potential for microbially-mediated greenhouse gas release under still-frozen conditions and after thawing (Figure 7). Here we discuss the implications of the in situ conditions of the permafrost and for microbial processes to occur in frozen and unfrozen soils.
Geochemistry of Carbon Reservoir
While most of the permafrost sediment depths analyzed had relatively low organic carbon content (TOC: ∼0.5 weight%; DOC: ∼10 mg/L), as might normally be expected for glaciofluvial sediments, we observed some depths with high TOC (2–7 weight%) and DOC (20–60 mg/L) contents (Figure 5). The active layer had the highest TOC and DOC concentrations, and a secondary peak was observed at ∼3 m depth. This depth may represent an organic-rich (not peat) paleo-active layer formed under warmer temperature conditions in the past. Indeed, other studies conducted in this area have documented the presence of older and deeper organic horizons thought to have formed during the Hypsithermal warm period in the early Holocene (Burn, 1997).
The permafrost organic matter observed in the core samples suggested possible terrestrial and marine sources, based on the 13C and 15N signatures of organic matter (Figure 5B). Terrestrial ecosystems (dominated by C3 plants) typically have 13C values that range from −23 to −34‰, whereas marine systems range from −10 to −25‰ (Ehleringer et al., 1993). Values measured in our core are slightly enriched in 13C, compared to sediments from the Lena River Delta ranged from −29 to −26‰ (Knoblauch et al., 2013). The 13C-organic matter in the surface samples was −26‰, suggesting a predominantly C3 terrestrial source, whereas more positive 13C values of deeper layers indicate mixed C3 terrestrial and marine sources. The 13C-organic matter value of −7.4‰ for the deepest layer does not reflect either of these sources. Such heavy values have been measured when the terrestrial system is dominated by C4 plants, which are typically tropical and warm-temperate plants. Certainly tropical plants are not supported at this site; however, unconsolidated Tertiary strata, which were deposited during much warmer climate conditions, do occur at shallow depth in the Tuktoyaktuk area, and reworked Tertiary pollen is often seen in Quaternary sediments (Ritchie, 1974). This may be a possible source for the enriched isotope values observed in this sample.
The stable isotope values give us a bulk view of the organic matter available to the microbial community, but microorganisms typically access carbon from the dissolved pool. Therefore, to compliment the stable isotope work, we also assessed the quality of the DOM with optical methods (Supplementary Material). We focus the discussion on SUVA254, which relates to the aromatic content of the molecules in the dissolved pool (Traina et al., 1990; Weishaar et al., 2003; Fellman et al., 2008). We recognize that this parameter has limitations in that there is no way to distinguish between a low concentration of highly absorbing material and a high concentration of low absorbing material. Furthermore, permafrost pore waters may have a very different chemical composition than the organic matter isolates analyzed in previous studies, so the relationship to DOM aromatic content may be different here. But, as a generalization, the higher the aromatic content, the less “labile” and more “refractory” the organic carbon is for microbial processes. Given the debate in the literature now with such labels as “labile” and “refractory” (Hansell, 2013) we use this measurement here only as an indicator of organic matter quality and not a definitive measurement. The permafrost sediment layer with the highest in situ CH4 concentration (Figure 5A), the highest potential for CH4 production (Figure 7D), and some of the lowest CO2 production potential (Figure 7E), had the highest SUVA254 value (Figure 5A). This indicates that the labile carbon to fuel microbial heterotrophic or fermentative respiration (i.e., producing CO2) is less available at this depth, and that methanogens are likely using more refractory carbon to produce CH4. Likewise, the deeper permafrost sediment layer with a subsurface TOC peak also had relatively high SUVA254 values (Figure 5A), the second highest CH4 production potential (Figure 7G), and modest CO2 production potential (Figure 7H). By contrast, the sediment from the active layer had low SUVA254 values (i.e., was more labile) and the lowest and highest CH4 and CO2 production potentials, respectively (Figures 7A, B). Overall, these patterns support the observation that permafrost carbon quality, in addition to quantity, plays an important role in determining greenhouse gas production potential (Schädel et al., 2014; Kuhry et al., 2020).
In situ CH4 Present in Permafrost and Potential for Atmospheric Release
We detected in situ CH4 in all frozen core samples with values ranging from 0.03 to 0.28 mg CH4 per kg sediment (Figure 5A). The highest value was measured in the organic-rich layer just below the modern active layer. These values are consistent with published values from other permafrost settings with low organic contents. For example, Alaskan discontinuous permafrost sediments contained ∼0.001–22 mg CH4 per kg sediment (Kvenvolden and Lorensen, 1993), and silty sediments with ground ice near Prudhoe Bay, Alaska, had 0.2–11 mg CH4 per kg sediment (Rasmussen et al., 1993). Higher values have been observed in organic-rich active layer sediments with lacustrine vegetation (15 mg CH4 per kg sediment (Rivkin, 1998); in the active layer of a permafrost floodplain and within a polygon center (6.5 and 8,656 mg CH4 per kg sediment, respectively Ganzert et al. (2007)), and Lena Delta permafrost setting (4.8 mg CH4 per kg sediment (Wagner et al., 2007)). Our study adds to the body of work on this topic and demonstrates that in situ CH4 is common in Arctic permafrost in a variety of sediments and geologic settings.
In addition to the concentration of in situ CH4 in permafrost, the state of CH4 (i.e., as bubbles trapped in ice, free gas in the sediment, and/or dissolved) is important when evaluating the potential for greenhouse gas release from these environments and for understanding operative geologic processes. Given that all of our core samples were collected in the winter when ground temperatures were well below −5°C, and that they were stored at −20°C until testing, we envisage that the CH4 detected was residing within a heterogeneous matrix consisting of sediment grains (sand, minor silt and some organics), pore ice and possibly a very small fraction of liquid water [even in sand, small amounts of unfrozen water can occur at negative temperatures (Watanabe et al., 2011)]. By comparing the in situ ice content (as estimated visually and from gravimetric water content and density determinations) vs. CH4 concentrations, we can estimate if CH4 existed as bubbles within ice. The highest ground ice contents within the samples investigated were within the active layer and at 3.5 m depth (Figure 4D), where the lowest CH4 concentrations were measured (Figure 5D). This indicates that the CH4 is not dominantly residing as bubbles in the ground ice, as coarse-grained sands are almost completely frozen at temperatures slightly below 0°C (Williams, 1967). Thus, we envisage that a significant fraction of the in situ CH4 may reside within the sediment matrix as free gas, and a small amount dissolved within unfrozen water. While the presence of free gas in permafrost settings is poorly studied, free gas was detected in permafrost research wells in the Mackenzie Delta (Dallimore and Collett, 1995), and has been implicated in the formation of permafrost craters in coastal settings in Siberia (Leibman et al., 2014). Likewise, some active geomorphic features may be associated with free gas release (Mackay, 1965). As finer-grained, organic rich sediments may be more conducive to free gas occurrence, additional studies are needed to constrain the physics and chemistry of CH4 residing with the pore space of permafrost sediments.
We envisage that a number of coastal processes could cause direct release to the atmosphere of the in situ CH4 observed in the Tuktoyaktuk Island permafrost. Tuktoyaktuk Island is undergoing rates of coastal erosion of ∼2.5 m per year, mostly during storm events which is significant when compared to other Arctic coastal settings (Lantuit et al., 2012). These storms can cause erosional niche formation creating block failures (Figure 8 upper left photo). When these events occur, the in situ CH4 can be immediately exposed to the atmosphere on the cliff faces. The permafrost away from the cliff faces can also rapidly thaw over a period of hours or days. Because the thawing is very rapid we speculate that the in situ CH4 could be released without being oxidized to form CO2. At Tuktoyaktuk Island coast, 6 m of permafrost is exposed on the exposed cliff edge (see Figure 4A). If we assume an average concentration of 0.15 mg CH4 per kg sediment in this upper 6 m, and an erosion rate of 2 m/yr, we estimate an annual CH4 flux rate from the eroding sediments could be ∼3,500 g CH4/yr/km of shoreline. Eroding coastal areas in the Canadian Beaufort Sea comprise at least 1,000 km in length (Solomon and Gareau, 2003; Manson et al., 2019) thus, if similar sediments were encountered elsewhere in the region, there is potential for atmospheric release of 3.5 × 10⁶ g CH4/yr. While this is a relatively small amount compared to the ∼1 × 10¹² g CH4 estimated to be released from the global permafrost reservoir annually (Saunois et al., 2020), it should be noted that the glaciofluvial sediments we have studied from Tuktoyaktuk Island are not particularly organic rich. A full assessment of the potential for release of CH4 to the atmosphere from this process is only possible with further testing of the different types of eroding sediments along the coast. Other eroding sedimentary deposits commonly found along the Beaufort coast include glacial till, lacustrine and deltaic sediments (Rampton, 1988) which may contain higher in situ CH4 concentrations and therefore result in increased atmospheric release from event driven erosion.
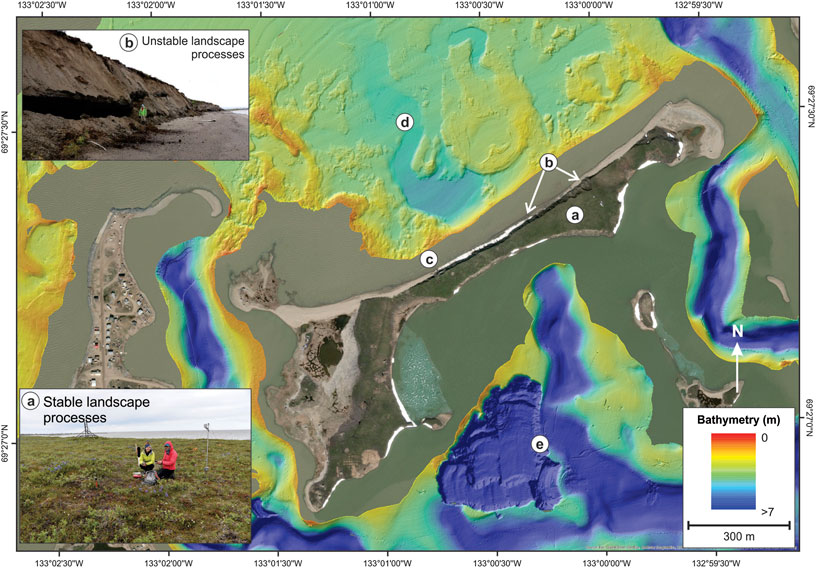
FIGURE 8. Potential biotic and geologic CH4 and CO2 feedbacks for an actively eroding coastline. This map shows Tuktoyaktuk Island currently and four geological settings that could release CH4 and CO2 and induce climate warming. (A) Indicates an area of stable landscape where the release of CH4 and CO2 to the sediment system and atmosphere is from deepening of the active layer and warming of permafrost at depth (lower left inset photo by Caroline Duchesne). (B) Closer to the coast, there are unstable landscape processes where the release of CH4 and CO2 to the atmosphere is from rapid deposition of thawed permafrost caused by coastal erosion and thaw slumps (upper left inset photo by Nicole Couture). (C) In the near shore, release of CH4 and CO2 to the atmosphere is from rapid deposition of thawed permafrost. (D) Offshore processes could involve release of CH4 and CO2 to the sediment system and atmosphere from thawing of seabed and warming of frozen permafrost at depth and (E) eroding materials could also be deposited into deep, anoxic basins to produce CH4 and CO2.
Microbial Greenhouse Gas Production Associated With Warming Ice-Bonded Permafrost
The observation of in situ CH4 in permafrost environments raises the question of how this CH4 was formed and if in situ CH4 concentrations could be increasing in association with warming of the permafrost due to climate change? Our incubation experiments clearly document that microbial activity remediate permafrost organic matter producing CO2 and CH4 with warming under still frozen conditions. Previous studies have documented the presence of viable microorganisms (Ganzert et al., 2007; Jansson and Taş, 2014; Stapel et al., 2016; Altshuler et al., 2017; Margesin and Collins, 2019) and active bacteria (Elberling and Brandt, 2003; Wagner et al., 2007; Mykytczuk et al., 2013) in frozen permafrost. Our incubations support these findings that there is an active, viable population of microorganisms producing CH4 at below freezing temperatures. We can not, however, speculate on the mechanism driving methanogenesis without further experiments with isotope labeled substrates (as done in Rivkina et al., 2004).
In terms of the geothermal setting of the cores from Tuktoyaktuk Island, we note the geothermal environment of the sediments is within the interval that experiences annual seasonal fluctuations in temperatures with warming and cooling that ranges from perhaps >10°C at 1 m depth to only a 1–2°C at 10 m depth. At in situ temperatures, our results demonstrate that CH4 and CO2 is potentially produced when the upper intervals of sediment experience seasonal warming. Indeed the in situ CH4 concentrations we observed likely result from slow but repetitive seasonal formation of biogenic gas, that is then trapped within the ice bonded sediment matrix.
Our experiments may also have implications when considering future climate warming and its impact on in situ greenhouse gas concentrations and geomorphic processes. While the pace of warming of subsurface permafrost is clearly somewhat slower than the pace of atmospheric warming, our work suggests that temperature increases of only a few degrees can enhance activity of the in situ microbial communities, generating greenhouse gases. This creates the potential for build-up of CH4 and CO2 under warming permafrost conditions than might be expected from seasonal temperature variations alone. This points to the potential for subsurface biogenic gas accumulations which are continually being charged or pressurized over time. Such conditions may create the potential for the in situ pressure regime to exceed the confining pressure of the permafrost cover. This in turn could cause the trapped gas to leak to the surface through cracks in the permafrost or even cause more catastrophic pressure release as is inferred for the formation of permafrost craters described in Siberia (Leibman et al., 2014). There is also the potential for the formation of intrapermafrost CH4 gas hydrate within the permafrost interval at depth (Dallimore and Collett, 1995).
Microbial Greenhouse Gas Production Associated With Thawing Ice-Bonded Permafrost
At incubation temperatures above freezing, the amount of CH4 produced in the Tuktoyaktuk Island samples, in terms of moles CH4 per weight sediment or petagrams CH4 per gram carbon (Figure 9) was comparable to rates observed in incubations with sediments from other settings with higher organic carbon contents (Roy Chowdhury et al., 2015; Treat et al., 2015). These results suggest that glaciofluvial sediments found along the coast of the Beaufort Sea, which might not normally be considered as candidates for high greenhouse gas production upon thawing, could be contributing significant amounts of modern microbial greenhouse gases in association with ongoing climate warming. A key consideration for our experiments however is that they were conducted under anaerobic conditions. If sediment processes associated with thawing change the in situ biogeochemical environment from anaerobic to aerobic conditions, of course there is potential for oxidation of CH4 to form CO2.
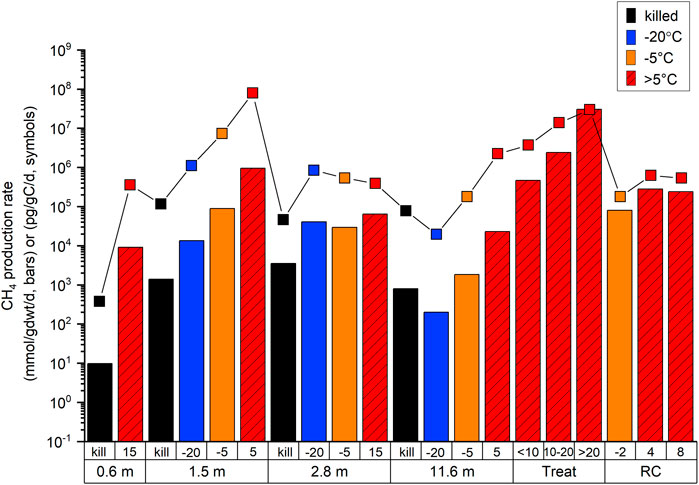
FIGURE 9. Comparison of measured CH4 production rates compared to published literature in two different units: colored bars (mmol CH4/gdwt/d) and black symbols (pg CH4/gC/d). For the colored bars, black represents killed controls, red is >0°C treatments, orange is −5°C treatment, and blue is −20°C treatment. Depths of sediment are given in meters. “Treat” refers to Treat et al., 2015 and “RC” refers to Roy Chowdry et al., 2015.
We anticipate a number of settings, found within a landscape such as Tuktoyaktuk Island, that experience greenhouse gas release from coastal processes. The first, and most widespread setting, is in association with a deepening of the active layer due to atmospheric warming along the coast (Figure 8A). In this case, CH4 and CO2 can be generated under anaerobic conditions similar to our experiments at the base of the active layer by microorganisms that already exist within the permafrost but become more active under thawed conditions. In addition, if new labile organic material thaws at the base of the active layer, there is potential for new microbial communities to become active and generate CH4. If CH4 and CO2 concentrations at the base of the active layer are substantive there is potential for free gas migration through the active layer quickly without oxidation. However, as observed in other settings, it is likely that at least some of the CH4 is oxidized to CO2 in the upper portion of the active layer which is likely to be oxygenated (Oh et al., 2020 and references within). The second candidate geologic setting relate to the possible mobility of organic material through an unstable landscape as it thaws and is re-deposited in new sedimentary environments (Figures 8B–E). At Tuktoyaktuk Island, this might include terrestrial landslide deposits, beach sediments or shallow nearshore settings on the north side of the Island, which are in oxygenated waters. Our experiments, conducted under anoxic conditions do not directly address this environment, however new studies (Tanski et al., 2019) are beginning to better characterize these conditions demonstrating potential for CO2 production and potential atmospheric release. However, we note that in Tuktoyaktuk Harbor on the south side of Tuktoyaktuk Island, deep water pockets allow for anoxic conditions to form year round creating conditions similar to our incubation experiments (Figure 8E; Lawrence et al., 1993). Local CH4 and CO2 production may possibly be quite vigorous in this setting. And finally, as the coastal setting is inundated with sea level rise, organic matter can accumulate in the offshore setting and host similar microbial processes to release CH4 and CO2 to the overlying waters (Figure 8D).
Conclusion and Future Directions
At a broader scale, this study emphasizes the value of characterizing in situ geology and biogeochemistry for understanding greenhouse gas dynamics, as highlighted by others recently (Barbier et al., 2012). Permafrost sediments are thought to contain an enormous amount of trapped carbon that could be converted to CH4 and CO2 by microbial activity. In fact, many previous incubation studies reveal significant CH4 production when permafrost is thawed, as might be expected in the case of a deepening active layer. However, current global CH4 budgets consider terrestrial permafrost sediments only as a small source of atmospheric CH4 release (∼1 Tg/yr; Saunois et al., 2020). This is in part because CH4 can be consumed within the oxygenated portion of the active layer. Our study characterizes a field example that is experiencing atmospheric warming and rapid coastal erosion and reveals that there is considerable potential for the greenhouse gas generation under anoxic conditions, even with modest concentrations of organic carbon. We envisage that these gases within the frozen permafrost could be rapidly released to the atmosphere when episodic coast erosion causes sediment block failures. There is also potential for the generation of free gas within the permafrost that could trigger unique permafrost processes or indeed migrate to the surface where it could be released to the atmosphere. While the observation of CH4 dynamics in frozen sediments needs to be verified across a variety of permafrost sediment types, there are several biogeochemical questions it opens: How are microbes functioning at freezing temperatures? Are there microzones of liquid water within the pore spaces that are enriched in active microbes? What organic matter source is being used? Future work could characterize the small organic acids that could be used in CH4 and CO2 production; along with the total DOM pool change over the time scale of an incubation.
Our study also highlights the need for more characterization of in situ CH4 and CO2 concentrations and production potential within permafrost sediments, especially in the coastal zone where such sediments could soon erode into the ocean. Notably, in our experiments, microbial degradation of organic matter to CO2 was generally 100–1,000 times higher than CH4 production, to make the CO2 release from these warming soils also a significant component of the greenhouse gas potential. In order to move toward a better constraint on the potential release rates in global models, in situ greenhouse gas concentrations within permafrost sediments across a variety of geologically distinct areas is necessary. Currently, the global CH4 model (Saunois et al., 2020) uses the potential release of CH4 from permafrost sediments from very few actual measurements (Kvenvolden and Lorensen, 1993; Rasmussen et al., 1993). By measuring more environments, and even repeating measurements in these early papers, we can confirm this flux currently estimated in global budgets.
Data Availability Statement
The datasets presented in this study can be found in online repositories. The names of the repository/repositories and accession number(s) can be found below: https://arcticdata.io/catalog/view/doi:10.18739/A2MP4VN5F.
Ethics Statement
Written informed consent was obtained from the individual(s) for the publication of any potentially identifiable images or data included in this article.
Author Contributions
LL and SD conceived of the experiments, planned field work, wrote the initial draft of the paper, and interpreted interdisciplinary data; CM and PF carried out field work to obtain samples; LH and BC carried out incubation experiments; CM provided stable isotope data and interpretation; LP and MG provided DOC characterization data and interpretation; and LL supervised and validated all geochemical data analyzed. MC provided high quality maps and figures; CD collected in situ temperature profile; and LL, BO, and SD acquired funding for the project. All authors contributed to the manuscript revision, read and approved the submitted version.
Funding
We thank our funding sources: Public Safety Geoscience Program, Geological Survey of Canada, Natural Resources Canada; Beaufort Regional Strategic Environment Assessment, Indigenous and Northern Affairs Canada (AGR-4935-ILOA-INAC); Maryland Sea Grant REU program (NSF grant OCE-1262374); and U.S. National Science Foundation grants PLR-1417128 (LLL) and PLR-1416961 (BNO).
Conflict of Interest
The authors declare that the research was conducted in the absence of any commercial or financial relationships that could be constructed as a potential conflict of interest.
The handling editor is currently organizing a Research Topic with one of the authors SRD.
Acknowledgments
We thank the staff of Midnight Sun drilling who conducted the drilling and the Hamlet of Tuktoyaktuk who assisted with logistics, Dustin Whalen who helped with community liaison and field logistics, and Edwin Amos and Joel McAlister (Aurora Research Institute) who assisted with lab activities in Inuvik and sample storage and transport. Special thanks also goes to the contractors in Tuktoyaktuk who helped remedy a small incident that happened when the drill rig arrived in the community. We thank Kathy Kelsey and Matthias Fuchs who provided insightful comments to improve this manuscript. The field work was conducted under science license #16286 issued by the Government of Northwest Territories, http://data.nwtresearch.com/Scientific/16286. This is UMCES contribution #5927.
Supplementary Material
The Supplementary Material for this article can be found online at: https://www.frontiersin.org/articles/10.3389/feart.2020.582103/full#supplementary-material.
References
Altshuler, I., Whyte, L., and Doordial, J. (2017). “Chapter 8, microbial life in permafrost,” in Psychrophiles: from biodiversity to biotechnology. Editor R. Margesin (Springer International Publishing), 153–179.
AMAP (2019). AMAP climate change update 2019: an update to key findings of snow, water, ice and permafrost in the arctic (SWIPA) 2017. Arctic monitoring and assessment programme (AMAP). Oslo, Norway. Available at: https://www.amap.no/documents/download/3295/inline (Accessed May 6 2019).
Barbier, B. A., Dziduch, I., Liebner, S., Ganzert, L., Lantuit, H., Pollard, W., et al. (2012). Methane-cycling communities in a permafrost-affected soil on Herschel Island, Western Canadian Arctic: active layer profiling of mcrA and pmoA genes. FEMS Microbiol. Ecol. 82, 287–302. 10.1111/j.1574-6941.2012.01332.x
Biskaborn, B. K., Smith, S. L., Noetzli, J., Matthes, H., Vieira, G., Streletskiy, D. A., et al. (2019). Permafrost is warming at a global scale. Nat. Commun. 10, 1–11. 10.1038/s41467-018-08240-4
Burn, C. R. (1997). Cryostratigraphy, paleogeography, and climate change during the early Holocene warm interval, western Arctic coast, Canada. Can. J. Earth Sci. 34, 912–925. 10.1139/e17-076
E. Bush, and D. S. Lemmen (Editors) (2019). Canada’s changing climate report. Ottawa, ON: Government of Canada Available at: https://www.nrcan.gc.ca/sites/www.nrcan.gc.ca/files/energy/Climate-change/pdf/CCCR_FULLREPORT-EN-FINAL.pdf (Accessed July 29 2020).
Christensen, J. H., Krishna Kumar, K., Aldrian, E., An, S.-I., Cavalcanti, I. F. A., De Castro, M., et al. (2013). “Climate phenomena and their relevance for future regional climate change,” in Climate change 2013: the physical science basis. Contribution of working group I to the fifth assessment report of the intergovernmental panel on climate change. Editors T. F. Stocker, D. in, G.-K. Plattner, M. Tignor, S. K. Allen, J. Boschunget al. (Cambridge: Cambridge University Press), 1585.
Dallimore, S. R., and Collett, T. S. (1995). Intrapermafrost gas hydrates from a deep core hole in the Mackenzie Delta, Northwest Territories. Canada. Geology. 23, 527–530. 10.1130/0091-7613(1995)023<0527:IGHFAD>2.3.CO;2
Dallimore, S. R., Nixon, F. M., Egginton, P. A., and Bisson, J. G. (1996). Deep-seated creep of massive gound ice, Tuktoyaktuk, NWT. Permafr. Periglac. Process. 7, 337–347. 10.1002/(SICI)1099-1530(199610)7:4<337::AID-PPP232>3.0.CO;2-3
Ehleringer, J. R., Hall, A. E., and Farquhar, G. D. (1993). Stable isotopes and plant carbon/water relations. San Diego, CA: Academic Press.
Elberling, B., and Brandt, K. K. (2003). Uncoupling of microbial CO2 production and release in frozen soil and its implications for field studies of arctic C cycling. Soil Biol. Biochem. 35, 263–272. 10.1016/S0038-0717(02)00258-4
Fellman, J. B., D’Amore, D. V., Hood, E., and Boone, R. D. (2008). Fluorescence characteristics and biodegradability of dissolved organic matter in forest and wetland soils from coastal temperate watersheds in southeast Alaska. Biogeochemistry. 88, 169–184. 10.1007/s10533-008-9203-x
Ganzert, L., Jurgens, G., Munster, U., and Wagner, D. (2007). Methanogenic communities in permafrost-affected soils of the Laptev Sea coast, Siberian Arctic, characterized by 16S rRNA gene fingerprints. FEMS Microbiol. Ecol. 59, 476–488. 10.1111/j.1574-6941.2006.00205.x
Gilichinsky, D., Rivkina, E., Bakermans, C., Shcherbakova, V., Petrovskaya, L., Ozerskaya, S., et al. (2005). Biodiversity of cryopegs in permafrost. FEMS Microbiol. Ecol. 53, 117–128. 10.1016/j.femsec.2005.02.003
GISTEMP (2019). Version 4. GISS surface temperature analysis (GISTEMP) [Online]. Available at: https://data.giss.nasa.gov/gistemp/ (Accessed February 27 2020).
Gruben, M. (2018). “On behalf of councillors of the Hamlet of Tuktoyaktuk: a Mayor’s assessment of a community threatened by coastal erosion,” in Arctic Net. Ottawa, Canada.
Hansell, D. (2013). Recalcitrant dissolved organic carbon fractions. Annual Review in Marine Science. 5, 421–445.
Hansen, J., Ruedy, R., Sato, M., and Lo, K. (2010). Global surface temperature change. Rev. Geophys. 48, 1–29. 10.1029/2010RG000345
Hu, K., Issler, D. R., Chen, Z., and Brent, T. A. (2013). Open file 6956. Permafrost investigation by well logs, and seismic velocity and repeated shallow temperature surveys, Beaufort-Mackenzie Basin. Canada: Geological Survey of Canada Available at: https://doi.org/10.4095/293120 (Accessed June 18 2013).
Hultman, J., Waldrop, M. P., Mackelprang, R., David, M. M., Mcfarland, J., Blazewicz, S. J., et al. (2015). Multi-omics of permafrost, active layer and thermokarst bog soil microbiomes. Nature. 521, 208–212. 10.1038/nature14238
Hynes, S., Solomon, S. M., and Whalen, D. (2014). Open file report 7685. GIS compilation of coastline variability spanning 60 years in the Mackenzie Delta and Tuktoyaktuk in the Beaufort Sea. Ottawa: Geological Survey of Canada, 7. Available at: https://doi.org/10.4095/295579 (Accessed December 12 2014).
Jansson, J. K., and Taş, N. (2014). The microbial ecology of permafrost. Nat. Rev. Microbiol. 12, 414–425. 10.1038/nrmicro3262
J. P. Riley, and G. Skirrow (Editors) (1975). Chemical oceanography. 2nd edition (New York: Academic Press), Vol. 4.
Knoblauch, C., Beer, C., Liebner, S., Grigoriev, M. N., and Pfeiffer, E.-M. (2018). Methane production as key to the greenhouse gas budget of thawing permafrost. Nat. Clim. Change. 8, 309–312. 10.1038/s41558-018-0095-z
Knoblauch, C., Beer, C., Sosnin, A., Wagner, D., and Pfeiffer, E.-M. (2013). Predicting long-term carbon mineralization and trace gas production from thawing permafrost of Northeast Siberia. Global Change Biol. 19, 1160–1172. 10.1111/gcb.12116
Kuhry, P., Bárta, J., Blok, D., Elberling, B., Faucherre, S., Hugelius, G., et al. (2020). Lability classification of soil organic matter in the northern permafrost region. Biogeosciences. 17, 361–379. 10.5194/bg-17-361-2020
Kvenvolden, K. A., and Lorensen, T. D. (1993). Methane in permafrost—Preliminary results from coring at Fairbanks, Alaska. Chemosphere. 26, 609–616. doi:10.1016/0045-6535(93)90446-C
Lantuit, H., Overduin, P. P., Couture, N., Wetterich, S., Aré, F., Atkinson, D., et al. (2012). The arctic coastal dynamics database: a new classification scheme and statistics on arctic permafrost coastlines. Estuar. Coast. 35, 383–400. 10.1007/s12237-010-9362-6
Lapham, L. L., Chanton, J. P., Martens, C. S., Sleeper, K., and Woolsey, J. R. (2008). Microbial activity in surficial sediments overlying acoustic wipe-out zones at a Gulf of Mexico cold seep. Geochem. Geophys. Geosyst. 9, Q06001. doi:06010.01029/02008GC001944
Lapham, L. L., Wilson, R. M., Macdonald, I. R., and Chanton, J. P. (2014). Gas hydrate dissolution rates quantified with laboratory and seafloor experiments. Geochem. Cosmochim. Acta. 125, 492–503. 10.1016/j.gca.2013.10.030
Lawrence, M. J., Bergmann, M. A., Hopky, G. E., and Chiperzak, D. B. (1993). Report No.: 859. NOGAP [northern Oil and gas program] B. 2; Chemical data from Tuktoyaktuk Harbour and mason Bay, 1984 to 1988. Winnipeg, MB: Central and Arctic Region Available at: https://waves-vagues.dfo-mpo.gc.ca/Library/149492.pdf (Accessed 1993).
Leibman, M. O., Kizyakov, A. I., Plekhanov, A. V., and Streletskaya, I. D. (2014). New permafrost feature- Deep crater in central Yamal (West Siberia, Russia) as a reponse to local climate fluctuations. Geography Environ. Sustain. 7, 68–79. 10.15356/2071-9388_04v07_2014_05
Lenssen, N., Schmidt, G., Hansen, J., Menne, M., Persin, A., Ruedy, R., et al. (2019). Improvements in the GISTEMP uncertainty model. J. Geophys. Res. Atmos. 124, 6307–6326. 10.1029/2018JD029522
Mackay, J. R., and Dallimore, S. R. (1992). Massive ice of the Tuktoyaktuk area, western Arctic coast, Canada. Can. J. Earth Sci. 29, 1235–1249. 10.1139/e92-099
Mackay, J. R. (1965). Gas-domed mounds in permafrost, Kendall Island, N.W.T. Geogr. Bull. 7, 105–115.
Magen, C., Lapham, L. L., Pohlman, J., Marshall, K., Bossman, S., and Chanton, J. P. (2014). A simple headspace equilibration method for measuring dissolved methane. Limnol Oceanogr. Methods. 12, 637–650. 10.4319/lom.2014.12.637
Manson, G. K., Couture, N. J., and James, T. S. (2019). Open File 8551. CanCoast 2.0: data and indices to describe the sensitivity of Canada's marine coasts to changing climate. Canada: Geological Survey of Canada Available at: https://doi.org/10.4095/314669 (Accessed June 5 2019).
Manson, G. K., and Solomon, S. M. (2007). Past and future forcing of Beaufort Sea coastal change. Atmos.-Ocean. 45, 107–122. 10.3137/ao.450204
Margesin, R., and Collins, T. (2019). Microbial ecology of the cryosphere (glacial and permafrost habitats): current knowledge. Appl. Microbiol. Biotechnol. 103, 2537–2549. 10.1007/s00253-019-09631-3
Murphy, K. R., Stedmon, C. A., Graeber, D., and Bro, R. (2013). Fluorescence spectroscopy and multi-way techniques. PARAFAC. Anal. Methods. 5, 6557–6566. 10.1039/c3ay41160e
Mykytczuk, N. C., Foote, S. J., Omelon, C. R., Southam, G., Greer, C. W., and Whyte, L. G. (2013). Bacterial growth at −15 °C; molecular insights from the permafrost bacterium Planococcus halocryophilus Or1. ISME J. 7, 1211–1226. 10.1038/ismej.2013.8
Nikrad, M. P., Kerkhof, L. J., and Hӓggblom, M. M. (2016). The subzero microbiome: microbial activity in frozen and thawing soils. FEMS Microbiol. Ecol. 92, fiw081. 10.1093/femsec/fiw081
Oh, Y., Zhuang, Q., Liu, L., Welp, L. R., Lau, M. C. Y., Onstott, T. C., et al. (2020). Reduced net methane emissions due to microbial methane oxidation in a warmer Arctic. Nat. Clim. Change. 10, 317–321. 10.1038/s41558-020-0734-z
Rampton, V. N. (1988). Memoir 423. Quaternary geology of the Tuktoyaktuk Coastlands, Northwest Territories. Canada: Geological Survey of Canada Available at: https://doi.org/10.4095/126937.98 (Accessed 1988).
Rasmussen, R. A., Khalil, M. a. K., and Moraes, F. (1993). Permafrost methane content: 1. experimental data from sites in northern Alaska. Chemosphere. 26, 591–594. doi:10.1016/0045-6535(93)90444-A
Ritchie, J. C. (1974). Modern pollen assemblages near the arctic tree line, Mackenzie Delta region, Northwest Territories. Can. J. Bot. 52, 381–396. 10.1139/b74-050
Rivkin, F. M. (1998). Release of methane from permafrost as a result of global warming and other disturbances. Polar Geogr. 22, 105–118. 10.1080/10889379809377640
Rivkina, E., Laurinavichius, K., Mcgrath, J., Tiedje, J. M., Shcherbakova, V., and Gilichinsky, D. (2004). Microbial life in permafrost. Adv. Space Res. 33, 1215–1221. doi:10.1016/j.asr.2003.06.024
Rivkina, E., Shcherbakova, V., Laurinavichius, K., Petrovskaya, L., Krivushin, K., Kraev, G., et al. (2007). Biogeochemistry of methane and methanogenic archaea in permafrost. FEMS Microbiol. Ecol. 61, 1–15. 10.1111/j.1574-6941.2007.00315.x
Romanovsky, V. E., and Osterkamp, T. E. (2000). Effects of unfrozen water on heat and mass transport processes in the active layer and permafrost. Permafr. Periglac. Process. 11, 219–239. 10.1002/1099-1530(200007/09)11:3<219::AID-PPP352>3.0.CO;2-7
Roy Chowdhury, T., Herndon, E. M., Phelps, T. J., Elias, D. A., Gu, B., Liang, L., et al. (2015). Stoichiometry and temperature sensitivity of methanogenesis and CO2 production from saturated polygonal tundra in Barrow, Alaska. Global Change Biol. 21, 727–737. doi:10.1111/gcb.12762
Saunois, M., Stavert, A. R., Poulter, B., Bousquet, P., Canadell, J. G., Jackson, R. B., et al. (2020). The global methane budget 2000–2017. Earth Syst. Sci. Data. 12, 1561–1623. 10.5194/essd-12-1561-2020
Schädel, C., Bader, M. K.-F., Schuur, E. A. G., Biasi, C., Bracho, R., Capek, P., et al. (2016). Potential carbon emissions dominated by carbon dioxide from thawed permafrost soils. Nat. Clim. Change. 6, 950–953. 10.1038/nclimate3054
Schädel, C., Schuur, E. A. G., Bracho, R., Elberling, B., Knoblauch, C., Lee, H., et al. (2014). Circumpolar assessment of permafrost C quality and its vulnerability over time using long-term incubation data. Global Change Biol. 20, 641–652. 10.1111/gcb.12417
Solomon, S., and Gareau, P. (2003). “Beaufort Sea coastal mapping and the development of an erosion hazard index,” in Proceedings of the 8th international conference on permafrost, Zurich, Switerland, July 21–25, 2003, 1091–1096. Available at: https://www.arlis.org/docs/vol1/ICOP/55700698/Pdf/Chapter_191.pdf (Accessed 2003).
Stapel, J. G., Schirrmeister, L., Overduin, P. P., Wetterich, S., Strauss, J., Horsfield, B., et al. (2016). Microbial lipid signatures and substrate potential of organic matter in permafrost deposits: implications for future greenhouse gas production. J. Geophys. Res. Biogeosci. 121, 2652–2666. 10.1002/2016JG003483
Statistics Canada (2017). Catalogue no.: 98-316-X2016001. Tuktoyaktuk, HAM [census subdivision], Northwest Territories and Northwest Territories [territory] (table). Census profile. 2016 census. (Ottawa, Canada: Statistics Canada). Available at: https://www12.statcan.gc.ca/census-recensement/2016/dp-pd/prof/index (Accessed February 8 2017).
Stedmon, C. A., and Bro, R. (2008). Characterizing dissolved organic matter fluorescence with parallel factor analysis: a tutorial. Limnol Oceanogr. Methods. 6, 572–579. doi:10.4319/lom.2008.6.572
Tanski, G., Wagner, D., Knoblauch, C., Fritz, M., Sachs, T., and Lantuit, H. (2019). Rapid CO2 release from eroding permafrost in seawater. Geophys. Res. Lett. 46, 11244–11252. 10.1029/2019GL084303
Traina, S. J., Novak, J., and Smeck, N. E. (1990). An ultraviolet absorbance method of estimating the percent aromatic carbon content of humic acids. J. Environ. Qual. 19, 151–153. 10.2134/jeq1990.00472425001900010023x
Treat, C. C., Natali, S. M., Ernakovich, J., Iversen, C. M., Lubascu, M., Mcguire, A. D., et al. (2015). A pan-arctic synthesis of CH4 and CO2 production from anoxic soil incubations. Global Change Biol. 21, 2787–2803. 10.1111/gcb.12875
Treat, C. C., Wollheim, W. M., Varner, R. K., Grandy, A. S., Talbot, J., and Frolking, S. (2014). Temperature and peat type control CO2 and CH4 production in Alaskan permafrost peats. Global Change Biol. 20, 2674–2686. 10.1111/gcb.12572
Turetsky, M. R., Abbott, B. W., Jones, M. C., Anthony, K. W., Olefeldt, D., Schuur, E. A. G., et al. (2020). Carbon release through abrupt permafrost thaw. Nat. Geosci. 13, 138–143. 10.1038/s41561-019-0526-0
Wagner, D., Gattinger, A., Embacher, A., Pfeiffer, E.-M., Schloter, M., and Lipski, A. (2007). Methanogenic activity and biomass in Holocene permafrost deposits of the Lena Delta, Siberian Arctic and its implication for the global methane budget. Global Change Biol. 13, 1089–1099. 10.1111/j.1365-2486.2007.01331.x
Watanabe, K., Kito, T., Wake, T., and Sakai, M. (2011). Freezing experiments on unsaturated sand, loam and silt loam. Ann. Glaciol. 52, 37–43. doi:10.3189/172756411797252220
Weishaar, J. L., Aiken, G. R., Bergamaschi, B. A., Fram, M. S., Fujii, R., and Moper, K. (2003). Evaluation of specific ultraviolet absorbance as an indicator of the chemical composition and reactivity of dissolved organic carbon. Environ. Sci. Technol. 37, 4702–4708. doi:10.1021/es030360x
Williams, P. J. (1967). DBR-RP-359. Properties and behaviour of freezing soils. Available at: https://publications-cnrc.canada.ca/fra/voir/objet/?id=ff43e8e1-9da1-4bd4-8b13-7ec7fe9ad47d (Accessed July 24 2012).
Zepp, R. G., Sheldon, W. M., and Moran, M. A. (2004). Dissolved organic fluorophores in southeastern U.S. coastal waters: correction method for eliminating Rayleigh and Raman scattering peaks in excitation-emission matrices. Mar. Chem. 89, 15–36. doi:10.1016/j.marchem.2004.02.006
Zingel, A. (2019). Protecting Tuktoyaktuk from coastal erosion could cost $50M, says mayor. Ottawa, Canada: CBC news online Available at: https://www.cbc.ca/news/canada/north/coastal-erosion-tuktoyaktuk-needs-more-money-1.5095115 (Accessed April 12 2019).
Keywords: permafrost, methanogenesis, carbon, thaw, coastal erosion
Citation: Lapham LL, Dallimore SR, Magen C, Henderson LC, Powers LC, Gonsior M, Clark B, Côté M, Fraser P and Orcutt BN (2020) Microbial Greenhouse Gas Dynamics Associated With Warming Coastal Permafrost, Western Canadian Arctic. Front. Earth Sci. 8:582103. doi: 10.3389/feart.2020.582103
Received: 10 July 2020; Accepted: 03 November 2020;
Published: 15 December 2020.
Edited by:
Benjamin M. Jones, University of Alaska Fairbanks, United StatesReviewed by:
Kathy Kelsey, University of Colorado Denver, United StatesMatthias Fuchs, Alfred Wegener Institute Helmholtz Centre for Polar and Marine Research (AWI), Germany
Copyright © 2020 Lapham, Dallimore, Magen, Henderson, Powers, Gonsior, Clark, Côté, Fraser and Orcutt. This is an open-access article distributed under the terms of the Creative Commons Attribution License (CC BY). The use, distribution or reproduction in other forums is permitted, provided the original author(s) and the copyright owner(s) are credited and that the original publication in this journal is cited, in accordance with accepted academic practice. No use, distribution or reproduction is permitted which does not comply with these terms.
*Correspondence: Laura L. Lapham, bGFwaGFtQHVtY2VzLmVkdQ==