 Ibrahima Diba
 Jules Basse1
 Mamadou Ndiaye
 Hamady Ngansou Sabaly
 Moctar Camara
- 1Laboratoire d’Océanographie, des Sciences de l’Environnement et du Climat (LOSEC), Université Assane SECK de Ziguinchor, Ziguinchor, Sénégal
- 2Laboratoire des Sciences de l’Atmosphère et des Océans, UFR SAT Université Gaston Berger de Saint-Louis, Saint-Louis, Sénégal
- 3Université Grenoble Alpes, IRD, CNRS, Grenoble INP, IGE, Grenoble, France
- 4UFHB-IRD Joint International Laboratory of Research on NEXUS Climate, Water, Energy and Agriculture and Development of Climate Services, African Centre of Excellence CCBAD (Climate Change, Biodiversity and Sustainable Agriculture), Université Félix Houphouet Boigny, Abidjan, Cote D’Ivoire
The aim of this study is to simulate the impact of mineral dust emissions from the Sahel–Saharan zone on temperature extremes over the Sahel. To achieve this goal, we performed two numerical simulations: one with the standard version of the regional climate model RegCM4 (no dust run) and another one with the same version of this model incorporating a dust module (dust run). The difference between both versions of the model allowed to isolate the impacts of mineral dust emissions on temperature extremes. The results show that the accumulation of mineral dust into the atmosphere leads to a decrease of the frequency of warm days, very warm days, and warm nights over the Sahel. This decrease is higher during the MAM (March-April-May) and JJA (June-July-August) periods especially in the northern and western parts of the Sahel. The impact of the mineral dust emissions is also manifested by a decrease of the frequency of tropical nights especially during MAM in the northern Sahel. When considering the warm spells, mineral particles tend to weaken them especially in MAM and JJA in the northern Sahel. To estimate the potential impacts of the mineral dust accumulation on heat stress, the heat index and the humidex are used. The analysis of the heat index shows that the dust impact is to reduce the health risks particularly in the northern Sahel during the MAM period, in the western Sahel during JJA, and in the southern and the northeastern parts of the Sahel during the SON (September-October-November) period. As for the humidex, it is characterized by a decrease especially in the northern Sahel for all seasons. This reduction of the occurrence of thermal extremes may have a positive effect on the energy demand for cooling and on global health. However, the accumulation of dust particles in the atmosphere may also increase the meningitis incidence and prevalence.
Introduction
The third of the earth’s surface is a potential source of dust. This dust varies spatially over the year following the season. Marticorena et al. (2011) showed that the Sahara desert is the largest source of mineral dust in the world. According to the Intergovernmental Panel on Climate Change (IPCC. Climate change, 2001), dust from this area accounts for 40% of global troposphere aerosol emissions. Li et al. (1996) showed that desert dust is the dominant element in the diffusion of solar radiation in the North Atlantic. Because of their absorption (direct effects) and diffusion (indirect effects) properties, these natural aerosols (mineral dust) have a nonnegligible impact on the solar radiation and therefore on the earth’s radiation balance (Liao and Seinfeld 1998; Gao et al. 2000; Tanré et al. 2003; Dahutia et al. 2018). N’Datchoh et al. (2018) showed that the mineral dust particles emitted from the Sahara and the Sahel and the biomass burning aerosols are frequently loaded in the atmosphere and represent an important part of the aerosols which interact directly with the West African monsoon system.
In addition, several studies (Zakey et al. 2006; Konaré et al. 2008; Solmon et al. 2008; Camara et al. 2010; N’Datchoh et al. 2018) have used the regional climate models to study the effect of aerosols on the West African climate. They all concluded that a regional climate model (typical horizontal resolutions for climate application range from 20 to 80 km) may be a more appropriate tool than a global climate model (coarse resolution) to study the effects of dust on the West African monsoon system because of their fine resolution including their advanced representation of atmospheric physics and chemistry processes. These regional climate models represent better the fine scale forcing and land surface heterogeneity, and they have the advantage to simulate with high resolution the dust emission and transport processes (Konaré et al. 2008; N’Datchoh et al. 2018). For example, Zakey et al. (2006) integrated a dust module in the regional climate model RegCM3 to study the Saharan dust distribution. They concluded that this model well reproduces the main spatial and temporal features of dust distribution especially at the seasonal timescale over the Saharan region. Konaré et al. (2008) used the same regional climate model to study the effect of the Saharan dust radiative forcing on the West African monsoon. They found that the effect of the dust shortwave radiative forcing is to reduce precipitation over the Sahel. Similar results were found by Solmon et al. (2008) who studied the effect of both dust shortwave and longwave radiative forcing on the West African climate. Camara et al. (2010) used the regional climate model RegCM3 to study the impacts of Saharan dust on the West African climate during the years 2005 and 2006. They found that dust impacts on Sahel-Saharan climate are to weaken both the monsoon flow and the tropical easterly jet, to strengthen the African easterly jet, and to decrease rainfall over the Sahel.
Furthermore, some studies (Schmidt et al., 2012; Jones et al., 2013; Kravitz et al., 2013; Tilmes et al., 2013) have investigated the response of the mean temperature, mean precipitation, and sea level pressure to solar dimming under the Geoengineering Model Intercomparison Project (GeoMIP). Jones et al. (2013) show that this model agrees on a rapid increase in global-mean temperature following termination accompanied by increases in global-mean precipitation rate and decreases in sea-ice cover. Curry et al. (2014) also study the changes in temperature and precipitation extremes in models running the solar radiation dimming experiment (G1). They found that the changes in climate extremes under G1 are generally much smaller than under 4 × CO2 alone compared to the preindustrial climate. Aswathy et al. (2015) examined extremes under stratospheric aerosol injection simulations and marine cloud brightening by sea salt emission. They found that the extreme temperature changes are similar to the mean temperature changes over much of the globe. Dagon and Schrag (2017) showed that solar geoengineering mitigates extreme heat events from greenhouse warming. This study emphasizes the key role of solar radiation dimming experiment on climate model extreme indices.
According to IPCC. Climate Change (2001), extreme weather events (rainfall and temperature extremes) should become more frequent under the global warming. Karimou and Ambouta (2015) showed that these events have a negative impact on agriculture, livestock, and natural resources which are key sectors on which most of the West African national economies are based. This is the case of the Sahel whose economic development is based on rain-fed agriculture, therefore dependent on climatic hazards. Moreover, Ringard et al. (2016) predict an intensification of temperature extremes over the Sahel and Guinea region during the future; this thermal extreme rise may impact negatively the human health (Sarr et al. 2019).
This work proposes a sensitivity study of the effect of mineral dust emissions from the Sahel–Saharan zone on the seasonal variability of temperature extremes over the Sahel. A brief description of the RegCM4 model, the simulations performed, and the data and methods is presented in Model Description, Data and Methods. The third section analyzes and discusses the results relating to the impacts of the accumulation of mineral dust into the atmosphere on the temperature extremes during the December-January-February (DJF), March-April-May (MAM), June-July-August (JJA) and September-October-November (SON) periods. The conclusion is presented in the last section.
Model Description and Data and Methods
Model Description
This work uses the fourth version of the regional climate model RegCM. It is a limited-area mesoscale model (i.e., covering only one part of the earth surface) using the primitive equations based on the hydrostatic approximation for the simulation of the climate of a particular region over periods varying from a few months to several years. The RegCM was developed at the first time at the National Center for Atmospheric Research (NCAR) and the Pennsylvania State University (PSU). Since 1990, it has been adapted and updated by scientists from the Earth System Physics section of the International Center for Theoretical Physics Abdu Salam (ICTP, Trieste, Italy). RegCM4 is a hydrostatic model using the continuity equation (i.e., conservation of mass) (Giorgi et al. 2012). The interactions between the land surface and the atmosphere are described using the Biosphere Atmosphere Transfer Scheme version 1 (BATS 1E) of Dickinson et al. (1993), and this interface offers most of the parameters used to couple the dust emission, while the Scheme of Zeng et al. (1998) is used to represent the ocean fluxes. Holtslag et al.’s (1990) model is used for the parameterization of the planetary boundary layer. The large-scale rain is parameterized with the subgrid explicit moisture and cloud scheme (SUBEX) developed by Pal et al. (2000). The convection schemes used are those of Grell (1993) with the closure of Fritsch and Chappell (1980) for the main land and Emanuel (1991) for the ocean as in Diba et al. (2016). Horizontal and vertical resolutions are, respectively, 50 km and 18 vertical levels. All the integrations start on 1 November 2000 and runs for 10 years and 2 month until 1 January 2011. The first two months (November-December 2000) are excluded from the analysis to allow for the model spin-up time. The description of the improvements of RegCM4 compared to the previous versions (RegCM1, RegCM2, and RegCM3) is detailed in Giorgi et al. (2012). The model has already been used in various studies over different domains of West Africa (Abiodun et al. 2008; Camara et al. 2010; Sylla et al. 2010; Mariotti et al. 2011; Diba et al. 2016).
Data and Methods
The control simulation and the “dust version”’ of the model are initialized and forced to their lateral boundaries by the ERA-Interim reanalyzes (with a spatial resolution of 1.5° x 1.5°, Simmons et al. 2007; Uppala et al. 2008). These reanalyzes are global data sets produced by the European Center for Medium-Range Weather Forecasts (ECMWF, Dee et al. 2011) and covering the period from 1 January 1979 to 31 August 2019. These reanalyzes are mesh data available at different spatial resolutions and on 37 pressure levels. They are currently the best way to describe the state of the atmosphere over West Africa. The dust module of RegCM used in this study is extensively described in Zakey et al. (2006), and a brief description is given in Konaré et al. (2008) and Camara et al. (2010). The dust scheme of RegCM includes dust transport by wind, turbulent diffusion, dust advection, deep convection, and removal wet and dry processes. These dust processes are extensively described in previous papers (Qian et al., 2001; Solmon et al., 2006). The dust emission process is also controlled by wind intensity and surface characteristics. Its calculation is based on parameterizations of soil aggregate saltation and sandblasting processes. Zakey et al. (2006) and Konaré et al. (2008) provide examples of the performance of the dust module of RegCM over the Sahara region for episodic dust events and for long-term simulations. They show that the model is capable of reproducing the evolution and dynamics of dust-generating events over the Sahara. The aerosol optical depth simulated by the “dust version” of the model (RegCM4_DUST) is analyzed and compared to observations from the AERONET network (Aerosol Robotic NETwork) in order to characterize the performance and robustness of the model. The AERONET network is a global aerosol observation and measurement tools based on remote sensing. It is created by the National Aeronautics and Space Administration (NASA) in collaboration with the Optical Laboratory (LOA) of the National Center for Scientific Research (CNRS, France). This network allows archiving and access of public to data on the optical, microphysical, and radiative properties of aerosols in near real-time, continuous, and long term (Holben et al. 1998). AERONET aims to characterize the aerosols properties by constituting a permanently available database for aerosol climatology and validation of satellite data (Diarra and Ba, 2014). In this study, the aerosol optical depth from four stations over the Sahel is used for comparison with the results of the “dust version” of the RegCM4 model. These stations shown in Figure 1 are Banizoumbou (Niger: 2.66°E–13.54°N), Ouagadougou (Burkina Faso: 1.48°W–12.42°N) located at the eastern Sahel, Dakar (Senegal: 16.95°W–14.39°N), and Cape Verde (Cape Verde: 22.93°W–16.73°N) located in the western Sahel.
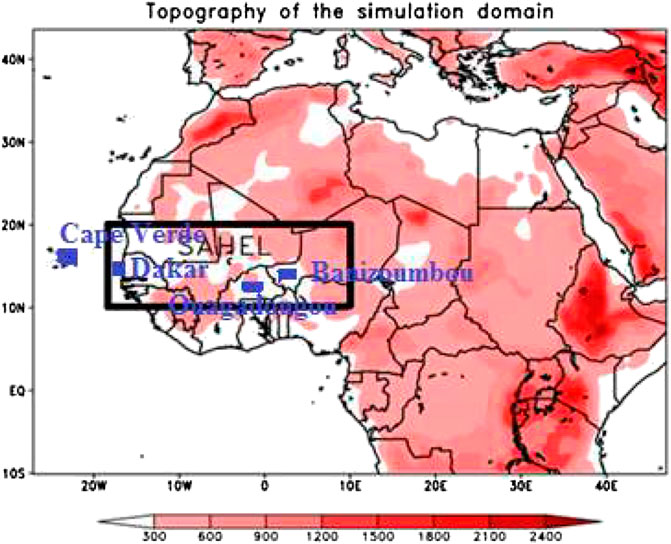
FIGURE 1. Topography (m) of the simulation domain (West Africa) and the four AERONET observation sites. The interested area (the Sahel) in rectangle.
Five (5) indices of temperature extremes recommended by the World Meteorological Organization (WMO) Expert Team on Climate Change Detection and Indices are also used to characterize the spatiotemporal distribution of thermal indices (Peterson et al. 2001). These indices are summarized in Table 1 and are also known for their great impact on human health. In addition to these indices presented in Table 1, we also assessed the impact of dust on heat stresses related to human health by considering the heat index (HI) from Steadman (1979) developed and most used by the US National Weather Service as well as the humidity-index commonly called humidex (HUM) developed by the Canadian Meteorological Service. The HI measures the combined effect of heat and humidity on human organism (see Table 2) while the HUM is used to describe the impacts of humidity on human comfort (see Table 3).
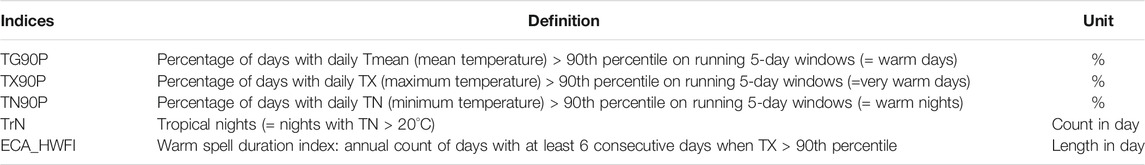
TABLE 1. Definition of climate indices (Peterson et al. 2001).
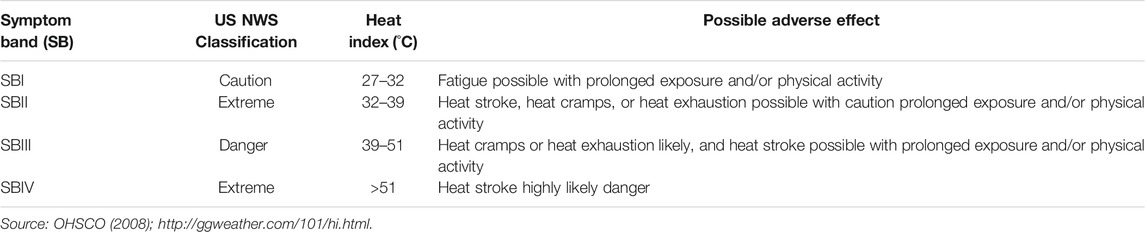
TABLE 2. Heat index threshold and potential health impact.
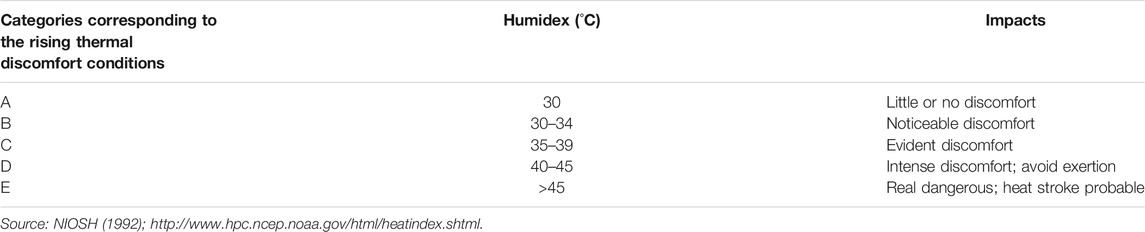
TABLE 3. Humidex threshold and potential health impact.
The heat index (HI) and the humidex (HUM) are, respectively, defined by
where c1=−42.37; c2=2.04901523; c3=10.14333127; c4=−0.22475541; c5=−6.83783∗10–3; c6=−5.481717∗10–2; c7=1.22874∗10–3; c8=8.5282∗10–4; and c9=−1.99∗10–6.
And HI is the heat index (in °F), T is the air temperature (in °F), and R is the relative humidity (in %). In this study, the HI values were afterwards converted into °C:
where
The simulation domain is presented in Figure 1. The interested area (the Sahel) is highlighted in the rectangle of Figure 1. Two runs were performed from 2001 to 2010 at a horizontal resolution of 50 km. These simulations use the same experimental setup as those performed in Diba et al. (2016). The first experiment which is the control simulation uses the standard version (reference) of the RegCM4 model. The second simulation (dust version also named RegCM4_DUST) uses this same version of the model taking into account its dust module.
The impacts of the accumulation of mineral dust particles into the atmosphere on temperature extremes is assessed at the seasonal timescale by analyzing the difference between both runs.
Results
Validation of the Simulations
The simulation of the control version of the model (RegCM4_CTL) analyzed in this study has already been validated in Diba et al. (2016). The results showed that the RegCM4 model has low biases of rainfall and surface temperature, reflecting its good ability to simulate the West African climate and in particular that of the Sahel. In this part, we validated the aerosol optical depth (dust loading) simulated by the “dust version” of the model (RegCM4_DUST) by comparing it with that of the AERONET observations.
Figure 2 presents the seasonal cycle of the aerosol optical depth for the AERONET observations and the RegCM4_DUST model averaged from 2001 to 2010 for two (2) stations located at the western Sahel (Dakar and Cape Verde) and two (2) others located at the eastern Sahel (Banizoumbou and Ouagadougou). The AERONET data exhibit the maxima of the aerosol optical depth from May to July over the Cape Verde and Dakar stations and the minima from November to April (Figures 2A,C). These results are in agreement with the findings of Fouquart et al. (1987), Dubovik et al. (2001), and Jones et al. (2003), who showed that during the wet season (June-July-August), intense convective systems and African easterly waves are responsible for important emissions of mineral dust over the southern Sahara and the Sahel. At Banizoumbou and Ouagadougou stations, the maxima are obtained during from February to April and the minima in November and December (Figures 2B,D) in agreement with Prospero (2002) and Ginoux et al. (2012). In fact, Prospero (2002) showed that during the months of March, April, and May, mineral dust arriving at Banizoumbou from the surface to about 2000 m originated mainly from the Sahara desert which has been identified as the major source area of dust loads. The RegCM4_DUST model and the AERONET data present similar mean values of the aerosol optical depth at Dakar and Cape Verde stations during the DJF, MAM, and SON seasons (Table 4). The model fairly reproduces the peaks of March and October observed in the AERONET data from Banizoumbou and Ouagadougou (Figures 2B,D) but does not reproduce the peaks of May and July at Dakar and Cape Verde stations (Figures 2A,C).The mean value of the aerosol optical depth over the study period is around 0.34 for the AERONET data at Dakar and 0.35 at Cape Verde station (Table 4). Generally, the results show that the model well reproduces the seasonal cycle of the aerosol optical depth in all considered stations with a strong positive correlation at Banizoumbou (r = 0.77) and Ouagadougou (r = 0.60) (Figures 2B,D) but underestimates the aerosol optical depth (Table 4) in agreement with Camara et al. (2010) and N’Datchoh et al. (2018).
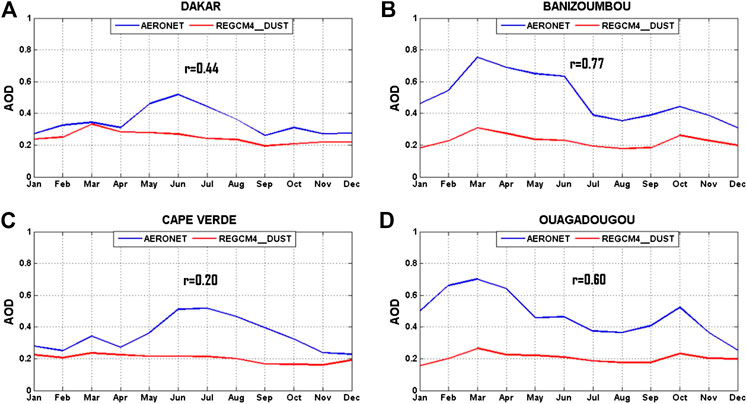
FIGURE 2. Annual cycle of the aerosol optical depth (AOD) averaged from 2001 to 2010: (A) Dakar (Senegal), (B) Banizoumbou (Niger), (C) Cape Verde (Cape Verde), and (D) Ouagadougou (Burkina Faso) for the AERONET data and the RegCM4_DUST model.
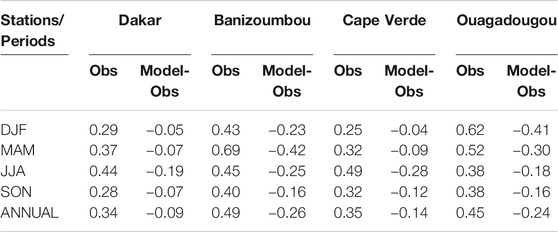
TABLE 4. Mean values of the aerosol optical depth averaged from 2001 to 2010 for AERONET observations (Obs) and the difference between the RegCM4_DUST model and the AERONET observations at Dakar, Banizoumbou, Cape Verde, and Ouagadougou stations.
In this study, only natural sources of mineral aerosols (desert dust) are taken into account. The low values simulated by the model could be due partly to the fact that other types of aerosols such as biomass burning and anthropogenic sources are not taken into account in the current simulations.
The next step of this study is to isolate the impacts of mineral dust emissions on the seasonal distribution of temperature extremes over the Sahel.
Impacts of Dust Emissions on Radiative Forcings
The seasonal distribution of dust surface shortwave and longwave radiative forcing averaged from 2001 to 2010 over the Sahel is presented in Figure 3. The model (RegCM4_DUST) simulates a strong intra-annual variability of dust surface shortwave radiative forcing (SSWRF) over the Sahel (Figures 3A–D). Results also show that dust induced shortwave radiative forcing is negative at the surface with high values > = −20 W/m2 over dust emission sources (Niger, Mauritania, and Mali) traducing a cooling at the surface over the Sahel domain. High values of this radiation are simulated over the western and eastern Sahel during the warm season March-April-May (MAM) and the summer season June-July-August (JJA) in agreement with the strong values of the aerosol optical depth obtained during these two seasons (Figures 3B,C). Generally, the analysis shows that the effect of mineral dust is to reduce the surface shortwave radiative throughout the Sahel for all seasons (DJF, MAM, JJA, and SON). The model simulates lower surface shortwave radiative during the December-February (DJF) (Figure 3A) and September-November (SON) (Figure 3D) periods over the western Sahel domain in consistence with the lower values of the aerosol optical depth obtained during these two seasons (Table 4). Moderate values of this parameter are simulated by the RegCM4_DUST model in the eastern Sahel during DJF and SON seasons in consistence with the maximum values of the aerosol optical depth observed from the AERONET data during November to April in the eastern stations (Banizoumbou and Ouagadougou). During the summer season (June-August; JJA), the model simulates a north–south gradient with higher values of surface shortwave radiative (up to 20 W/m2) over the western and eastern parts of the Sahel (Figure 3C). These results are in agreement with those of Zhao et al. (2011) and Raji et al. (2017).
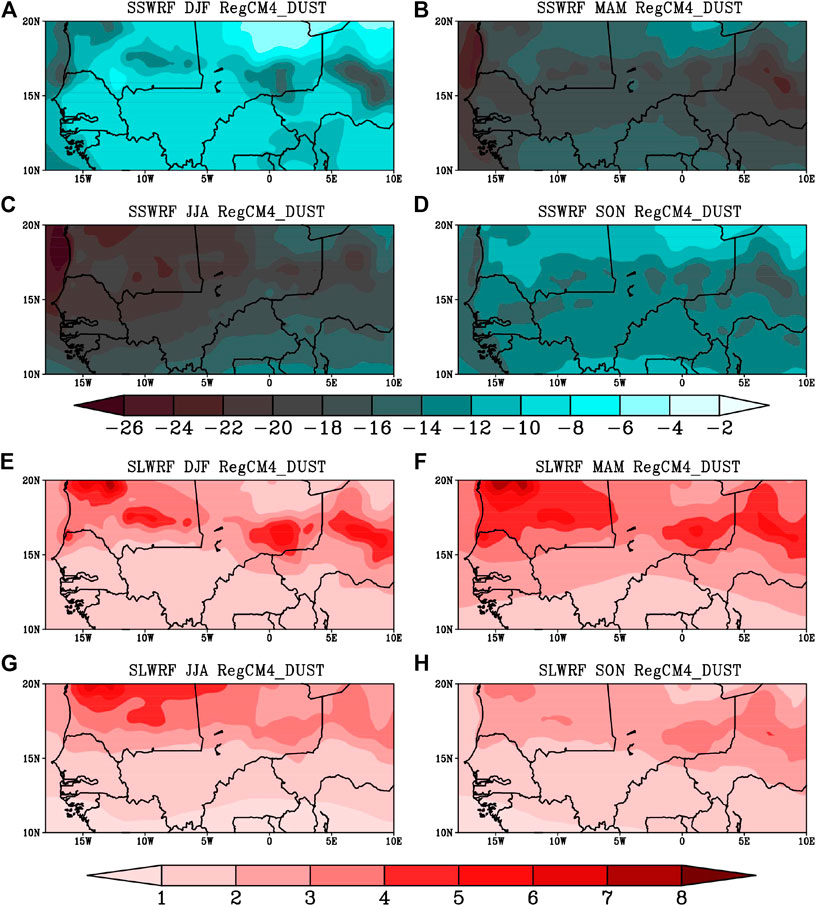
FIGURE 3. Seasonal variability of dust surface shortwave (SSWRF) and longwave (SLWRF) radiative forcing (unit W/m2) averaged from 2001 to 2010 over the Sahel for the RegCM4_DUST model (dust version).
When considering the Ocean front, results show that the dust surface shortwave radiative forcing has seasonal variations with maximum values (up to −24 W/m2) during MAM and JJA periods in the northwestern part of the Sahel along the coasts and minimum values in the southern Sahel during the DJF period (Figures 3B–D).
The seasonal distribution of dust surface longwave radiative forcing (SLWRF) shows that the effect of the mineral dust is to enhance (positive values) the longwave radiative flux at the surface over the entire Sahel domain for all seasons (Figures 3E–H), with strong values over Niger during the DJF and MAM periods (Figures 3E,F). The maxima of dust surface longwave radiative are found over the dust emission sources (Niger, Mauritania, and Mali) during the DJF, MAM, and JJA seasons (Figures 3E–G), in agreement with the findings of Perlwitz et al. (2001); Zhao et al. (2011); Solmon et al. (2012); and Raji et al. (2017). In fact, Raji et al. (2017) showed that the maximum dust surface longwave radiative forcing coincides with the transition period between the dry (MAM) and wet seasons (JJA). During the December-February (DJF) period, the RegCM4_DUST model simulates the maxima of the surface longwave radiation in the northeastern and northwestern parts of the Sahel and the minima in the southern Sahel (Figure 3H). Values up to 3 W/m2 are simulated by the RegCM4_DUST model in the northeastern and northwestern parts of the Sahel during the MAM period (Figure 3F). During the June-August (JJA) period, the model simulates a north–south gradient with values reaching 3 W/m2 in the northwestern part of the Sahel (Figure 3G). The RegCM4_DUST model simulates lower longwave radiation over the southern Sahel from September to November (Figure 3H).
The analysis of dust net surface radiative forcing (figure not shown) shows similar spatial distribution to that of dust surface shortwave radiative forcing (SSWRF) with the strongest values simulated over the dust sources (Niger, Mauritania, and Mali) for all seasons. The analysis indicates that the accumulation of mineral dust into the atmosphere exerts essentially a cooling effect at the surface over the Sahel for all seasons, with the maximum cooling obtained during the periods of high dust concentrations: the warm period (MAM) and the summer season (JJA) in coherence with Malavelle et al. (2011); Solmon et al. (2012); and Nébon et al. (2019).
At the top of the atmosphere, the seasonal distribution of dust shortwave radiative forcing (TOA SWRF) (Supplementary Figure S2) shows a strong intra-annual variability. Dust induced shortwave radiative forcing is negative at the top of the atmosphere with maximum values >= −10 W/m2 over the southern Sahel suggesting that the mineral dust exerts essentially a cooling effect at the top of the atmosphere for all seasons in agreement with Nébon et al. (2019). Moreover, this negative effect is lower than at the surface (Figure 3). The maximum shortwave radiative forcing is more located south of 15°N during the warm season (MAM) and the summer period (JJA). When considering the seasonal distribution of dust longwave radiative forcing at the top of the atmosphere (TOA LWRF) (Supplementary Figure S2), results show that dust particles induce an enhancement (positive values) of the longwave radiative flux at the TOA in the whole Sahelian domain for all seasons. The maximum longwave radiation at the TOA values is found over dust emission sources (Niger, Chad, Mauritania, and Mali) during the warm season (MAM) and the wet season (JJA).
We also analyze the dust single-scattering albedo for a better interpretation of changes in mean temperature thermal extremes. The dust single-scattering albedo, the ratio of scattering coefficient to total extinction coefficient, is an essential parameter used to estimate the direct radiative forcing of dust. The analysis of this parameter (Supplementary Figure S1) shows higher values over the northern Sahel for all seasons. This could indicate that, over the northern Sahel (less humid area), preferential diffusion of radiation by aerosol could be occurring. Over the western Sahel, the highest single-scattering albedo values are simulated at around 20°N during the summer season (JJA) and the warm period (MAM) and around 17°N and 20°N during DJF. The albedo increases from the southern Sahel to the northern Sahel indicating that the dust activity extends northward during JJA traducing the propagation of the Saharan Air Layer (SAL) mainly located at the midlevels. This result is also in agreement with previous studies of Jones et al. (2003) who showed that during this period (summer season: JJA), intense convective systems and African Easterly waves are responsible for significant emissions of mineral dust particles in the south of the Sahara and in the Sahel. Weak values of this parameter are simulated south of 15°N for all seasons indicating that over the southern Sahel (most humid area), preferential absorption of radiation by aerosol could be occurring.
Effects of Dust Emissions on Temperature Extremes Over the Sahel
In this part of the work, we first isolated the impacts of the accumulation of mineral dust into the atmosphere on the mean, minimum, and maximum temperatures over the Sahel before studying their impacts on the temperature indices presented in Table 1. The seasonal distribution of the mean surface temperature is presented in Figure 4. The control version of the model simulates the lowest temperatures (between 16 and 24°C) during the DJF period especially in the northern and central Sahel. During the MAM period, the mean temperature strongly increases and the model simulates higher values in the latitudinal band 12–17°N (up to 34°C). During the wet season (JJA), the model simulates a north–south gradient with the lowest temperatures located over the southern Sahel. This is due to the fact that during this season, rainfall over the Sahel is characterized by a latitudinal gradient with stronger intensities in the south causing a considerable decrease of surface temperature in this part of the Sahel. The model simulates relatively low temperatures over the northern and southern Sahel during the SON period. The analysis of the difference between the “dust version” of the model and the control one shows that the accumulation of mineral dust in the atmosphere leads globally to a decrease of the mean surface temperature over the Sahel, whatever the considered season with maxima depicted in the northern and central Sahel.
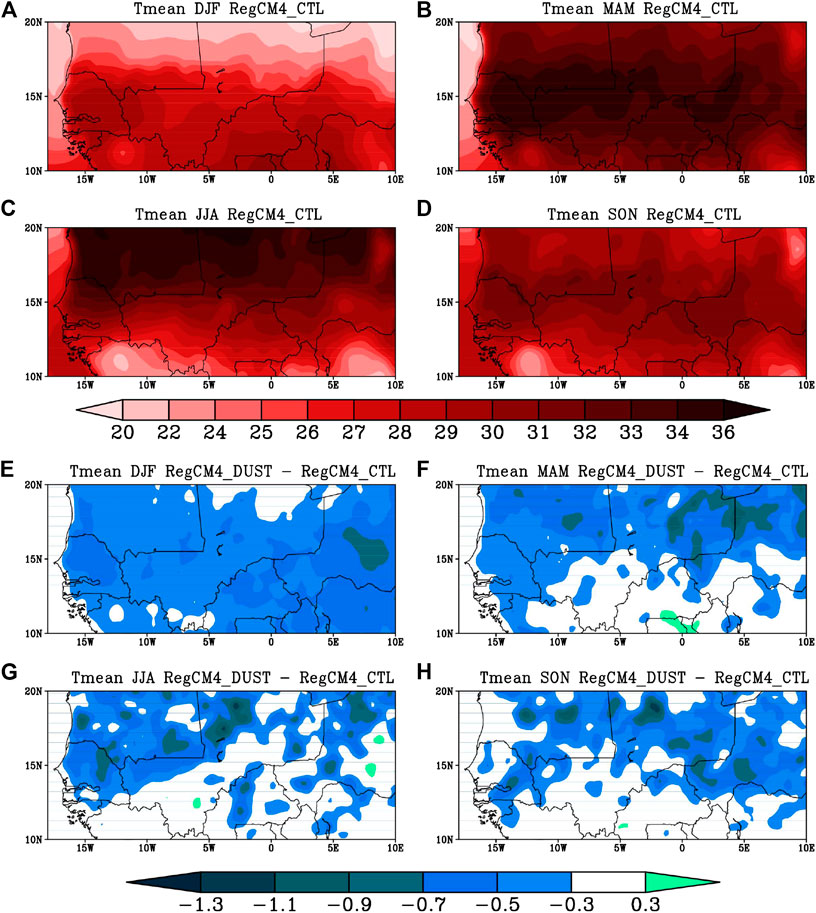
FIGURE 4. Seasonal variability of the mean surface temperature (Tmean) (°C) averaged from 2001 to 2010 over the Sahel: (top) RegCM4_CTL, (down) difference between RegCM4_DUST and RegCM4_CTL.
When considering the minimum and maximum surface temperatures (figure not shown), mineral particles tend to decrease the maximum temperature over the whole Sahel domain during DJF and in the northern, southern, and western Sahel during MAM, JJA, and SON. The minimum temperature seems to be less impacted by dust particles (especially over the southern Sahel). This little impact of dust emissions on the daily minimum temperature over the southern Sahel could be due to the little impact of dust on the surface longwave radiative forcing over this region.
Figure 5 shows the percentage of days with a daily mean surface temperature above the 90th percentile of the daily mean surface temperatures (percentage of warm days, TG90P) for the control version of the RegCM4 model (top) and the difference between the two simulations (down). The model simulates high frequencies (up to 20%) of the TG90P indice over the entire central part of the Sahel during the March-April-May (MAM) period (Figure 5B) in agreement with Diba et al. (2019). During the summer season (June-August: JJA), the frequency of warm days varies between 2 and 18% over the southern Sahel and increases fairly (>20%) over the northern part of the region (Figure 5C). The percentage of warm days varies between 8 and 16% in the central and northeastern parts of the Sahel during the September-October-November (SON) period (Figure 5D). The minima of the TG90P indice (<8%) are simulated over the northern and southern Sahel during the December-January-February (DJF) period (Figure 5A). The difference between the two simulations of the model shows that the effect of mineral dust emissions is to attenuate the frequency of warm days over the northern and central Sahel during the DJF and MAM periods and almost over the whole Sahel domain during the summer season (JJA). An increase of this indice is noted over the southern and central Sahel during the SON period.
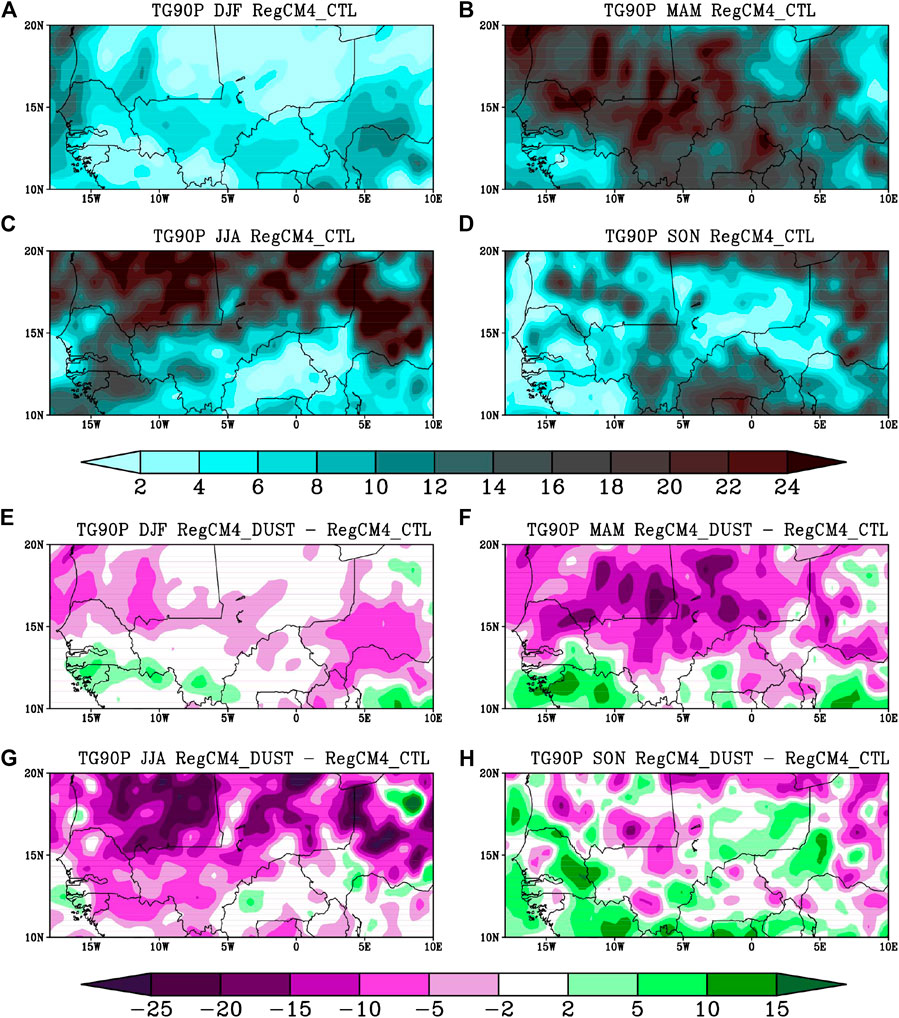
FIGURE 5. Seasonal variability of the percentage of warm days (TG90P) averaged from 2001 to 2010 over the Sahel: (top) RegCM4_CTL, (down) difference between RegCM4_DUST and RegCM4_CTL. The differences are significant at 95% level using the Student test.
A high occurrence of very warm days poses a serious threat to human health and well-being of populations and the natural environment. Figure 6 shows the percentage of the very warm days (TX90P) over the Sahel. The control version exhibits lower frequencies (<8%) of the very warm days over the central Sahel during the DJF and SON seasons (Figures 6A,D) and over the southeastern part of the Sahel during the JJA season (Figure 6C). Overall, the high frequencies of this indice (>16%) are simulated over the western Sahel during the summer period (JJA) (Figure 6C) and over the southeastern part of the Sahel during the SON season (Figure 6D). Between 16% and 20% of the very warm days occurred throughout the northwestern and central parts of the Sahel during the warm season (MAM) partly linked to the maximum shortwave radiation received by the Sahel during this period. This result is in agreement with the previous works of Moron et al. (2016) and Odoulami et al. (2017).
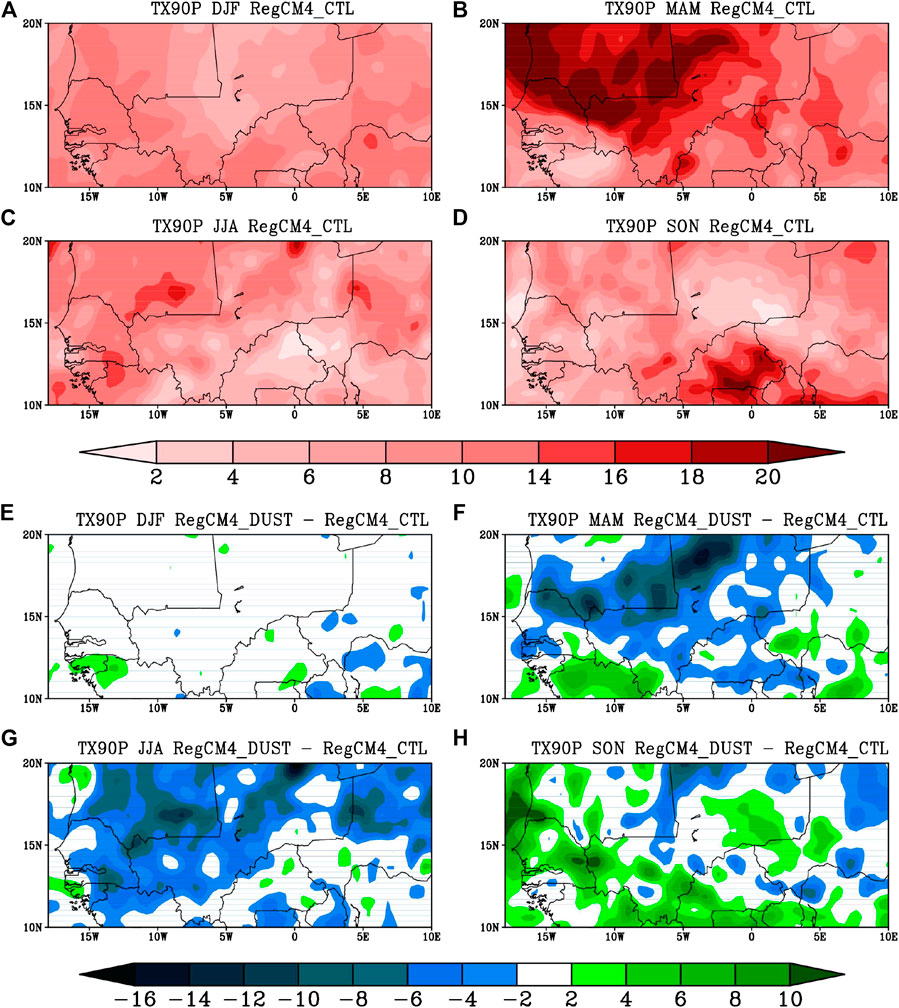
FIGURE 6. Seasonal variability of the percentage of very warm days (TX90P) averaged from 2001 to 2010 over the Sahel: (top) RegCM4_CTL, (down) difference between RegCM4_DUST and RegCM4_CTL. The differences are significant at 95% level using the Student test.
The difference between the two simulations shows that the accumulation of mineral dust in the atmosphere leads to a decrease of the frequency of very warm days almost over the entire Sahel domain during the summer period (JJA) and over the northern and central Sahel during the warm season (MAM). This indice increases over the western and southern Sahel during the SON period probably due to the strengthening of the surface longwave radiative forcing (SLWRF) due to dust emission (Figure 3H).
The decreases of the frequency of warm days and very warm days during MAM and JJA periods is partly due to the cooling of the entire Sahel domain caused by the accumulation of mineral dust in the atmosphere (Figure 3). This is consistent with the fact that the aerosol optical depth is stronger during these two seasons (Table 4).
The frequency of warm nights (TN90P) averaged from 2001 to 2010 for the standard version of the model (top) and the difference between the two versions (down) is shown in Figure 7. The model exhibits high frequencies (>21%) of warm nights over the central Sahel during the warm season (MAM) (Figure 7B) and over the northern Sahel during the summer season (JJA) (Figure 7C). The low frequencies (<9%) of warm nights are recorded over the entire Sahel during the DJF season (Figure 7A) and over the central Sahel during the SON period (Figure 7D). This DJF season is the period of low mineral dust emissions into the atmosphere in coherence with Drame et al. (2015). The effect of the mineral dust emissions is to reduce the frequency of warm nights over the whole Sahel during the DJF, MAM, and JJA periods, as well as in the northeastern and central parts of the Sahel during the SON period. The accumulation of mineral dust in the atmosphere also tends to strengthen the frequency of warm nights in the southwestern part of the Sahel in SON.
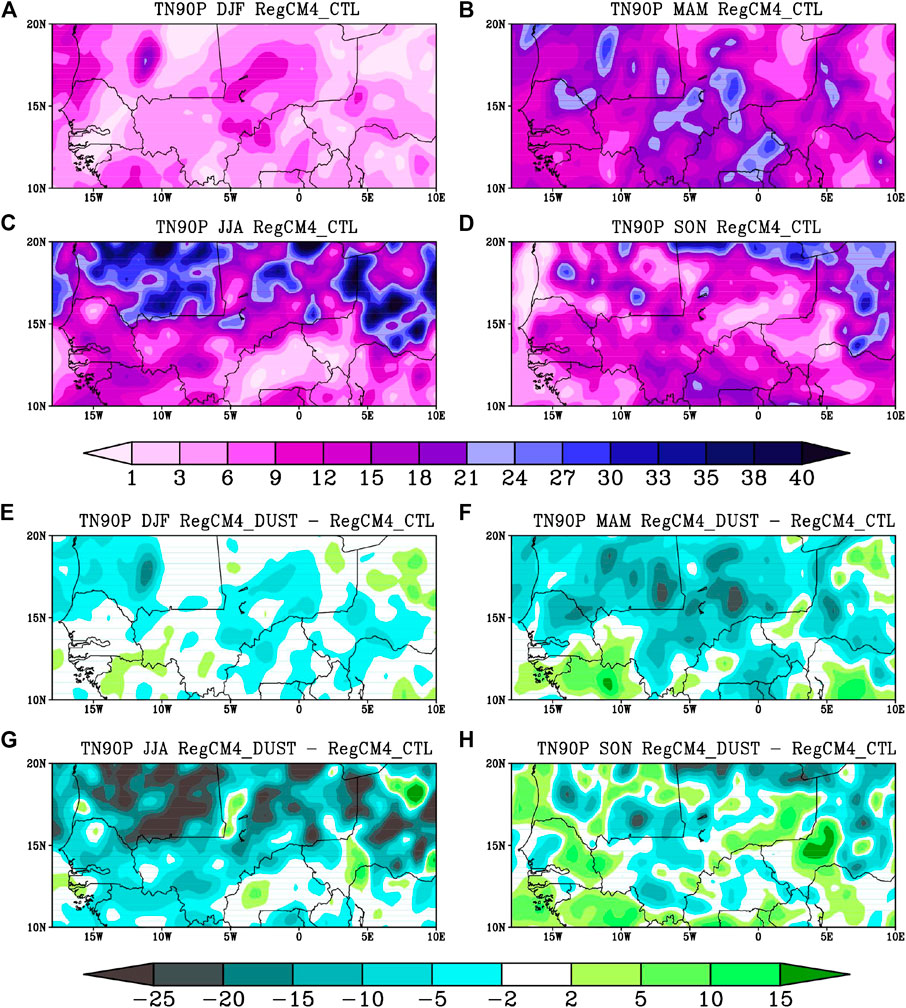
FIGURE 7. Seasonal variability of the percentage of warm nights (TN90P) averaged from 2001 to 2010 over the Sahel: (top) RegCM4_CTL, (down) difference between RegCM4_DUST and RegCM4_CTL. The differences are significant at 95% level using the Student test.
We also computed the tropical nights (TrN: nights with minimum temperatures above 20°C) as considered in Moron et al. (2016). The tropical nights are more frequent (>60 days) over the southern Sahel during the MAM and SON seasons (Figures 8B,D) and over the whole Sahel domain during the JJA period (Figure 8C). The weak values (<20 days) of this indice are recorded over the northern Sahel during DJF (Figure 8A) and the values between 30 and 70 days over the northern Sahel during MAM and SON periods (Figures 8B,D). The difference between the two versions of the model shows that the impact of the accumulation of mineral dust in the atmosphere results in a decrease of the number of tropical nights over the southern Sahel during DJF and over the northern Sahel during MAM and SON periods.
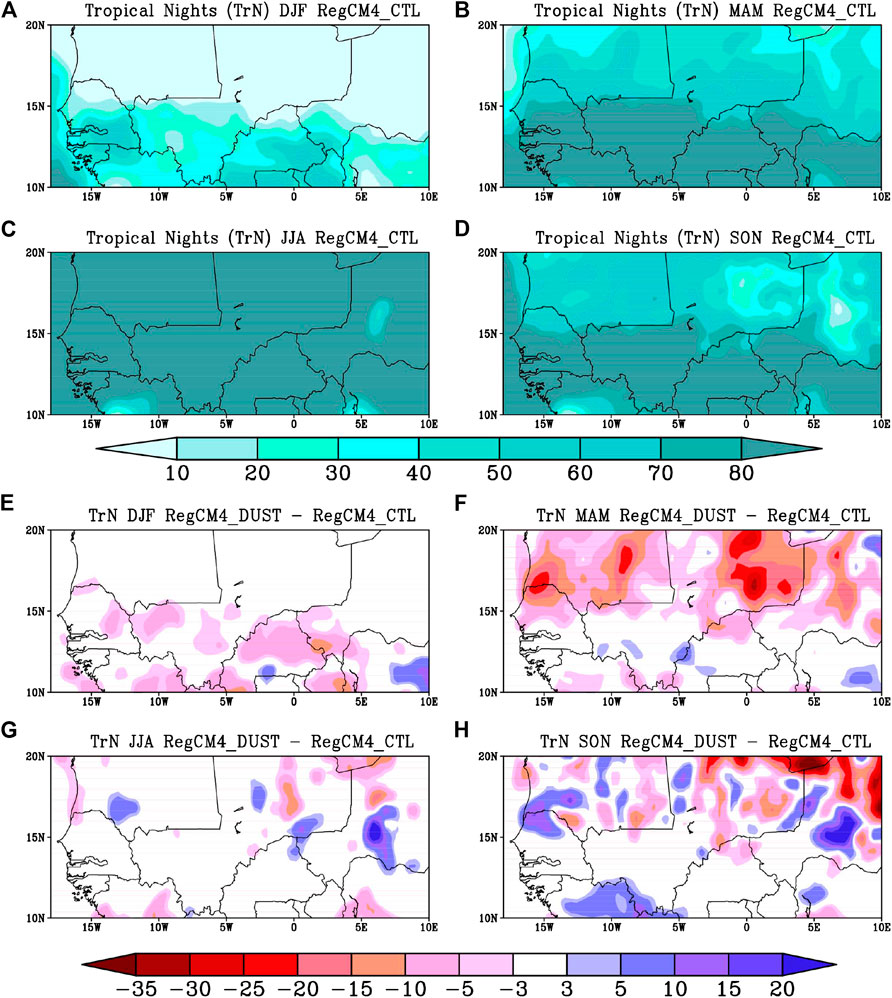
FIGURE 8. Seasonal variability of tropical nights (nights with a minimum daily temperature above 20°C, TrN) averaged from 2001 to 2010 over the Sahel: (top) RegCM4_CTL, (down) difference between RegCM4_DUST and RegCM4_CTL. The differences are significant at 95% level using the Student test.
Likewise, the human health is sensitive to high values of warm spell days (Luber et al. 2014). Figure 9 shows the frequency of warm spell days averaged from 2001 to 2010 for the standard version of the RegCM4 model (top) and the difference between the two versions of the model (down). The control version of the model simulates longer warm spell days (>17 days) over the northwestern and central parts of the Sahel during the MAM period (Figure 9B). The model also simulates shorter values (<7 days) of this indice over the entire Sahel during the DJF period (Figure 9A). Between 15 and 21 warm spell days are simulated by the model over the northeastern and northwestern parts of the Sahel during JJA (Figure 9C) and over the northeastern part during the SON period (Figure 9D). The impact of mineral dust emissions is to reduce the frequency of warm spell days over the northern and central parts of the Sahel during the MAM period and over the northern Sahel during the JJA and SON periods.
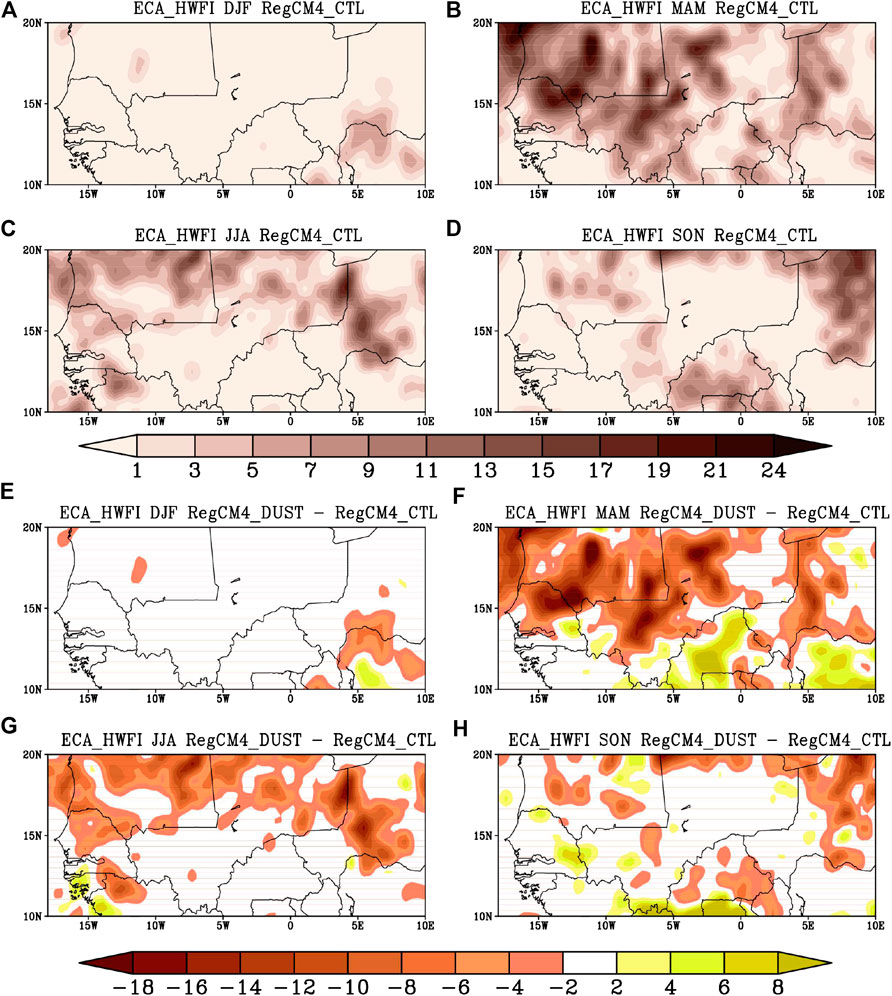
FIGURE 9. Seasonal variability of warm spell days (ECA_HWFI) averaged from 2001 to 2010 over the Sahel: (top) RegCM4_CTL, (down) difference between RegCM4_DUST and RegCM4_CTL. The differences are significant at 95% level using the Student test.
To go deeper in the characterization of dust impacts on heat indices related to human health, we analyzed the heat index (HI) and the humidex (HUM) which are the main standard indices used in numerous studies (Willett and Sherwood, 2012; Anderson et al. 2013; Garland et al. 2015; Sarr et al. 2019). These health-related indices are generally based on meteorological variables which condition the temperature felt by humans. The heat index and the humidex combine air temperature and relative humidity and provide levels of thermal discomfort or even danger to humans. Table 2 and 3 show the different levels of discomfort and health risks for the humanity. The control version of the model simulates the lowest heat index (<28°C) during the DJF period over the entire Sahel (Figure 10A) reflecting a low health risk. During the MAM period, the heat index increases and the model simulates higher values (up to 30°C) in the southern Sahel (Figure 10B) reflecting a higher risk level which could result in shots fatigue and cramps after long exposures. This increase is in line with that of the surface temperature during the warm season (MAM) (Figure 4). During the wet season (JJA) and the SON period, the model simulates the stronger values (up to 34°C) over the northern Sahel (Figure 10C,D) reflecting a high health risk levels which may lead to possible heat cramps and heat stroke with prolonged exposure. The strong HI values recorded during the wet season (JJA) could be due partly to the increase of the relative humidity during this period. The HI values obtained during the DJF period correspond to the symptom band I and that of the MAM, JJA, and SON seasons to the symptom band II (Table 2). These results are in agreement with the findings of Meehl and Tebaldi (2004) and Sarr et al. (2019). The difference between the two versions of the model shows that the accumulation of mineral dust in the atmosphere results in a decrease of the heat index especially in the northern Sahel during the MAM period, over the western Sahel during JJA, and over the central, the southern, and the northeastern parts of the Sahel during the SON period traducing a decrease of health risks. Moreover, the heat index shows an increase of more than 0.5°C over the northern, central, and southern Sahel during JJA (Figure 10G). This increase may be due to the strengthening of the surface humidity in those areas (figure not shown) which in turn may be related to the cloud-aerosol-precipitation interaction. In fact, dust particles may serve as cloud condensation nuclei around which cloud droplets form. This may increase rainfall which in turn may strengthen the relative humidity and therefore the heat index.
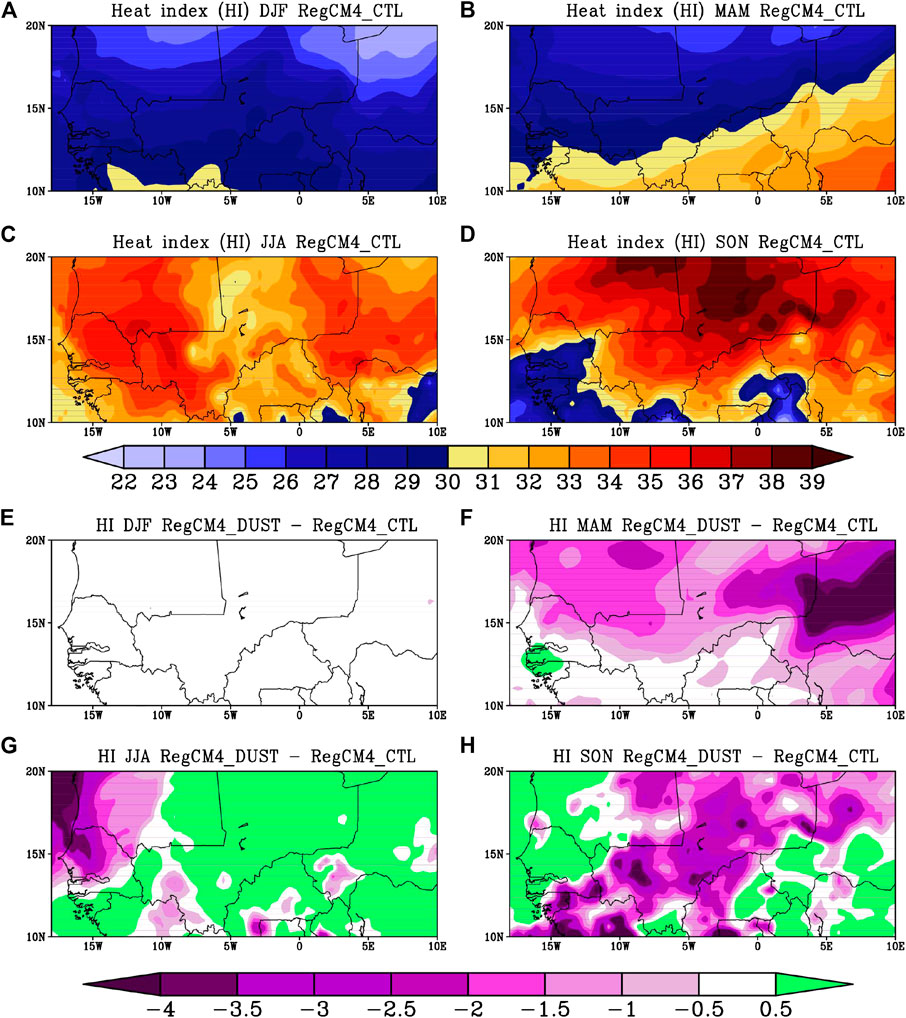
FIGURE 10. Seasonal variability of the heat index (°C) averaged from 2001 to 2010 over the Sahel: (top) RegCM4_CTL, (down) difference between RegCM4_DUST and RegCM4_CTL. The differences are significant at 95% level using the Student test.
Figure 11 shows the seasonal variability of the humidex (HUM) over the Sahel. The control version of the model simulates the lowest humidex values (<30°C) during the DJF and the MAM periods over the northern Sahel (Figures 11A,B) traducing a little or no discomfort in this zone (comfortable area) during these two seasons (Table 3). During the wet season (JJA) and the SON period, the model simulates a north–south gradient with the lowest humidex located over the southern Sahel (Figures 11C,D). The strongest values (>32°C) of this indice are recorded over the southern Sahel during the MAM period (Figure 11B) and over the northern Sahel during the JJA and SON periods (Figures 11C,D) in agreement with Sarr et al. (2019) traducing evident discomfort (Category B and C in Table 3). The difference between both versions of the model shows that the dust impact is to decrease the humidex especially in the northwestern part of the Sahel during the DJF and MAM periods and over the central and the northeastern parts of the Sahel during the JJA and SON periods. Indeed, the combination of temperature and relative humidity decreases could have positive impacts on human health.
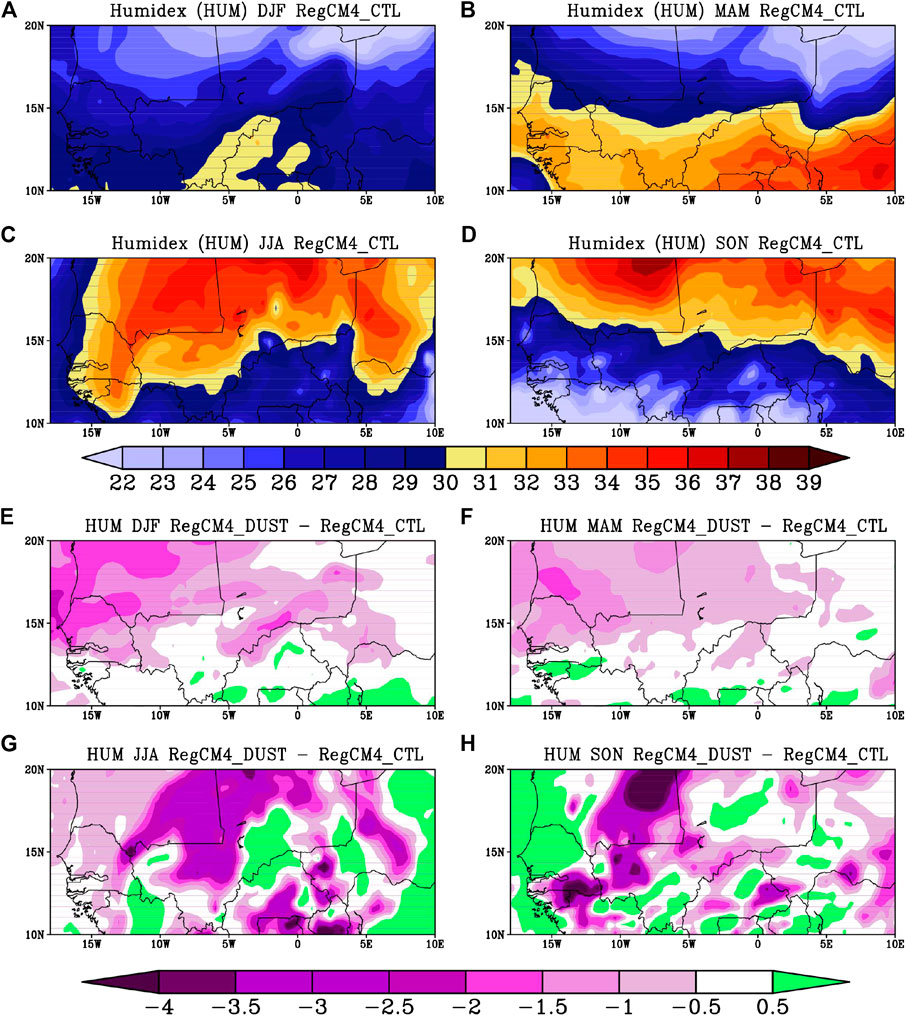
FIGURE 11. Seasonal variability of the humidex (°C) averaged from 2001 to 2010 over the Sahel: (top) RegCM4_CTL, (down) difference between RegCM4_DUST and RegCM4_CTL. The differences are significant at 95% level using the Student test.
Conclusion
The aim of this study was to assess the potential impact of mineral dust emissions from the Sahel–Saharan zone on the seasonal variability of temperature extremes over the Sahel. We performed two simulations: one with the reference version (standard) of the RegCM4 model and another one using the same model, in which the dust module is activated (“dust version”). The results show that the “dust version” of the model well reproduces the annual cycle of the aerosol optical depth (dust loading) in the considered stations (Dakar, Cape Verde, Banizoumbou, and Ouagadougou) with a strong positive correlation at Banizoumbou (r = 0.77) and Ouagadougou (r = 0.60) despite the underestimation of the intensity.
Furthermore, this work also highlights the fact that the accumulation of mineral dust in the atmosphere essentially causes a cooling at the surface of the Sahel domain. This cooling is stronger in MAM and JJA which coincide with periods of high dust emissions.
The analysis of dust impacts on temperature extremes shows that these mineral particles have considerable impacts on thermal extremes over the Sahel region. A decrease of temperature extremes is observed especially in the frequency of warm days over the northern and central parts of the Sahel during the DJF and MAM periods and in almost all Sahel domains during the summer season (JJA). This decrease is stronger during the warm period (MAM) and the summer season (JJA) especially in the northern and western parts of the Sahel. This is consistent with the fact that the aerosol optical depth is stronger during these two seasons. This global cooling due to dust particles leads to a decrease of the frequency of warm nights over the entire Sahel during the DJF, MAM, and JJA periods, as well as over the northeastern and central parts of the Sahel during SON. We also observe a decrease of the number of tropical nights over the southern Sahel during DJF and over the northern Sahel during MAM and SON. The effect of the mineral dust emissions is also manifested by a reduction of the warm spell days especially in MAM and JJA particularly over the northwestern and central parts of the Sahel domain. The analysis of the heat index shows that the accumulation of mineral dust into the atmosphere is to reduce the health risks particularly over the central and the northeastern parts of the Sahel during the JJA and SON periods. As for the humidex, it is characterized by a decrease especially in the northern Sahel for all seasons traducing an increase of human comfort.
Finally, the results show that the accumulation of mineral dust particles in the atmosphere decreases the warm extreme indice values over some Sahelian regions especially during the warm (MAM) and the summer seasons (JJA) suggesting that this dust loading could have a positive impact on human health particularly over the northern Sahel. Moreover, a decrease in the frequency of thermal extremes may induce a lower demand on domestic energy consumption for cooling. However, the dust accumulation in the atmosphere may favor meningitis incidence and prevalence in the region (Moreira et al., 2020).
This study could be extended to the analysis of extreme rainfall in the region. This will allow to assess the impact of the accumulation of mineral dust in the atmosphere on important climatic parameters for the agriculture and water resource management in the region such as wet and dry sequences as well as the rainfall intensity which remain a major concern for the populations and the policymakers.
Data Availability Statement
The raw data supporting the conclusions of this article will be made available by the authors, without undue reservation.
Author Contributions
ID and MC performed the design/conceptualization of the paper. ID processed the data. All the authors analyzed and discussed the results and contributed to the manuscript.
Funding
This work was supported by the Assane SECK University of Ziguinchor and the “Fond d’Impulsion de la Recherche Scientifique et Technologique” program of MESRI-Senegal. The research leading to this publication is co-funded by the NERC/DFID “Future Climate for Africa” programme under the AMMA-2050 project, grant number NE/M019969/1, by IRD (Institut de Recherche pour le Développement; France) grant number “UMR IGE Imputation 252RA5,” and by Université Assane Seck de Ziguinchor (Senegal).
Conflict of Interest
The authors declare that the research was conducted in the absence of any commercial or financial relationships that could be construed as a potential conflict of interest.
Acknowledgments
The authors would like to thank the Assane SECK University of Ziguinchor and the “Fond d’Impulsion de la Recherche Scientifique et Technologique” program of MESRI (Senegal) for their support.
Supplementary Material
The Supplementary Material for this article can be found online at: https://www.frontiersin.org/articles/10.3389/feart.2020.591150/full#supplementary-material.
References
Abiodun, B. J., Pal, J. S., Afiesimama, E. A., Gutowski, W. J., and Adedoyin, A. (2008). Simulation of West African monsoon using RegCM3 Part II: impacts of deforestation and desertification. Theor. Appl. Climatol. 93, 245–261. doi:10.1007/s00704-007-0333-1
Anderson, G. B., Bell, M. L., and Peng, R. D. (2013). Methods to calculate the heat index as an exposure metric in environmental health research. Environ. Health Perspect. 121 (10), 1111–1119. doi:10.1289/ehp.1206273
Aswathy, V. N., Boucher, O., Quaas, M., Niemeier, U., Muri, H., Mülmenstädt, J., et al. (2015). Climate extremes in multi-model simulations of stratospheric aerosol and marine cloud brightening climate engineering. Atmos. Chem. Phys. 15, 9593–9610. doi:10.5194/acp-15-9593-2015
Camara, M., Jenkins, G., and Konare, A. (2010). Impacts of dust on West African climate during 2005 and 2006. Atmos. Chem. Phys. 10 (2), 3053–3086. doi:10.5194/acpd-10-3053-2010
Curry, C. L., Sillmann, J., Bronaugh, D., Alterskjaer, K., Cole, J. N. S., Ji, D., et al. (2014). A multimodel examination of climate extremes in an idealized geoengineering experiment. J. Geophys. Res. Atmos. 119, 3900–3923. doi:10.1002/2013JD020648
Dagon, K., and Schrag, D. P. (2017). Regional climate variability under model simulations of solar geoengineering: Variability Under Solar Geoengineering. J. Geophys. Res. Atmos. 122, 12106–12121. doi:10.1002/2017JD027110
Dahutia, P., Pathaka, B., and Bhuyanb, P. K. (2018). Aerosols characteristics, trends and their climatic implications over Northeast India and adjoining South Asia. Int. J. Climatol. 38, 1234–1256. doi:10.1002/joc.5240
Dee, D. P., Uppala, S. M., Simmons, A. J., Berrisford, P., Poli, P., et al. (2011). The ERA-Interim reanalysis: configuration and performance of the data assimilation system. Quarterly Journal of the Royal Meteorology Society 137, 553–597. doi:10.1002/qj. 828
Diarra, C., and Ba, A. (2014). Analyse des paramètres optiques des aérosols atmosphériques, de leur distribution et de leur albédo de diffusion par les mesures photométriques au Mali. Afrique Science. 10, 82–97.
Diba, I., Camara, M., and Diedhiou, A. (2019). Impacts of the Sahel-Sahara interface reforestation on West African climate: intra-annual variability and extreme temperature events. Atmos. Clim. Sci. 9, 35–61. doi:10.4236/acs.2019.91003
Diba, I., Camara, M., and Sarr, A. B. (2016). Impacts of the Sahel-Sahara interface reforestation on West African climate: intra-seasonal variability and extreme precipitation events. Advances in Meteorology 2016, 3262451. doi:10.1155/2016/3262451
Dickinson, R. E., Henderson, S. A., and Kennedy, P. J. (1993). Biosphere-atmosphere transfer scheme (BATS) version 1E as coupled to the NCAR community climate model. NCAR Tech. rep. TN-387+STR, 72. doi:10.5065/D67W6959
Drame, M. S., Ceamanos, X., Roujean, J. L., Boone, A., Lafore, J. F., Carrer, D., et al. (2015). On the importance of aerosol composition for estimating incoming solar radiation: focus on the Western African stations of Dakar and Niamey during the dry season. Atmosphere 6, 1608–1632. doi:10.3390/atmos6111608
Dubovik, O., Holben, B., Eck, T. F., Smirnov, A., Kaufman, Y. J., King, M. D., et al. (2001). Variability of absorption and optical properties of key aerosol types observed in worldwide locations. J. Atmos. Sciences 59, 590–608.
Emanuel, K. A. (1991). A scheme for representing cumulus convection in large-scale models. J. Atmos. Sci. 48, 2313–2335. doi:10.1175/1520-0469(1991)048<2313:ASFRCC>2.0.CO;2
Fouquart, Y., Bonnel, B., ChaouiRoquai, M., Santer, R., and Cerf, A., (1987). Observation of saharan aerosols: results of ECLATS field experiment. Part 1: optical thicknesses and aerosol size distributions. J. Clim. Appl. Meteorol. 26, 28–37. doi:10.1175/1520-0450(1987)026<0028:OOSARO>2.0.CO;2
Fritsch, J. M., and Chappell, C. F. (1980). Numerical prediction of convectively driven mesoscale pressure systems. Part I: convective parameterization. J. Atmos. Sci. 37, 1722–1733. doi:10.1175/1520-0469(1980)037<1722:NPOCDM>2.0.CO;2
Gao, Y., Kaufman, Y. J., Tanré, D., and Falkowski, P. G. (2000). Seasonal distribution of aeolian iron fluxes to the global ocean. Geophys. Res. Lett. 28, 29–33. doi:10.1029/2000GL011926
Garland, R. M., Matooane, M., Engelbrecht, F. A., Bopape, M. J., Landman, W. A., Naidoo, M., et al. (2015). Regional projections of extreme apparent temperature days in Africa and the related potential risk to human health. Int. J. Environ. Res. Publ. Health 12 (10), 12577–12604. doi:10.3390/ijerph121012577
Ginoux, P., Prospero, J., Gill, T. E., Hsu, N. C., and Zhao, M. (2012). Global scale attribution of anthropogenic and natural dust sources and their emission rates based on MODIS deep blue aerosol products. Rev. Geophys. 50 (3), 3005. doi:10.1029/2012RG000388
Giorgi, F., Coppola, E., Solmon, F., Mariotti, L., Sylla, M. B., Bi, X., et al. (2012). RegCM4: model description and preliminary tests over multiple CORDEX domains. Clim. Res. 52, 7–29. doi:10.3354/cr01018
Grell, G. A. (1993). Prognostic evaluation of assumptions used by cumulus parameterizations. Mon. Weather Rev. 121 (3), 764–787. doi:10.1175/1520-0493(1993)121<0764:PEOAUB>2.0.CO;2
Holben, B., Eck, T., Sluster, I., Tanre, D., Buis, J., Setzer, A., et al. (1998). AERONET-A federated instrument net-work and data archive for aerosol characterization. Rem. Sens. Environ. 66 (1), 1–16. doi:10.1016/S0034-4257(98)00031-5
Holtslag, A., De Bruijn, E., and Pan, H. (1990). A high resolution air mass transformation model for short-range weather forecasting. Mon. Weather Rev. 118 (8), 1561–1575. doi:10.1175/1520-0493(1990)118<1561:AHRAMT>2.0.CO;2
IPCC. Climate Change (2001). The scientific basis. Contribution of Working Group I to the Third Assessment Report of the Intergovernmental Panel on Climate Change. Editors J. T. Houghton, Y. Ding, D. J. Griggs, M. Noguer, P. J. van der Linden, X. Dai, K. Maskell, and C. A. Johnson. (Cambridge, United Kingdom, New York, NY: Cambridge University Press), 881.
Jones, A., Haywood, J. M., Alterskjær, K., Boucher, O., Jason, N. S., Charles, L, et al. (2013). The impact of abrupt suspension of solar radiation management (termination effect) in experiment G2 of the geoengineering model Intercomparison project (GeoMIP), J. Geophys. Res. Atmos. 118, 9743–9752. doi:10.1002/jgrd.50762
Jones, C., Mahowald, N., and Luo, C. (2003). The role of easterly waves in African desert dust transport. J. Clim. 16, 3617–3628. doi:10.1175/1520-0442(2003)016<3617:TROEWO>2.0.CO;2
Karimou, B. M., and Ambouta, K. (2015). Analyse des phénomènes climatiques extrêmes dans le Sud-Est du Niger. Liège: XXVIIIèColloque de l’Association Internationale de Climatologie, 537–542.
Konaré, A., Zakey, A. S., Solmon, F., Giorgi, F., Rauscher, S., Ibrah, S., et al. (2008). A regional climate modelling study of the effects of desert dust on the West African monsoon. J. Geophys. Res. 113, D12206. doi:10.1029/2007JD009322
Kravitz, B., Robock, A., Forster, P. M., Haywood, J. M., Lawrence, M. G., and Schmidt, H. (2013). An overview of the geoengineering model Intercomparison project (GeoMIP). J. Geophys. Res. Atmos. 118, 103–13,107. doi:10.1002/2013JD020569
Li, X., Maring, H., Savoie, D., Voss, K., and Prospero, J. (1996). Dominance of mineral dust in aerosol scattering in the North Atlantic trade winds. Nature. 380, 416–419. doi:10.1038/380416a0
Liao, H., and Seinfeld, J. H. (1998). Radiative forcing by mineral dust aerosol: sensitivity to key variables. J. Geophys. Res. 103, 31637–31646. doi:10.1029/1998JD200036
Luber, G., Knowlton, K., Balbus, J., Frumkin, H., Hayden, M., Hess, J., et al. (2014). Ch. 9: Human health. Climate change impacts in the United States: the third national climate assessment, Editors J. M. Melillo, T. C. Terese, and G. W. Yohe, (Washington DC): U.S. Global Change Research Program, 220–256. doi:10.7930/J0PN93H5
Malavelle, F., Pont, V., and Mallet, V. (2011). Simulation of aerosol radiative effects over West Africa during DABEX and AMMA SOP-0. J. Geophys. Res. D. 116 (8), D08205. doi:10.1029/2010JD014829
Mariotti, L., Coppola, E., Sylla, M. B., Giorgi, F., and Piani, C. (2011). Regional climate model simulation of projected 21st century climate change over an all Africa domain: comparison analysis of nested and driving model results. J. Geophys. Res. 116, D15111. doi:10.1029/2010JD015068
Marticorena, B., Haywood, J., Coe, H., Formenti, P., Liousse, C., Mallet, M., et al. (2011). Tropospheric aerosols over West Africa: highlights from the AMMA international program. Atmos. Sci. Lett. 12, 19–23. doi:10.1002/asl.322
Meehl, G. A., and Tebaldi, C. (2004). More intense, more frequent, and longer lasting heat waves in the 21st century. Science 305, 994–997. doi:10.1126/science.1098704
Moreira, R. P., Costa, A. C., Gomes, T. F., and de Oliveira Ferreira, G. (2020). Climate and climate-sensitive diseases in semi-arid regions: a systematic review. Int. J. Publ. Health 65, 1749–1761. doi:10.1007/s00038-020-01464-6
Moron, V., Oueslati, B., Pohl, B., Rome, S., and Janicot, S., (2016). Trends of mean temperatures and warm extremes in northern tropical Africa (1961-2014) from observed and PPCA-reconstructed time series. J. Geophys. Res.: Atmosphere 121, 5298–5319. doi:10.1002/2015JD024303
Nébon, B., Drame, M. S., Sall, S. M., Bruno, K., Niang, D. N., Florent, K. P., et al. (2019). Intra-seasonal and annual variation of aerosols and their radiative impact in the sahelian zone of Burkina Faso. Atmos. Clim. Sci. 9, 62–74. doi:10.4236/acs.2019.91004
N’Datchoh, E. T., Diallo, I., Konaré, A., Silué, S., Ogunjobi, K. O., Diedhiou, A., et al. (2018). Dust induced changes on the West African summer monsoon features. Int. J. Climatol. 38, 452–466. doi:10.1002/joc.5187
Odoulami, R. C., Abiodun, B. J., Ajayi, A. E., Diasso, U. J., and Saley, M. M. (2017). Potential impacts of forestation on heat waves over West Africa in the future. Ecol. Eng. 102, 546–556. doi:10.1016/j.ecoleng.2017.02.054
Pal, J. S., Small, E. E., and Eltahir, E. A. B. (2000). Simulation of regional scale water and energy budgets: representation of subgrid cloud and precipitation processes within RegCM. J. Geophys. Res. 105, 29579–29594. doi:10.1029/2000JD900415
Perlwitz, J., Tegen, I., and Miller, R. L. (2001). Interactive soil dust aerosol model in the GISS GCM: 1. Sensitivity of the soil dust cycle to radiative properties of soil dust aerosols. J. Geophys. Res. 106, 18167–18192. doi:10.1029/2000JD900668
Peterson, T. C., Folland, C., Gruza, G., Hogg, W., Mokssit, A., and Plummer, N. (2001). Report on the activities of the working group on climate change detection and related rapporteurs 1998-2001. WMO Rep. WCDMP 47, WMO-TD 1071.
Prospero, J. M. (2002). Environmental characterization of global sources of atmospheric soil dust identified with the Nimbus 7 total ozone mapping spectrometer (TOMS) absorbing aerosol product. Rev Geo phys. 40 (1), 1002. doi:10.1029/2000RG000095
Qian, Y., Giorgi, F., Huang, Y., Chameides, W. L., and Luo, C. (2001). Simulation of anthropogenic sulfur over East Asia with a regional coupled chemistry-climate model. Tellus B. 53B, 171–191. doi:10.1034/j.1600-0889.2001.d01-14.x
Raji, K. B., Ogunjobi, K. O., and Akinsanola, A. A. (2017). Radiative effects of dust aerosol on West African climate using simulations from RegCM4. Model. Earth Syst. Environ. 3, 34. doi:10.1007/s40808-017-0295-y
Ringard, J., Dieppois, B., Rome, S., DiedhiouArona, P. T., Konaré, A., Diawara, A., et al. (2016). The intensification of thermal extremes in west Africa. Global Planet. Change. 139, 66–77. doi:10.1016/j.gloplacha.2015.12.009
Sarr, A. B., Diba, I., Basse, J., Sabaly, H. N., and Camara, M. (2019). Future evolution of surface temperature extremes and the potential impacts on the human health in Senegal. Afr. J. Environ. Sci. Technol. 13 (21), 482–510. doi:10.5897/AJEST2019.2757
Schmidt, A., Carslaw, K. S., Mann, G. W., Rap, A., Pringle, K. J., Spracklen, D. V., et al. (2012). Importance of tropospheric volcanic aerosol for indirect radiative forcing of climate. Atmos. Chem. Phys. 12, 7321–7339. doi:10.5194/acpd-12-8009-2012
Simmons, A. S., Uppala, D., and Kobayashi, S. (2007). ERA-Interim: new ECMWF reanalysis products from 1989 onwards. ECMWF Newsletter. 110, 29–35. doi:10.21957/pocnex23c6
Solmon, F., Giorgi, F., and Liousse, C. (2006). Aerosol modelling for regional climate studies: application to anthropogenic particles and evaluation over a European/African domain. Tellus B. 58 (1), 51–72. doi:10.1111/j.1600-0889.2005.00155.x
Solmon, F., Elguindi, N., and Mallet, M. (2012). Radiative and climatic effects of dust over West Africa, as simulated by a regional climate model. Clim. Res. 52, 97–113. doi:10.3354/cr01039
Solmon, F., Mallet, M., Elguindi, N., Giorgi, F., Zakey, A., and Konaré, A. (2008). Dust aerosol impact on Regional Precipitation over western Africa, mechanisms and sensitivity to absorption properties. Geophys. Res. Lett. 35, L24705. doi:10.1029/2008GL035900
Steadman, R. G. (1979). The assessment of sultriness. Part I: a temperature-humidity index based on human physiology and clothing science. J. Appl. Meteorol. 18, 861–873. doi:10.1175/1520-0450(1979)018<0861:TAOSPI>2.0.CO;2
Sylla, M. B., Dell’Aquila, A., Ruti, P. M., and Giorgi, F. (2010). Simulation of the intraseasonal and the interannual variability of rainfall over West Africa with a RegCM3 during the monsoon period. Int. J. Climatol. 30, 1865–1883. doi:10.1002/joc.2029
Tanré, D., Haywood, J., Pelon, J., Léon, J. F., Chatenet, B., Formenti, P., et al. (2003). Measurement and modeling of the saharan dust radiative impact: overview of the saharan dust experiment (SHADE). J. Geophys. Res. 108(D13), 8574. doi:10.1029/2002JD003273
Tilmes, S., Garcia, R. R., Kinnison, D. E., Gettelman, A., and Rasch, P. J. (2013). Impact of geoengineered aerosols on the troposphere and stratosphere, J. Geophys. Res. 114, D12305. doi:10.1029/2008JD011420
Uppala, S., Dee, D., Kobayashi, S., Berrisford, P., and Simmons, A. (2008). Towards a climate data assimilation system: status update of ERA-Interim. ECMWF Newsletter 115, 12–18. doi:10.21957/byinox4wot
Willett, K. M., and Sherwood, S. (2012). Exceedance of heat index thresholds for 15 regions under a warming climate using the wet‐bulb globe temperature. Int. J. Climatol. 32 (2), 161–177. doi:10.1002/joc.2257
Zakey, A. S., Solmon, F., and Giorgi, F. (2006). Implementation and testing of a desert dust module in a regional climate model. Atmos. Chem. Phys. 6, 4687–4704. doi:10.5194/acp-6-4687-2006
Zeng, X., Zhao, M., and Dickinson, R. E. (1998). Intercomparison of Bulk aerodynamic algorithms for the computation of sea surface fluxes using TOGA COARE and TAO data. J. Clim. 11, 2628–2644.
Keywords: RegCM4, climate modelling, mineral dust, temperature extremes, Sahel
Citation: Diba I, Basse J, Ndiaye M, Sabaly HN, Diedhiou A and Camara M (2021) Potential Dust Induced Changes on the Seasonal Variability of Temperature Extremes Over the Sahel: A Regional Climate Modeling Study. Front. Earth Sci. 8:591150. doi: 10.3389/feart.2020.591150
Received: 03 August 2020; Accepted: 07 December 2020;
Published: 21 January 2021.
Edited by:
Xing Yuan, Nanjing University of Information Science and Technology, ChinaReviewed by:
Dingwen Zeng, Lanzhou Institute of Arid Meteorology, ChinaFengxue Qiao, East China Normal University, China
Copyright © 2021 Diba, Basse, Ndiaye, Sabaly, Diedhiou and Camara. This is an open-access article distributed under the terms of the Creative Commons Attribution License (CC BY). The use, distribution or reproduction in other forums is permitted, provided the original author(s) and the copyright owner(s) are credited and that the original publication in this journal is cited, in accordance with accepted academic practice. No use, distribution or reproduction is permitted which does not comply with these terms.
*Correspondence: Moctar Camara, bW9jdGFyLmNhbWFyYUB1bml2LXppZy5zbg==