 Natalia Zamora
 Patricio A. Catalán
 Alejandra Gubler
 Matías Carvajal
- 1Barcelona Supercomputing Center ‐ Centro Nacional de Supercomputacién, Barcelona, Spain
- 2Research Center for Integrated Disaster Risk Management (CIGIDEN), Santiago, Chile
- 3Departamento de Obras Civiles, Universidad Técnica Federico Santa María, Valparaíso, Chile
- 4Centro Científico Tecnológico de Valparaíso (CCTVal), Valparaíso, Chile
- 5Millennium Nucleus the Seismic Cycle Along Subduction Zones (CYCLO), Valdivia, Chile
- 6Programa de Doctorado en Ciencias Geológicas, Facultad de Ciencias Químicas, Universidad de Concepción, Concepción, Chile
Tsunami hazard is typically assessed from inundation flow depths estimated from one or many earthquake scenarios. However, information about the exact time when such inundation occurs is seldom considered, yet it is crucial for pedestrian evacuation planning. Here, we propose an approach to estimating tsunami hazard by combining tsunami flow depths and arrival times to produce a nine-level, qualitative hazard scale that is translated into a simple tsunami hazard map. To do this, one of the most populated regions of the coast of Chile is considered as the sample site, using a large set of 2,800 tsunamigenic sources from earthquakes with magnitudes in the range
1 Introduction
Tsunamis are natural events that can have a range of disastrous consequences, such as loss of life (Doocy et al., 2013), damage to infrastructure (Charvet et al., 2017; UNISDR, 2018), and triggering morphological changes that can affect the sustainability of coastal environments and communities (Morton et al., 2011; Atwater et al., 2013; Catalán et al., 2015; Hoang et al., 2018; Imamura et al., 2019). Moreover, tsunamis can spread over large portions of the ocean basins where they occur, and their hydrodynamic behavior can vary significantly along the affected coasts. The triggering of a tsunami can be due to several processes, some of which are not yet fully understood, and the capability to forecast the inundation following a known tsunami source is still undergoing active research.
Partially due to recent tsunami-related disasters, tsunamis have been increasingly recognized by coastal communities throughout the world as potential hazards that need to be accounted for to mitigate the associated risk. The safest approach to minimize risk would be to relocate outside the inundation zone, which would yield zero exposure, yet would be a costly measure and is thus, to some extent, unlikely. Since redesigning coastal settlements is not usually a feasible option, evacuation planning is necessary for risk and loss of life minimization. Indeed, it has been shown that evacuation is the most effective measure to reduce casualties during tsunami events (McAdoo et al., 2006; Makinoshima et al., 2020). As demonstrated by past tsunamis, wave heights, inundation flow depths and inland extent, and arrival times can vary substantially over horizontal spatial scales of a few hundred meters. This means that risk, as a result of exposure and other dependencies, likewise varies over short spatial scales, and should thus be assessed with the corresponding resolution.
To characterize risk, the required first step is to obtain an estimate of the tsunami hazard, both in terms of its magnitude and recurrence. Aided by progressively increasing computational capacities due to new hardware and software, as well as novel numerical implementations, state-of-the-art tsunami numerical models allow for a large number of computations in shorter time, even when the modeling considers tsunami generation, propagation and inundation (e.g. Yamazaki et al., 2009; LeVeque et al., 2011; Macías et al., 2017). As a result of the improved numerical performance, the once standard method of estimating the tsunami hazard based on single (or small number of) worst credible scenarios (Scenario-Based Tsunami Hazard Assessment SBTHA, Tinti et al., 2011; Harbitz et al., 2013) is being gradually superseded by Probabilistic Tsunami Hazard Assessments that considers multiple scenarios with stochastically defined slip distributions (PTHA, e.g. Geist and Parsons, 2006; LeVeque et al., 2016; Park and Cox, 2016; De Risi and Goda, 2017; Davies et al., 2017; Volpe et al., 2019). In the latter, different sources of uncertainty can be included, especially those regarding recurrence rates, source variability and complexity (Grezio et al., 2017; Mori et al., 2018; Sepúlveda et al., 2018).
Regardless of the procedure to generate data, the tsunami hazard assessment follows two steps. First, it is based mostly on tsunami intensity metrics such as the tsunami peak coastal amplitudes (offshore) or inland flow depths. Ideally, other quantities such as tsunami momentum fluxes or velocities should be included also. Second, these tsunami intensity metrics are treated independently, and the focus is set on extreme values. The reason for this is obvious, considering that amplitude and flow depth can be correlated with the damage potential of the event. In some countries like Chile, evacuation plans are derived only from the information available on the tsunami hazard maps, which typically depict the flow depth in meters as a measure of the hazard, which can be difficult to interpret (Cubelos et al., 2019). Moreover, in the Chilean case, these maps are often derived from single scenario modeling (SHOA, 2012), and therefore, they may not consider the unavoidable uncertainties of the tsunami sources.
While considering hydrodynamic quantities such as the flow depths has implications for structural design, it can be less relevant for evacuation purposes, where the tsunami arrival time is of great significance. Yet, arrival times are seldom accounted for in tsunami evacuation maps (Wood and Schmidtlein, 2013), which possibly stems from the notion that evacuation should be instantaneous. While large flow depths obviously can seriously hamper evacuation, it should be noted that evacuation can also be affected when amplitudes or flow depths are small. Even flows of a few decimeters high can block routes, alter the psychological behavior of people, and even hurt them if the flow comes with debris and large speeds. Therefore, it could be argued that arrival time should be the only quantity of interest. However, flow depths are also relevant for the purpose of evacuation planning. Spatial information of flow depths is important for the design process of evacuation routes, (e.g. orientation and routing), or placement and design of potential vertical evacuation shelters. However, despite having detailed information about flow depths, current hazard maps tend to treat it in a binary way, that is, as a proxy to identify whether it is required to evacuate or not (León et al., 2018; Cubelos et al., 2019). Having a high level of detail for flow depths does not necessarily lead to improved insights, as they do not provide sufficient information for the decision on when to evacuate nor provide an estimate of how long it is required to remain outside the inundated area.
To overcome these deficiencies, evacuation studies resort to using agent-based modeling coupled with detailed, phase resolving tsunami modeling (e.g., León et al., 2020, among others). The downside is that, due to the high computational burden, only a small number of scenarios is usually considered, and the results become scenario-dependent and decoupled from the hazard map. Relying on single scenarios for evacuation planning appears to be a step back from the benefits gained by carrying out probabilistic tsunami hazard assessments that accounts for uncertainties of the tsunami sources. For purposes such as integral risk management, it will be useful to incorporate the tsunami arrival time as an additional intensity measure (Park and Cox, 2016; Park et al., 2018). However, providing hazard probabilities may hinder the ability to convey these results in a straightforward manner, which may lead to a lack of awareness or understanding of local tsunami risk by the population, thus hampering tsunami evacuation preparedness.
Tsunami arrival times also vary between events in the same region. The tsunamigenic zone width in Chile (distance between the trench and the coastline) is among the smallest in the world, resulting in very short propagation times. A country-wide assessment by Williamson and Newman (2019) yields times of 15–20 min or less. This has been observed empirically: during the 2010
Such challenges have been identified along the central zone of Chile (Zamora et al., 2020), an area that hosts a large coastal population and is highly exposed to large earthquakes (Martínez et al., 2020). From this follows the need to account for standard tsunami intensity metrics (such as flow depth) as well as very short expected arrival times (e.g., Williamson and Newman, 2019). The goal of the present study is to evaluate the benefit of coupling these metrics as a way to improve tsunami hazard assessment and mapping. This is done within the context of a proof-of-concept case study based on some aspects of seismic probabilistic tsunami hazard analysis (SPTHA; Lorito et al., 2015) and a hybrid aggregated-scenario approach (e.g., González et al., 2020). In particular, the aim is to introduce an approach to microzone tsunami hazards based on the hybrid distribution of flow depth and arrival time in the populated coastal cities of Viña del Mar and Valparaíso. For illustration purposes, a set of 2,800 synthetic earthquake ruptures was generated and used as input for numerical simulations of tsunami inundation along the region.
The paper is structured as follows: In Section 2, the methods and data used to achieve the objectives are described. In Section 3, results of the source characterization used for tsunami modeling and the numerical tsunami flow depth and arrival time outcomes are explained. Finally, in Sections 4 and 5, the discussion of the main findings and the conclusions are given.
2 Data and Methods
Tsunami hazard assessment relies on the proper characterization of the potential tsunamigenic sources (e.g., earthquakes, submarine or subaerial mass movements, etc.,). In this paper, only tsunamis triggered by seismic sources along the subduction megathrust are considered. While this could limit the scope of the tsunami hazard assessment performed, it is considered sufficient for illustrating the proposed approach. The overall procedure follows the workflow shown in Figure 1. First, an area of interest is identified where earthquakes are expected to occur. Next, the seismic source is characterized, leading to the generation of multiple scenarios considering a stochastic distribution of slip and an appropriate range of magnitudes. For each scenario, the initial sea-surface displacement is computed from regularly used elastic dislocation models. These displacements are treated as initial conditions for tsunami numerical modeling, from propagation to inundation, using high-resolution topographic and bathymetric computational grids. From these numerical simulations, the tsunami flow depths and arrival times are obtained. These tsunami intensity metrics are analyzed and integrated into an hybrid tsunami hazard microzoning map. The quantitative categorizations of each metric, microzoning map evaluated independently, are then combined to produce a qualitative characterization of the hazard. The details of these steps and their implications are discussed below.
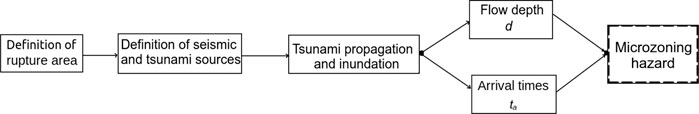
FIGURE 1. Flowchart summarizing the overall procedure used in this study.
2.1 Definition of Seismic and Tsunami Sources
A high tsunamigenic potential due to megathrust earthquakes exists offshore of the cities of Valparaíso and Viña del Mar, in Central Chile, where regions of high frictional strength have been identified (Sippl et al., 2020). The expected rupture zone roughly coincides with the most populated coastal zone of metropolitan Chile (Figure 2), including the cities of Viña del Mar and Valparaíso, which are home to about 40,000 people that live within the inundation zone. Their population increases significantly during the summer season, increasing risk (data available at http://siedu.ine.cl).
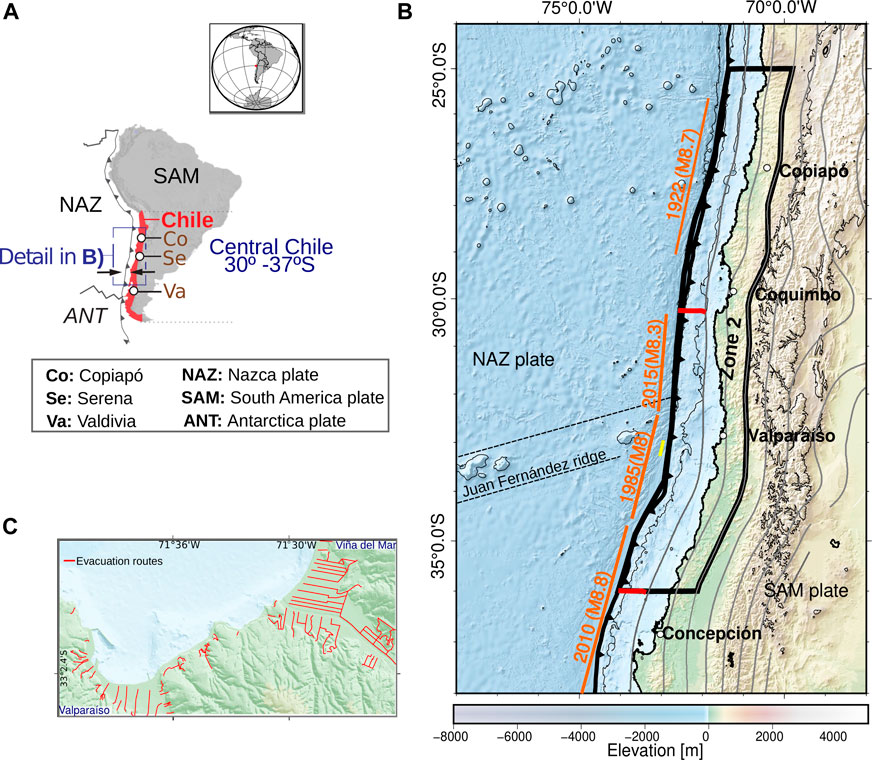
FIGURE 2. Tectonic setting, seismic source zone and study area. (A) Regional map of South America showing the subduction zone formed between the Nazca and South America plates that converge at 6–7 cm/yr (B) Seismic source zone. The black polygon demarcates the Zone 2 from Poulos et al. (2019), where 2,800 seismic sources with stochastic slip distributions were generated. For reference, thin grey lines show Slab 1.0 depth contours every 20 km (Hayes et al., 2012). Orange lines show the along-strike extent of selected earthquake ruptures from 1900–2020, and the 1730 rupture estimated by Carvajal et al. (2017a) is shown in red (C) Digital elevation model of Valparaíso and Viña del Mar coastal cities. The red lines show the official tsunami evacuation routes.
At least 11 earthquakes with magnitudes larger that
While a complete SPTHA in this region is required, a recent study has estimated the tsunami hazard in central Chile based on the potential rupture of only very large magnitude events (Becerra et al., 2020), by generating seismic scenarios over a rupture area similar to or larger than that of the 1730 Valparaíso earthquake (Carvajal et al., 2017a). A broader range of magnitudes will need to be considered, which includes also smaller magnitudes, and a full range of uncertainties. It should be noted that the goal of this study is not to conduct a full SPTHA, which essentially follows other goals and takes into account additional uncertainties. However, future SPTHA efforts could follow the same basic approach as presented here.
For the present study, an extensive rupture area is considered, over which great earthquakes of magnitudes ranging from
To generate the set of scenarios, the fault region is discretized into 505 rectangular sub-faults with dimensions of 22 × 22 km along strike and downdip. The Karhoenen-Loeve expansion is used to generate aleatory slip distributions (LeVeque et al., 2016; Melgar et al., 2016). This is done to account for epistemic and aleatory uncertainties due to intra-event variability, i.e., the range of possible slip distributions for events of the same magnitude. The approach departs from SPTHA in the sense that the recurrence, or the probability of a target magnitude earthquake to occur in a given time window, is not considered, and all scenarios have the same weight. It is not intended to address the probability of occurrence for a certain flow depth or arrival time, but the focus is on evaluating what to do in case it occurs.
For each rupture scenario, a tsunami initial condition is obtained based on its respective coseismic seafloor displacement, which is modeled to be equivalent to the free sea-surface displacement, under the assumption of incompressible water and instantaneous rupture (Kajiura, 1970). Although this simplification may not completely hold in reality, this approach should be a reasonable first-order approximation. Seafloor and land deformation were computed with the analytical solutions of a rectangular source given by Okada (1985). The total sea-surface displacements, which were used as the initial conditions for tsunami modeling, were approximated by superposing the displacements of each subfault. Although the horizontal displacement of the inclined seafloor may contribute to the total sea-surface displacement (Tanioka and Satake, 1996), here only the vertical deformation of the upper plate is considered, since it has been suggested to control the tsunami generation in the study area (Bletery et al., 2015). For the purpose of retrieving accurate arrival times, the use of an instantaneous rupture can introduce an error owing to the finite rupture propagation velocity. For the size of the sources considered here, it was estimated that the error would be at most
2.2 Tsunami Numerical Modeling
For each tsunami source, the inland flow depths and arrival times are computed using the tsunami modeling software Tsunami-HySEA (Macías et al., 2017). Tsunami-HySEA solves the two-dimensional shallow-water equations (NLSWE) using a high-order path-conservative finite volume method. Values of instantaneous water depth h, and momentum fluxes
High-resolution bathymetric and topographic computational grids were produced. A topo-batyhmetric elevation model was created using data from the General Bathymetric Chart of the Oceans (GEBCO, 2019), nautical charts from the National Hydrographic and Oceanographic Service of the Chilean Navy (SHOA, by its Spanish acronym), local cartography and ALOS World 3D-30 m (AW3D30) elevation data (Tadono et al., 2014). The coordinate reference system was in geographical coordinates referenced to ellipsoid WGS84, and the vertical datum was set to the local mean sea level. Due to the 1.8 m microtidal range, the tide level is kept constant for simplicity, although it could be considered an additional source of uncertainty. The computational grids were generated using triangular irregular networks, and Delaunay triangulation was used to interpolate to a uniform grid among different sources. Four nested regular grids were generated, with resolutions of 30, 7.5, 1.875 and 0.234 arc seconds (∼925, ∼230, ∼55 and ∼10 m), respectively, as shown in Figure 3. The finest grid covers the urban area of the cities of Valparaíso and Viña del Mar. A constant Manning’s roughness coefficient was set to
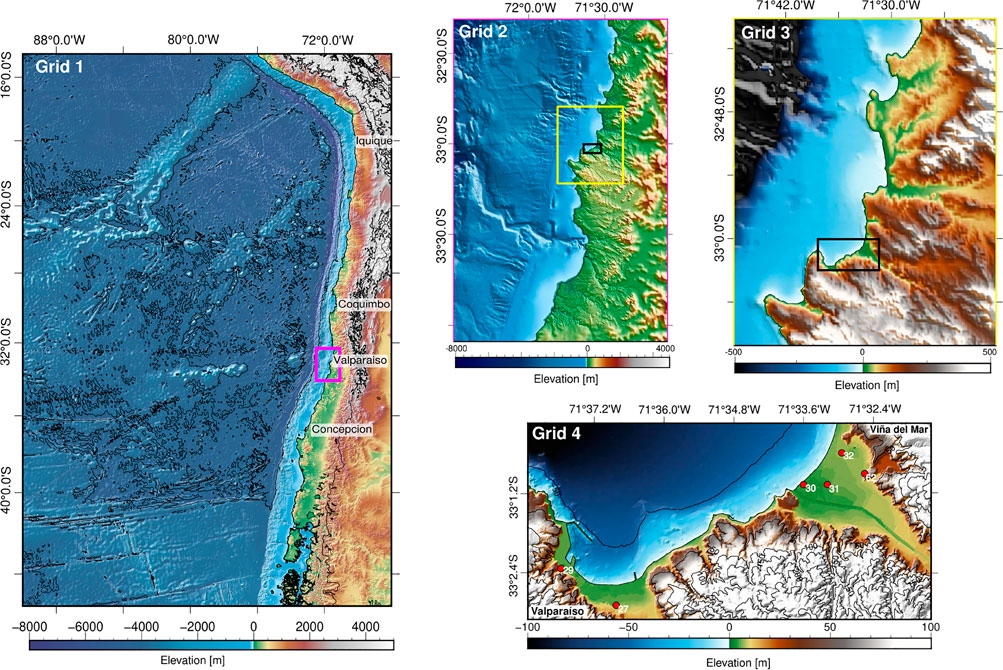
FIGURE 3. Nested digital elevation models used in the numerical simulations. The colorbar stands for the terrain elevation with resolutions of 30 arcsec (grid 1), 7.5 arcsec (grid 2), 1.875 arcsec (grid 3) and 0.234 arcsec (grid 4). Red points show the points of interest where tsunami arrival times are analyzed.
2.3 Assessment of Tsunami Inundation Metrics
Time series of inundation flow depth
This approach, at least initially, imposes constraints similar to simplified SPTHA methods that consider inundation (e.g., those of Lorito et al., 2015; Sepúlveda et al., 2018). But, unlike those, no subsampling to reduce the computational burden is applied because arrival times can be controlled by aspects such as relative orientation and relative distance to the slip patches. This may preclude clustering and linearization, and instead makes it necessary to perform inundation modeling with the complete catalog of synthetic scenarios.
The focus of the present study is to produce relevant information for evacuation planning. This goal definition controls the hierarchy among the variables, and also the rationale behind selecting a representative value among all scenarios and modeled quantities. For evacuation purposes, the earliest arrival at each cell among the set of scenarios is considered as the worst situation. Similarly, the worst case would be the maximum flow depth. Hence, each time series of flow depth
Tsunami hazard maps usually convey information about flow depth, measured discretely in length units, (e.g. meters) with some level of discretization. This can be counterintuitive and difficult to interpret as to its implications. In contrast, the approach used for some tsunami warning systems is to characterize the hazard based upon peak tsunami coastal amplitudes estimated closely offshore. The use of actual numerical values is discarded in favor of a categorization based on thresholds, as it is then possible to relate it univocally to an evacuation action to be performed by the population. This is the case, for instance, of the tsunami warning system in Chile, where the tsunami hazard analysis identifies four hazard levels that are associated with three different evacuation actions (Catalán et al., 2020):
where
No equivalent metric or categorization exists for the inundation flow depth, as it has been implicitly assumed that any inundation level is hazardous enough to prompt evacuation. Moreover, no categorization exists for the arrival time either, as it has been assumed that evacuation needs to occur immediately, regardless of when the inundation takes place. Here it is hypothesized that coupling these parameters can produce relevant information for a more detailed analysis of evacuation strategies. Also, it could lead to maps that could be easier to interpret by the general public.
Therefore, as a first step, it is proposed to categorize the final set of flow depth and arrival time values, using a nine-level qualitative hazard scale, from A1 (least hazardous) to C3 (most hazardous), as shown in Table 1. These levels result from the combination of the hazard levels as established in the Informative, Advisory and Watch levels, defined in Eq. 1, now mapped as values 1, 2 and 3, respectively, with a new classification of the arrival time.
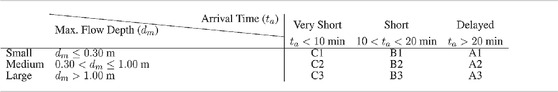
TABLE 1. Classification of hazard levels.
The temporal thresholds presented in Table 1 were defined arbitrarily, and could be subject to modification depending on the location and/or objectives of the assessment. Here, we use as first reference the expected issuance of the first assessment by the Chilean Tsunami Warning System in Chile (about 8 min, which is rounded up to 10 min), and twice that time. These threshold values are consistent with arrivals observed during past tsunamis in Chile, and with observed and modeled evacuation times in the area (León et al., 2020). These are denoted by letters, from A to C (least to most hazardous). The applied hierarchy gives more relevance to the arrival time compared to flow depth. Hence, a very early arrival with small flow depth, (i.e. C1), is considered more hazardous for evacuation than an early arrival with large amplitude, (i.e. B2). This is based upon the consideration that even flow depths as low as 70 cm with 1.3 m/s flow speeds can already put under threat a pedestrian (Koshimura et al., 2006), and the tsunami fatality rate is highly increased when inundation depths exceeds 2 m according to fragility curves (Koshimura et al., 2009). While this hazard ranking is arbitrary, for the present goal it is proposed as a baseline scheme that could be further developed if deemed necessary. For completeness, alternative thresholds were tested and are shown in the (Supplementary Table S1, S2), which do not alter the main conclusions of this work.
3 Results
3.1 Source Characterization and Tsunami Modeling
Before analyzing the resulting hazard maps, it is relevant to first evaluate the data that supports them. The statistics of the slip distributions used as initial conditions for the tsunami modeling are thus reviewed. In Figure 4A, a sample scenario is shown, where a relatively shallow and concentrated peak slip area is observed, with a maximum slip value that exceeds 15 m. This particular value is slightly lower than the 19 m estimate of offshore slip deficit accumulated since the last large earthquake in 1730 (Carvajal et al., 2017a), considering a convergence rate of about 6.5 cm/yr. This source does not feature slip in the entire considered seismogenic domain, which allows for the rupture size adjustment according to scaling laws (Blaser et al., 2010). This was the intended behavior of the scenario generation algorithm for producing earthquakes with different magnitudes.
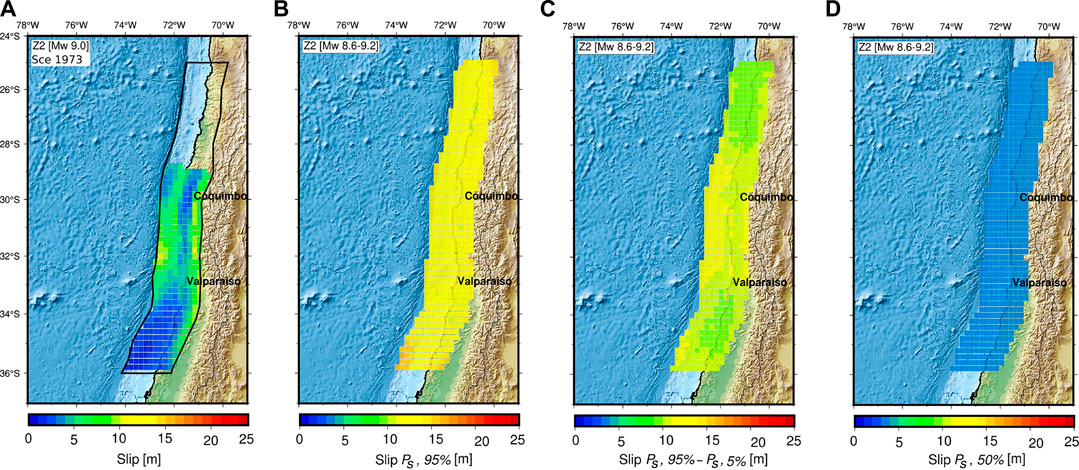
FIGURE 4. Statistics of the slip distribution estimated at each cell including all seismic scenarios generated using the K-L expansion for the range
The randomness and variability of slip across all scenarios are illustrated in other panels (Figure 4B–D). Since slip is always positive, data are not Gaussian distributed. Hence, non-Gaussian statistics will be used. All data at each cell are sorted and normalized, and the local cumulative distribution function,
The spatial statistics for coseismic slip are shown in Figures 4B–D. The
Figure 5 shows the results of tsunami inundation at Viña del Mar and Valparaíso, in a way that aggregates information from all simulated scenarios. For instance, Figure 5A shows the envelope of maximum flow depths,
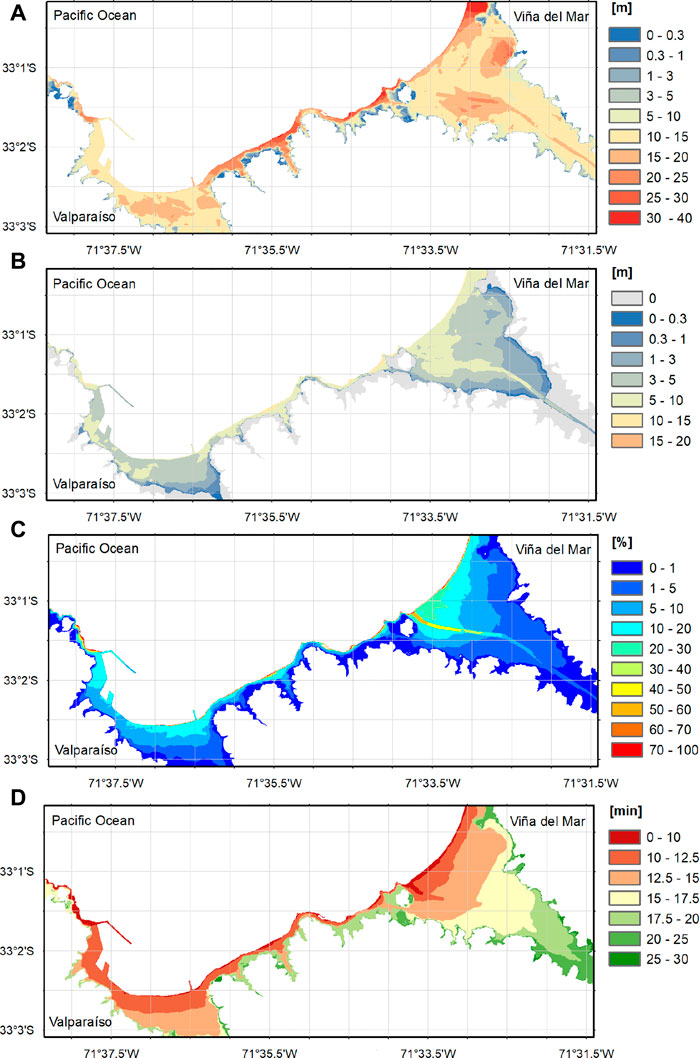
FIGURE 5. Maps of inundation statistics at Valparaíso and Viña del Mar: integration of all scenarios between
These results focus on the absolute maximum at each cell, which is usually the quantity of interest. Figure 5B shows the
Figure 5D shows the spatial distribution of the envelope of the minimum arrival time,
3.2 Hazard Microzoning
Based on these data, the categorization and thresholds presented in Table 1 are applied to the ensemble of 2,800 scenarios. Figure 6, top row, shows the categorization (Cat.) based solely on the flow depth, where these flow values larger than 1 m (Cat. 3) cover most of the map, resulting in rather uniform maps. This may be taken to imply that the whole area should be treated equally, and that the same evacuation response should be triggered during an emergency. Hence, this map can be further simplified to a binary map for evacuation planning purposes. The use and categorization of arrival time leads to a similar result (middle panel), where most of the arrivals are Cat. B (between 10 and 20 min), again resulting in uniform maps. Just a small area near the river entrance in Viña del Mar, and west of the breakwater in Valparaíso, show very early arrivals (Cat. C, <10 min). Note that this breakwater is intended to protect the port from wind waves, and there were no tsunami considerations in its design. In fact, no coastal defenses that target tsunami mitigation exist in this area.
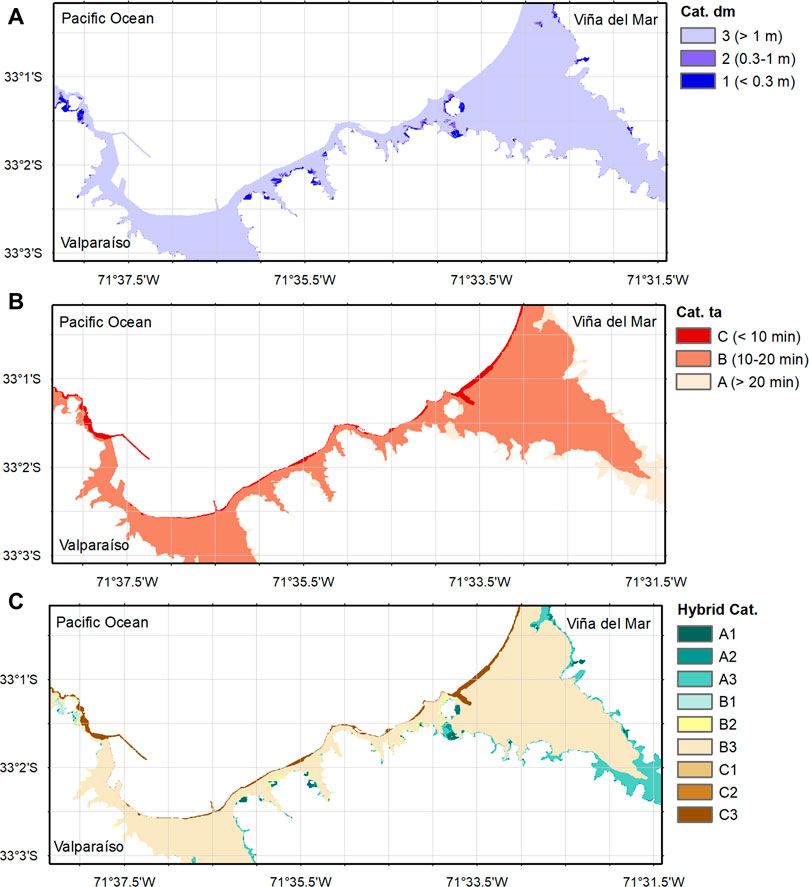
FIGURE 6. Application of categorization thresholds to qualify hazard (A) Hazard levels based on tsunami flow depth (B) Hazard levels based on tsunami arrival time (C) Hybrid categorization hazard levels. Thresholds for each case are defined in Table 1. Refer to Fig. S10 in the Supplementary Material where the fraction of events in each hazard level is shown, and Figs. S11‐S17 to see the categorization for each Mw.
The hybrid categorization proposed in this work is presented in the bottom row of Figure 6. The extent is the same as in the other maps, adding no information as to which locations need to be evacuated. However, the combined use of both parameters adds an extra layer of detail that can provide significant information. For example, some small areas that yield large amplitudes have been classified as Cat. A3 (dark green), because of the large inundation depths (>1 m) and relatively late arrival inundation times (>20 min). Regions of extreme hazard are identified as Cat. C3 (dark brown) near the river entrance and northwest of the port. However, most areas are classified as level B3 (pale brown). At first glance, it may seem as if this categorization is not sufficiently informative compared to the original maps. The B3 level likewise suggests that the tsunami is not only large but will also arrive slightly later (between 10–20 min). In the following, the consequences of the proposed mapping are analyzed.
4 Discussion
4.1 Implications for Evacuation Procedures
Typically, tsunami hazard maps are presented in terms of flow depth values, consistent with the notion that flow depth is the main driver of tsunami damage, at least to first order. Yet, within the context of evacuation, the relevant variable is the time difference between evacuation and arrival time, which needs to be maximized. The premise of evacuation studies is that a person is considered under threat once the tsunami arrives first, (i.e. before evacuation is completed), regardless of its flow depth. While this concept may be debated, it is notably decoupled from the parameter flow depth. Evacuation strategies, on the other had, usually attempt to promote instantaneous evacuation, ideally triggered by the earthquake itself (self-evacuation) or by alarms issued by authorities. Within the context, it is relevant to know the extent of the inundation zone, and promote instantaneous evacuation inside it. A binary map could suffice for this.
Real-world evacuation processes, in contrast, cannot be accomplished instantaneously. Travel times to safe ground vary dramatically depending on several factors, such as topography, road connectivity, blockages, criteria to define “safe zones”, and others. For the study area, León et al. (2019b) and León et al. (2020) noted that many areas of Viña del Mar are too far away to reach the high ground defined as “safe zones” (up to 48 min). This is shown in detail in Figure 7, where official evacuation routes and safe zones are presented. National guidelines indicate evacuation sites have to be located above the 30 m terrain contour, shown in green in Figure 7. This contour is generally located relatively far from the inundation zone, thus requiring long travel times for some residents. To illustrate this, tsunami arrival time and the expected behavior of the population to an alert, in case that people are located close to the beach area, is examined for three starting points within the C3 zone. These starting points are denoted by orange squares in Figure 7, where dashed red lines highlight the suggested evacuation routes according to the evacuation map. If a person departs from starting point S15, the route along 15 Norte should be followed for 1.0 km to arrive at the M1 safe zone. A second person, located in S08 would be required to walk 1.9 km before reaching the M2 safe zone as per the current evacuation recommendations. Critically, a person located in site S02 would have to walk about 2.7 km in order to arrive at the M3 evacuation site. As shown by the tsunami arrival time (shown in black contour lines), after 15–20 min, maximum flow depths of
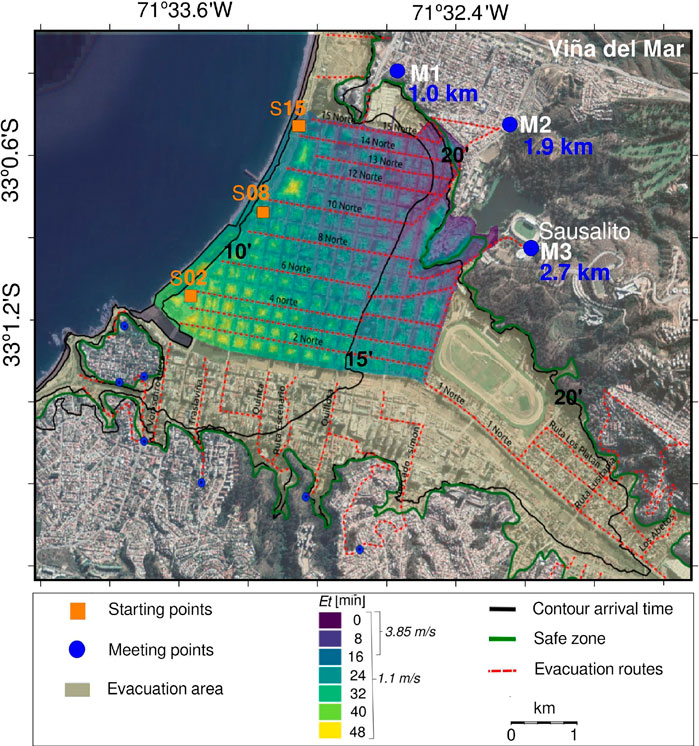
FIGURE 7. Map comparing evacuation times (shown with the colored grid) and distances to tsunami arrival times for Viña del Mar. Black contours represent tsunami arrival time isolines. Orange squares show three example starting points (S02, S08, S15) for persons to be evacuated, for estimating their distances to the three corresponding meeting points M1, M2 and M3; Et: pedestrian evacuation times according to the shortest routes from León et al. (2019b). Evacuation route (red) locations have been retrieved from: https://www.onemi.gov.cl/mapas/region/valparaiso/.
Including tsunami arrival times in hazard estimation is thus essential, but it does not suffice to drive evacuation planning. Using time alone neglects the effect of the magnitude of the tsunami. When arrival times are combined with flow depths, as in the present proposal, a more detailed zoning arises. This allows for further analyzing the connectivity of evacuation routes, and even the placing of evacuation infrastructure (e.g., for vertical evacuation). In the example, some of the Cat. C3 areas are located near Cat. A1 or Cat. B1 areas. This is relevant, because it means that properly designed vertical evacuation infrastructure could be located in these Category. One zones. While these areas are still subject to inundation, it occurs with smaller flow depths and late arrivals, which could result in reduced pedestrian evacuation both in distance and time. Of course, this would require proper design of said infrastructure. Another alternative worth considering could be a shift of meeting points, with people traversing over zones not foreseen now. For instance, from the vicinity of point S02, to the nearby hill (see Figure 7), if the safeness of the evacuation route is previously guaranteed. These hybrid maps illuminate other viable options that may not be derived when only the flow depth is taken into account.
One apparent downside is that most of the area in the hybrid categorization map (Figure 6C) falls into a single category, B3. Although this is not ideal, it is also not a severe handicap. León et al. (2018) carried out an exercise where additional evacuation shelters were placed within the inundation zone, greatly improving safe evacuation. Their rationale for locating these additional vertical evacuation sites was based on structural and building type considerations. Based on our results shown in the hybrid map, additional vertical evacuation could have been carried out in locations close to the orange squares in Figure 7. For this purpose, it is not useful to locate additional evacuation sites in the A3 or B3 areas, but possibly in an A2 or B2 area, since there would be shorter pedestrian travel times, with less risk of damage due to the smaller flow depth. It is thus hypothesized that planning exercises can be greatly improved using this hybrid mapping approach, without the need to use costly single scenario models that do not cover all possibilities.
Note that the proposed map is not aimed to be used during an evacuation, but in advance of it. The design of the map is based upon considerations that need to be coordinated with decision and/or policy makers. The more clear the definition of thresholds of the hazard variables and time arrivals, based on elicitation with authorities, will ensure more practical use on decision making. Arrival times vary between locations, and early arrivals can be defined in accordance to local values and evacuation times. A second important aspect is the hierarchy that has been imposed on the data, with the proposed categorization giving precedence to arrival time over flow depth. The rationale for this is based on the understanding that even a small flow depth could hamper evacuation. Nevertheless, the matrix-style categorization used here may be rearranged upon further considerations and analysis, e.g., during a systematic process of elicitation with authorities. A sensitivity analysis on this regard was performed (refer to Supplementary Figures S18, S19), which results in changes to the map. Nevertheless, it was found that the usefulness of the presented methodological approach is not affected by these decisions.
Once thresholds and hierarchies are defined, the next step is to quantify the hydrodynamic variables. While the relevance and definition of maximum flow depth is well established and thus does not necessitate further analysis, time of arrival is a metric that has a relatively loose definition. For the present case, it was identified as the instance when a zero flow depth becomes non-zero for the first time, regardless of its amplitude. Other criteria could consider the first time a flow depth threshold is exceeded, or the timing of the maximum flow depth. To study the effect of these decisions, all 2,800 time series at a selected point in the region C3 are analyzed. Figure 8A shows individual flow depth time series normalized by their maxima, and their mean and standard deviation (after removing zero flow depth series). The time axis of each series has been shifted by subtracting the arrival time, so all series have a common time domain. The time series are characterized by sharp fronts once the wave first inundates the shoreline. Although the maximum does not necessarily occur during the first wave, the difference between the time of the maximum and the recorded arrival time is typically less than 3 min, as shown by the histogram in Figure 8B. Thus, for the present case, the definition of the threshold of inundation depths to determine the arrival time is not very important. However, choosing a lower amplitude threshold would make the method and the resulting map more conservative for evacuation planning, which is recommended.
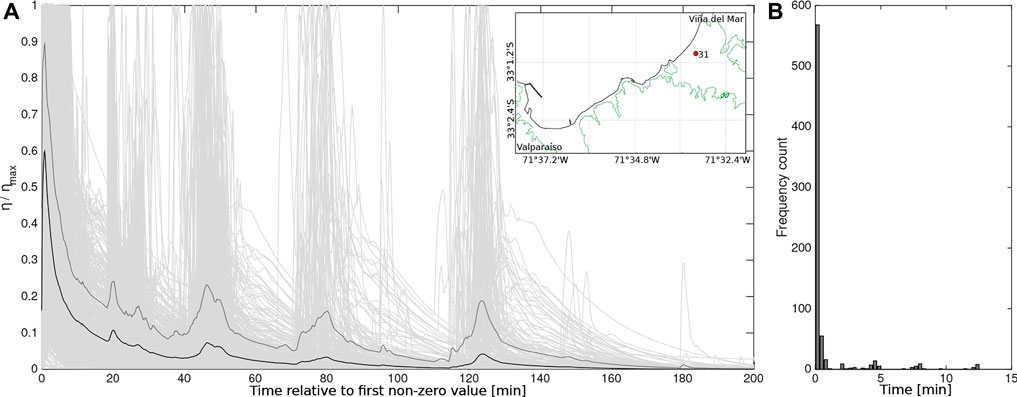
FIGURE 8. Arrival times at point of interest (POI) ID 31 (A) Time series of the normalized flow depth of 2,800 scenarios recorded at POI 31 shown in the inset map. The assessment is done considering inland arrival with time relative to the first non-zero value. Black line shows the mean and darker grey shows the standard deviation (B) Frequency of the time difference between the maximum amplitude arrival and the first amplitude arrival at POI 31.
4.2 Scenario Contributions to the Hazard Mapping
The presented approach to producing hazard maps departs from a deterministic, scenario based framework by considering a large number of different scenarios. It is also different from PTHA, because recurrence and probabilities are not considered. This is justified since saving lives ought to follow a low-probability, high consequences approach Muhari et al. (2015); Langenbruch et al. (2020). The planning must thus consider low probability events that cause high potential damage to the people, to minimize loss of life (Ranghieri and Ishiwatari, 2014). While it is desirable to ensure that evacuation routes and safe zones are designed in this way, other elements such as vertical evacuation structures could follow a different approach for their structural design.
An apparent feature of the performed modeling is that even though the scenario dataset considers a broad range of magnitudes and hundreds of slip realizations per magnitude bin, the final results and maps appear to be defined by just a small number of events. This is depicted by the fraction of events inundating the domain (Figure 5C). Whilst a large variability of tsunami inundation metrics was found, only few events in each magnitude bin were capable of inundating large swaths of the coast, while the majority were not able to inundate beyond the coastline. This is interpreted as an appropriate response from the modeling, since the set of scenarios incorporates shallower and deeper rupture depths, consistent with knowledge about past earthquakes in the area. For example, although smaller in magnitude than the present target scenario, the two last local events in 1985 (
To better understand this, the scenarios that produce the extreme value at each cell are identified (Supplementary Figure S2). Figure 9A shows that only 16 scenarios contributed to generate the maximum flow depth map. Two scenarios control most of the domain (IDs 2,551 and 2,558), but several others are relevant for the western end of the domain, west of the breakwater. This could indicate a large sensitivity to whether these scenarios are included in the analysis. However, when the percentage of events (among this set of 16) that inundate each grid cell is considered (Figure 9C), it can be seen that typically, 80% or more of these 16 events do inundate a large section of the domain. Hence, similar results would be obtained as long as any of those 16 events was included. Five of the above-mentioned events are capable of reaching the maximum inundation, and they significantly modify the overall extent of the inundation zone. This means that including intra-event variability is essential to account for all cases, and may preclude filtering or subsampling for extreme (but plausible) earthquakes beforehand. This is reinforced when arrival time is considered. Figure 9B shows scenarios that contribute to the minimum arrival time for each cell, resulting in a set of 32 scenarios (Figure 9). A less uniform distribution compared to inundation depths is observed, with two scenarios controlling the minimum arrival time (ID 2589 and 2,472). Notably, scenario ID 2472 was not part of the scenarios contributing to flow depth maxima. Again, this further shows not only the need to include a large number of scenarios, but also the importance to treat the inundation depth and arrival times independently, as proposed here.
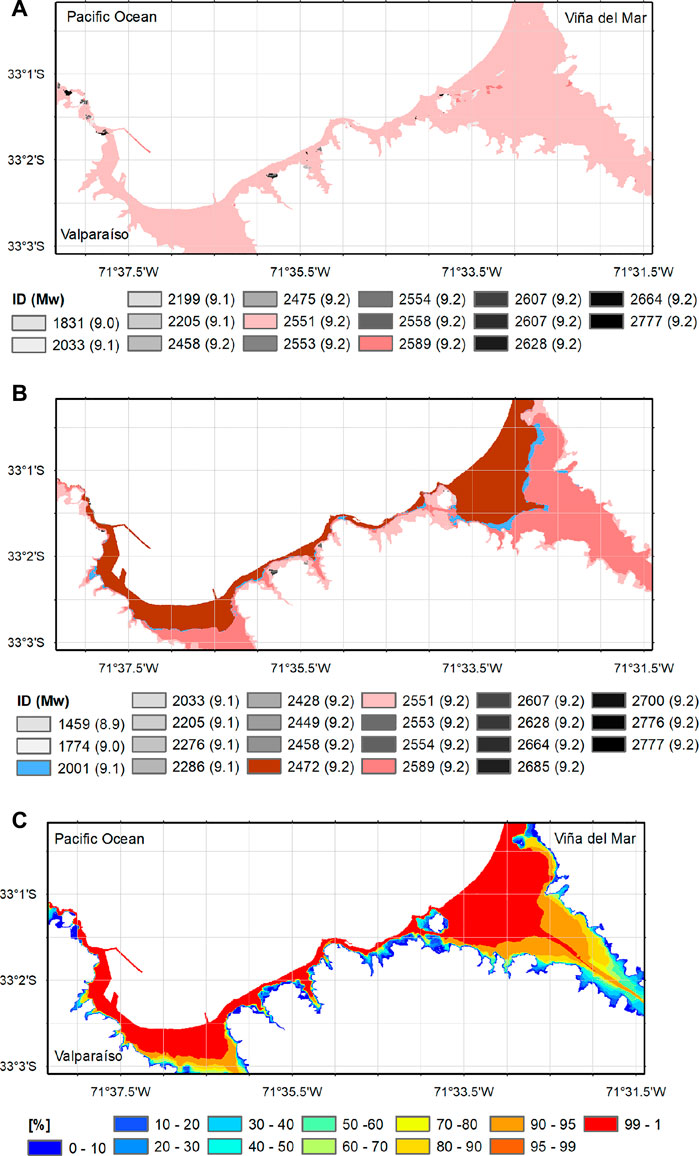
FIGURE 9. Discrimination of extreme values among scenarios (A) Scenarios that contribute to the maximum flow depth. Left number shows the scenario Id and in parenthesis the corresponding moment magnitude (B) Scenarios that contributed to the arrival time (C) Fraction of those scenarios that inundate each pixel.
This analysis may lead to the impression that only those large magnitude scenarios contribute to the presented results. To check this, a scatter plot of maximum flow depth and arrival time from all 2,800 scenarios was computed at five locations within the inundated area. Results are classified by magnitude, and the category thresholds are also shown in Figure 10. A large number of scenarios of different magnitude is observed to fall into the extreme category, and these are more frequent in the set than previously suggested, which can be observed in the cloud of scenarios that are classified as Cat. B3 at POI 29 (Figure 10C). The scenario of the maximum flow depth does not coincide with that of the minimum arrival time. Maximum flow depths appear to be more sensitive to scenario selection, with one or two scenarios having extreme flow depths. In contrast, arrival time usually has a larger number of events with similar values, as shown by a flatter distribution of data points at the shortest times. Some of the presented locations highlight the need to include different magnitudes and scenarios in the assessment. POI 62 (Figure 10F) shows that the largest events have late arrivals (Cat. A3), but there are several smaller events of different magnitude that arrive significantly earlier (Cat. B3). POI 30 (Figure 10D) shows that events of different magnitudes can yield a large range of flow depths, but all of them occurring within 10–20 min after the earthquake. Remarkably, this point (POI 30) is located near the river mouth, the area previously identified as the one having longer evacuation times. This reinforces the need to decouple arrival time and flow depth. Figure 10 also highlights the sensitivity of the results to the choice of thresholds, especially those related to arrival time. At POI 30, a single event arrives in less than 10 min, which controls the C3 category. Had the threshold been chosen at 12 min, 3 scenarios would have been considered.
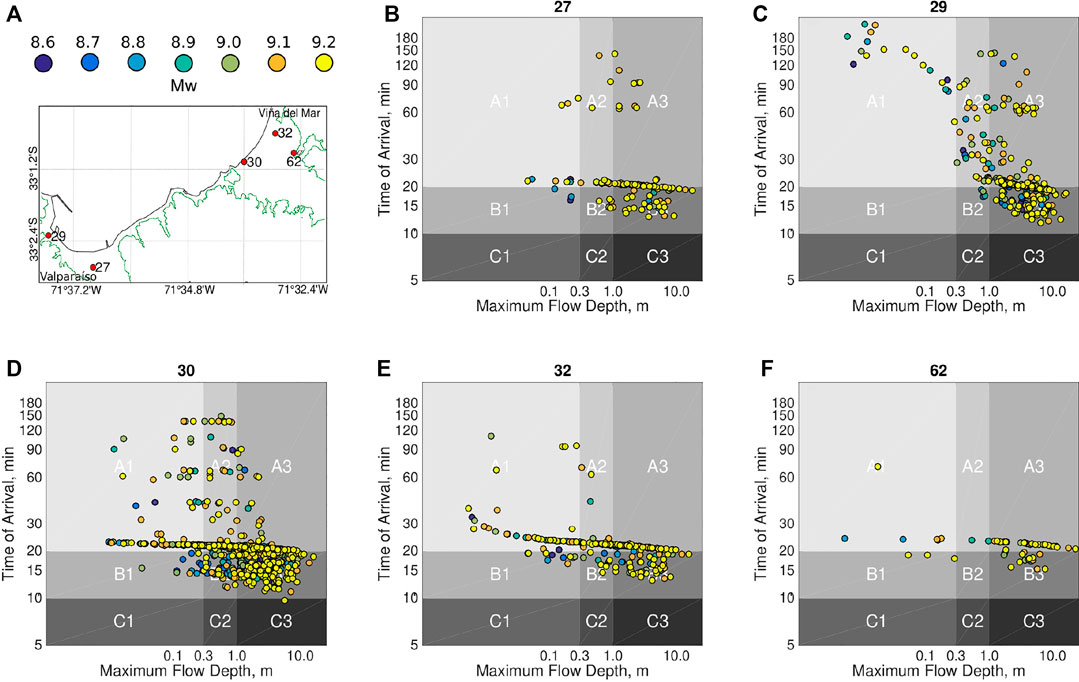
FIGURE 10. Scatter plots of earliest arrival time against maximum flow depth, color coded by
A by-product of the presented analysis is that it is possible to identify the latest arrival (uppermost points in the scatter plots). This means that after evacuation has been issued, no safe return to the inundated area should be allowed before approximately 180 min. This also implies that if no inundation has been observed after 180 min, or with some extra time added to be conservative, it would be reasonable to assume that no inundation will occur. The inclusion of arrival times hence not only defines the necessary promptness of evacuation, but could also be used to define the time of issuance of safe returns. To our understanding, this aspect has been largely missing from tsunami hazard assessments, yet it is a key aspect to be considered in areas where evacuations might be recurrent, as in Chile, and the system is at risk of a loss of confidence by the population due to perceived false alarms. A more detailed modeling exercise should also contain the effect of resonance and edge waves (Catalán et al., 2015; Cortés et al., 2017; Aránguiz et al., 2019), by modeling the domain for a sufficient time for them to occur. This could also necessitate an expansion of the analysis to seismogenic areas located further away from the area of interest.
These results show that it is relevant to include a wide range of scenarios and magnitudes, although the categorization may not be as sensitive to the inclusion of extreme events. This opens the possibility to implement post-processing methods (Sepúlveda et al., 2018; Davies, 2019) in order to omit some scenarios that can be contributing as outliers (or erroneous numerical artifacts), while also keeping the distribution of the starting configuration of stochastic realizations. This has not been implemented here, but could be part of a further refinement of the method.
5 Conclusion
In this work, the hybrid use of tsunami arrival times and flow depths in the elaboration of a hazard map has been evaluated. To this end, 2,800 stochastic sources and their respective tsunamis were modeled from generation to inundation in two cities of central Chile. Different ways of arranging the tsunami hazard categorization were tested, with the goal of producing a map that can be useful for decision making in evacuation planning and management, while being easy to understand.
The main findings show that a small number of scenarios generate large tsunami inundation, but with variable arrival times not necessarily associated to the same event. In contrast, similar tsunami arrival times can be the result of multiple events of different magnitudes. This result stresses that when evacuation is considered, reliance on the maximum flow depth alone does not suffice, and the inclusion of multiple events and magnitudes is essential, highlighting the need to incorporate intra-and inter-event variability. In the present study, aspects such as recurrence were not included, and ought to be subject of subsequent research. The approach used herein used the hazard envelope, under a low probability, high consequence framework.
Combining these two intensity metrics into a 9-level categorization that gives more weight to arrival time while acknowledging the maximum hazard as presented by the tsunami flow depth, yields maps that allow a better understanding of the hazard, especially when having evacuation as its main purpose. The hazard scale is built on a priori decisions such as the definition of thresholds, which could affect the details of the final map, and could be defined locally with authorities.
It was found that the map conveys relevant information as intended. Among the benefits found is the capacity of providing support for improving evacuation routes and safe zone placement, based on a very simple representation of the hazard. In addition, the arrival time-based maps allow for introducing the notion of safe return time windows after an evacuation has been issued.
At the local level, assessing tsunami hazard due to future Chilean megathrust earthquakes (and in the far-field) must be a multidisciplinary and comprehensive approach based on the current knowledge of tsunami source specification, propagation and inundation, that should include arrival times as a key parameter.
This will help reducing tsunami risk along coastal communities with education and outreach programs based on the scientific knowledge especially in regions with a false notion of low tsunami hazard and risk (Bernard and Titov, 2015; Zamora et al., 2020). It is hypothesized that these simpler maps, even though considering more information, can be better interpreted by the general public and enhance people’s awareness.
Data Availability Statement
The datasets presented in this article are not readily available because part of the bathymetric and topographic datasets are restricted to the public, since it was shared by SHOA under an agreement. Requests to access the datasets should be directed to cGF0cmljaW8uY2F0YWxhbkB1c20uY2w=.
Author Contributions
NZ: Conceptualization. Data processing, writing manuscript and editing. PC: Conceptualization. Writing and editing the manuscript. AG: Data processing, writing and editing the manuscript. MC: Conceptualization, writing, and editing the manuscript.
Conflict of Interest
The authors declare that the research was conducted in the absence of any commercial or financial relationships that could be construed as a potential conflict of interest.
Acknowledgments
The authors acknowledge SHOA’s support to this work, particularly making available nautical charts and coastal zone plans used to generate high resolution terrain models. PC, NZ and AG were partially funded by ANID through its grants ANID/FONDAP/15110017 (CIGIDEN), and ANID/FONDEF/ID19I10048. PAC also thanks ANID PIA/APOYO AFB180002. MC acknowledges the support from ‘Millennium Nucleus CYCLO: The Seismic Cycle Along Subduction Zones’ and Chile’s Fondo Nacional de Desarrollo Científico y Tecnológico, FONDECYT Projects N°1190258 and N° 1181479. The authors also acknowledge C. Sippl for discussion about asperities offshore Valparaíso and corrections to the manuscript. The authors thankfully acknowledges the computer resources at CTE-POWER and the technical support provided by BSC (RES-AECT-2020-2-0001), and the EDANYA Group at Málaga university for providing the HySEA code. We acknowledge D. Melgar for making available the MudPy code at: https://github.com/dmelgarm/MudPy. J. León is acknowledge for sharing the evacuation results. We are very grateful to the editor S. Lorito and the comments of K. Goda, A. Armigliato and W. Power, for a thoughtful and insightful discussion that helped us to greatly improve this work. NZ has received funding from the STARS programme part of the Marie Skłodowska-Curie grant agreement H2020-MSCA-COFUND-2016-75443.
Supplementary Material
The Supplementary Material for this article can be found online at: https://www.frontiersin.org/articles/10.3389/feart.2020.591514/full#supplementary-material.
Abbreviation
ALOS, Global Digital Surface Model “ALOS World 3D-30m (AW3D30)”; CENDHOC, Centro Nacional de Datos Hidrogrficos y Oceanogrficos de Chile; CIGIDEN, Research Center for Integrated Disaster Risk Management, ANID/FONDAP/15110017; CITSU, Cartas de Inundacin por Tsunami; INE, Instituto Nacional de Estadsticas; ONEMI, Oficina Nacional de Emergencia del Ministerio del Interior; SHOA, Servicio Hidrogrfico y Oceanogrfico de la Armada de Chile.
References
Aránguiz, R., Catalán, P. A., Cecioni, C., Bellotti, G., Henriquez, P., and González, J. (2019). Tsunami resonance and spatial pattern of natural oscillation modes with multiple resonators. J. Geophys. Res.: Oceans 124, 7797–7816. doi:10.1029/2019JC015206
Aránguiz, R., González, G., González, J., Catalán, P. A., Cienfuegos, R., Yagi, Y., et al. (2016). The 16 september 2015 Chile tsunami from the post-tsunami survey and numerical modeling perspectives. Pure Appl. Geophys. 173, 333–348. doi:10.1007/s00024-015-1225-4
Atwater, B. F., Cisternas, M., Yulianto, E., Prendergast, A. L., Jankaew, K., Eipert, A. A., et al. (2013). El tsunami de 1960 en una planicie de cordones litorales cerca de Maullín, Chile: Descenso tierra adentro, surcos renovados, abanicos agradados, múltiples predecesores. Andean Geol. 40, 393–418. doi:10.5027/andgeoV40n3-a01
Barrientos, S. E. (1988). Slip distribution of the 1985 central Chile earthquake. Tectonophysics 145, 225–241. doi:10.1016/0040-1951(88)90197-7
Becerra, I., Aránguiz, R., González, J., and Benavente, R. (2020). An improvement of tsunami hazard analysis in central Chile based on stochastic rupture scenarios. Coast Eng. J. 62, 1–16. doi:10.1080/21664250.2020.1812943
Beck, S., Barrientos, S., Kausel, E., and Reyes, M. (1998). Source characteristics of historic earthquakes along the central Chile subduction zone. J. S. Am. Earth Sci. 11, 115–129. doi:10.1016/S0895-9811(98)00005-4
Bernard, E., and Titov, V. (2015). Evolution of tsunami warning systems and products. Philos Trans A Math Phys Eng Sci. 373, 20140–20371. doi:10.1098/rsta.2014.0371
Blaser, L., Kruger, F., Ohrnberger, M., and Scherbaum, F. (2010). Scaling relations of earthquake source parameter estimates with special focus on subduction environment. Bull. Seismol. Soc. Am. 100, 2914–2926. doi:10.1785/0120100111
Bletery, Q., Sladen, A., Delouis, B., and Matteó, L. (2015). Quantification of tsunami bathymetry effect on finite fault slip inversion. Pure Appl. Geophys. 172, 3655–3670. doi:10.1007/s00024-015-1113-y
Bravo, F., Koch, P., Riquelme, S., Fuentes, M., and Campos, J. (2019). Slip distribution of the 1985 Valparaíso earthquake constrained with seismic and deformation data. Seismol Res. Lett. 90, 1792–1800. doi:10.1785/0220180396
Carvajal, M., Cisternas, M., and Catalán, P. A. (2017a). Source of the 1730 Chilean earthquake from historical records: implications for the future tsunami hazard on the coast of Metropolitan Chile. J. Geophys. Res.: Solid Earth 122, 3648–3660. doi:10.1002/2017JB014063
Carvajal, M., Cisternas, M., Gubler, A., Catalán, P., Winckler, P., and Wesson, R. (2017b). Reexamination of the magnitudes for the 1906 and 1922 Chilean earthquakes using Japanese tsunami amplitudes: implications for source depth constraints. J. Geophys. Res. 122, 4–17. doi:10.1002/2016JB013269
Catalán, P. A., Aránguiz, R., González, G., Tomita, T., Cienfuegos, R., González, J., et al. (2015). The 1 april 2014 Pisagua tsunami: observations and modeling. Geophys. Res. Lett. 42, 2918–2925. doi:10.1002/2015GL063333
Catalán, P. A., Gubler, A., Cañas, J., Zuñiga, C., Zelaya, C., Pizarro, L., et al. (2020). Design and operational implementation of the integrated tsunami forecast and warning system in Chile (SIPAT). Coast Eng. J. 62, 373–388. doi:10.1080/21664250.2020.1727402
Charvet, I., Macabuag, J., and Rossetto, T. (2017). Estimating tsunami-induced building damage through fragility functions: critical review and research needs. Frontiers in Built Environment 3, 36. doi:10.3389/fbuil.2017.00036
Cortés, P., Catalán, P. A., Aránguiz, R., and Bellotti, G. (2017). Tsunami and shelf resonance on northern Chile coast. J. Geophys. Res.: Oceans 122, 7364–7379. doi:10.1002/2017JC012922
Cubelos, C., Shyam Kularathna, A. H. T., Valenzuela, V. P. B., Iliopoulos, N., Quiroz, M., Yavar, R., et al. (2019). Understanding community-level flooding awareness in remote coastal towns in northern Chile through community mapping. Geosciences 9, 279. doi:10.3390/geosciences9070279
Davies, G., Griffin, J., Løvholt, F., Glimsdal, S., Harbitz, C., Thio, H. K., et al. (2017). A global probabilistic tsunami hazard assessment from earthquake sources. Geological Society, London, Special Publications 456, 219–244. doi:10.1144/SP456.5
Davies, G. (2019). Tsunami variability from uncalibrated stochastic earthquake models: tests against deep ocean observations 2006-2016. Geophys. J. Int. 218, 1939–1960. doi:10.1093/gji/ggz260
De Risi, R., and Goda, K. (2017). Simulation-based probabilistic tsunami hazard analysis: empirical and robust hazard predictions. Pure Appl. Geophys. 174, 3083–3106. doi:10.1007/s00024-017-1588-9
Doocy, S., Daniels, A., Packer, C., Dick, A., and Kirsch, T. D. (20132013). The human impact of earthquakes: a historical review of events 1980-2009 and systematic literature review. PLoS Curr, 5, 1–26. doi:10.1371/currents.dis.67bd14fe457f1db0b5433a8ee20fb833
Dura, T., Cisternas, M., Horton, B. P., Ely, L. L., Nelson, A. R., Wesson, R. L., et al. (2015). Coastal evidence for Holocene subduction-zone earthquakes and tsunamis in central Chile. Quat. Sci. Rev. 113, 93–111. doi:10.1016/j.quascirev.2014.10.015
Fraser, S. A., Wood, N. J., Johnston, D. M., Leonard, G. S., Greening, P. D., and Rossetto, T. (2014). Variable population exposure and distributed travel speeds in least-cost tsunami evacuation modelling. Nat. Hazards Earth Syst. Sci. 14, 2975–2991. doi:10.5194/nhess-14-2975-2014
Fritz, H. M., Petroff, C. M., Catalán, P. A., Cienfuegos, R., Winckler, P., Kalligeris, N., et al. (2011). Field survey of the 27 february 2010 Chile tsunami. Pure Appl. Geophys. 168, 1989–2010. doi:10.1007/s00024-011-0283-5
GEBCO (2019). The GEBCO-2019 grid. a continuous terrain model of the global oceans and land. the british oceanographic data centre., NERC, UK: national oceanography centre.
Geist, E. L., and Parsons, T. (2006). Probabilistic analysis of tsunami hazards. Nat. Hazards 37, 277–314. doi:10.1007/s11069-005-4646-z
González, J., González, G., Aránguiz, R., Melgar, D., Zamora, N., Shrivastava, M. N., et al. (2020). A hybrid deterministic and stochastic approach for tsunami hazard assessment in Iquique, Chile. Nat. Hazards 1, 231–254. doi:10.1007/s11069-019-03809-8
Grezio, A., Babeyko, A., Baptista, M. A., Behrens, J., Costa, A., Davies, G., et al. (2017). Probabilistic tsunami hazard analysis: multiple sources and global applications. Rev. Geophys. 55, 1158–1198. doi:10.1002/2017RG000579
Harbitz, C. B., Løvholt, F., and Bungum, H. (2013). Submarine landslide tsunamis: how extreme and how likely? Nat. Hazards 72, 1341–1374. doi:10.1007/s11069-013-0681-3
Hayes, G. P., Wald, D. J., and Johnson, R. L. (2012). Slab1.0: a three-dimensional model of global subduction zone geometries. J. Geophys. Res.: Solid Earth 117, B01. doi:10.1029/2011JB008524
Hoang, V. C., Tanaka, H., and Mitobe, Y. (2018). Estuarine morphology recovery after the 2011 great east Japan earthquake tsunami. Mar. Geol. 398, 112–125. doi:10.1016/j.margeo.2018.01.001
Imamura, F., Boret, S. P., Suppasri, A., and Muhari, A. (2019). Recent occurrences of serious tsunami damage and the future challenges of tsunami disaster risk reduction. Progress in Disaster Science, 1, 100 009. doi:10.1016/j.pdisas.2019.100009
Kajiura, K. (1970). Tsunami source, energy and the directivity of wave radiation. Bull. Earthq. Res. Inst. 48, 835–869. doi:10.1007/BF02109296
Koshimura, S., Katada, T., Mofjeld, H. O., and Kawata, Y. (2006). A method for estimating casualties due to the tsunami inundation flow. Nat. Hazards 39, 265–274. doi:10.1007/s11069-006-0027-5
Koshimura, S., Namegaya, Y., and Yanagisawa, H. (2009). Tsunami fragility: a new measure to identify tsunami damage. J. Disaster Res. 4, 479–488. doi:10.20965/jdr.2009.p0479
Langenbruch, C., Ellsworth, W. L., Woo, J.-U., and Wald, D. J. (2020). Value at induced risk: injection-induced seismic risk from low-probability, high-impact events. Geophys. Res. Lett. 47, e2019GL085. doi:10.1029/2019GL085878
León, J., Castro, S., Mokrani, C., and Gubler, A. (2020). Tsunami evacuation analysis in the urban built environment: a multi-scale perspective through two modeling approaches in viña del mar, Chile. Coast Eng. J. 62, 389–404. doi:10.1080/21664250.2020.1738073
León, J., Mokrani, C., Catalán, P., Cienfuegos, R., and Femenías, C. (2018). Examining the role of urban form in supporting rapid and safe tsunami evacuations: a multi-scalar analysis in Viña del Mar, Chile. Procedia Engineering 212, 629–636. doi:10.1016/j.proeng.2018.01.081
León, J., Mokrani, C., Catalán, P., Cienfuegos, R., and Femenías, C. (2019a). The role of built environment’s physical urban form in supporting rapid tsunami evacuations: using computer-based models and real-world data as examination tools. Frontiers in Built Environment 4, 89. doi:10.3389/fbuil.2018.00089
León, J., Vicuña, M., and Gubler, A. (2019b). Increasing tsunami risk through intensive urban densification in metropolitan areas: a longitudinal analysis in viña del mar, Chile. International Journal of Disaster Risk Reduction 41, 101–312. doi:10.1016/j.ijdrr.2019.101312
LeVeque, R., George, D., and Berger, M. (2011). Tsunami modelling with adaptively refined finite volume methods. Acta Numer. 20, 211–289. doi:10.1017/S0962492911000043
LeVeque, R. J., Waagan, K., González, F. I., Rim, D., and Lin, G. (2016). Generating random earthquake events for probabilistic tsunami hazard assessment. Pure Appl. Geophys. 173, 3671–3692. doi:10.1007/s00024-016-1357-1
Li, L., Switzer, A. D., Chan, C.-H., Wang, Y., Weiss, R., and Qiu, Q. (2016). How heterogeneous coseismic slip affects regional probabilistic tsunami hazard assessment: a case study in the South China Sea. J. Geophys. Res.: Solid Earth 121, 6250–6272. doi:10.1002/2016JB013111
Lorito, S., Selva, J., Basili, R., Romano, F., Tiberti, M. M., and Piatanesi, A. (2015). Probabilistic hazard for seismically induced tsunamis: accuracy and feasibility of inundation maps. Geophys. J. Int. 200, 574–588. doi:10.1093/gji/ggu408
Macías, J., Castro, M. J., Ortega, S., Escalante, C., and González-Vida, J. M. (2017). Performance benchmarking of tsunami-HySEA model for NTHMP’s inundation mapping activities. Pure Appl. Geophys. 174, 3147–3183. doi:10.1007/s00024-017-1583-1
Makinoshima, F., Imamura, F., and Oishi, Y. (2020). Tsunami evacuation processes based on human behaviour in past earthquakes and tsunamis: a literature review. Progress in Disaster Science 7, 100–113. doi:10.1016/j.pdisas.2020.100113
Martínez, C., Cienfuegos, R., Inzunza, S., Urrutia, A., and Guerrero, N. (2020). Worst-case tsunami scenario in cartagena bay, central Chile: challenges for coastal risk management. Ocean Coast Manag., 185, 105060. doi:10.1016/j.ocecoaman.2019.105060
McAdoo, B. G., Dengler, L., Prasetya, G., and Titov, V. (2006). How an oral history saved thousands on Indonesia’s simeulue island during the december 2004 and march 2005 tsunamis. Earthq. Spectra 22 (3), 661–669. doi:10.1193/1.2204966
Melgar, D., LeVeque, R. J., Dreger, D. S., and Allen, R. M. (2016). Kinematic rupture scenarios and synthetic displacement data: an example application to the cascadia subduction zone. J. Geophys. Res.: Solid Earth 121, 6658–6674. doi:10.1002/2016JB013314
Mori, N., Goda, K., and Cox, D. (2018). “Recent process in probabilistic tsunami hazard analysis (PTHA) for mega thrust subduction earthquakes,” in The 2011 Japan earthquake and tsunami: reconstruction and restoration. Advances in natural and technological hazards research. Editors V. Santiago-Fandiño, S. Sato, N. Maki, and K. Iuchi, 47, 469–485. doi:10.1007/978-3-319-58691-5_27
Morton, R. A., Gelfenbaum, G., Buckley, M. L., and Richmond, B. M. (2011). Geological effects and implications of the 2010 tsunami along the central coast of Chile. Sediment. Geol. 242, 34–51. doi:10.1016/j.sedgeo.2011.09.004
Muhari, A., Imai, K., Sugawara, D., and Imamura, F. (2015). “A method to determine the level 1 and level 2 tsunami inundation areas for reconstruction in Eastern Japan and possible application in pre-disaster areas,” in Post-tsunami hazard. Editors V. Santiago-Fandiño, Y. Kontar, and Y. Kaneda (Cham: Springer), 133–155. doi:10.1007/978-3-319-10202-3_10
Nakamura, S. (1992). An analysis of the 1985 Chilean tsunami. Mar. Geodes 15, 277–281. doi:10.1080/01490419209388064
NGDC/WDS (2018). National Geophysical Data Center, World Data Service. Global historical tsunami database. Washington, D.C, United States: National Geophysical Data Center.
Okada, Y. (1985). Surface deformation due to shear and tensile faults in a half-space. Bull. Seismol. Soc. Am. 75, 1135–1154.
Park, H., Cox, D. T., and Barbosa, A. R. (2018). Probabilistic Tsunami Hazard Assessment (PTHA) for resilience assessment of a coastal community. Nat. Hazards 94, 1117–1139. doi:10.1007/s11069-018-3460-3
Park, H., and Cox, D. T. (2016). Probabilistic assessment of near-field tsunami hazards: inundation depth, velocity, momentum flux, arrival time, and duration applied to Seaside, Oregon. Coast Eng. 117, 79–96. doi:10.1016/j.coastaleng.2016.07.011
Poulos, A., Monsalve, M., Zamora, N., and de la Llera, J. C. (2019). An updated recurrence model for Chilean subduction seismicity and statistical validation of its Poisson nature. Bull. Seismol. Soc. Am. 109, 66–74. doi:10.1785/0120170160
Ranghieri, F., and Ishiwatari, M. (2014). Chapter: strategies for managing low-probability, high-impact events. Learning from megadisasters: lessons from the great east Japan earthquake, 297–304. doi:10.1596/978-1-4648-0153-2ch32
Sepúlveda, I., Liu, P. L.-f., and Grigoriu, M. D. (2018). Probabilistic tsunami hazard assessment in south China sea with consideration of uncertain earthquake characteristics. J. Geophys. Res.: Solid Earth 124, 658–688. doi:10.1029/2018JB016620
SHOA (2012). Carta de inundación por tsunami (CITSU) de Valparaíso y Viña del Mar., Valparaíso, Chile: Servicio Hidrográfico y Oceanográfico de la Armada de Chile Available at: http://www.shoa.cl/php/citsu.php (Accessed January 15, 2021).
Sippl, C., Moreno, M., and Benavente, R. (2020). Microseismicity appears to outline highly coupled regions on the central Chile megathrust. Preprint at EarthArXiv. doi:10.31223/X56S3B
Tadono, T., Ishida, H., Oda, F., Naito, S., Minakawa, K., and Iwamoto, H. (2014). Precise global DEM generation by ALOS PRISM. ISPRS. Annals 4, 71–76. doi:10.5194/isprsannals-II-4-71-2014
Tanioka, Y., and Satake, K. (1996). Tsunami generation by horizontal displacement of ocean bottom. Geophys Res Lett. 23, 861–864. doi:10.1029/96GL00736
Tinti, S., Tonini, R., Bressan, L., Armigliato, A., Gardi, A., Guillande, R., et al. (2011). Handbook of tsunami hazard and damage scenarios. EUR 24691 EN – joint research centre – institute for the protection and security of the citizen. Tech. rep (Luxembourg: Publications Office of the European Union), 43.
UNISDR (2018). Economic losses, poverty & disasters 1998‐2017. Tech. Report. Available at: https://www.undrr.org/publication/economic-losses-poverty-disasters-1998-2017
Volpe, M., Lorito, S., Selva, J., Tonini, R., Romano, F., and Brizuela, B. (2019). From regional to local SPTHA: efficient computation of probabilistic tsunami inundation maps addressing near-field sources. Nat. Hazards Earth Syst. Sci. 19, 455–469. doi:10.5194/nhess-19-455-2019
Williamson, A. L., and Newman, A. V. (2019). Suitability of open-ocean instrumentation for use in near-field tsunami early warning along seismically active subduction zones. Pure Appl. Geophys. 176, 3247–3262. doi:10.1007/s00024-018-1898-6
Wood, N. J., and Schmidtlein, M. C. (2013). Community variations in population exposure to near-field tsunami hazards as a function of pedestrian travel time to safety. Nat. Hazards 65, 1603–1628. doi:10.1007/s11069-012-0434-8
Yamazaki, Y., Kowalik, Z., and Cheung, K. F. (2009). Depth-integrated, non-hydrostatic model for wave breaking and run-up. Int. J. Numer. Methods Fluid 61, 473–497. doi:10.1002/fld.1952
Keywords: Tsunami hazard, microzoning, arrival times, flow depths, evacuation, slip distributions, earthquakes, central Chile
Citation: Zamora N, Catalán PA, Gubler A and Carvajal M (2021) Microzoning Tsunami Hazard by Combining Flow Depths and Arrival Times. Front. Earth Sci. 8:591514. doi: 10.3389/feart.2020.591514
Received: 04 August 2020; Accepted: 28 December 2020;
Published: 01 April 2021.
Edited by:
Stefano Lorito, Istituto Nazionale di Geofisica e Vulcanologia (INGV), ItalyReviewed by:
Katsuichiro Goda, Western University, CanadaAlberto Armigliato, University of Bologna, Italy
William Power, GNS Science, New Zealand
Copyright © 2021 Zamora, Catalán, Gubler and Carvajal. This is an open-access article distributed under the terms of the Creative Commons Attribution License (CC BY). The use, distribution or reproduction in other forums is permitted, provided the original author(s) and the copyright owner(s) are credited and that the original publication in this journal is cited, in accordance with accepted academic practice. No use, distribution or reproduction is permitted which does not comply with these terms.
*Correspondence: Natalia Zamora, bmF0YWxpYS56YW1vcmFAYnNjLmVz
†Present address: Matías Carvajal, Instituto de Geografía, Pontificia Universidad Católica de Valparaíso, Valparaíso, Chile