 Edoardo Dallanave
 Uwe Kirscher
- 1Faculty of Geosciences, University of Bremen, Bremen, Germany
- 2Department of Geosciences, University of Tuebingen, Tuebingen, Germany
Paleogeographic reconstructions largely rely on paleomagnetic data, mostly in the form of paleomagnetic poles. Compilations of poles are used to determine so called apparent polar wander paths (APWPs), which capture the motion through time of a particular location with respect to an absolute reference frame such as the Earth’s spin axis. Paleomagnetic datasets from sedimentary rocks are particularly relevant, because of their spatial distribution and temporal continuity. Several criteria have been proposed through the years to assess the reliability of paleomagnetic datasets. Among these, the latitudinal-dependent elongation of a given paleomagnetic directions distribution, predicted by a widely accepted paleosecular variations model, has been applied so far only to investigate inclination flattening commonly observed in sedimentary rocks. We show in this work that this concept can be generalized to detect “contamination” of paleomagnetic data derived from tectonic strain, which is not always detected by field observation only. After generating different sets of simulated geomagnetic directions at different latitudes, we monitored the variations in the shape of the distributions after applying deformation tensors that replicate the effect of increasing tectonic strain. We show that, in most cases, the “deformation” of the dataset can be detected by elongation vs. inclination ratios not conforming to the values predicted by the paleosecular variations model. Recently acquired paleomagnetic directions and anisotropy of magnetic susceptibility (AMS; a parameter very sensitive to tectonic strain) data from New Caledonia verifies the results of these simulations and highlights the importance of measuring AMS when using sedimentary paleomagnetic data for paleogeographic reconstruction. We suggest to include always AMS measurement and analysis of the distribution shape to assess sedimentary paleomagnetic data used for paleogeographic reconstructions.
Introduction
Paleomagnetism and Paleogeographic Reconstruction
Plate tectonics is a unifying theory that provides a solid background for understanding fundamental processes occurring on Earth. In this model, the outer shell of the Earth consists of moving lithospheric plates and their past movement can be traced using geological data (Torsvik et al., 2008). The relative and absolute motion of the tectonic plates is reconstructed using combinations of ocean floor magnetic anomalies, hot-spot tracks, and paleomagnetic data. The oldest hotspot track in the South Atlantic is ∼130 Ma, and the ocean floor magnetic anomalies allow estimating the relative finite rotation of plates back to ∼180 Ma (Steinberger and Torsvik, 2008; Torsvik et al., 2008; DeMets et al., 2010; Wang et al., 2019). Paleomagnetic data are thus fundamental for paleogeographic reconstructions, particularly for pre-Jurassic times.
The basic element for all paleomagnetic-based paleogeographic reconstructions is the paleomagnetic direction. Paleomagnetic directions, measured at a given locality in rocks of any age, are expressed in the form of declination and inclination (D, I). Each direction, can be converted into a virtual geomagnetic pole (VGP), which is the point on the Earth’s surface where the imaginary pole that would results in the measured D and I is located. To account for paleosecular variation of the geomagnetic field, an adequate number of VGPs should be averaged to determine a paleomagnetic pole. Subsequently, compilations of consecutive poles can be combined to establish pole paths, so-called apparent polar wander paths (APWPs). APWPs are normally plotted as a series of points “wandering” away from the geographic pole with increasing age, where paleopoles based on rocks with very young ages plot close to the geographic pole. The adjective “apparent” comes from the fact that the geographic pole does not move but APWPs rather reflect the changing orientation and distance of a plate with respect to the (fixed) geographic pole (Creer et al., 1954; Van der Voo, 1993; Besse and Courtillot, 2002; Torsvik et al., 2008). At the base of this approach lies the assumption that the geomagnetic field averaged over a few thousand years can be approximated by the one generated by a geocentric axial dipole (GAD), with the characteristic that the paleomagnetic pole, obtained by averaging the available VGPs, and the geographic poles coincide (e.g., Butler, 1992; Tauxe, 2010).
Geomagnetic Paleosecular Variation
Analyses of paleomagnetic data compilations for the last 5 Myr (McElhinny and McFadden, 1997; MM97) revealed that the recent geomagnetic field is largely dominated by the GAD component (Tauxe and Kent, 2004; Tauxe, 2005). However, a snapshot of the geomagnetic field in a particular moment at a given location on the globe would result in a VGP that is deviated from the one predicted from the GAD model up to ∼10°. This is the result of the secular variation (Fleming, 1946; Lund, 2018). Starting from the work of Constable and Parker (1988), Tauxe and Kent (2004) developed a model for the paleosecular variation (TK03.GAD) designed to fit the latitudinal-dependent scatter of the VGPs observed in the paleomagnetic poles of the MM97 dataset. The TK03.GAD model results in predicted paleomagnetic direction distributions that are markedly North-South elongated, with a maximum elongation at the equator gradually diminishing toward the poles (Tauxe and Kent, 2004; Tauxe, 2005). Following this model, a collection of paleomagnetic directions from a locality, spanning a time interval long enough to average out secular variations, is expected to possess a distribution with a certain degree of elongation developed parallel to the mean declination.
Paleomagnetic Earth Filters
Sedimentary rocks constitutes about 66% of the rocks exposed on the Earth’s surface (Blatt and Jones, 1975). Therefore, sedimentary paleomagnetic datasets are of extreme value for paleogeographic reconstructions. However, the record of the Earth’s paleomagnetic field in sedimentary rocks is often “distorted” by different natural processes including tectonic deformation, remagnetization, or compaction-induced inclination flattening. These phenomena have been defined as “Earth filters” (Tauxe, 2005). In particular, sedimentary inclination shallowing of paleomagnetic directions is a long known problem, and it is described by the tangent function introduced by King (1955):
where Io is the observed remanence inclination, If is the inclination of the inducing field, and f is the flattening factor ranging from 0 (completely flattened directions) to 1 (absence of flattening). Directional sets affected by significant inclination shallowing typically possess an elongation developed perpendicular to the average declination (Tauxe and Kent, 1984). Eq. 1 is at the base of the E/I (Elongation/Inclination) method for correcting shallow biased paleomagnetic directions (Tauxe and Kent, 2004). A given set of flattened paleomagnetic directions is corrected by applying gradually decreasing f values to each direction. The “unflattened” average inclination is reached when the elongation of the whole distribution matches the value predicted by the TK03.GAD model. This statistical technique has been successfully applied to a wide range of sedimentary rocks (Kent and Tauxe, 2005; Krijgsman and Tauxe, 2006; Tauxe et al., 2008; Dallanave et al., 2009, Dallanave et al., 2012, Dallanave et al., 2015, Dallanave et al., 2018a; Kirscher et al., 2014). A reliable APWP of Adria (the African promontory) since the Permian was recently compiled systematically applying the E/I correction to new and published datasets (Muttoni et al., 2013; Muttoni and Kent, 2019).
Paleomagnetic inclination flattening is not the only “Earth filter”. Many sedimentary rocks are affected by tectonic strain, which is not always detectable by simple field observations, and that can deflect the characteristic remanent magnetization (ChRM) directions (Cogné and Perroud, 1985; Lowrie et al., 1986; Jackson et al., 1993; Borradaile, 1997). The finite strain state of a sedimentary rock can be qualitatively evaluated by using the anisotropy of magnetic susceptibility (AMS). By monitoring the AMS of Eocene mudstones of the Southern Pyrenean Foreland Basin, Parés et al. (1999) found that during incipient deformation, the fabric evolves through a series of stages that can be essentially synthetized in three types (Figure 1). In the absence of deformation, only compaction acts on the sediments resulting in an oblate AMS ellipsoid with a vertical minor axis (Figure 1A). As the deformation evolves to the weak cleavage state, the fabric changes toward a prolate shape with the major axis perpendicular to the shortening direction (Figure 1B). At the strong cleavage state, the fabric will assume a triaxial k1 > k2 > k3 form (where k1, k2, and k3 are respectively the major, intermediate, and minor axes of the AMS tensor) with the minimum axis parallel and the maximum perpendicular to the shortening direction (Figure 1C).
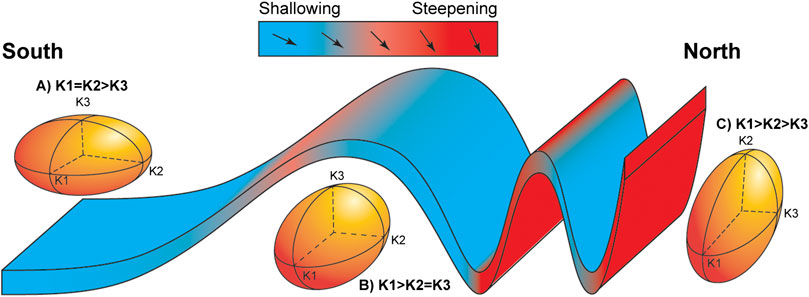
FIGURE 1. Theoretical evolution of magnetic fabric in sedimentary rocks during incipient deformation. (A) Absence of finite strain results in the solely effect of compaction-derived oblate fabric. (B) During a weak cleavage stage the fabric assumes a prolate shape, with the major axis perpendicular to the shortening direction. (C) In a strong cleavage state the fabric is triaxial, with the minor and major axes respectively parallel and perpendicular to the shortening direction. The effect of the fabric evolution on the paleomagnetic inclintaion is shown on top of the figure; figure drawn adapting concepts from Parés et al., 1999 and Borradaile, 1997.
In some pioneering work, ChRM directions in sedimentary rocks have been restored with an “unstrain” strategy (Cogné and Perroud, 1985, Cogné and Perround, 1987; Cogné, 1987). In this approach the paleomagnetic directions are considered as behaving like a passive line within the rock matrix, even though in some cases, due to the nature of the rock forming particles, this approach may be an oversimplification (Kligfield et al., 1983; Borradaile, 1997). The quality and reliability of the “unstrained” dataset was assessed using basic Fisher (1953) statistical criteria, whereby increasing of the precision parameter k reflects improved clustering of the directions. It is now clear that the remanence magnetization of sedimentary rocks reflects a more complex behavior of the geomagnetic field, and using just the standard Fisher (1953) statistics to evaluate the reliability of paleomagnetic datasets is an oversimplification. Monitoring the E/I of a paleomagnetic dataset in order to detect inclination flattening has become already a standard approach. Analogously, other earth filters can lead to E/I couples of values that are “unrealistic” (i.e., departing from the values expected from the TK03.GAD field model). In this paper we show that the shape of given ChRM directions set can be used to check if finite strain has undermined the reliability of the data. Using simulated paleomagnetic data, we show that strain related deflection of ChRM directions promptly modify the distribution elongation expected from the TK03.GAD model at a given latitude. We apply this concept to assess the reliability of a recently published dataset from Eocene sedimentary rocks exposed in New Caledonia (Dallanave et al., 2020).
Methods
Data Generation
To clearly visualize the effect of inclination flattening and finite strain simulation on a theoretical distribution of directions, we first generated a purely circular distribution of 30° radius around a mean direction of D = 0° and I = 50° (Figure 2A). A circular distribution can be considered as a simplification of a Fisher (1953) distribution, which is defined as 1) uniformly distributed around the mean direction and 2) with a occurring frequency of directions decaying exponentially with the distance form the mean (see also Fisher et al., 1987).
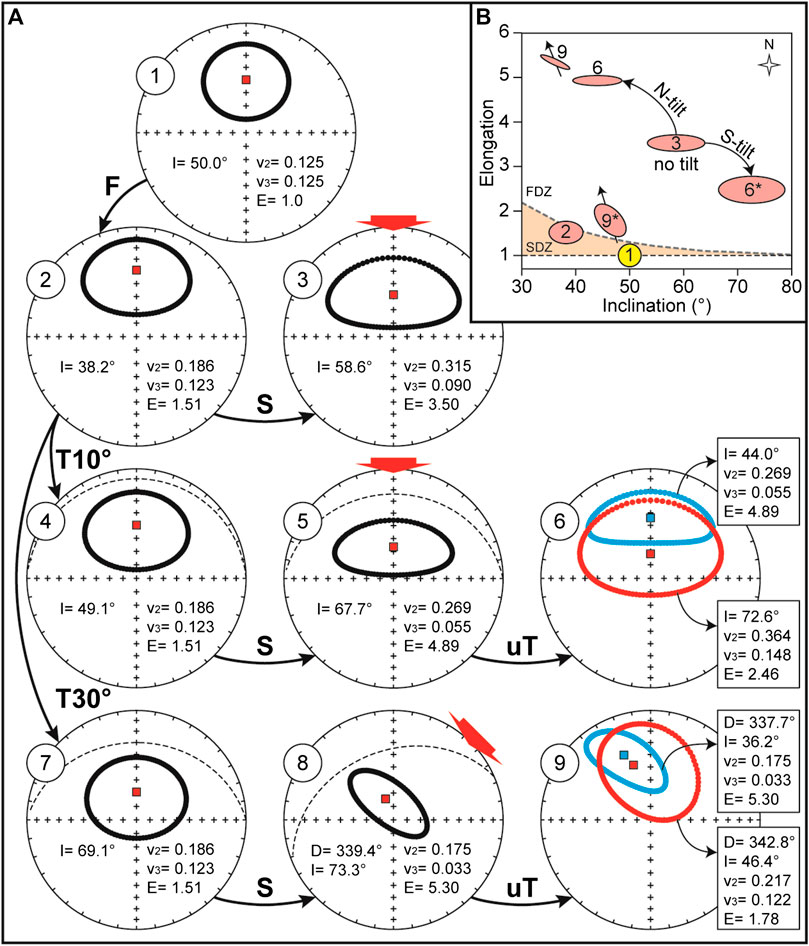
FIGURE 2. Effect of strain simulation on a purely circular distribution. (A) 1 = original distribution; 2 = simulated inclination flattening; 3 = effect of a pure compressional shear, with shortening indicated by the red arrow; 4–6 = effect of combination of pre-compressional strata tilting followed by shortening; while only northward tilting is shown in equal area projections 4 and 5, projection 6 shows the effect, after correcting for the bedding tilt, of both northward (blue) and southward (red) tilting on the same distribution; 7–9 = same as 4–6 but with an initial tilting of 30° and simulated shortening directed NE–SW; F = flattening simulation; S = shortening; T10° and T30° = 10° and 30° tilting; uT = correction for strained tilt. In all insets: D = declination (°); I = inclination (°); v2 and v3 = medium and minimum axes of the distribution matrix (Scheidegger, 1965); E = elongation (v2/v3). (B) Diagram of elongation (E) vs. inclination (I) of the original circular distribution (1), after inclination flattening (2), and after all the listed strain simulations; 6 and 9 are the E/I couples for the blue data plotted in the corresponding projections of panel A, while 6* and 9* refer to the red data; the shape, size, and orientation of the ellipses reflects the variations of the directions distributions as determined by the distribution matrix, while the arrows behind the ellipses are the mean declination of the directions; SDZ and FDZ = shallowed and flawed distribution zone, respectively.
To evaluate the effect of finite strain on more “realistic” directions, which reflect the secular variations of the geomagnetic field, we generated six sets of paleomagnetic directions using the tk03.py Python script compiled by Tauxe et al. (2016). The sets consist of declination-inclination-intensity triplets drawn accordingly to the TK03.GAD geomagnetic field model at specified latitudes. The six sets were generated applying latitudes of 10, 15, 20, 30, 40, and 50°N, imposing a normal polarity field. For all sets we selected a number (N) of 120 directions (Supplementary Table S1). Tauxe et al. (2008) indicated that an adequate number of directions to evaluate reliably the distribution shape is > 100. Since it is uncommon to find published direction sets that exceed this number by far, we consider N = 120 realistic. We excluded all directions with geomagnetic intensity lower than 10μT from the generated datasets. This is based on the assumption that the highest harmonics of the field (i.e., with the lowest intensity) are often not recorded by sediments, and if they are, they result in transitional directions that are normally excluded by directional cutoff (analogously to what done by McElhinny and McFadden (1997), for the MM97 compilation). The obtained distributions possess k values ranging from 20 to 35 (Figure 3; Table 1), which is in agreement with published high-quality sedimentary datasets (see e.g., compilation of Muttoni et al., 2013).
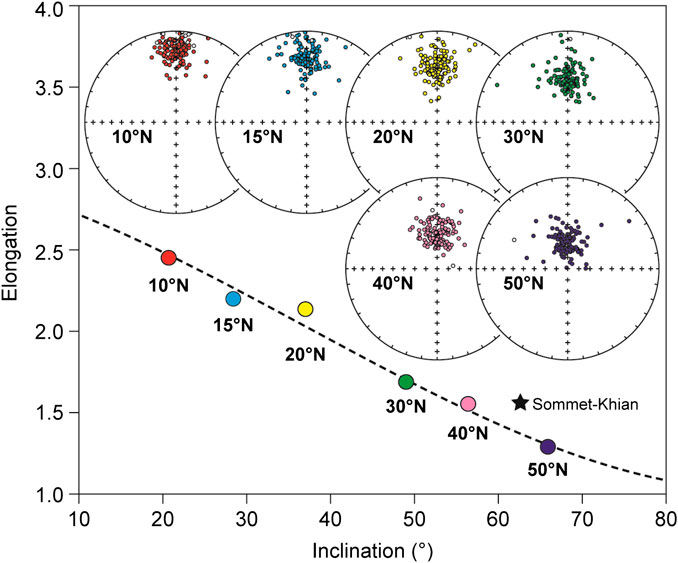
FIGURE 3. Simulated sets of paleomagnetic directions predicted by the TK03.GAD paleosecular variation model. Each stereographic projection is shown with the associated latitude. The elongation/inclination (E/I) values predicted by the TK03.GAD model are shown by the dashed line, together with the E/I pair of each distribution (the color corresponds to the associated stereographic projection). The star is the E/I pair of the paleomagnetic directions set from Sommet-Khian discussed in the text.
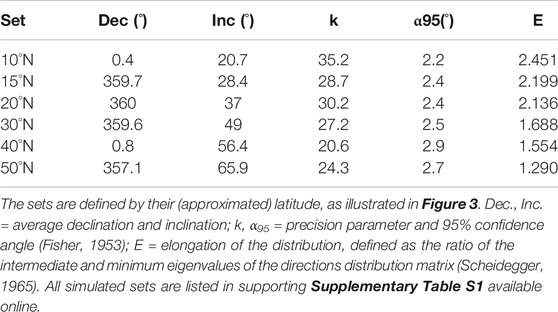
TABLE 1. List of the simulated paleomagnetic direction sets.
Strain Simulation and Elongation Monitoring
Paleomagnetic directions are commonly defined by D and I with unit length, so the intensity of the TK03.GAD directions was not considered further after filtering. For each generated set we calculated the elongation E, which is defined as the v2/v3 ratio, where v2 and v3 are the intermediate and minimum eigenvalues of the directions distribution matrix (Scheidegger, 1965; Table 1). The directions of each set are first converted to Cartesian coordinates xi with i = 1, 2, 3. We simulated the effect of the deformation by applying the strain matrix S, which is a symmetric matrix of elements si,j (where i, j = 1, 2, 3, and si,j = sj,i). The new coordinates di of each “strained” direction are obtained by:
This can also be used to simulate the effect of inclination shallowing by applying a diagonal matrix S of the form s11 = s22 > s33 (flattening matrix F). Note that under this condition this operation is equivalent to apply Eq. 1 with f = s33/s11.
We monitored the effect of the strain simulation on the directions distributions following the steps described as follows.
Circular Distribution
The workflow is shown in Figure 2. We first apply an inclination flattening with f = ∼0.6 (detailed values of si,j are listed in Table 2) to the circular distribution, which can be considered a reasonable assumption for sedimentary rocks (Figures 2A, diagram 1 and 2). In nature, the flattening factor is case sensitive and can easily range from 0.4 to 0.9 (see e.g. compilation of Muttoni et al., 2013). We simulated at first the simplest scenario, by applying shortening parallel to the average declination (Table 2) as indicated by the red arrow (Figures 2A, diagram 3). This situation, however, is not entirely realistic, because it implies no tilting of the strata, and in nature compressional strain is typically associated with folding. For this reason, in the next step we followed the case illustrated by Borradailee (1997). At the very initial stage of the deformation, low amplitude buckles, which result in tilted strata but not pervasive deformation, are subsequently passively strained, and the strain is affecting both the paleomagnetic directions and the strata attitude. The initial tilting of the strata is unknown, so we applied two different example scenarios, with initial tilting of 10°N (and 10°S), followed by N-S shortening (Figure 2A, diagrams 4–6), and initial tilting of 30°N (and 30°S) with shortening oriented NE-SW (Figure 2A, diagrams 7–9). We plot the strained directions, with associated means, in tilt corrected coordinates, and the variations of E/I ratios are monitored in Figures 2B.
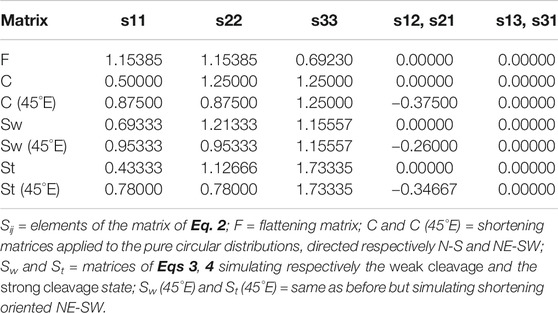
TABLE 2. List of the strain simulation matrices applied to the circular distribution and to the TK03.GAD distributions in presence of bedding tilt.
TK03.GAD Distributions
Similar to what has been done for the circular distribution, we applied different straining scenarios, while monitoring the variations of E/I ratios in all cases. At first, to explore the effect on the original TK03.GAD distribution shape of pure compressional strain, we applied a series of oblate deformation tensors in the form (expressed as eigenvalues) of s1 = s2 > s3, with s1 vertical. The value of the (normalized) eigenvalue of s3 ranges from 0.9 to 0.2 (Table 3). We then varied the orientation of the eigenvector s3 with respect to the average declination of the distributions, ranging from 0° to 20°. Geometrically, this replicates different tectonic stresses oriented parallel to the strata but with a different azimuth (Figures 4, 5). After each simulated deformation we calculate the average inclination and the elongation of the distribution for comparison with the E/I value expected from the TK03.GAD model.
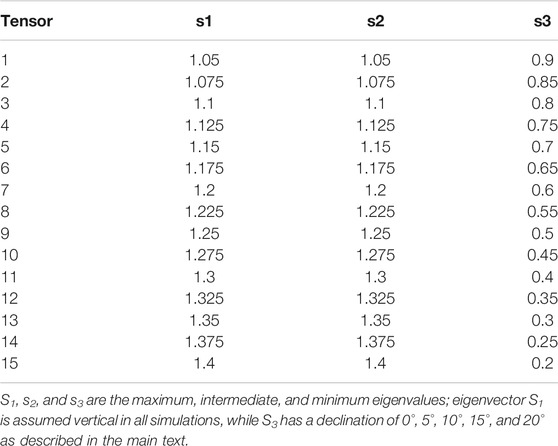
TABLE 3. List of strain tensors applied to the TK03.GAD distribution in the case of shortening without tilting.
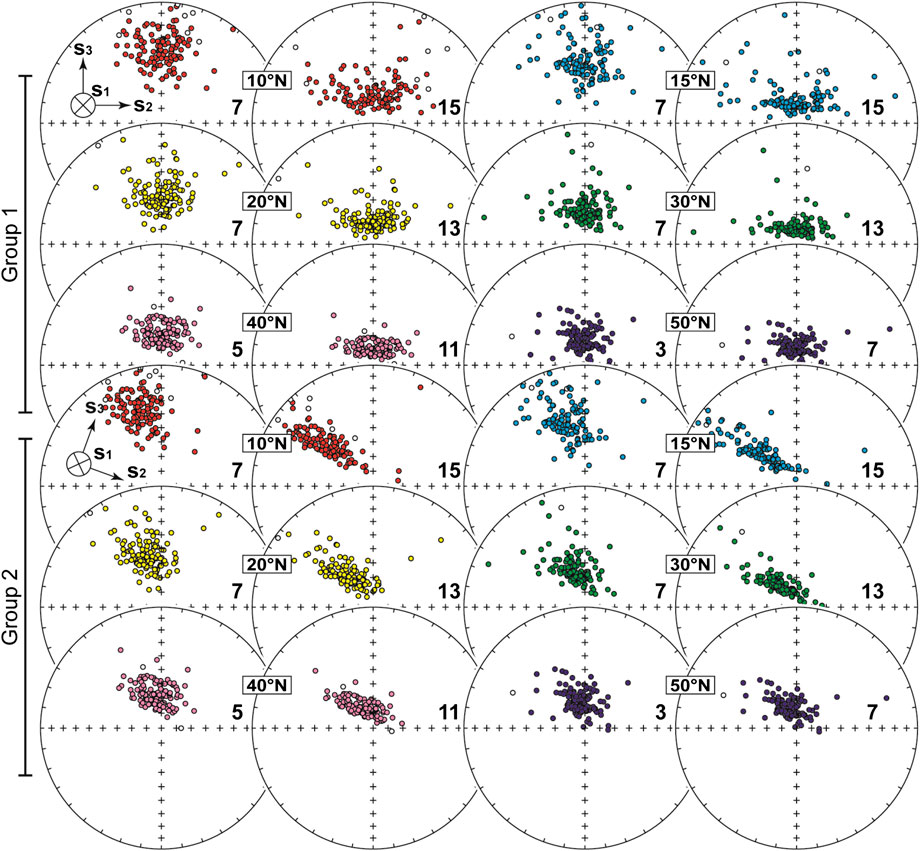
FIGURE 4. Effect of simulated deformations, without strata tilting, on the TK03.GAD directions datasets. The latitude of the generated dataset is also indicated, and the colors of the data are as in Figure 3. Group 1 and 2 correspond respectively to a N-S and a 20°E oriented shortening, as represented by the eigenvectors of the strain matrix (S) shown in the insets. The bold numbers inside the projections indicate the S matrix applied to the set, listed in Table 3.
A more complex but more realistic scenario has been applied to the direction sets simulated for low (10°N) and mid (40°N) latitudes, with the aim of recreating the fabrics shown in Figure 1. The directions have been first flattened with f = ∼0.6 (Figures 1A). The weak cleavage and the strong cleavage fabrics are assumed to be the result of the sum of the flattening fabric and a successive strain. As the weak cleavage state is characterized by a prolate fabric with k1 > k2 = k3 (Figures 1B), while the strong cleavage by a triaxial fabric with k1 > k2 > k3 (Figures 1C), we applied to the flattened directions a deformation matrix calculated by either:
or
where Sw and St are the deformation matrix that simulate respectively the weak and the strong cleavage final stage, Pw (weak cleavage) and Pt (strong cleavage) are the (case sensitive) fabric that characterize the rocks, and F−1 is the inverse of the diagonal matrix F used to simulate the inclination shallowing (Table 2).
Results
Circular Distribution
The effect of inclination shallowing followed by simulated shortening is shown in Figure 2. As expected, the solely flattening results in a variation of the elongation from circular to E-W elongated (Figures 2B). This condition can be easily restored by the site-level E/I correction (Tauxe and Kent, 2004), which gradually increase the directions inclination using Eq. 1 until they are Fisher (1953) distributed (i.e., circular around the mean direction). The simple scenario of N-S shortening without rotation (i.e., bedding tilt) results in an increase of both elongation and inclination (Figures 2A,B, distribution 3). It is interesting to observe the influence of pre-existing tilting on the parameter variation, especially the inclination. The equal area projection 6 of Figures 2A shows the result of a N-S shortening simulation of distribution initially tilted by 10°N (blue ellipsis) and 10°S (red ellipsis). The final inclination is respectively ∼15° shallower and ∼14° steeper than the one obtained by the pure shear shortening (Figures 2B). This is also in agreement with the behavior in natural sedimentary rocks predicted by Borradaile (1997) and schematized in Figure 1. If tilting and paleomagnetic inclination are plunging toward the shortening direction, the final inclination with respect to the bedding will be flattened, while if the bedding and directions are antipodal, the final inclination will be steepened. Changing the orientation of the S matrix, will also affect the elongation direction, as shown in diagrams 7–9 of Figure 2. The inclination is less affected than during shortening parallel to the paleomagnetic declination, but the final elongation is not perpendicular to the declination, as expected if the inclination shallowing was the only filter acting on the data (Figures 2B, ellipses 9 and 9*). This concept is important also to help identifying the possible effect of finite strain in natural sedimentary rocks, as discussed below.
TK03.GAD Distributions
Effect of Strain Without Tilting
Figure 3 shows the simulated undeformed distributions. The calculated E/I lies in proximity to the expected values from the TK03.GAD model. We first apply the simplified model of strain that involves no pre-deformation rigid body rotation, with initial shortening parallel to the paleomagnetic declination (Figure 4, Group 1). The bold number within each equal area projection of Figure 4 corresponds to the applied tensor listed in Table 3. The effect on the expected E/I couplets is shown in Figure 5. The most extreme applied simulated deformations are probably very unlikely to be found in nature, especially without the folding and tilting affecting the rocks, and possibly other remagnetization effects that would modify or even replace the original directions (i.e., piezoremanent magnetization; PRM; Till et al., 2010). As expected, when s3 is parallel with the average declination there is a progressive increase of the inclination. The minimum of the curves in Figure 5 coincides with the point where the elongation direction changes from parallel to perpendicular with respect to the declination. Before that point they are systematically below the reference TK03.GAD values. Soon after the elongation direction shifts from parallel to perpendicular with respect to the declination, the elongation increases to values higher than the reference TK03.GAD curve (Figure 5).
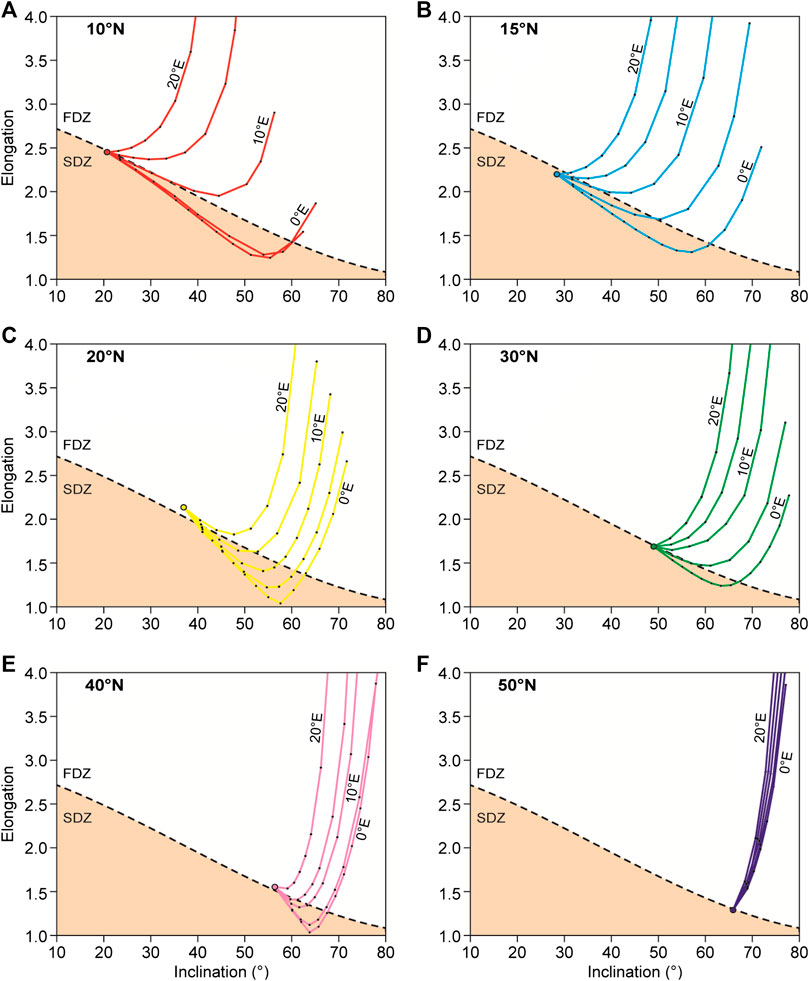
FIGURE 5. Effect on the elongation/inclination (E/I) pairs of the TK03.GAD directions sets distribution varying the angle between the average declination and the eigenvector s3 (i.e., shortening direction) of the strain (S) matrix (angles = 0°, 5°E, 10°E, 15°E, 20°E). Colors are as in Figures 3, 4, and the latitude of the set is indicated for clarity (bold).
When increasing the angular distance between the declination and the eigenvector s3, there is progressively less effect on the inclination. This occurs along with a stronger effect on the elongation (Figure 5). An angle of 20° between s3 and the distribution declination is enough to drive the E/I to unrealistic values at low levels of strain. Direction distributions at high latitude, which are predicted to be quasi-circular by the TK03.GAD model, acquire an unrealistic elongation at very low strain (Figures 5F).
Effect of Strain With Tilting
We followed a chain of events closer to reality by combining the effects on the 10°N and 40°N TK03.GAD distributions of an initial compaction flattening, followed by finite strain simulations that replicate the weak cleavage and the strong cleavage fabric observed in natural rocks. Both strains are applied to directions belonging to two limbs of a fold (Figures 6A). We first assumed a shortening parallel to the paleomagnetic declination (Figures 6B,C). After applying the compaction flattening matrix F (Table 2), both the 10°N and the 40°N distributions acquire a nearly circular shape (Figures 6C). Because the initial bedding tilt before deformation is unknown, in the case of the weak cleavage we applied an initial strata inclination of 10°, plunging both to the north (front limb) and to the south (back limb). The effect of the Sw matrix of Eq. 3 on the 10°N directions set is not significant in terms of inclination, but the distributions of both limbs acquire an elongation oriented E-W and falling below the reference TK03.GAD line (Figures 6B,C, distr. 1 and 2). The same strain simulation appears to have a more severe impact on the 40°N set, because both fold limbs are characterized by distribution shapes jumping above the TK03. GAD line (Fig. 6B,C, distr. 3 and 4). When applying the St matrix (Eq. 4), which replicates the strong cleavage scenario, we assumed an initial bedding tilt of 30° for both limbs. The combined effects of stronger strain and higher initial bedding are immediately visible on the E/I ratios of both the 10°N and the 40°N sets. The inclinations of the 10°N set do not show a dramatic variation, but in the front limb case the strained distribution (which gets sensibly smaller) is strongly E-W elongated, while the back limb is still well below the TK03.GAD line (Figures 6B,C, distr. 5 and 6). As for the weak cleavage simulation, the 40°N distribution appears to be more affected by the St matrix, with the front and the back limbs distributions showing respectively a marked shallowing and steepening of the inclination, parallel to a significant variation in elongation (Figures 6B,C, distr. 7 and 8).
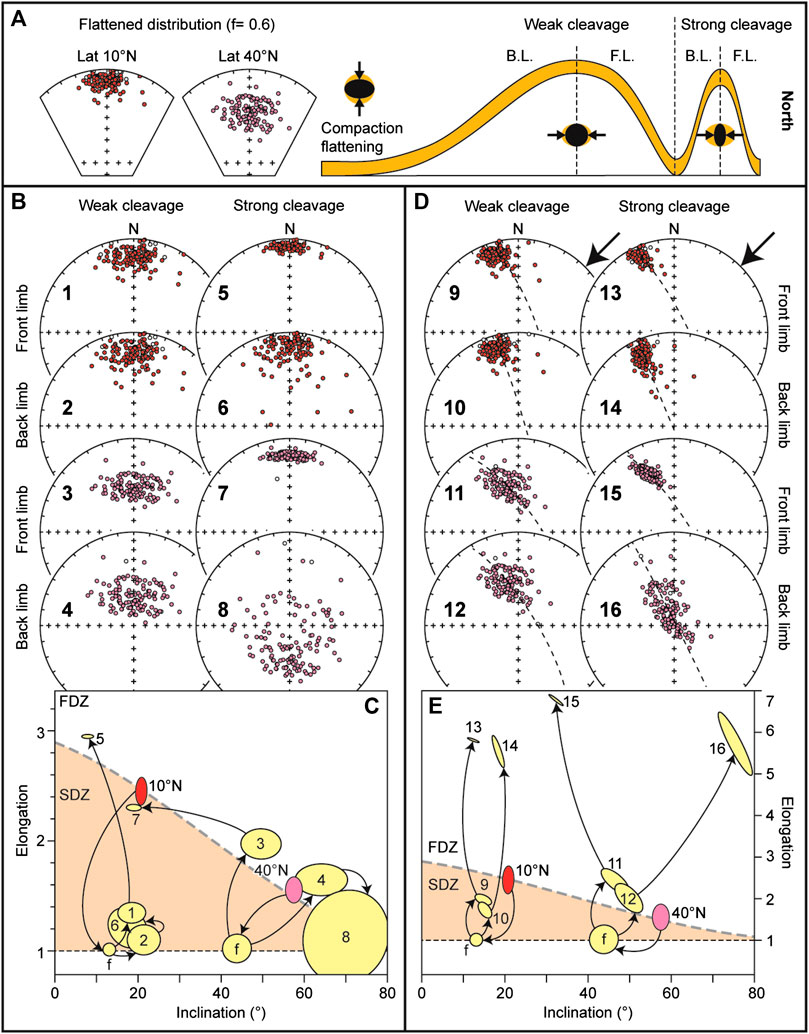
FIGURE 6. Effect of the strain simulation with strata tilting. (A) Two reference TK03.GAD distributions generated for a 10 and 40°N latitude are first subjected to inclination shallowing as described in the text; to the right hand side the conceptual model of the theoretical weak cleavage and strong cleavage conditions is shown on both the back limb (B.L.) and front limb (F.L.) of a fold system. (B) Effect of the different strain simulation on the two distributions as described in the main text; the bold numbers correspond to the ellipses shown in panel C. (C) Elongation vs. inclination of the data shown in panel B; data are shown together with the reference curve expected by the TK03.GAD model (dashed line), on which the original 10°N latitude (red) and the 40°N latitude (pink) sets lie; the dotted line is the minimum possible value of E (1 = circle); SDZ and FDZ = shallowed and flawed distribution zone, respectively. (D) and (E) are as B and C, but with a simulated shortening direction (minimum axis of the S matrix) oriented NE-SW.
Applying a shortening oriented 45° clockwise, has in general a more severe impact on all distributions (Figures 6D,E). The effect is particularly evident on the elongations; in all cases the strong cleavage scenario causes the E/I couples to assume unrealistic values. The weak cleavage simulations generate E/I values that are closer to the expected TK03.GAD reference line, nevertheless the direction of the elongation is significantly deviated (Figures 6D,E).
Discussion
Strain and Distributions Shape
In the case of the circular distributions, the effect of either inclination shallowing or finite strain (or the combination of both) is readily visible, because the distribution departs from the original circular shape (E = 1). With the assumed circle (30° of radius) all the simulations, except for the pure compaction shallowing, fall above what we name the “shallowed distribution zone” (SDZ). This is the area where we would find all E-W elongated ellipses affected only by compaction shallowing, and they could be restored through the “site mean” E/I correction (Tauxe and Kent, 2004). All other E/I values of this diagram (for a circle of initial 30° radius) indicate distributions that are flawed and affected by reorientation mechanisms like strain, which make them unreliable. We call this area of the diagram the “flawed distribution zone” (FDZ) (Figures 2B). From the analysis of the circle distribution it is also evident that the angle between the maximum axis of the elongation and the mean direction declination can be used as a reliability index. In fact, inclination flattening only produces elongations that are perpendicular with respect to the declination, and thus an angle that is not perpendicular is indicating a flawed distribution.
Similar concepts can be applied to the analyses of the TK03.GAD distributions. Applying the S matrix on the original TK03.GAD distributions, without imposing a pre-strain rotation (i.e., tilting), has an effect that depends mostly on the angle between the shortening direction (s3 eigenvector of the strain matrix) and the average direction declination. When they are parallel (Figure 4, Group 1) many of the E/I values of the deformed datasets, fall below the expected TK03.GAD function line, in the SDZ section of the diagram (Figures 5A–F). Analogously to what has been described for the circular distributions, this is the area of the diagram where normally the E/I pair of sets that are affected by sedimentary inclination flattening are found. Applying the E/I unflattening method of Tauxe and Kent (2004) to such a distribution would result in a final inclination even further steepened. As the degree of the simulated strain increases, the distributions acquire unrealistic E/I pairs, falling in the FDZ. Since high latitude simulations are originally quasi circular, they are promptly deformed to unrealistic E/I values by the simulated strain (Figures 5F). A similar effect is obtained by increasing the angle between the shortening direction and the declination (Figure 4, Group 2, Figure 5). This is the case because it affects more the distribution shape rather than the inclination. A shortening direction oriented E-W would in fact act only on the shape, which would peak straight to unrealistic values.
The effect of pre-strain tilting is affecting the final directions inclination (calculated with respect to the bedding plane) in a more complex way. With the applied boundary conditions (flattening and initial bedding tilt), especially in the strong cleavage scenario, the direction belonging to the front limb of the modeled fold tends to be flattened, while the ones belonging to the back limbs are steepened. This is in agreement with the behavior predicted by Borradaile (1997). Strain simulations with a shortening azimuth deviated from the mean declination affect more the elongation, also in terms of orientation. Any paleomagnetic set that is elongated neither parallel (as predicted by the TK03.GAD model) nor perpendicular (i.e., affected by compaction shallowing) with respect to the average declination should thus be considered potentially flawed. These analyses also show how sensitive the initial conditions like flattening and bedding tilt, which are a priori unknown, influence the final result.
This is why paleomagnetic analyses for paleogeographic reconstructions should always be carried out in combination with AMS analyses, as a proxy of the presence of finite strain. Only when the AMS fabric is sedimentary, a standard E/I correction can be safely applied.
The New Caledonia Case
Paleomagnetic Directions and Anisotropy of Magnetic Susceptibility
Dallanave et al. (2020) recently published paleomagnetic data from carbonate rocks exposed in the Koumac region of northern New Caledonia. New Caledonia is the emergent part of the northernmost Norfolk Ridge, which is in turn part of a large continental mass that is submerged for more than 90%, referred to as Zealandia (Mortimer et al., 2017; Sutherland et al., 2019). The sampled section (Sommet-Khian, 260 stratigraphic meters) consists of a massive basal pelagic micrite (0–83 m) overlain upsection by terrigenous–rich calciturbidites (83–260 m). For this work we exclude the dataset from the terrigenous-rich calciturbidite because of the general lower quality of the ChRM directions and a negative reversal test (see Dallanave et al., 2020 for details). The dataset from the massive micrite consists of 88 ChRM directions that allow a correlation of the section with Chrons C23n.2n to C21n (51–46 Ma, corresponding to the early-middle Eocene; Ogg, 2012). Of these 88 directions, 77 have been isolated using the interpolation proposed by Kirschvink (1980) and, to maximize the reliability, each direction was anchored (or not) to the origin of the demagnetization axes following the Bayesian criteria proposed by Heslop and Roberts (2016). Eight directions were determined by means of fisher mean on the vector end points, while three through great circles analyses (McFadden and McElhinny, 1988); (Supplementary Table S2). The dataset is statistically antipodal, with a positive bootstrap-based reversal test (Tauxe et al., 1991). Despite the high quality of the dataset, there is a mismatch between the average inclination from Sommet-Khian and the reference directions expected for this time (Veevers and Li, 1991; Torsvik et al., 2012). The average direction from New Caledonia is steeper (i.e., higher inclination) compared to the reference directions from the literature. When compared with the inclination derived from the synthetic global APWP of Torsvik et al. (2012), the resulted steepening is ∼10°. However, this reference compilation consists of a limited number of entries that has to go through multiple rotations to be plotted into Zealandia coordinates, and there is only one entry from the Australian plate (53 Ma; Torsvik et al., 2012) (Figures 7A–C; Supplementary Table S3). The steepening decreases to 5.4° if the inclination is compared with the APWP of Veevers and Li (1991), which is based on entries from Australia and India, but using old datasets with poorly defined quality criteria and age control (Figures 8A).
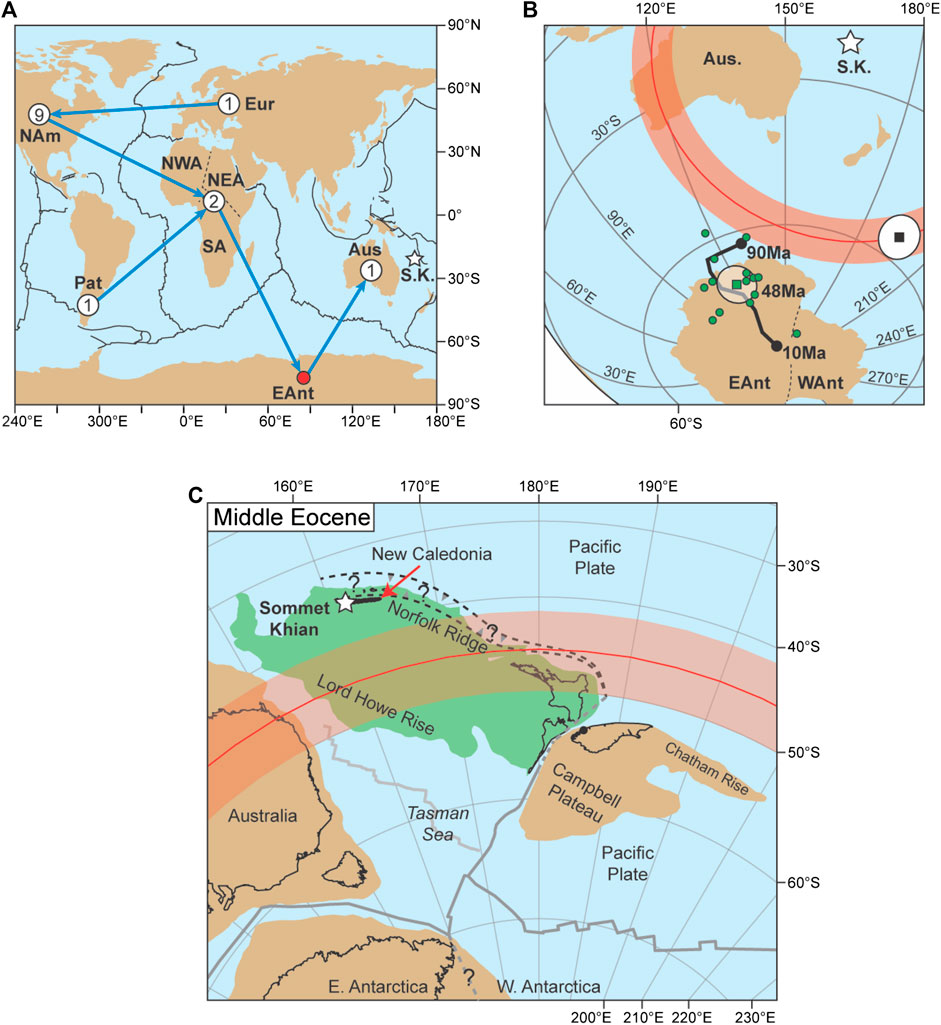
FIGURE 7. Geological and paleomagnetic-paleogeographic framework of the Sommet-Khian record from northern New Caledonia; in all panels: Aus = Australia; Eur = stable Europe; EAnt and WAnt = east and west Antarctica; NAm = north America; NWA, NEA, and SA = northwest, northeast, and south Africa; Pat = Patagonia; S.K. = Sommet-Khian. (A) Global plate configuration and circuits (blue arrows) connecting the Australian plate with the source of the paleomagnetic data for the 53–43 Ma interval included in the reference compilation of Torsvik et al. (2012); (Supplementary Table S3); white circle indicate the source plate of the data and the number of entries. (B) The average paleomagnetic pole from Sommet-Khian (black square with white 95% confidence cone) is compared with the reference paleomagnetic pole (green square) calculated averaging 14 entries (green dots) from the compilation of Torsvik et al. (2012) that fall within the 53–43 Ma window (Supplementary Table S3); the 90–10 Ma global synthetic apparent polar wander path from the same compilation, plotted in Australian coordinates, is also shown as thick black line; the red line with the shaded area shows that, even rotating the S.K. pole to toward reference 48 Ma one, they remain statistically distinguishable. (C) Paleogeographic reconstruction of the Southwest Pacific area in the middle Eocene (∼45 Ma); continental areas are filled in light brown except for northern Zealandia (light green); the light gray line is the Tasman Ocean spreading ridge, which activity ended during Chron 24n (∼53 Ma), and the dark gray lines are active spreading ridges; dotted black lines are the approximate position of the proto-Tonga-Kermadec subduction zone and the north-east dipping early Eocene east-dipping subduction zone inferred by the geology of New Caledonia (see text); the white star is the location of Sommet-Khian. While the reconstruction is based on the published reference data, the red line with the red shaded area is the paleolatitude and associated confidence boundaries obtained from the paleomagnetic directions from Sommet-Khian.
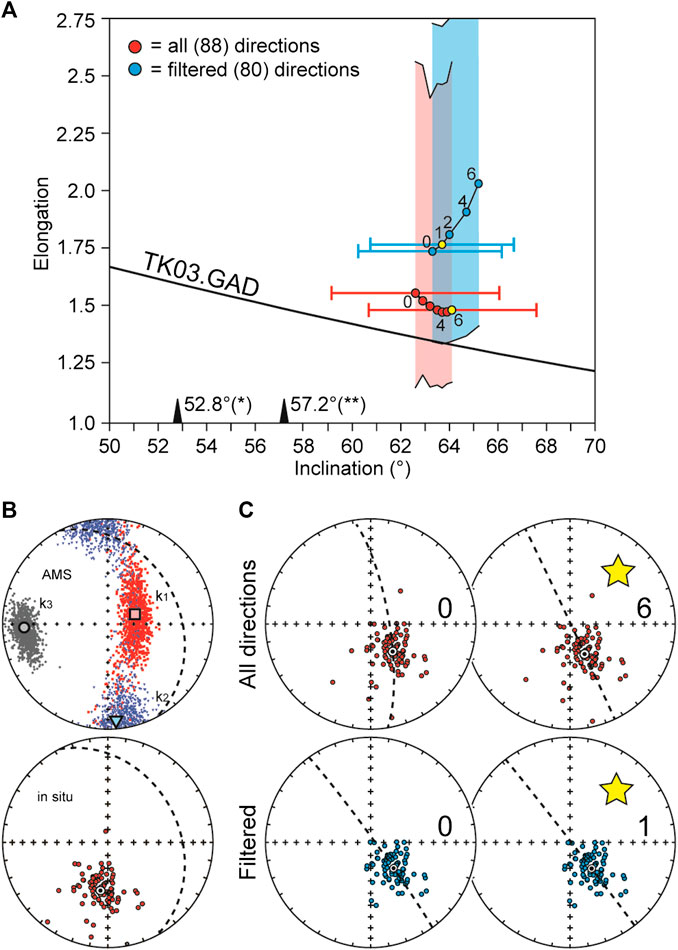
FIGURE 8. Paleomagnetic directions, anisotropy of magnetic susceptibility (AMS), and distribution shape analysis of Sommet-Khian. (A) Elongation vs. inclination (E/I) of the paleomagnetic distribution for the whole (red) and the filtered (blue) dataset, compared with the value expected by the TK03.GAD model; the yellow dots represent the “unstrained” condition where the elongation direction is parallel to the average declination, shown with the inclination 95% confidence angle determined by applying standard Fisher (1953) statistics; the elongation values of the original and “unstrained” steps are shown with the 90% confidence zone determined by means of 1,000 bootstrapped pseudo-dataset expected inclination calculated from the compilations of Torsvik et al. (2012*) and Veevers and Li (1991**) are shown. (B) Upper projection: AMS from Sommet-Khian; k1 (red symbols), k2 (blue symbols), and k3 (gray symbols) are respectively the major, intermediate, and minor axes of the AMS, with average direction of the eigenvectors; lower projection: characteristic remanent magnetization (ChRM) directions from Sommet-Khian in insitu coordinates, together with the Fisher (1953) mean; in both projections the dashed circle is the bedding plane; data from Dallanave et al. (2020). (B) Effect of the “unstraining” on the whole (red) and filtered (blue) dataset from Sommet-Khian; the yellow star indicates the condition where the elongation direction (dotted line) is parallel to the declination; the number within the diagrams indicate the matrix used (Table 4) and the associated E/I couple in panel A.
AMS data of 89 samples from Sommet-Khian yield an oblate tensor with a low degree of anisotropy (Jelínek, 1981) (Pj = 1.05). The foliation plane (defined by k1 and k2 axes of the AMS) does not coincide with the bedding, indicating a tectonic-induced magnetic fabric in contrast to a sedimentary fabric typically observed in absence of finite strain (Figures 8B). The orientation of this fabric is in agreement with the general tectonic style of New Caledonia, which is the result of a convergence broadly oriented NE-SW, perpendicular to the length of the island (e.g., Lillie and Brothers, 1969; Cluzel et al., 2012). Tectonic strain largely influences the AMS fabric (e.g., Parés et al., 1999) but using the absolute value of the AMS to quantify the internal strain of the rock is difficult because of the number of variables that can influence it (Evans et al., 2003).
Analysis of the Directions Distribution From Sommet-Khian
The first step is comparing the E/I ratio of the dataset from Sommet-Khian with the one predicted by the TK03.GAD model. The original ChRM directions have an elongation that falls above the value predicted by the TK03.GAD model. Repeated calculations on 1,000 bootstrapped pseudo-distributions (Tauxe et al., 1991) estimate a (fairly large) 90% confidence boundary for the elongation that overlaps with the expected value (Figures 8A), implying that the E/I ratio itself is, at a 90% confidence, realistic. The wide extension of the 90% confidence margins is likely due to the limited number (<100) of directions. This outlines the importance of having an adequate number of paleomagnetic directions for a fully reliable analysis. We repeated the same calculation using the dataset filtered from the three directions determined by great circle analyses and also eliminating five directions which VGP is > 45° apart from the mean paleomagnetic pole, similarly to the cutoff applied to the MM97 dataset of McElhinny and McFadden (1997). The obtained inclination is very similar, with a slightly higher elongation (Figures 8A). Despite the confidence margins, the fact that both datasets have an elongation higher than expected is an indication of potential contamination of the dataset, possibly steepened by the effect of strain.
We tried to restore the original inclination by progressively “unstrain” the paleomagnetic directions until they match the elongation predicted by the TK03.GAD model. In order to do this we considered the bedding also as a physical entity affected by the total strain. We therefore apply the “unstrain” matrix in the form of s1 > s2 = s3 with progressively higher degrees of elongation, with s1 parallel to the k3 AMS axis (Figure 8). We applied the “unstrain” matrix to all the ChRM directions in situ (IS) coordinates as well as to the bedding plane using the eigenvalues listed in Table 4, and we monitor the E/I couplets after correcting the dataset for (“unstrained”) bedding tilt (Table 5). We applied the same process to both the whole and the filtered dataset, so that we can evaluate the effect of outlier directions within the (not-filtered) dataset. In both cases the progressive “unstrain” led to a minor increase of the inclination, which however always falls within the confidence bounds of the original distribution (Figures 8A). The value of E changes in different fashion in the two cases: for the whole dataset it progressively decreases, but without crossing the model line. Despite that, the bootstrap-based 90% confidence interval indicates that the elongation is statistically acceptable throughout the whole “unstrain” process, and it reaches a minimum after applying matrix 4 of Table 4 (Figures 8A). The filtered dataset on the contrary is characterized by a steep rise of the elongation, which becomes statistically unacceptable (at a 90% confidence) after a very mild unstrain (S matrix 2 of Table 4; Figures 8A).
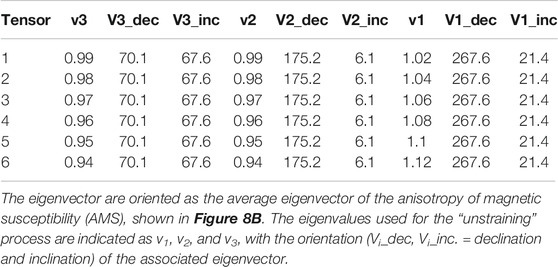
TABLE 4. List of the “unstraining” tensors applied to the paleomagnetic directions from Sommet-Khian.
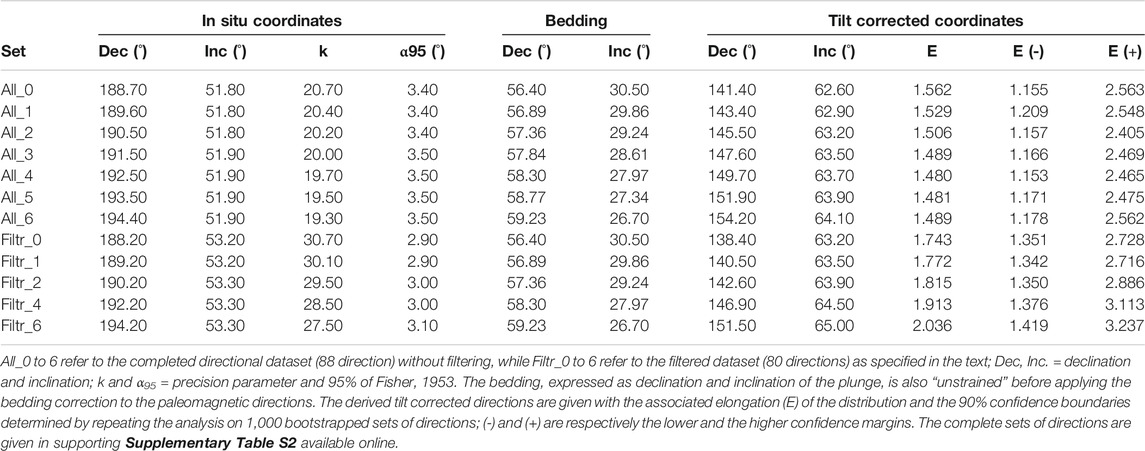
TABLE 5. Effect of the “unstraining” tensors on the paleomagnetic directions and bedding of Sommet-Khian.
A close inspection of the equal area projections, plotted together with the elongation direction (Figures 8C) reveals that the elongation assumes an orientation parallel to the declination after applying unstrain matrix 6 (in the case of the whole dataset) and 1 (in the case of the filtered dataset). Having the elongation parallel to the mean declination is, together with the latitude dependent specific value of E, a condition predicted by the TK03.GAD model. The inclinations obtained are 64.1 ± 3.5° and 63.5 ± 2.9° respectively for the whole and the filtered dataset (Figures 8A). In both cases the elongation is still statistically acceptable at a 90% of confidence. In synthesis, both datasets give similar corrected results, even if the limited number of directions results in wide elongation confidence bounds.
Paleogeographic Implications
The southwest Pacific area went through a complex tectonic and paleogeographic evolution during the Eocene, related to the inception of the Tonga-Kermadec subduction system (recent reviews can be found in Cluzel et al., 2012; Collot et al., 2020; Dallanave et al., 2018b, Dallanave et al., 2020; Maurizot et al., 2020a, Maurizot et al., 2020b; Sutherland et al., 2020). The Tonga-Kermadec subduction initiated in the middle Eocene immediately to the east of the Norfolk Ridge, the northernmost part of which is emerging to form the New Caledonia archipelagos (Figures 7C). The history of the eastern margin of northern Zealandia before the Tonga-Kermadec subduction is still debated, because the geology of New Caledonia suggests the presence of a pre-Tonga east-dipping subduction zone (Cluzel et al., 2012; Collot et al., 2020; Maurizot, 2011; Maurizot et al., 2020a, Maurizot et al., 2020b), which is, however, difficult to reconcile with the geologic history derived from seismic profiles acquired in the Tasman area (Sutherland et al., 2017). Zealandia is separated from continental Australia by the oceanic crust of the Tasman Ocean basin, which ended its spreading activity during magnetic anomaly 24 in the early Eocene (∼53 Ma; Gaina et al., 1998; Figures 7C). Therefore, middle Eocene paleomagnetic data from Australia should be applicable also to northern Zealandia. The most widely used APWP was compiled by Torsvik et al. (2012), but a closer look at the dataset reveals that there is only one early Eocene (53 Ma) entry from Australia for the entire Paleogene based on a study on the Barrington Volcano in New South Wales (Wellman et al., 1969, later confirmed by; Hill et al., 2002). Recent authochtonous data have been published only for the Oligocene (Hansma and Tohver, 2019). The reference Australian APWP for the Paleogene (and the entire time back to the Permian) is constructed mainly using data rotated from other plates. For this reason, the paleomagnetic record of Sommet-Khian is extremely valuable, because it is the first early-middle Eocene autochthonous directional dataset from northern Zealandia (and Australia).
The Eocene sedimentary record of the Koumac area lies on top of the Mesozoic basement, but New Caledonia as a whole is constituted by sedimentary, metamorphic, and igneous terranes that are overlain by allochthons of sedimentary, mafic, and ultramafic nappes obducted from the late Eocene with the opening of the North Loyalty Basin (Cluzel et al., 2001, Cluzel et al., 2005, Cluzel et al., 2006, Cluzel et al., 2012; Maurizot, 2011; Maurizot et al., 2020a). The paleomagnetic declination obtained by Dallanave et al. (2020) is in general agreement with the tectonic constraints, indicating a post-middle Eocene rotation of New Caledonia of about 60° CCW. The ChRM directions inclination is primary and should be usable (at a first inspection) as paleogeographic constraint.
The “unstrained” mean paleomagnetic inclination is ∼64° (Figures 8A). Using the dataset with the widest uncertainties (i.e., the unfiltered directions; 64.1 ± 3.5°) we obtained an average paleolatitude of deposition of 45.8°S (confidence boundaries: 50.5°S, 41.6°S; Figures 7C). We estimated precisely the expected paleolatitude of Sommet-Khian by using 14 paleomagnetic poles falling within the 53 and 43 Ma age window from the global selection of Torsvik et al. (2012), who also provide the parameters for rotating the poles into Australian coordinates (Figures 7–C; Supplementary Table S3). We selected this specific 10 Myr time-window because it is approximately centered on the age of the Sommet-Khian section (∼51–46 Ma). The resulting paleolatitude (33.4°S) is significantly lower than the 45.8°S calculated using the dataset from Sommet-Khian. The same applies for the paleolatitude of ∼38°S predicted by the dataset of Veevers and Li (1991). This implies that either the tectonic strain affecting the Sommet-Khian sediments pervasively affected the dataset (even if it seems acceptable within the statistically determined bounds) or the lack of autochthonous (i.e., Australian) data for the Eocene results in an erroneous paleolatitude estimation for the area. We are more inclined to consider that the problem resides in the Sommet-Khian directions, because the AMS data clearly indicate a non-sedimentary fabric. We stress the fact that without AMS analysis, the dataset could have been considered reliable, because of the presence of several reversals and a positive reversal test. A collection of autochthonous Eocene data from either continental Zealandia or Australia might add new constraints to resolve the paleogeography of the southwest Pacific area. Our approach highlights that AMS measurement should be always presented to help assessing the quality of the data.
Conclusion
Finite strain in sedimentary rocks induced by tectonism can deviate primary paleomagnetic directions. Using different simulated deformations on distributions drawn according to the TK03. GAD paleosecular variation model, we show how finite strain affects the shape of the directions distribution, which can be used as an indicator of the reliability of paleomagnetic directions. Only if the shape agrees with the expected one based on the TK03.GAD model, a direction distribution can be regarded as of high quality. Otherwise, a “flawed” distribution shape is indicative of post depositional changes requiring further investigation. We apply this concept to a recently published early-middle Eocene paleomagnetic and AMS dataset from New Caledonia. Despite the high quality of the directions and a positive reversal test, the paleomagnetic inclination from New Caledonia is considerably steeper than the one expected from published reference datasets, which are however limited in number and mostly rotated into Australian coordinate from other plates. Paleomagnetic directions from New Caledonia are likely affected by some amount of finite strain, as revealed by a weak prolate AMS fabric of tectonic origin. The distribution shape appears to be in agreement with the TK03.GAD model within a (large) 90%-bootstrap-determined confidence boundaries. Nevertheless, the presence of an AMS tectonic fabric is enough to undermine the reliability of the data. New Eocene data from continental Australia and/or Zealandia should solve the conflict between the autochthonous paleomagnetic dataset and the reference data, which, as is, results in a considerable paleolatitude discrepancy. More importantly, we suggest that AMS measurements should be always measured and presented together with directional datasets when performing paleogeographic reconstructions based on paleomagnetic data from sedimentary rocks.
Data Availability Statement
The original contributions presented in the study are included in the article/Supplementary Material, further inquiries can be directed to the corresponding author.
Author Contributions
All authors listed have made a substantial, direct, and intellectual contribution to the work and approved it for publication.
Funding
ED is supported by the Deutsche Forschungsgemeinschaft (DFG) through grants DA1757/1-1 and DA1757/2-1.
Conflict of Interest
The authors declare that the research was conducted in the absence of any commercial or financial relationships that could be construed as a potential conflict of interest.
The reviewer (DK) declared a past co-authorship with one of the authors (UK) to the handling editor.
Acknowledgments
We thank SS (Editor) and the Reviewers for the comments that greatly improve the quality of the manuscript.
Supplementary Material
The Supplementary Material for this article can be found online at: https://www.frontiersin.org/articles/10.3389/feart.2020.592277/full#supplementary-material.
References
Besse, J., and Courtillot, V. (2002). Apparent and true polar wander and the geometry of the geomagnetic field over the last 200 Myr. J. Geophys. Res. 107, 2300. doi:10.1029/2000JB000050
Blatt, H., and Jones, R. L. (1975). Proportions of exposed igneous, metamorphic, and sedimentary rocks. Bull. Geol. Soc. Am. 86, 1085–1088. doi:10.1130/0016-7606(1975)86<1085:POEIMA>2.0.CO 2
Borradaile, G. J. (1997). Deformation and paleomagnetism. Surv. Geophys. 18, 405–435. doi:10.1023/A:1006555906559
Cluzel, D., Aitchison, J. C., and Picard, C. (2001). Tectonic accretion and underplating of mafic terranes in the Late Eocene intraoceanic fore-arc of New Caledonia (Southwest Pacific): geodynamic implications. Tectonophysics 340, 23–59. doi:10.1016/S0040-1951(01)00148-2
Cluzel, D., Bosch, D., Paquette, J.-L., Lemennicier, Y., Montjoie, P., and Ménot, R.-P. (2005). Late Oligocene post-obduction granitoids of New Caledonia: a case for reactivated subduction and slab break-off. Isl. Arc. 14, 254–271. doi:10.1111/j.1440-1738.2005.00470.x
Cluzel, D., Maurizot, P., Collot, J., and Sevin, B. (2012). An outline of the geology of New Caledonia; from Permian–Mesozoic Southeast Gondwanaland active margin to Cenozoic obduction and supergene evolution. Episodes 35, 72–86. doi:10.18814/epiiugs/2012/v35i1/007
Cluzel, D., Meffre, S., Maurizot, P., and Crawford, A. J. (2006). Earliest Eocene (53 Ma) convergence in the southwest pacific: evidence from pre-obduction dikes in the ophiolite of New Caledonia. Terra. Nova. 18, 395–402. doi:10.1111/j.1365-3121.2006.00704.x
Cogné, J. P. (1987). Paleomagnetic direction obtained by strain removal in the Pyrenean Permian redbeds at the “Col du Somport” (France). Earth Planet Sci. Lett. 85, 162–172. doi:10.1016/0012-821X(87)90029-X
Cogné, J. P., and Perroud, H. (1985). Strain removal applied to paleomagnetic directions in an orogenic belt: the Permian red slates of the Alpes Maritimes, France. Earth Planet Sci. Lett. 72, 125–140. doi:10.1016/0012-821X(85)90122-0
Cogné, J. P., and Perroud, H. (1987). Unstraining paleomagnetic vectors: the current state of debate. Eos, Trans. Am. Geophys. Union. 68, 705–712. doi:10.1029/EO068i034p00705-01
Collot, J., Patriat, M., Sutherland, R., Williams, S., Cluzel, D., Seton, M., et al. (2020). “Geodynamics of the southwest Pacific: a brief review and relations to New Caledonian geology,”in. New Caledonia–geology, geodynamic evolution, and mineral resources. Editors P. Maurizot, and N. Mortimer (London, United Kingdom: Geological Society of London MemoirsGeological Society of London), 51, 1–14.
Constable, C., and Parker, R. L. (1988). Statistics of the geomagnetic secular variation for the past 5 m. Y. J. Geophys. Res. 93, 11569–11581. doi:10.1029/jb093ib10p11569
Creer, K. M., Irving, E., and Runcorn, S. K. (1954). The direction of the geomagnetic in great field in remote epochs britain. J. Geomagn. Geoelectr. 6, 163–168. doi:10.5636/jgg.6.163
Dallanave, E., Agnini, C., Bachtadse, V., Muttoni, G., Crampton, J. S., Strong, C. P., et al. (2015). Early to middle Eocene magneto-biochronology of the southwest Pacific Ocean and climate influence on sedimentation: insights from the Mead Stream section, New Zealand. Geol. Soc. Am. Bull. 127, 643–660. doi:10.1130/B31147.1
Dallanave, E., Agnini, C., Muttoni, G., and Rio, D. (2009). Magneto-biostratigraphy of the Cicogna section (Italy): implications for the late Paleocene–early Eocene time scale. Earth Planet Sci. Lett. 285, 39–51. doi:10.1016/j.epsl.2009.05.033
Dallanave, E., Agnini, C., Muttoni, G., and Rio, D. (2012). Paleocene magneto-biostratigraphy and climate-controlled rock magnetism from the belluno basin, tethys ocean. Italy. Palaeogeogr. Palaeoclimatol. Palaeoecol. 337–338, 130–142. doi:10.1016/j.palaeo.2012.04.007
Dallanave, E., Agnini, C., Pascher, K. M., Maurizot, P., Bachtadse, V., Hollis, C. J., et al. (2018b). Magneto-biostratigraphic constraints of the Eocene micrite–calciturbidite transition in New Caledonia: tectonic implications. N. Z. J. Geol. Geophys. 61, 145–163. doi:10.1080/00288306.2018.1443946
Dallanave, E., Kirscher, U., Hesse, R., Bachtadse, V., and Wortmann, U. G. (2018a). Palaeomagnetic time and space constraints of the early cretaceous rhenodanubian flysch zone (eastern alps). Geophys. J. Int. 213, 1804–1817. doi:10.1093/gji/ggy077
Dallanave, E., Maurizot, P., Agnini, C., Sutherland, R., Hollis, C. J., Collot, J., et al. (2020). Eocene (46-44 Ma) onset of Australia-Pacific plate motion in the southwest Pacific inferred from stratigraphy in New Caledonia and New Zealand. Geochem. Geophys. Geosys. 21, e2019GC008699. doi:10.1029/2019GC008699
DeMets, C., Gordon, R. G., and Argus, D. F. (2010). Geologically current plate motions. Geophys. J. Int. 181, 1–80. doi:10.1111/j.1365-246X.2009.04491.x
Evans, M. A., Lewchuk, M. T., and Elmore, R. D. (2003). Strain partitioning of deformation mechanisms in limestones: examining the relationship of strain and anisotropy of magnetic susceptibility (AMS). J. Struct. Geol. 25, 1525–1549. doi:10.1016/S0191-8141(02)00186-4
Fisher, N. I., Lewis, T., and Embleton, B. J. J. (1987). Statistical analysis of spherical data. Cambridge, United Kingdom: Cambridge University Press, 329.
Fisher, R. (1953). Dispersion on a sphere. Proc. Roy. Soc. Lond. A217, 295–305. doi:10.1098/rspa.1953.0064
Fleming, J. A. (1946). Geomagnetic secular variations and surveys. Proc. Phys. Soc. 58, 213–247. doi:10.1088/0959-5309/58/3/301
Gaina, C., Müller, R. D., Royer, J. Y., Stock, J., Hardebeck, J., and Symonds, P. (1998). The tectonic history of the Tasman Sea: a puzzle with 13 pieces. J. Geophys. Res. 103, 12413–12433. doi:10.1029/98JB00386
Hansma, J., and Tohver, E. (2019). Paleomagnetism of Oligocene hot spot volcanics in central queensland, Australia. J. Geophys. Res. Solid Earth. 124, 6280–6296. doi:10.1029/2019JB017639
Heslop, D., and Roberts, A. P. (2016). Analyzing paleomagnetic data: to anchor or not to anchor?. J. Geophys. Res. Solid Earth. 121, 7742–7753. doi:10.1002/2016JB013387
Hill, M. J., Gratton, M. N., and Shaw, J. (2002). Palaeomagnetic investigation of Tertiary lava from Barrington Tops, NSW, Australia, using thermal and microwave techniques. Earth Planet Sci. Lett. 198, 245–256. doi:10.1016/S0012-821X(02)00534-4
Jackson, M. J., Borradaile, G. J., Hudleston, P., and Banerjee, S. K. (1993). Experimental deformation of synthetic magnetite-bearing calcite sandstones: effects on remanence, bulk magnetic properties, and magnetic anisotropy. J. Geophys. Res. 98, 383–401. doi:10.1029/92JB01028
Jelínek, V. (1981). Characterization of the magnetic fabric of rocks. Tectonophysics 79, T63–T67. doi:10.1016/0040-1951(81)90110-4
Kent, D. V., and Tauxe, L. (2005). Corrected late triassic latitudes for continents adjacent to the north atlantic. Science 307, 240–244. doi:10.1126/science.1105826
King, R. F. (1955). The remanent magnetism of artificially deposited sediments. Monogr. Nat. R. Astron. Soc. Geophys. Suppl. 7, 115–134. doi:10.1111/j.1365-246X.1955.tb06558.x
Kirscher, U., Bilardello, D., Mikolaichuk, A., and Bachtadse, V. (2014). Correcting for inclination shallowing of early Carboniferous sedimentary rocks from Kyrgyzstan--indication of stable subtropical position of the North Tianshan Zone in the mid-late Palaeozoic. Geophys. J. Int. 198, 1000–1015. doi:10.1093/gji/ggu177
Kirschvink, J. L. (1980). The least-squares line and plane and the analysis of palaeomagnetic data. Geophys. J. Roy. Astron. Soc. 62, 699–718. doi:10.1111/j.1365-246X.1980.tb02601.x
Kligfield, R., Lowrie, W., Hirt, A. M., and Siddans, A. W. B. (1983). Effect of progressive deformation on remanent magnetization of permian redbeds from the alpes maritimes (France). Tectonophysics 97, 59–85.
Krijgsman, W., and Tauxe, L. (2006). E/I corrected paleolatitudes for the sedimentary rocks of the Baja British Columbia hypothesis. Earth Planet Sci. Lett. 242, 205–216. doi:10.1016/j.epsl.2005.11.052
Lillie, A. R., and Brothers, R. N. (1969). Geology of New Caledonia. N. Z. J. Geol. Geophys. 13, 145–183.
Lowrie, W., Hirt, A. M., and Kligfield, R. (1986). Effects of tectonic deformation on the remanent magnetization of rocks. Tectonics 5, 713–722. doi:10.1029/TC005i005p00713
Lund, S. P. (2018). A new view of long-term geomagnetic field secular variation. Front. Earth Sci. 6, 1–13. doi:10.3389/feart.2018.00040
Maurizot, P., Bordenave, A., Cluzel, D., Collot, J., and Etienne, S. J. G. (2020a). “Late Cretaceous to Eocene cover: from rifting to convergence,” in New Caledonia–geology, geodynamic evolution, and mineral resources, memoirs of the geological society, 51. Editor N. Mortimer (London, United Kingdom: Geological Society of London), 285.
Maurizot, P. (2011). First sedimentary record of the pre-obduction convergence in New Caledonia: formation of an Early Eocene accretionary complex in the north of Grande Terre and emplacement of the ‘Montagnes Blanches’ nappe. Bull. la Soc. Geol. Fr. 182, 479–491. doi:10.2113/gssgfbull.182.6.479
Maurizot, P., Robineau, B., Vendé-Leclerc, M., and Cluzel, D. (2020b). Chapter 1 Introduction to New Caledonia: geology, geodynamic evolution and mineral resources. Geol. Soc. London, Mem. 51, 1–12. doi:10.1144/m51-2019-33
McElhinny, M. W., and McFadden, P. L. (1997). Palaeosecular variation over the past 5 Myr based on a new generalized database. Geophys. J. Int. 131, 240–252. doi:10.1111/j.1365-246X.1997.tb01219.x
McFadden, P. L., and McElhinny, M. W. (1988). The combined analysis of remagnetization circles and direct observations in palaeomagnetism. Earth Planet Sci. Lett. 87, 161–172. https://doi.org/10.1016/0012-821X(88)90072-6.
Mortimer, N., Campbell, H. J., Tulloch, A. J., King, P. R., Stagpoole, V. M., Wood, R. A., et al. (2017). Zealandia: earth’s hidden continent. GSA Today. 27, 1–8. doi:10.1130/GSATG321A.1
Muttoni, G., Dallanave, E., and Channell, J. E. T. (2013). The drift history of Adria and Africa from 280 Ma to Present, Jurassic true polar wander, and zonal climate control on Tethyan sedimentary facies. Palaeogeogr. Palaeoclimatol. Palaeoecol. 386, 415–435. doi:10.1016/j.palaeo.2013.06.011
Muttoni, G., and Kent, D. V. (2019). Jurassic monster polar shift confirmed by sequential paleopoles from Adria, promontory of Africa. J. Geophys. Res. Solid Earth. 124, 1–19. doi:10.1029/2018JB017199
Ogg, J. G. (2012). “The geomagnetic polarity time scale,” in The geologic time scale 2012. Editors F. M. Gradstein, J. G. Ogg, M. D. Schmitz, and G. M. Ogg (Amsterdam, Netherlands: Elsevier), 85–113
Parés, J. M., van der Pluijm, B. A., and Dinarès-Turell, J. (1999). Evolution of magnetic fabrics during incipient deformation of mudrocks (Pyrenees, northern Spain). Tectonophysics 307, 1–14. doi:10.1016/S0040-1951(99)00115-8
Scheidegger, A. E. (1965). On the statistics of the orientation of bedding planes, grain axes, and similar sedimentological data. U. S. Geol. Surv. Prof. Pap. 525, 164–167.
Steinberger, B., and Torsvik, T. H. (2008). Absolute plate motions and true polar wander in the absence of hotspot tracks. Nature 452, 620–623. doi:10.1038/nature06824
Sutherland, R., Collot, J., Bache, F., Henrys, S., Barker, D., Browne, G. H., et al. (2017). Widespread compression associated with Eocene Tonga- Kermadec subduction initiation. Geology 45, 355–358. doi:10.1130/G38617.1
Sutherland, R., Dickens, G. R., Blum, P., Agnini, C., Alegret, L., Asatryan, G., et al. (2020). Continental scale of geographic change across Zealandia during Paleogene subduction zone initiation. Geology 48, 419–424. doi:10.1130/G47008.1
Sutherland, R., Dickens, G. R., Blum, P., Agnini, C., Alegret, L., Asatryan, G., et al. (2019). Tasman frontier subduction initiation and Paleogene climate. Proc. Int. Ocean Discov. Progr. 371, doi:10.14379/iodp.proc.371.101.2019
Tauxe, L. (2005). Inclination flattening and the geocentric axial dipole hypothesis. Earth Planet Sci. Lett. 233, 247–261. doi:10.1016/j.epsl.2005.01.027
Tauxe, L., and Kent, D. V. (2004). “A simplified statistical model for the geomagnetic field and the detection of shallow bias in paleomagnetic inclinations: was the ancient magnetic field dipolar?,” in Timescales of the paleomagnetic field, geophys. Monogr. Editors J. E. T. Channell, D. V. Kent, W. Lowrie, and J. G. Meert (Washington, DC: American Geophysical Union), 101–115.
Tauxe, L., and Kent, D. V. (1984). Properties of a detrital remanence carried by haematite from study of modern river deposits and laboratory redeposition experiments. Geophys. J. Roy. Astron. Soc. 77, 543–561.
Tauxe, L., Kodama, K. P., and Kent, D. V. (2008). Testing corrections for paleomagnetic inclination error in sedimentary rocks: a comparative approach. Phys. Earth Planet. In. 169, 152–165. doi:10.1016/j.pepi.2008.05.006
Tauxe, L., Kylstra, N., and Constable, C. (1991). Bootstrap statistics for paleomagnetic data. J. Geophys. Res. 96, 11723–117490. doi:10.1029/91jb00572
Tauxe, L. (2010). Paleomagnetic principle and practice. New York, NY: Kluwer academic publishers, 301.
Tauxe, L., Shaar, R., Jonestrask, L., Swanson-Hysell, N. L., Minnett, R., Koppers, A. A. P., et al. (2016). PmagPy: software package for paleomagnetic data analysis and a bridge to the magnetics information consortium (MagIC) database. Geochemi. Geophys. Geosys. 17, 2450–2463. doi:10.1002/2015GC006307
Till, J. L., Jackson, M. J., and Moskowitz, B. M. (2010). Remanence stability and magnetic fabric development in synthetic shear zones deformed at 500°C. Geochemistry, Geophys. Geosystems. 11, Q12Z21. doi:10.1029/2010GC003320
Torsvik, T. H., Müller, R. D., Van der Voo, R., Steinberger, B., and Gaina, C. (2008). Global plate motion frames: toward a unified model. Rev. Geophys. 46, 1–54. doi:10.1029/2007RG000227.1
Torsvik, T. H., Van der Voo, R., Preeden, U., Mac Niocaill, C., Steinberger, B., Doubrovine, P. V., et al. (2012). Phanerozoic polar wander, palaeogeography and dynamics. Earth Sci. Rev. 114, 325–368. doi:10.1016/j.earscirev.2012.06.007
Van der Voo, R. (1993). Paleomagnetism of the atlantic, tethys and iapetus oceans. Cambridge, United Kingdom: Cambridge University Press, 411.
Veevers, J. J., and Li, Z. X. (1991). Review of seafloor spreading around Australia. II. Marine magnetic anomaly modelling. Aust. J. Earth Sci. 38, 391–408. doi:10.1080/08120099108727980
Wang, C., Gordon, R. G., Zhang, T., and Zheng, L. (2019). Observational test of the global moving hot spot reference frame. Geophys. Res. Lett. 46, 8031–8038. doi:10.1029/2019GL083663
Keywords: paleomagnetic directions, TK03.GAD, finite strain, paleogeographic reconstruction, anisotropy of magnetic susceptability (AMS)
Citation: Dallanave E and Kirscher U (2020) Testing the Reliability of Sedimentary Paleomagnetic Datasets for Paleogeographic Reconstructions. Front. Earth Sci. 8:592277. doi: 10.3389/feart.2020.592277
Received: 06 August 2020; Accepted: 16 November 2020;
Published: 23 December 2020.
Edited by:
Sara Satolli, G. d'Annunzio University of Chieti and Pescara, ItalyReviewed by:
Dennis Kent, Lamont Doherty Earth Observatory (LDEO), United StatesBaochun Huang, Peking University, China
Copyright © 2020 Dallanave and Kirscher. This is an open-access article distributed under the terms of the Creative Commons Attribution License (CC BY). The use, distribution or reproduction in other forums is permitted, provided the original author(s) and the copyright owner(s) are credited and that the original publication in this journal is cited, in accordance with accepted academic practice. No use, distribution or reproduction is permitted which does not comply with these terms.
*Correspondence: Edoardo Dallanave, ZWRvYXJkb0B1bmktYnJlbWVuLmRl