 Leny Montheil
 Virginia G. Toy
 James M. Scott
 Thomas M. Mitchell
 David P. Dobson
- 1Géosciences Montpellier, UMR 5243, Université de Montpellier, Montpellier, France
- 2Institut für Geowissenschaften, Johannes Gutenberg-Universität Mainz, Mainz, Germany
- 3Department of Geology, University of Otago, Dunedin, New Zealand
- 4Department of Earth Sciences, University College of London, London, United Kingdom
In natural friction melts, or pseudotachylites, clast textures and glass compositions can influence the frictional behavior of faults hosting pseudotachylites, and are, in turn, sensitive to the processes involved in pseudotachylite formation. Quantification of these parameters in situations where the host rock composition and formation conditions are well-constrained, such as analogue experiments, may yield calibrations that can be employed in analysis of natural pseudotachylites. In this paper, we experimentally-generated pseudotachylites in granitoid rocks (tonalite and Westerly granite) at Pconf = 40 MPa and slip rates of ∼0.1 m s−1, comparable to the conditions under which natural pseudotachylite is known to form in Earth’s upper crust. We find variations in both clast textures and glass compositions that reflect formation processes, and probably influence the frictional behavior of similar natural faults hosting pseudotachylite. Quantification of particle size and shape distribution with a semi-automatic image analysis method, combined with analysis of glass and host-rock composition of these experimentally generated pseudotachylites, reveals that the textures of pseudotachylite material evolved by combinations of 1) comminution, 2) heterogeneous frictional flash melting, and 3) homogeneous (diffusive) clast melting and/or marginal decrepitation. Fractal dimensions of pseudotachylite-hosted clasts (D ∼ 3) that are greater than those of marginal fragmented host rock particles (gouge, D ∼ 2.4), reflect an increase of the intensity of comminution by slip localisation during a pre-melting phase. Chemical analyses demonstrate that these pseudotachylite glasses were generated by frictional flash melting, where host rock phases melt individually. Biotite is the least resistant to melting, feldspar intermediate, and quartz is the most resistant. The peudotachylite glass generated in these experiments has an alkaline composition, is depleted in SiO2 compared to the bulk host-rock, and shows heterogeneous compositions in a single sample related to proximity to host-rock minerals. The percentage contributions of host rock phases to the melt, calculated by a mixing model, shows that glass compositions are dominated by plagioclase and biotite. Within the melt, margins of clasts were dissolved uniformly by diffusion and/or affected by marginal decrepitation, resulting in convex and round shapes with convexities averaging ∼0.8 and circularities averaging ∼0.65.
Introduction
The porosity, permeability and frictional strength of fault’s “principal slip zones” are influenced by the size and shape distributions of their constituent components. These parameters change as component sizes and shapes are modified by coseismic comminution, alteration and melting (Storti et al., 2007; Abe and Mair, 2009), as cements precipitate from circulating aqueous fluids, and as pseudotachylites (frictional melts) form and solidify (Mitchell et al., 2016). These modifications change the effective frictional strength of a fault, which affects earthquake nucleation and propagation (Scholz, 1998).
Brittle faults are composed of fractured rock (cataclasite, gouge), with or without pseudotachylite. Pseudotachylites are typically (but not exclusively) aphanitic rocks comprising an amorphous matrix enclosing host rock clasts. Pseudotachylites form by frictional melting during rapid fault slip, when the conversion of frictional energy to heat produces sufficient temperature to exceed the melting temperature of some protolith minerals. Phyllosilicates or inosilicates are preferentially melted compared to tectosilicates (Sibson, 1975; Allen, 1979; Maddock, 1983; Toyoshima, 1990; Maddock, 1992; Magloughlin and Spray, 1992; Lin and Shimamoto, 1998; Kanamori and Rivera, 2006; Spray, 2010). Fault vein pseudotachylites are found as thin (mm to cm), planar layers on their generating fault plane, commonly connected to high-angle injection veins containing greater volumes of friction melt (Sibson and Toy, 2006).
Evaluation of the evolution of shape and size of pseudotachylite material during seismic events, coupled with chemical analyses, should enable a better understanding of earthquake nucleation and arrest. Furthermore, experimental calibrations of relationships of chemistry and clast textures to the conditions at which pseudotachylite formed may be employed to determine generating conditions in natural examples. Past textural analyses of fault rocks, mainly focused on cataclasite and fault gouges, typically make relationships between 3-dimensional fractal dimension (D) of particle size distributions and generation processes (Sammis et al., 1987; Blenkinshop, 1991; Rawling and Goodwin, 2003; Storti et al., 2003; Heilbonner and Keulen, 2006). Theoretical calculations (Sammis et al., 1987) and experimental work (Biegel et al., 1989; Marone and Scholz, 1989) have shown that fragmentation by reasonable mechanisms in fault gouges generates particles with size distributions that have a fractal dimension (D) of 2.6. This value, which is associated with the constrained comminution model (Sammis et al., 1987), is considered a benchmark for fault gouge particle size distributions. However, natural fault rocks are more complex and present fractal dimensions ranging from 1.8 to 5.5 (Engelder, 1974; Blenkinshop, 1991). A D larger than 2.6 is generally associated with the dominance of cataclasis. In fault gouges it has been suggested to reflect either the introduction of abrasion (Morgan et al., 1996), or intensification of comminution, with D increasing to reach values approaching or exceeding 3 within narrow zones during coseismic slip (Storti et al., 2003). These processes depend on slip localization and of the intensity of fragmentation, and can be linked to coseismic slip rates since D increases with higher slip rates. A D larger than 2.6 is considered good evidence of coseismic rupture in natural (Balsamo and Storti, 2011) and experimental materials (Balsamo et al., 2014). A D smaller than 2.6 is associated with alteration processes (Blenkinshop, 1991) or chipping of small slivers of particles (Rawling and Goodwin, 2003). Fragmentation also affects the shape distribution of fault material. Coexistence of small, round, and smooth particles with large, angular, and rough particles is characteristic of comminution intensification (Heilbonner and Keulen, 2006) or of a change in the fragmentation process, depending on the size of those particles (comminution for large grains, abrasion for small grains, Bjørk et al., 2009).
In the previous literature, pseudotachylite-hosted clast size and shape distributions have been mostly studied qualitatively, with results showing that comminution and melt processes occur coevally during pseudotachylite generation and both influence size and shape distributions (Spray, 1995; Spray, 2010). The roundness of pseudotachylite-hosted quartz was quantified by Lin (1999), who found that pseudotachylite-hosted clast roundness is higher than that of fragmented rock material. Lin (1999) attributed this to attrition, marginal decrepitation and frictional melting. To improve our understanding of the impact of frictional melting on fault mechanics, more quantitative assessments, involving analyses of particle size and shape distributions, are needed. We have employed a semi-automatic size and shape determination method to obtain such distributions in experimentally-generated pseudotachylite hosted in granitoid rocks. Chemical analyses of the same samples yield information about incorporation of various constituent minerals into the melt from the protolith rock.
Materials and Methods
Experimental Procedure
The Slow to High Velocity Apparatus (SHIVA) at the National Institute of Geophysics and Volcanology (INVG) in Rome, Italy, was used to reproduce earthquake deformation conditions and coseismic frictional processes at the interface of two cylindrical specimens (55 mm in diameter and 40 mm in length, Figure 1A) that represents a simulated fault. Methods and operation of the apparatus were detailed by Di Toro et al., (2010). Tonalite and Westerly granite (described below) were selected as host rock as they are representative of the upper continental crust, where most pseudotachylites have been documented (Sibson and Toy, 2006). During the experiment, two cylindrical specimens were rotated against each other by two brushless engines in a rotary shear configuration, under a normal load of 40 MPa and at slip rates of 0.14 m.s−1 for tonalite and 0.08 m.s−1 for granite. Maximum shear stresses were 20 MPa for tonalite and 16 MPa for granite. The slip rates in these experiments differ by one- to two-orders of magnitude from typical coseismic conditions (slip rates of 1–10 m.s−1; Spray, 2010 and strain rates greater than 10−2 s−1; Sibson, 1980). They are the maximum slip rates that could be obtained and were selected as a trade off between rotation velocity and normal stress, to prevent sample damage.
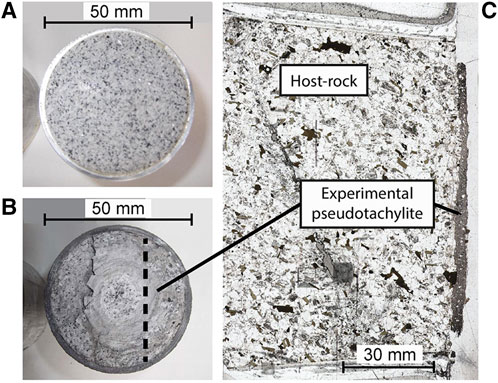
FIGURE 1. (A) Photography of Westerly Granite cylinder before and (B) after the run. The dotted line represents the location of thin sections cut perpendicular to the contact surface. (C) Example of a thin section used in this study that contains both host rock and pseudotachylite.
Initially, fine powders (gouge-like particles) were produced due to grinding at the contact surfaces of the specimens, then frictional melting was observed to occur after 1 s for tonalite and 3 s for granite (the videos of the experiments are available in the Supplementary Videos). Since the room temperature is 25°C, the melt cools and solidifies almost instantaneously to form pseudotachylite (Figures 1B,C). The experimental apparatus does not have the ability to contain the powders or melts so some of these materials are released from the slip plane during experiments (see videos in the Supplementary Videos). Consequently, some aspects of the microstructures that developed differ from those expected in natural systems (e.g. lack of injection veins). Conversely, the benefit of generating pseudotachylite with an experimental procedure is that key parameters such as normal load, slip rate and time can be controlled and determined. Also, we can exclude post-generation processes such as alteration, devitrification, metamorphism, or partial destruction during subsequent seismic events that limit the interpretation of natural examples (Kirkpatrick et al., 2009).
Point Counting
The proportions of host rock phases, clast phases and clast against matrix were obtained by point counting. A virtual grid of 300 squares was overlain on optical microscope images (Olympus BX 41, reflected light source: Olympus TH4-200, University of Otago) for the host-rock phases, and on low magnification (×100) BSE images obtained using an Electron Probe Microanalyser (JEOL JXA-8230 SuperProbe, University of Victoria) equipped with an X-ray spectrometer, for clast and matrix proportions. A phase, or the nature of material (clast or matrix), was associated with each square of the grid and theses raw counts were normalized to obtain the percentage of that phase or material. As we used two-dimensional images, the percentage calculated with this method is an area percentage. In the case of randomly distributed clasts the two dimensional and three dimensional clast and matrix proportions should be identical (Exner, 1972).
Electron Microbeam Analyses
Semi-quantitative chemical compositions of host rock minerals and pseudotachylite glasses were obtained by point analyses using Energy-dispersive X-ray Spectroscopy (EDS) attached to a scanning electron JEOL 6700F FE-SE at the University of Otago. The instrument was operated with a 20 nA beam current and an accelerating voltage of 15 kV at a constant working distance of 8.5 mm. The beam was calibrated on cobalt metal, and phases standardized to Smithsonian microbeam reference materials. Chemical analysis were evaluated with the AZtec program (Oxford Instruments, 2012).
Mixing Model
Since there is no possibility for ingress of melt from elsewhere or of subsequent alteration of the quenched pseudotachylite in the experiments, it is reasonable to assume that the pseudotachylite matrix compositions should be reproducible by mixtures of the mineral compositions in the host rocks. A linear least-squares mixing model was constructed as follows. Eight chemical components SiO2, TiO2, Al2O3, FeO and Fe2O3 (calculated as “FeO”, CaO, MgO, Na2O and K2O) were included in the calculation. The model concentration of the i‐th chemical component,
Particle Size and Shape Distributions
Backscattered Electron (BSE) images were obtained using a JEOL JXA-8230 SuperProbe. To capture the maximum possible range of particle sizes, BSE images were acquired at a variety of magnifications. In order to analyse an equal area at each magnification we acquired one image at ×100, ×200 and ×400. The sizes of particles observed and documented is this study range from 1 μm to 110 μm. Size and shape measurements were obtained by treating BSE images (Figure 2A) with the semi-automatic Matlab code Gray Scale Image Analyses (Bjørk et al., 2009, Supplementary DataSheet 1), that employs a greyscale thresholding process to separate grains from background matrix (Figure 2B). The area (A), the perimeter (P) and the convex perimeter (Pc, that can be compared to a rubber-band stretched around the particle; Bjørk et al., 2009) of each particle were calculated from the Matlab output image (Figure 2B) using ImageJ (Schneider et al., 2012). In all analyses, the number of particles detected was large (Table 3) and the analyses are thus statistically robust. We use the relation:
(Hartmann, 1969) to characterize the particle size distribution. N(S) is the number of particles or cumulative frequency; S is the equivalent diameter which is calculated from the relation
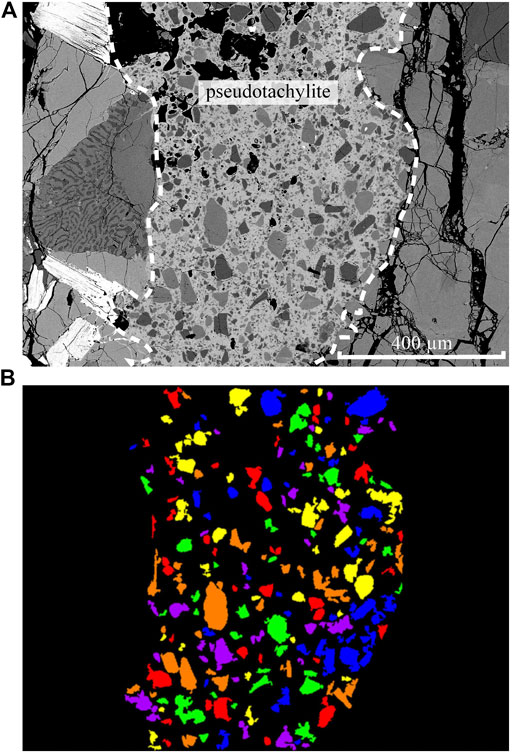
FIGURE 2. Illustration of the semi-automatic particle size and shape method based on the Matlab code “Gray Scale Image Analyses” (Bjørk et al., 2009). (A) Original BSE image. (B) Output image after code application. Each grain is differentiated from the background matrix based on its gray scale and assigned a random color to facilitate later segmentation by automated analysis using ImageJ.
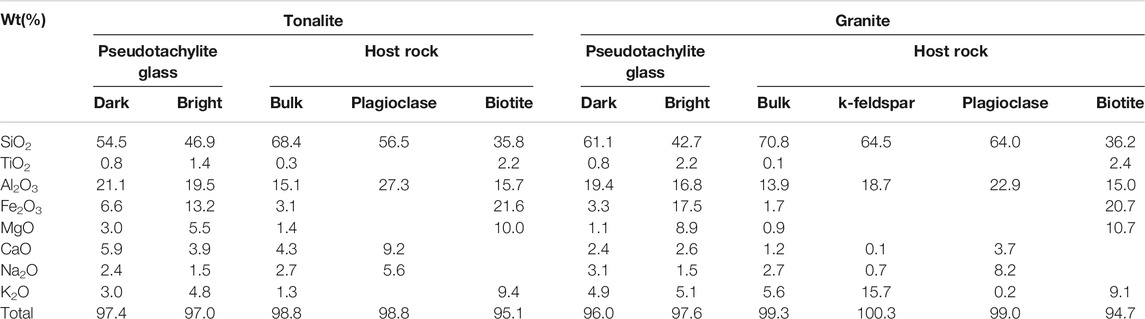
TABLE 1. Standardized semi-quantitative chemical analyses of pseudotachylite glass and host rock minerals in tonalite-hosted and granite-hosted specimens.
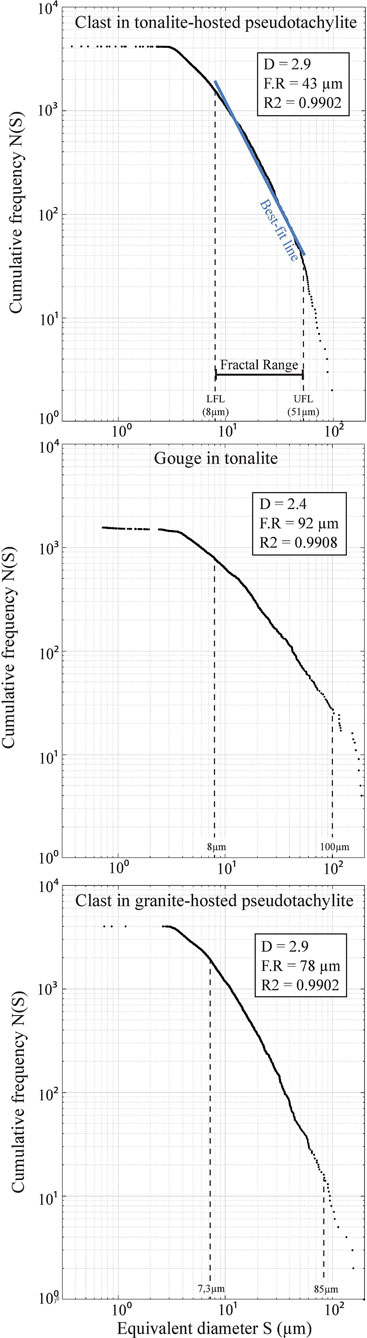
FIGURE 3. Example of particle size distribution plot. Log-log diagram of equivalent diameter (S) against cumulative frequency N(S) of clasts in pseudotachylite in the tonalite-hosted specimen. Fractal dimension (D) is measured as the slope of the straight line that fits the data. FR, Fractal Range; LFL, Lower Fractal Range; UFL, Upper Fractal Range.
The D that we measure is a 2D sampling of a 3D distribution as we use two-dimensional BSE images so there is a “truncation effect” (Exner, 1972). This effect is corrected by the relation:
(Sammis and Biegel, 1989) that we have applied to all the results presented in this study.
We used the shape descriptors convexity (Co) and circularity (Ci) to characterize the particle shape. Convexity is calculated from the squared ratio between the convex perimeter (Pc) and the perimeter (P):
(Bjørk et al., 2009) It is a measure of how convex a particle is, and ranges between 0 and 1, with 1 being a perfectly convex particle.
Circularity (a measure of the roundness of a particle), is calculated from:
(Bjørk et al., 2009) It ranges between 0 and 1, with 1 being a perfect circle. Characteristic shapes and their associated shape descriptor values are presented in Figure 4. To characterize the particle shape distributions, convexity and circularity are plotted against equivalent diameter (S) in a contoured colored diagram that emphasizes the highest concentrations of points with yellow to red colors (Figure 5). The mean, the standard deviation (σ) and the standard error
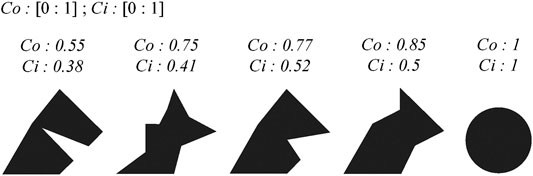
FIGURE 4. Test shapes demonstrating associated circularity and convexity values.
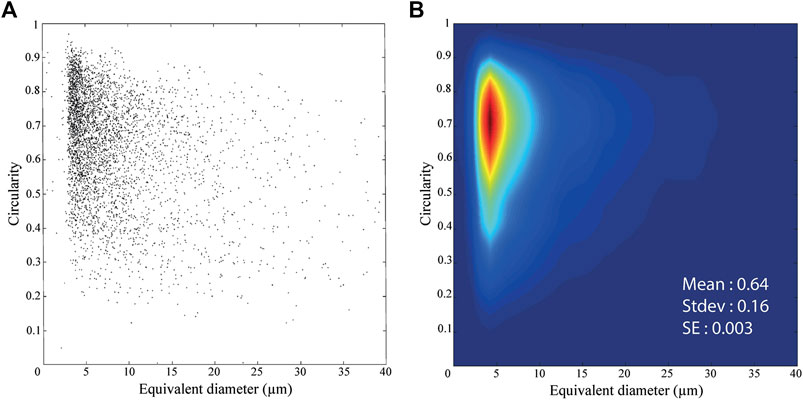
FIGURE 5. Example of particle shape distribution plot. Circularity against equivalent diameter (S) diagram for clasts in tonalite hosted pseudotachylite before (A) and after (B) contouring. Associated mean, standard deviation (σ) and standard error
Results
Specimen Description
The pseudotachylite’s host rocks are specimens of massive and competent tonalite and Westerly granite (Figure 1, Table 1). The tonalite is composed of subhedral grains (1 mm on average) of plagioclase (47%), quartz (37%) and biotite (14%). The Westerly granite is composed of subhedral grains (0.5 mm on average) of K-feldspar (31%), plagioclase (30%), quartz (29%) and biotite (8%).
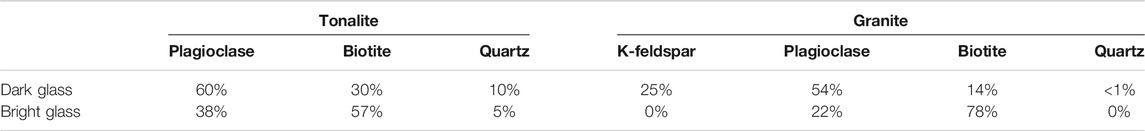
TABLE 2. Percentage of the influence of host rock phases on glass composition. Calculated with a mixing-model from Dobson et al., (in press) based on the composition presented in Table 1.
Contacts between host rock and pseudotachylite tend to be abrupt, although feldspar and quartz in contact with the pseudotachylite vein are extensively fragmented into a gouge comprising 1–110 µm particles in the tonalite specimen (Figure 6A). Host rock biotites are not fragmented but do contain kink-bands (Figure 6D). In the tonalite, the pseudotachylite averages 0.6 mm thick and is composed of 46% glassy matrix and 54% clasts comprising quartz (55%) and plagioclase (45%) that range from 1 to 100 µm. In the Westerly granite, the pseudotachylite is thicker (1 mm) and composed of 38% glassy matrix and 62% clasts ranging from 1 to 110 µm. These clasts comprise quartz (53%), plagioclase (26%) and K-feldspar (21%).
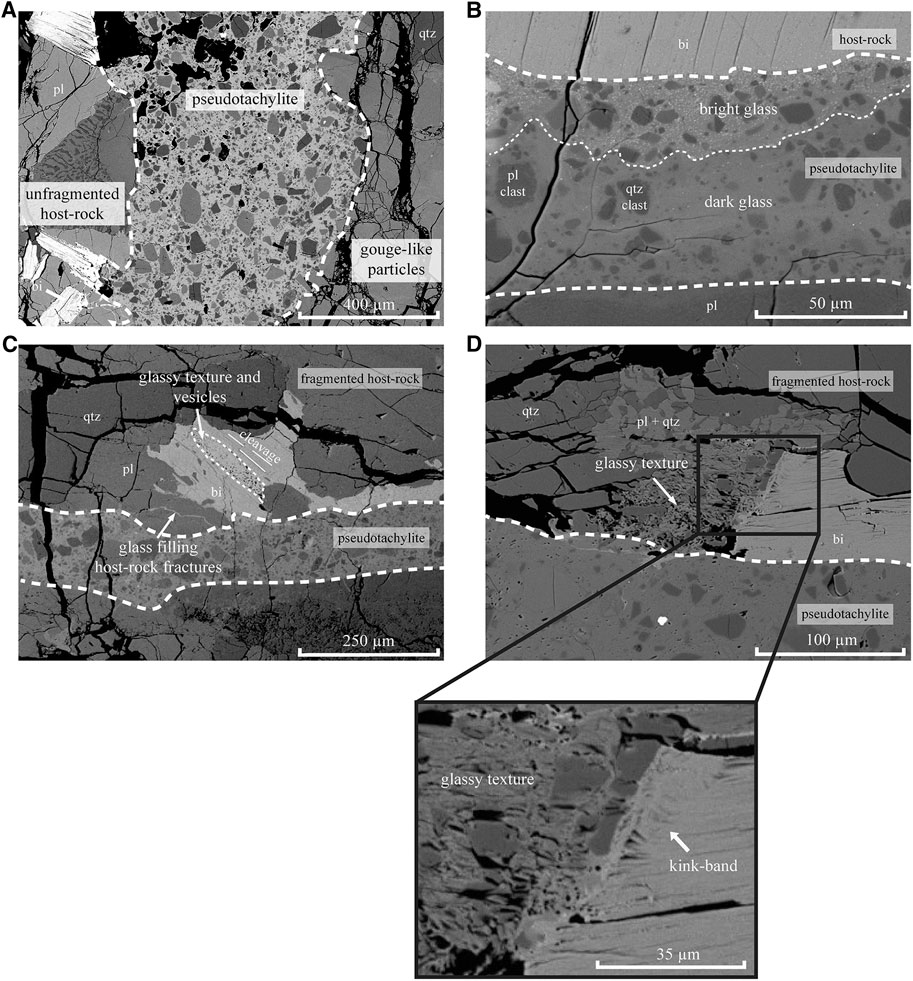
FIGURE 6. BSE images of the tonalite-hosted specimen. (A) General view of pseudotachylite surrounded by fragmented host rock (right) and unfragmented host rock in sharp contact with the pseudotachylite (left); (B) enlargement of pseudotachylite – biotite contact, illustrating the glass heterogeneity, with brighter glass close to biotite; (C) glassy texture and vesicles along biotite cleavage and evidence of melt percolation around plagioclase; (D) melting texture of plagioclase within a primary symplectite of plagioclase and quartz. Inter-grown quartz is preserved compared to the surrounding plagioclase. Kink-bands are present in biotite.
The glassy matrix of the pseudotachylite appears fairly homogeneous in both granite and tonalite hosted specimens (Figures 6A,C). However, there are a compositional heterogeneities close to host-rock biotites that are in contact with the pseudotachylite. In these areas, the glass is brighter in BSE images, which indicates that the bulk atomic weight of the glass is enriched toward heavier elements (Figure 6B). This glass contains very small agglomerates of Fe-Ti oxide (<1 µm) that are also present as inclusions in biotite. Glass is also found to fill fractures at the contact between pseudotachylite and host rock, where it isolates plagioclase from the host rock (Figure 6C). Some of the host rock biotites and plagioclases in contact with pseudotachylite are partially replaced by glass and vesicles (Figures 6C,D). In biotite this replacement follows the cleavage.
Particle Size and Shape Distribution
Five datasets of particle size and shape were generated by the semi-automatic image analysis method. In the tonalite-hosted specimen, we analyzed pseudotachylite-hosted clasts, fragmented (gouge-like) host-rock particles, quartz clasts and plagioclase clasts (Figure 6A). In the granite-hosted specimen, only pseudotachylite-hosted clasts were analyzed. This heterogeneity of the resultant data is due to 1) the rarity of fragmented host-rock particles surrounding the pseudotachylite in granite-hosted specimens and 2) the low greyscale difference between feldspar clasts and surrounding glass in granite-hosted specimens.
The size distributions of pseudotachylites-hosted clasts in both tonalite and Westerly Granite are characterized by a D close to 3 (Table 3, Figure 3). This fractal dimension is representative of the clast population, which covers a large fractal range (Table 3). However, it is not possible to fit a straight line well to the log-log diagram for very small particles (<7 µm). The fractal dimension for this low fractal range is significantly lower than that of the higher parts of the fractal range (D ∼ 2). The size distribution of marginally fragmented host-rock (gouge) particles in the tonalite specimen has a lower fractal dimension (D ∼ 2.4) than that of clasts in pseudotachylite and does not show a different fractal dimension for very small particles (Table 3, Figure 3). The size distributions of quartz and plagioclase clasts in the tonalite specimen are similar with D values (∼3) comparable to those of the bulk clasts of granite and tonalite (Table 3).
The convexity and circularity distributions of clasts in the pseudotachylite are visually similar (Supplementary Image 1) and concentrated toward 1, with mean convexities of 0.8 and 0.76, and mean circularities of 0.68 and 0.64, respectively, for Westerly Granite- and tonalite-hosted specimens. Consideration of the means and Standard Errors
In the tonalite-hosted specimen, convexity and circularity distributions of quartz and plagioclase clast populations do not clearly differ. Circularities and convexities are similarly concentrated toward the value of 1 (i.e., very circular) (Supplementary Image 1). Statistically, means, standard deviations and standard errors are similar for both datasets and comparable with the other clast datasets (Table 3). This indicates that there is no statistically significant difference in the shape distribution of quartz and plagioclase clasts populations and that mineralogy does not affect the clast shape distribution.
Chemistry
The two host rocks have minerals with slightly different chemistries and this has influenced the compositions of the glasses in the pseudotachylites they host. For example, the tonalite has much more calcic plagioclase (An48Ab52) than the Westerly Granite (An20Ab80), and the glasses are also much more calcic (Table 1). As noted above, the pseudotachylite glasses are either dark or bright in backscattered electron images (Figure 6B). In the studied rocks, both glasses are alkaline but the dark glass is depleted in K2O, MgO, Fe2O3 and TiO2 and enriched in SiO2, Al2O3, NaO and CaO relative to the bright glass (Table 1). The glasses are classified, according to total alkali vs. silica (TAS classification, LeBas et al., 1986, Supplementary Image 2), in the tonalite as basaltic andesite (dark) and trachybasalt (bright), and as basanite (bright) and trachyte (dark) in the Westerly Granite. In a Na2O+CaO vs. SiO2 plot, where the various host rock minerals are also shown, the bright glass plots closer to biotite than the darker glass (Figures 7A,B).
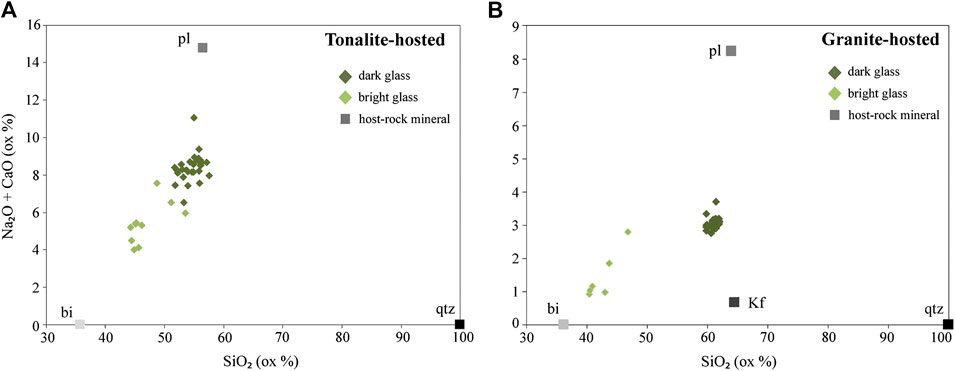
FIGURE 7. NaO2+CaO vs. SiO2 diagrams representing point analyses of bright glass (light green diamond) and dark glass (dark green diamond) for (A) tonalite-hosted samples and (B) granite-hosted samples. Squares represents host rock compositions.
Discussion
Influence of Frictional Flash Melting on Melt Chemistry.
There is a consensus that pseudotachylite melts are generated by disequilibrium “flash” melting (e.g., Spray, 1992; Spray, 2010), a process that is dependent on yield strength, fracture toughness and thermal conductivity, wherein certain composition phases are completely and almost instantaneously consumed by initial frictional heating within a gouge (Lin et al., 1992; Spray, 1992; Caggianelli et al., 2005; Spray 2010). Most commonly, hydrous minerals such as phyllosilicates or amphiboles are preferentially melted whereas soro-silicates are resistant to melting, with quartz being more resistant than feldspar (Bossiere, 1991; Lin et al., 1992; Lin and Shimamoto 1998). This generates a melt that is typically depleted in SiO2 and more hydrous than the bulk composition of the host rock (Shand, 1916; Sibson, 1975; Toyoshima, 1990; Lin et al., 1992; Spray, 1992; Lin and Shimamoto, 1998). The results we present confirm, experimentally and quantitatively, the relationships between melt chemistries and frictional flash melting in these previous studies.
In our specimens, we observed the co-existence of two glasses (dark and bright in BSE images, Figure 6B) in a single pseudotachylite, that are both lower in SiO2 than the bulk host-rock composition. We attribute the formation of these to initial flash melting of different proximal host-rock phases. Preservation of these sub-millimeter scale variations in melt composition clearly testifies to the rapid quenching of these melts. We calculated the percentage contribution of host-rock phases in granite and tonalite to the melt composition using the mixing model described in Dobson et al. (in press), and from the glass composition presented in Table 1. The composition of the pseudotachylite melt is approximated as a weighted average of the compositions of the minerals, which comprise the host rock, with the weights being the modal percentage of each mineral.
In the tonalite hosted pseudotachylite, the dark glass (which is the dominant glass in this specimen) can be modeled as ∼60% plagioclase component, ∼30% biotite component and ∼10% quartz component. In the Westerly Granite-hosted specimen, similar mixing models indicate that the dark glass composition is dominated by plagioclase in slightly lesser proportion (54%) and that K-feldspar (25%), biotite (14%) and quartz (7%) were also involved in melt production (Table 2).
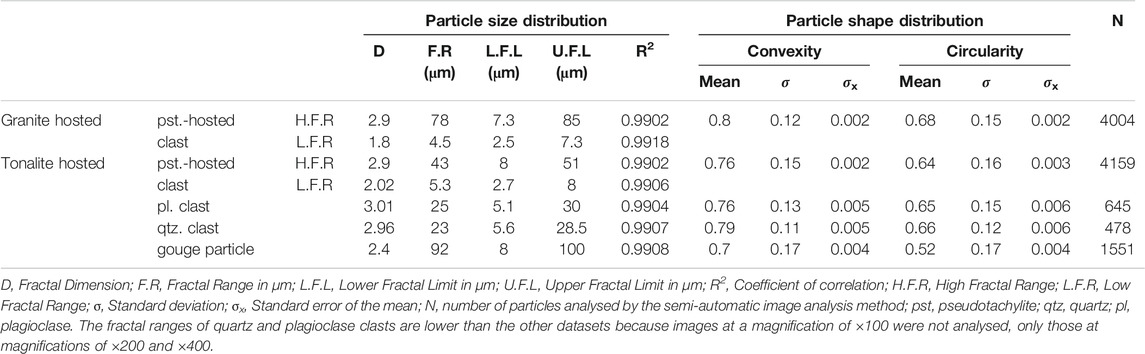
TABLE 3. Values of the different parameters that characterize the particle size and shape distribution of tonalite and granite-hosted specimens.
Like for the dark glasses, mixing models for the bright glass chemistries also require quartz and feldspar to have participated in the melting process, even though clasts of these phases are still present in the pseudotachylite. In the tonalite, the bright glass can be modeled to result from mixing of ∼57% biotite with 38% plagioclase and 5% quartz. In the Westerly Granite, where there is a second potassic phase in the form of K-feldspar, the bright glass still shows a trend toward biotite (Figure 7B) but the mixing models are more complicated. The bright glass in this rock can broadly be modeled as resulting from 78% biotite and 22% plagioclase indicating that this melting would have involved no K-feldspar or quartz. A better statistical fit for the bright glass composition can be modeled if small amounts of K-feldspar are a product of the melting reaction which is consistent with peritectic melting of biotite under fluid-absent conditions (see Dobson et al., in press, for further details). The bright glasses in both granite and tonalite hosted pseudotachylite are typically proximal to the biotites in the host-rock. This microstructural observation, in combination with the mixing model calculations (Table 2), and a general deficit of relict biotite as residual clasts, indicates that biotite was completely absorbed during frictional melting, producing a melt with a particularly biotite-like composition (bright glass). Once it was incorporated into the “main” melt (dark glass), which has a composition largely influenced by plagioclase, that melt became enriched in K2O, MgO, Fe2O3 and TiO2. The presence of glass along the cleavage planes of biotites that are in contact with pseudotachylite (Figure 6C) confirms that these cleavages represent a preferential pathway for melt to migrate into the host rock (Spray, 2010).
Our results confirm that in tonalite and Westerly granite hosted pseudotachylite, frictional flash melting heterogeneously affects host-rock phases, with biotite being the least resistant, feldspar intermediate, and quartz the most resistant. Rapid quenching of the pseudotachylite melt allowed preservation of glass microstructures that prove the independent melting of host-rock phases during this process (Figures 6B–D).
Our observation that pseudotachylite glasses isolate plagioclase fragment from the host rock (Figure 6C) indicates that melt produced within the main shearing zone tends to percolate into the adjacent fragmented host rock. Percolation through fractured host-rock could be a process that favors melt propagation and clast generation.
Impact of Comminution, Dissolution and Marginal Decrepitation on Clast Size and Shape Distributions.
In both tonalite and Westerly Granite, the pseudotachylites were unequivocally formed by processes occurring at the contact between the two cylindrical blocks as they were rotated. Our observations demonstrate those processes were i) comminution, and ii) melting stimulated by frictionally generated heat. From our quantification of the particle size distributions of pseudotachylite-hosted clasts and surrounding gouge-like grains we infer that melting was preceded by the comminution. This is consistent with our observation of powdered material emanating from the shearing surface before melting commenced (see Supplementary Videos). During this pre-melting phase, slip was localized in the future pseudotachylite zone, resulting in an intensification of comminution that preferentially generated small particles and increased the fractal dimension (Figure 8). These processes are reflected by the fractal dimension of clasts in pseudotachylite (D ∼ 3) being larger than that of gouge particles (D ∼ 2.4). The influence of such processes on D have been described previously in cataclasites with a carbonate protolith (Storti et al., 2003). A D ∼ 3 could result from “intense comminution” after fragmentation by constrained comminution (Storti et al., 2003) and we infer that our pseudotachylite material experienced this process prior to substantial melting. We also note that the D of the gouge is close to that predicted for comminution (D = 2.6, Biegel et al., 1989; Marone and Scholz, 1989).
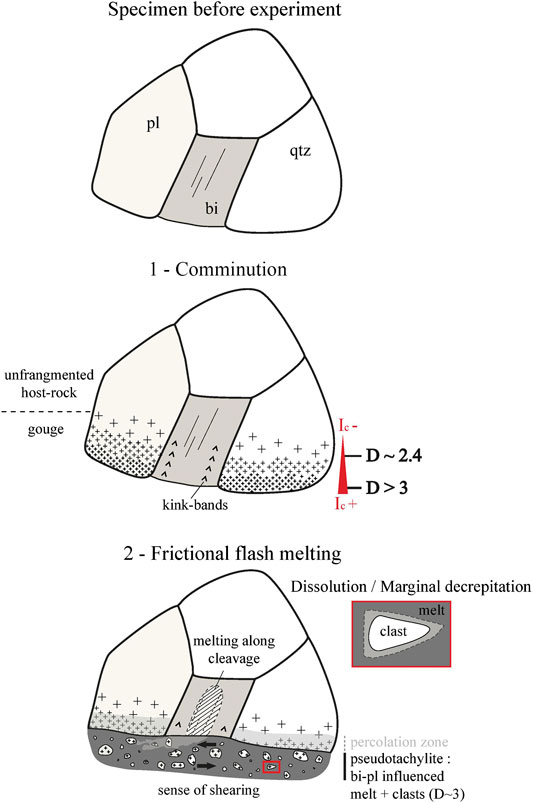
FIGURE 8. Unscaled schematic representation of the processes occurring during the generation of experimental pseudotachylite and relative chronology (fragmentation, frictional flash melting and marginal decrepitation). The relative chronology is not associated with time as the process is very fast (less than 5 s). IC: Intensity of comminution. D: Fractal dimension. Cross marks represent the limit of fragmention of the material, with small marks symbolising high fragmentation. The light gray borders around the clast in the zoomed red box represents the part of the clast that is dissolved by the melt.
Subsequently, frictional melting affected part of the gouge layer and all slip was subsequently focused into this zone (Figure 8). Sibson (1975), Magloughlin and Spray (1992), and Lin (1999) have previously qualitatively inferred that angular clasts become rounded by diffusive dissolution of their isothermal surface, i.e. melt corrosion, and that roundness of a clast is, therefore, characteristic of this mechanism. This process produces similar results to the process of marginal decrepitation described by Sibson (1975), where thermal stresses in the outer portions of clasts causes them to fracture. Both processes are controlled by diffusion and will preferentially remove material from regions of high curvature, causing clasts to become more spherical. This is seen in the distributions of the shape descriptors, convexity and circularity, with clasts in pseudotachylite populations having higher mean values of circularity and convexity, and smaller standard deviations than those in pure gouge particles. The less convex and angular shapes of gouge particles are consistent with comminution being the dominant process during the generation of this material (Heilbonner and Keulen, 2006).
The absence of statistically significant differences between fractal dimensions of size distributions, and convexity and circularity distributions of quartz and plagioclase clasts could indicate that the mineralogy of clasts does not affect their size or shape distributions. Furthemore, this demonstrates that diffusive dissolution and/or marginal decrepitation affects all clasts homogenously, i.e., without dependence on their composition. In addition to changing the shape of clasts, dissolution of clasts into the frictional melt will preferentially remove small clasts as this process only depends on the radius of curvature of a clast and not on its size. Consequently, the absolute volume of melt generated from a clast by diffusive dissolution is the same regardless of the size of that clast. This implies that relative to their size, small clasts will lose a larger proportion of volume than medium or large ones. This will result in the under-representation of small clasts in the overall clast population and cause a decrease of the fractal dimension at small clast sizes. This is supported by the low fractal dimension associated with clasts contained in the low fractal range (D ∼ 2 for clasts <7 µm) and a deflection in the curvature to the particle size distribution within the granite and tonalite-hosted pseudotachylite, which indicates that clasts close to the lower fractal limit (around 2 µm) are under-represented compared to those close to the upper fractal limit (7 µm).
Finally, note that the dominant D, of ∼3, of our experimental pseudotachylites is the same as was measured in natural pseudotachylytes in Adamello tonalite by Di Toro and Pennacchioni (2005). This indicates that the samples they examined could have experienced similar processes to those we characterize, i.e., fragmentation by constrained comminution, intense comminution, frictional melting and diffusive dissolution/marginal decrepitation.
Implications of the Textural and Chemical Melt Evolution for Fault Behavior
The texture of fault zone material influences its frictional properties, and the chemistry of melt affects its viscosity so also influences shear strength. The textural evolution we describe accompanies melt generation, toward a dominance of small particles (D ∼ 3 or less) and round and convex shape of the clasts, should reduce overall frictional strength. However, although preferential consumption of biotite during initial flash melting should initially yield fairly low viscosity melts, we expect these may evolve to more felsic, thus viscous, compositions during subsequent melt corrosion that affects all particles homogeneously. Competition between these processes will impact the ability of similar pseudotachylite-bearing faults to accommodate ongoing coseismic slip. Unfortunately, we cannot constrain the clast size and shape evolution with time and chemical evolution sufficiently from our experimental results to compare the relative impacts on fault behavior. These processes should certainly be examined more closely in future studies.
Conclusion
Our results demonstrate that combining measurements of particle size and shape distributions with chemical analyses of experimentally generated pseudotachylites, allows interpretations of the relative chronology of comminution and melting - the two physico-chemical processes that operate during pseudotachylite generation - and can quantify their impact on pseudotachylite texture. In our experimental pseudotachylites, first, comminution fragmented the host-rock heterogeneously due to slip localisation and concomitant intensification of comminution (Figure 8). This generated a finer-grained zone (future pseudotachylite) with a larger fractal dimension of its particle size distribution (D ∼ 3) than that of adjacent gouge (D ∼ 2.4). Subsequently, melt was generated by frictional flash melting where slip was the most localized (Figure 8). This process was dependent on yield strength, fracture toughness and thermal conductivities and affected host rock phases heterogeneously, with biotite being the least resistant to melting, feldspars intermediate, and quartz the most resistant. The melts issued by this flash melting are alkaline and their compositions are largely influenced by plagioclase and biotite. The clasts present within the melt were further affected by diffusive dissolution and/or marginal decrepitation independently of their mineralogy. These processes resulted in convex, smooth and round shapes with values of circularity and convexity close to one, and tended to lower the fractal dimension, D, by preferentially affecting smaller particles.
This study experimentally confirms previous findings about the frictional melting processes that occur during coseismic slip, constrains their chronology and quantifies their effect on size and shape distributions, and chemistries of pseudotachylite material. The textural and chemical evolutions that these samples displayed are, respectively, expected to contribute to co-seismic fault weakening and strengthening. Our results do not allow complete assessment of the relative mechanical consequences, but this should be explored further in future studies.
Data Availability Statement
The raw data supporting the conclusions of this article will be made available by the authors, on request by email.
Author Contributions
LM: textural, statistical and chemical analyses, manuscript preparation. VT: Experimental procedure, textural analysis supervision, manuscript preparation, funding. JS: Chemical analysis supervision, manuscript preparation. TM: Experimental procedure, funding. DD: Mixing model calculation, statistical analysis supervision, manuscript preparation.
Conflict of Interest
The authors declare that the research was conducted in the absence of any commercial or financial relationships that could be construed as a potential conflict of interest.
Acknowledgments
The authors would like to warmly thank Giulio di Toro for allowing the experiments to be performed on SHIVA supported by ERC Starting Grant USEMS project no. 205175, and Ian Schipper from University of Victoria for his help in BSE image acquisition. The authors are grateful to Elizaveta Kovaleva and Fabrizio Balsamo for providing comments that improved the manuscript. We also acknowledge support of the Royal Society of New Zealand Rutherford Discovery Fellowship 16-UOO-1602, and University of Otago Research Grants. TM acknowledges support from NERC Grant NE/M004716/1.
Supplementary Material
The Supplementary Material for this article can be found online at: https://www.frontiersin.org/articles/10.3389/feart.2020.596116/full#supplementary-material.
References
Abe, S., and Mair, K. (2009). Effects of gouge fragment shape on fault friction: new 3D modelling results. Geophys. Res. Lett. 36 (23), L23302. doi:10.1029/2009GL040684
Allen, A. R. (1979). Mechanism of frictional fusion in fault zones. J. Struct. Geol. 1, 231–243. doi:10.1016/0191-8141(79)90042-7
Balsamo, F., Aldega, L., De Paola, N., Faoro, I., and Storti, F. (2014). The signature and mechanics of earthquake ruptures along shallow creeping faults in poorly lithified sediments. Geology 42 (5), 435–438. doi:10.1130/G35272.1
Balsamo, F., and Storti, F. (2011). Size-dependent comminution, tectonic mixing, and sealing behavior of a “structurally oversimplified” fault zone in poorly lithified sands: evidence for a coseismic rupture? Bulletin 123 (3-4), 601–619. doi:10.1130/B30099.1
Biegel, R. L., Sammis, C. G., and Dieterich, J. H. (1989). The frictional properties of a simulated gouge having a fractal particle distribution. J. Struct. Geol. 11, 827–846. doi:10.1016/0191-8141(89)90101-6
Bjørk, T. E., Mair, K., and Austrheim, H. (2009). Quantifying granular material and deformation: advantages of combining grain size, shape, and mineral phase recognition analysis. J. Struct. Geol. 31, 637–653. doi:10.1016/j.jsg.2009.03.020
Blenkinsop, T. G. (1991). Cataclasis and processes of particle size reduction. Pure Appl. Geophys. 136, 59–86. doi:10.1007/BF00878888
Bossière, G. (1991). Petrology of pseudotachylytes from the alpine fault of New Zealand. Tectonophysics 196, 173–193. doi:10.1016/0040-1951(91)90295-4
Caggianelli, A., de Lorenzo, S., and Prosser, G. (2005). Modelling the heat pulses generated on a fault plane during coseismic slip: inferences from the pseudotachylites of the Copanello cliffs (Calabria, Italy). Tectonophysics 405, 99–119. doi:10.1016/j.tecto.2005.05.017
Di Toro, G., Niemeijer, A., Tripoli, A., Nielsen, S., Di Felice, F., Scarlato, P., et al. (2010). From field geology to earthquake simulation: a new state-of-the-art tool to investigate rock friction during the seismic cycle (SHIVA). Rendiconti Lincei 21 (1), 95–114. doi:10.1007/s12210-010-0097-x
Di Toro, G., and Pennacchioni, G. (2005). Fault plane processes and mesoscopic structure of a strong- type seismogenic fault in tonalites (Adamello batholith, Southern Alps). Tectonophysics 402 (1-4), 55–80. doi:10.1016/j.tecto.2004.12.036
Dobson, D., Montheil, L., Paine, J., and Thomson, A. (Forthcoming). Peritectic melting of mica in fault-related pseudotachylite melts and potassium mass balance as an indicator of fluid-absent source conditions. Geochem. Geophys. Geosyst.
Engelder, J. T. (1974). Cataclasis and the generation of fault gouge. GSA Bulletin 85 (10), 1515–1522. doi:10.1130/0016-7606
Exner, H. (1972). Analysis of grain-and particle-size distributions in metallic materials. Int. Metall. Rev. 17 (1), 25–42. doi:10.1179/imtlr.1972.17.1.25
Hartmann, W. K. (1969). Terrestrial, lunar, and interplanetary rock fragmentation. Icarus 10, 201–213. doi:10.1016/0019-1035(69)90022-0
Heilbronner, R., and Keulen, N. (2006). Grain size and grain shape analysis of fault rocks. Tectonophysics 427, 199–216. doi:10.1016/j.tecto.2006.05.020
Kanamori, H., and Rivera, L. (2006). “Energy partitioning during an earthquake,” In Geophysical Monograph Series. Editors. R. Abercrombie, A. McGarr, H. Kanamori, and G. Di Toro (Washington, D.C.: American Geophysical Union), 3–13. doi:10.1029/170GM03
Kirkpatrick, J. D., Shipton, Z. K., and Persano, C., (2009). Pseudotachylytes; rarely generated, rarely preserved or rarely reported? Bull. Seismol. Soc. Am. 99, 382–388. doi:10.1785/0120080114
Le Bas, M. J., Maitre, R. L., Streckeisen, A., and Zanettin, B. (1986). A chemical classification of volcanic rocks based on the total alkali-silica diagram. J. Petrol. 27 (3), 745–750. doi:10.1093/petrology/27.3.745
Lin, A. (1999). Roundness of clasts in pseudotachylytes and cataclastic rocks as an indicator of frictional melting. J. Struct. Geol. 21, 473–478. doi:10.1016/S0191-8141(99)00030-9
Lin, A., Shimamoto, T., and Iwamori, H. (1992). “Experimentally-generated pseudotachylytes,” in Proceedings of the 29th international geological congress, Kyoto [abstract 167].
Lin, A., and Shimamoto, T. (1998). Selective melting processes as inferred from experimentally generated pseudotachylytes. J. Asian Earth Sci. 16, 533–545. doi:10.1016/S0743 9547(98)00040-3
Maddock, R. H. (1992). Effects of lithology, cataclasis and melting on the composition of fault-generated pseudotachylytes in Lewisian gneiss, Scotland. Tectonophysics 204 (3-4), 261–278. doi:10.1016/0040-1951(92)90311-S
Maddock, R. H. (1983). Melt origin of fault-generated pseudotachylytes demonstrated by textures. Geology 11 (2), 105–108. doi:10.1130/0091-7613(1983)11
Magloughlin, J. F., and Spray, J. G. (1992). Frictional melting processes and products in geological materials: introduction and discussion. Tectonophysics 204, 197–204. doi:10.1016/00401951(92)90307-R
Marone, C., and Scholz, C. H. (1989). Particle-size distribution and microstructures within simulated fault gouge. J. Struct. Geol. 11 (7), 799–814. doi:10.1016/0191-8141(89)90099-0
Mitchell, T. M., Toy, V., Di Toro, G., Renner, J., and Sibson, R. H. (2016). Fault welding by pseudotachylyte formation. Geology 44 (12), 1059–1062. doi:10.1130/G38373.1
Morgan, J. K., Cladouhos, T. T., Scharer, K. M., Cowan, D. S., and Vrolijk, P. J. (1996). Fractal particle size distributions in Death Valley fault zones: controls on mechanics and kinematics of fault rocks. Eos Trans. AGU 77 (46), F717.
Rawling, G. C., and Goodwin, L. B. (2003). Cataclasis and particulate flow in faulted, poorly lithifed sediments. J. Struct. Geol. 25 (3), 317–331. doi:10.1016/S0191-8141(02)00041-X
Sammis, C., and Biegel, R. (1989). Fractals, fault-gouge, and friction. Pure Appl. Geophys. 13 (1-2), 255–271. doi:10.1007/BF00874490
Sammis, C., King, G., and Biegel, R. (1987). The kinematics of gouge deformation. Paleogeophysics 125, 777–812. doi:10.1007/BF00878033
Schneider, C. A., Rasband, W. S., and Eliceiri, K. W. (2012). NIH Image to ImageJ: 25 years of image analysis. Nat. Methods 9 (7), 671–675. doi:10.1038/nmeth.2089
Shand, S. J. (1916). A recording micrometer for geometrical rock analysis. J. Geol. 24, 394–404. doi:10.1086/622346
Sibson, R. H. (1975). Generation of pseudotachylyte by ancient seismic faulting. Geophys. J. Int. 43, 775–794. doi:10.1111/j.1365-246X.1975.tb06195.x
Sibson, R. H. (1980). Power dissipation and stress levels on faults in the upper crust. J. Geophys. Res. Solid Earth 85 (B11), 6239–6247. doi:10.1029/JB085iB11p06239
Sibson, R. H., and Toy, V. G. (2006). “The habitat of fault-generated pseudotachylyte: presence vs. absence of friction-melt,” in Geophysical Monograph Series. Editors. R. Abercrombie, A. McGarr, H. Kanamori, and G. Di Toro (Washington, D. C.: American Geophysical Union), 153–166. doi:10.1029/170GM16
Spray, J. G. (1992). A physical basis for the frictional melting of some rock-forming minerals. Tectonophysics 204, 205–221. doi:10.1016/0040-1951(92)90308-S
Spray, J. G. (1995). Pseudotachylyte controversy: fact or friction? Tectonophysics 204 (3–4), 205–221. doi:10.1016/0040-1951(92)90308-S
Spray, J. G. (2010). Frictional melting processes in planetary materials: from hypervelocity impact to earthquakes. Annu. Rev. Earth Planet Sci. 38, 221–254. doi:10.1146/annurev.earth.031208.100045
Storti, F., Balsamo, F., and Salvini, F. (2007). Particle shape evolution in natural carbonate granular wear material. Terra. Nova 19, 344–352. doi:10.1111/j.1365-3121.2007.00758.x
Storti, F., Billi, A., and Salvini, F. (2003). Particle size distributions in natural carbonate fault rocks: insights for non-self-similar cataclasis. Earth Planet Sci. Lett. 206, 173–186. doi:10.1016/S0012-821X(02)01077-4
Keywords: frictional melting, experimental pseudotachylite, size and shape distribution, chemistry, tonalite, granite
Citation: Montheil L, Toy VG, Scott JM, Mitchell TM and Dobson DP (2020) Impact of Coseismic Frictional Melting on Particle Size, Shape Distribution and Chemistry of Experimentally-Generated Pseudotachylite. Front. Earth Sci. 8:596116. doi: 10.3389/feart.2020.596116
Received: 18 August 2020; Accepted: 03 November 2020;
Published: 10 December 2020.
Edited by:
Andrea Billi, National Research Council (CNR), ItalyReviewed by:
Elizaveta Kovaleva, University of the Free State, South AfricaFabrizio Balsamo, University of Parma, Italy
Copyright © 2020 Montheil, Toy, Scott, Mitchell and Dobson. This is an open-access article distributed under the terms of the Creative Commons Attribution License (CC BY). The use, distribution or reproduction in other forums is permitted, provided the original author(s) and the copyright owner(s) are credited and that the original publication in this journal is cited, in accordance with accepted academic practice. No use, distribution or reproduction is permitted which does not comply with these terms.
*Correspondence: Leny Montheil, bGVueS5tb250aGVpbEB1bW9udHBlbGxpZXIuZnI=