 Tommaso Piacentini
 Monia Calista1
 Nicola Sciarra
- 1Department of Engineering and Geology, Università degli Studi “G. d'Annunzio” Chieti‐Pescara, Pescara, Italy
Snow avalanches are critical events due to the sudden instability of snow in mountain regions. Seismically induced snow avalanches, due to a particular type of trigger perturbing snow-covered slopes, are occasional events in geodynamically active mountain regions around the world, which can lead to large anomalous avalanches. The seismic trigger of an avalanche is either simultaneous or delayed. In Italy, the Alps, and particularly the Apennines, feature large areas expected to be affected by seismically induced snow avalanches. In this work, the avalanches’ distribution in Central Italy (i.e., Abruzzo region) and its connection with moderate–high seismicity were investigated. With regional and historical analyses, we investigated the connection between avalanches and seismicity. We revealed two main events of seismically induced avalanches (April 6–9, 2009, western Gran Sasso-Assergi area, and January 18, 2017, Gran Sasso massif) characterized by an anomalous distribution of avalanches. A specific and detailed analysis focused on the northeast Mt. Siella slope, where well-documented and constrained events occurred on January 18, 2017 in the Gran Sasso area, affecting a tourist facility. This involves geomorphological and photogeological multitemporal investigations. Moreover, the Rigopiano avalanche was analyzed through 3D numerical modeling and stability analysis of the snow to investigate the possible seismic trigger. We found the avalanche was consistent with delayed seismically induced avalanche cases. This combination contributed to a more general assessment of the seismically induced avalanches in the Central Apennines area (i.e., Abruzzo region) and provided new examples of seismically induced avalanches at both the regional and detailed scales, which are largely consistent with the world distribution.
Introduction
Snow avalanches are critical events due to the sudden instability of snow and its downward flow, which affect all the snow-covered mountain regions around the world (Figure 1A). These events are induced by numerous predisposing and triggering natural and anthropogenic factors. Earthquakes are one of the factors that can trigger catastrophic avalanches, as documented in the main mountain ranges in active geodynamic areas (Singh and Ganju, 2002; Podolskiy, 2010; Podolskiy et al., 2010a; Bulajić et al., 2018; Parshad et al., 2019; Puzrin et al., 2019). Specifically, the entire Rocky Mountains, the tropical and temperate Andes, and the entire Alpine–Himalayan mountain system are affected by these phenomena (Figure 1A). These events involve snow and occasionally might affect the underlying cover of surface deposits (e.g., talus slope deposits, debris, and colluvial deposits) (Hackman, 1968; Podolskiy, 2010; Wang et al., 2015). Observations of avalanches and the inducing factors have been investigated for defining the distribution, features, and failure mechanisms of avalanches, and for the assessment of the related hazards as well as the interaction with tourist facilities (Schweizer et al., 2003; Cappabianca et al., 2008; Heierli et al., 2008; van Herwijnen and Heierli, 2009; Chriesten et al., 2010; Barbolini et al., 2011; Vriend et al., 2013; Pérez-Guillén et al., 2014; Ito et al., 2016; Höller, 2017; Schweizer, 2017; Techel and Schweizer, 2017; Keller et al., 2019; Kumar et al., 2019).
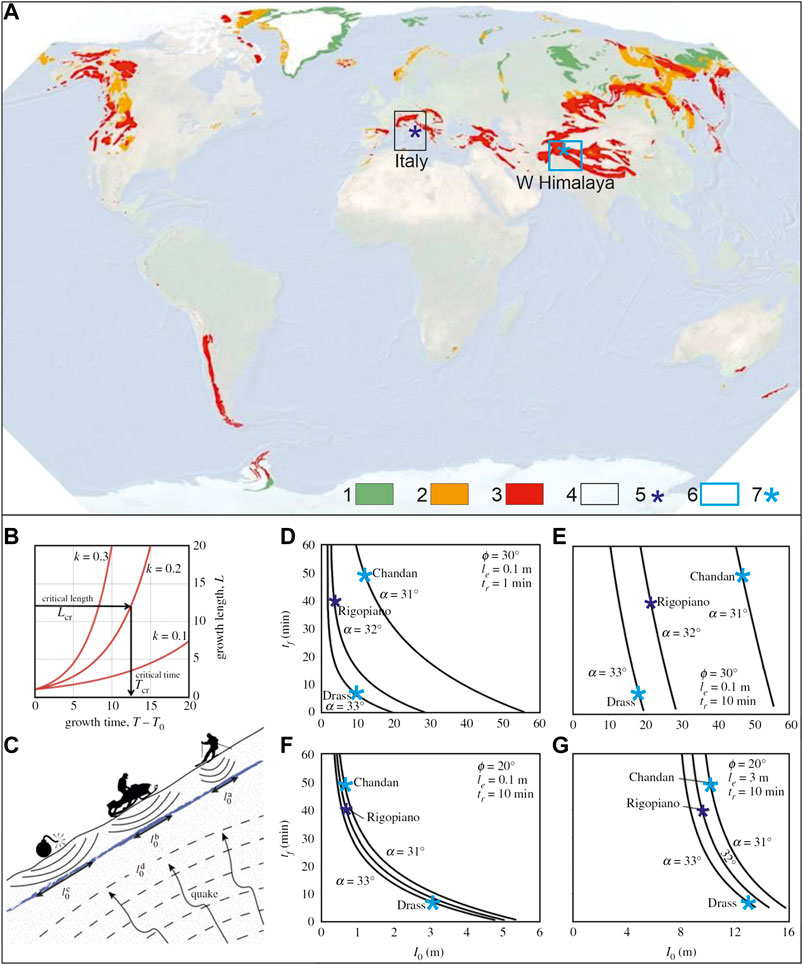
FIGURE 1. (A) Global distribution of expected seismically induced snow avalanches (modified from Podolskiy, 2010); the black box is the location of Italy. Legend: 1) Extent of avalanche activity (from Kotlyakov, 1997); 2) extent of areas with low earthquake-induced avalanche probability (PGA, peak ground acceleration >0.2 ms−2); 3) extent of areas with high earthquake-induced avalanches probability (PGA >0.8 ms−2); 4) area with documented delayed seismically induced snow avalanches (western Himalaya, including the Drass and Chandan cases, table 1 in Singh and Ganju, 2002). The seismicity limits are defined by peak ground acceleration (PGA) corresponding to low (>0.2 ms−2) and moderate to high (>0.8 ms−2) seismic hazard expected with 10% exceedance probability over a 50-year period (Giardini et al., 2003; Global Seismic Hazard Map, 2011). Hypothesis of delay (from Puzrin et al., 2019): (B) development of the rupture surface for different k values (from Puzrin et al., 2019); (C) initial fracture length l0 vs. local (explosives, snowmobile, and skiers), and global triggers (earthquake) (from Puzrin et al., 2019); (D–G) sensitivity study of l0 potentially earthquake-triggered delayed avalanches (Rigopiano, Italy; Drass and Chandan, western Himalaya), considering a wide range of realistic parameters (from Puzrin et al., 2019).
Seismically induced snow avalanches feature a particular type of trigger that induces a perturbation on snow-covered slopes. This type has been analyzed with several different approaches at the regional and local scales and with analogue and numerical modeling (Hackman, 1968; Singh and Ganju, 2002; Podolskiy et al., 2010b; Pérez-Guillén et al., 2014; Wang et al., 2015; Bulajić et al., 2018; Parshad et al., 2019; Puzrin et al., 2019). Regional analysis using a statistical approach allowed the inference that snow avalanches can be triggered by an earthquake of Mw > 2.0 (magnitude moment), up to a distance of more than 600 km, both during seismic shaking, and with a certain delay (Singh and Ganju, 2002; Podolskiy, 2010; Podolskiy et al., 2010a; Puzrin et al., 2019).
The delay in the seismic trigger of an avalanche is one of the most complex aspects to consider. The non-contemporaneity of the cause and effect could be understood as a lack of connection between the two events. A possible temporal delay from an earthquake to an induced avalanche was documented in the area of western Himalaya (Figure 1A) (Singh and Ganju, 2002). Several cases were reported that highlighted the delay times of some avalanches from the seismic shaking (e.g., in Western Himalaya: March 4, 1996 Lagongama, delay 350 min; January 26, 1999 Chadan, 49 min; January 16, 2000 Drass Sector, 7 min; January 21, 2000 Jawala area, 82 min; and other cased less constrained; for more details see table 1 of Singh and Ganju, 2002 and Puzrin et al., 2019). The release mechanisms were recently summarized by Schweizer et al. (2016); the main mechanism of the delay in earthquake-induced avalanches release was also investigated using a new analytical model that produces dynamics coherent with the Rigopiano case (Puzrin et al., 2019). The rupture mechanism occurs due to the interaction between creep phenomena within the mass about to slip, strain softening, and the strain-rate sensitivity of the snow, which guide the growth of a basal shear fracture, as explained by Puzrin et al. (2019) (Figures 1B–G). A broad range of realistic parameters was used for three potentially earthquake-triggered delayed avalanches (Gaume et al., 2013, 2018).
The Alps and the Apennines in Italy, according to the global distribution reported by Podolskiy (2010), show large areas expected to be affected by seismically induced snow avalanches (Figure 2A). The eastern side of central Italy (i.e., the Abruzzo Region) features the highest elevation mountain area in the entire Apennines chain, is frequently affected by deep snow cover and snow avalanches, and is also affected by strong seismicity. In the last decade, the 2009 L’Aquila earthquake (max. Mw 6.1) and the 2016–2017 central Italy seismic crisis (max. Mw 6.5) affected the area and, incidentally, had strong seismic shocks in winter and early spring (i.e., April 6–9, 2009, Mw 5.4–6.1, and January 18, 2017, the last Mw > 5 sequence of the 2016–2017 seismic crisis, Figure 2B (INGV, 2016; Chiaraluce et al., 2017; Luzi et al., 2017)). In mid-January 2017, the northeast Apennines flank and the entire Gran Sasso area was affected by a heavy snow precipitation event (snow cover greater than 3 m deep in the mountain area and 1–1.5 m in the hilly piedmont) (Di Lena and Giuliano, 2017; Regione Abruzzo, 2017). After this combination of seismic and meteorological events, from January to February 2017, several avalanches, landslides, and flooding events occurred from the NE Apennines chain to its piedmont area and the Adriatic coast (Calista et al., 2019). These events caused severe damage, fatalities, and evacuees, and were declared an official natural disaster at the regional government level (Regione Abruzzo, 2017; Romeo et al., 2018). For this reason, we focused on the investigation of these events and specifically on the general connection between avalanches and seismicity in central Italy.
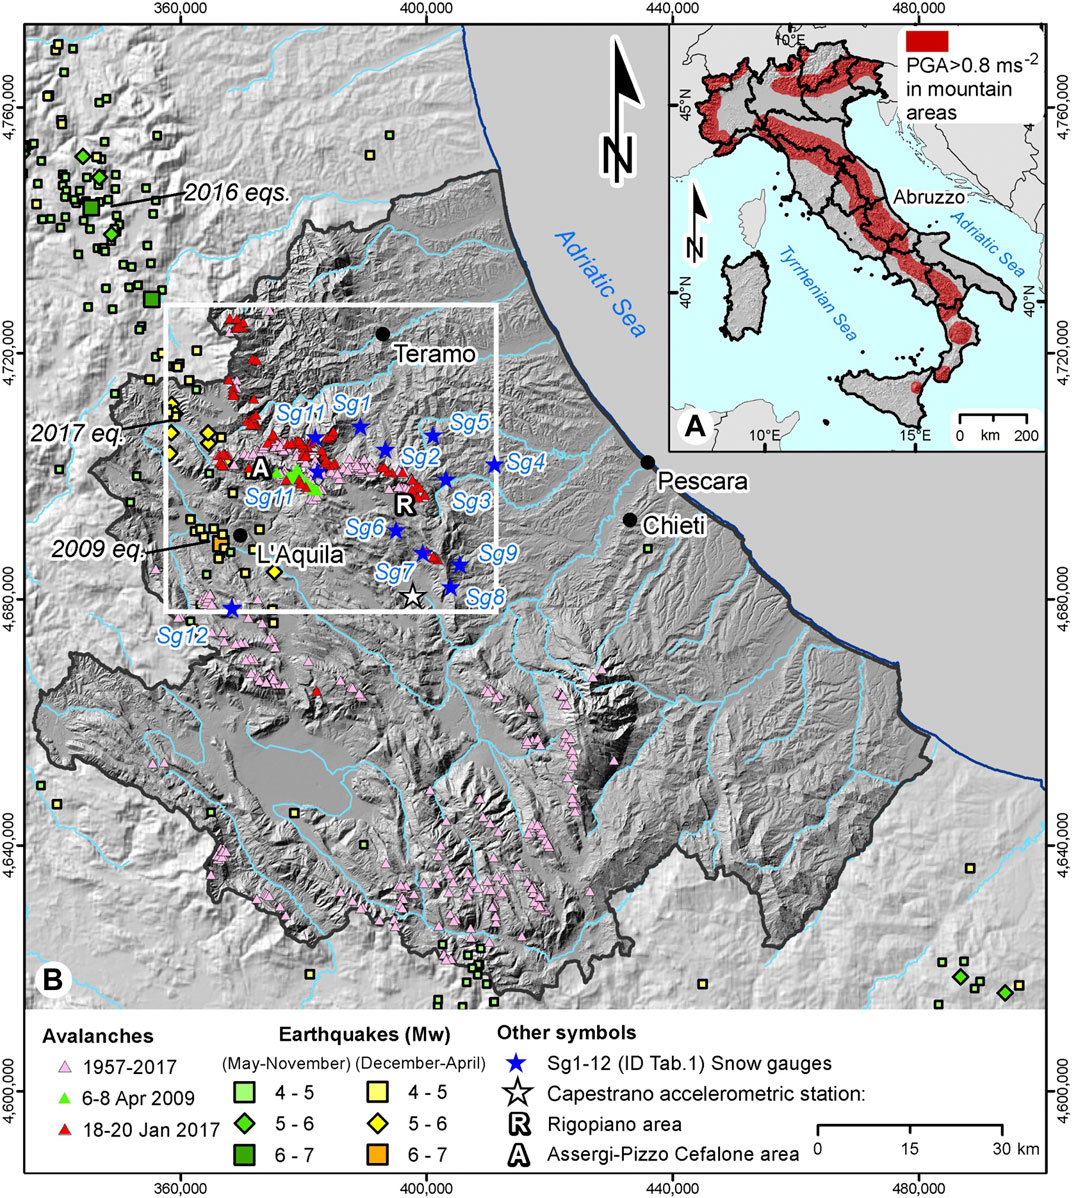
FIGURE 2. (A) Detail of the Italian distribution of expected seismically induced avalanches according to Podolskiy’s global analysis (Podolskiy, 2010; Podolskiy et al., 2010a). Red indicates mountain areas affected by high snow cover and moderate-to-high seismic hazard (PGA > 0.8 ms−2) (Stucchi et al., 2004). (B) Hillshade image of the Abruzzo region and location map (white box) of the area affected by avalanches in April 2009 and January 2017. Avalanches data were derived from the snow avalanche inventory of the State Forestry Corps of Italy, from local chronicles, eyewitness reports, a field survey, and the Historical Avalanches Map of Abruzzo. Distribution of the recent historical avalanches (1957–2018) and seismicity (1950–2018) in the Abruzzo region. Earthquakes (Mw > 4) in winter (i.e., December–April) are mapped (yellow-orange symbols) as well the those in spring to autumn (i.e., May–November; green symbols). See Supplementary Appendix A for details (INGV, 2016; Rovida et al., 2019).
Previous studies on these events mostly focused on the geology of the earthquakes and seismically induced surface deformation and landslides. Specific investigations particularly concerning avalanche features, field analyses, numerical simulations (Bocchiola et al., 2018; Frigo et al., 2018), and forensic applications (Chiambretti et al., 2018), as well as analysis of the triggering conditions (Puzrin et al., 2019), also focused on the NE slope of Mt. Siella, where well-documented avalanches occurred on January 18, 2017 after four main seismic events (e.g., the catastrophic Rigopiano event, which affected a tourist facility). Other studies examined the landslides triggered in the same period in NE the Abruzzo area (Solari et al., 2018; Calista et al., 2019 and references therein). However, an overall analysis of the snow avalanches in the last decades and their connection with the seismicity, as well as an overall geomorphological detailed investigation integrated with numerical modeling of the Mt. Siella and Rigopiano case, are still lacking.
We attempted to fill this gap by analyzing the avalanches’ distribution in the Central Apennines and its connection with moderate-to-high seismicity. The study was based on an integrated analysis, including snow depth data, seismicity data, and regional avalanche distribution analysis. The avalanche distribution was investigated and compared with the nivological features, and the seismic events occurred in winter. The analysis revealed two main events in April 2009 in the western Gran Sasso (Assergi) and January 2017 in the entire Gran Sasso massif. A specific detailed-scale analysis then focused on the avalanches on the NE slope of Mt. Siella (eastern Gran Sasso massif). The study was performed through a geomorphological field investigation and photogeological analysis through multitemporal and multiscale air photo interpretation that allowed the definition of the main features and the temporal distribution of the avalanches. Geomorphological and photogeological data were enhanced with numerical modeling for investigating the possible seismic triggers. The detachment was investigated using stability analysis and 3D modeling in static (non-earthquake) and dynamic (earthquake) conditions using FLAC3D code (Itasca, 2019).
The main aim was to contribute 1) to the comprehension of the overall distribution and features of the avalanches in central Italy and the connection to the seismic events in April 2009 and January 2017, and possible previous events, in the framework of the global distribution of seismically induced avalanches, and 2) to the understanding of the 2017 Mt. Siella avalanches as delayed seismically induced avalanche in the framework of central Italy and the world.
Study Area
Regional Setting
The central Italy and Abruzzo landscape is divided into three main morphostructural domains: chain, piedmont, and coastal area (Figure 2B). The chain is composed of thrust ridges, made up of thick calcareous sequences with different thickness and erodibility, pertaining to Mesozoic–Cenozoic pre-orogenic paleogeographic domains. The Neogene deformation of these sequences caused the emplacement of the main mountain ridges including the major Gran Sasso ridge (Vezzani et al., 2010; Pace et al., 2014 and references therein). Pleistocene–Holocene extensional tectonics, mostly along NW–SE- to NNW–SSE-oriented faults, defined the present landscape of the mountain area and the main intermontane basins, and is responsible for the recent and historical seismicity (Figure 2B). The morphology of the chain is asymmetric, with its highest peaks (Gran Sasso, 2,912 m a.s.l.; Maiella, 2,793 m a.s.l.) on the NE side. A steep mountainside with large escarpments features the NE front of the Apennines, which heavily affects the climatic-meteorological features. The landscape shows a series of ridges trending from NW–SE to N–S (heights of 2,000–3,000 m), separated by narrow valleys parallel to the ridges or by broad intermontane depressions (elevation 250–1,000 m). The Gran Sasso ridge is the highest in the Apennines, with several peaks above 2,500 m a.s.l. It is arched-shaped, trending from W–E to N–S, and drops down to the piedmont area to an elevation below 1,000 m, defining a large and steep mountain escarpment. The mountain area is mostly affected by mass wasting, gravity-induced (e.g., rock falls, topples, flows, etc.), and fluvial-related processes (e.g., debris flows, alluvial fans, etc.). Ancient glacial processes are preserved as relict landforms (Miccadei et al., 2017). The area is largely characterized by deep snow cover during winter up to several meters thick. This has induced snow related processes, as recurrent avalanches documented for the last 60 years by the Historical Avalanches Map of Abruzzo (Figure 2B) (Regione Abruzzo, 2014). In April 2009 and January 2017, avalanches occurred mostly across the NE side of the chain and the piedmont area.
The piedmont and coastal area feature a low relief area (heights ∼ 100–800 m) characterized by shaly-arenaceous rocks pertaining to Neogene sequences (Bigi et al., 1997) arranged in a cuesta and mesa relief incised by fluvial valleys and wide alluvial plains (D’Alessandro et al., 2003; Miccadei et al., 2017). The area is affected mainly by mass wasting, gravity-induced, and fluvial processes frequently triggered by heavy rainfall and seismic events and occasionally by heavy snowfall and rapid snowmelt (Piacentini et al., 2018; Calista et al., 2019; Carabella et al., 2019; Calista et al., 2020).
Climate, Nivological, and Meteorological Features
The central Italy and Abruzzo climate generally ranges from Mediterranean to temperate. However, it is affected by the orography of the Apennines chain and its eastern front, changing from a Mediterranean type with maritime influence along the coasts and the hilly piedmont area, to more temperate and continental-like in the inland (Peel et al., 2007; Di Lena et al., 2012). The average temperature is 16–18°C along the coast to 8–10°C in the mountain areas (with minimum values of 0–5°C, at high elevation). The winter temperature (average January values) is 8–10°C in the hilly coastal area to 0–2°C in the inland areas (with minimum values of approximately −5 to −10°C at high elevations). The rainfall distribution is also controlled by topography. The highest average annual rainfall (up to 1,500–2,000 mm/year) occurs along the main ridges and drop down to 600–800 mm/year in the piedmont hills and coastal areas. The rainfall distribution is frequently characterized by occasional heavy rainfall (>100 mm/day and 30–40 mm/h) (Chiaudani et al., 2013; Piacentini et al., 2018). In recent decades, the region has been affected by flash flood events and some heavy snowstorms, which were induced by heavy rainfall ranging from 60 to 100 mm in a few hours to >200 mm per day, and by snowfall up to >1 m/day (e.g., January 2003, April 2004; and October 2007, March 2011, September 2012, December 2013, February–March 2015, and January–February 2017; Piacentini et al., 2018; Calista et al., 2019).
The historical nivological data were analyzed specifically for the Gran Sasso and L’Aquila area, in which most of the avalanches occurred (Figure 2B). The snow cover depth recorded by nine snow gauges was analyzed (1935–2003 data sets; Figure 3A). The maximum snow depth recorded ranges from 0 (from many years, at specific locations, at lower elevations) to a maximum of 200–210 cm (Castel del Monte, early 1970s). For many years in the time series, the maximum snow depth was far below 100 cm. The average maximum snow depth ranges from 17 to 66 cm for the entire time series (1935–2003) with a good elevation/cover correlation showing a gradient of ∼50 cm/1,000 m (Figure 3B). However, according to the elevation distribution of the stations (Table 1), the recorded snow depth underestimates the snow depth expected in the high-elevation mountain ridges and flanks, which have been affected by snow avalanches. At high elevation and for the last decade, the snow depth was investigated using three additional snow gauges in ski areas and ranged from 100 cm to as much as 400–550 cm (e.g., 2014) with average cover of 150–318 cm (e.g., Campo Imperatore, Prati di Tivo, and Gran Sasso areas, stars in Figure 3B; non-official data from https://www.skiinfo.it). This means that snow cover >200–300 cm deep is typical on high-elevation mountain slopes (e.g., >1,500–2,000 m) and can induce avalanches development especially after strong snowstorms or rapid temperature increase.
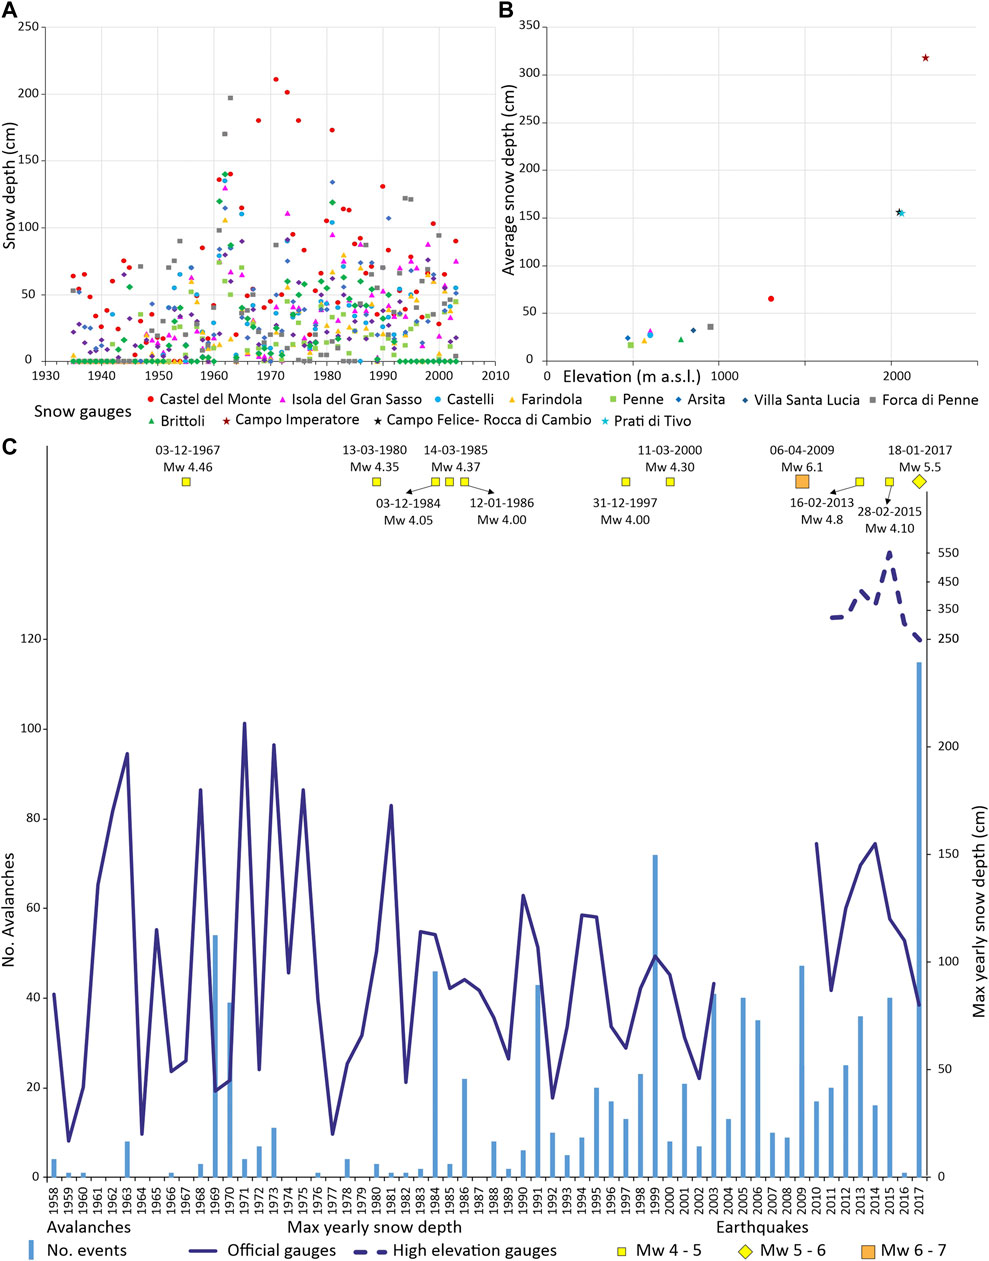
FIGURE 3. (A) Snow cover distribution in the Gran Sasso area (snow gauges and locations in Table 1 and Figure 2b). For each site and each year, the maximum snow depth was derived and plotted. The record period is 1935 to 2003 (ISPRA, 2018). (B) The average snow depth vs. snow gauges elevation in the Gran Sasso area. For each site and each year, the average maximum snow cover was derived and plotted. (C) The number of avalanches in the Abruzzo region from 1957 to 2017 (Regione Abruzzo, 2014), compared to the maximum snow cover recorded at all the snow gauges (Table 1) and to the main seismic sequences or moderate earthquakes (Mw > 4) occurring in winter.
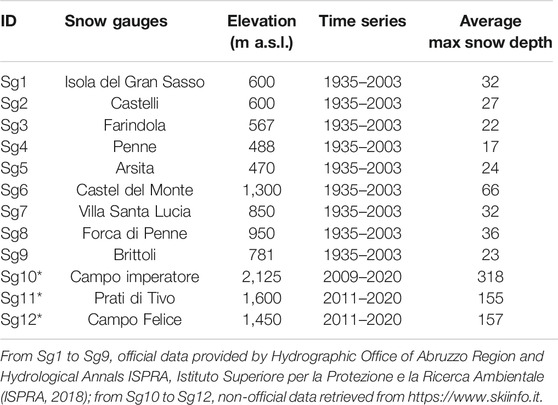
TABLE 1. Snow gauges analyzed in the Gran Sasso area (location in Figure 2B).
The yearly number of avalanches (Figure 3C) has ranged from 0 to 70 in the last decades, and more than 40 avalanches were recorded only in the 8 years pre-2017 (1969, 1984, 1991, 1999, 2003, 2005, 2009, and 2015) with a poor direct correlation with the snow thickness. In this distribution, 2017 features a distinct anomaly. A total of 115 avalanches were reported, of which 105 occurred within a 3-day time span, on 18–20 January 2017. More specifically, 76 avalanches were reported on 18 January; this means that in a single day, more avalanches occurred than in any other entire year in the time series (1957–2017), indicating a large anomalous distribution. Moreover, the diagram shows that this anomaly is no correlation between this high number of avalanches and the snow depth both in the official station and in the high elevation ones (where snow depth above 2.5 m is common; Figure 3C).
Seismicity
The central Italy area has been affected by both historical and recent strong seismicity (INGV, 2016; Rovida et al., 2019; Rovida et al., 2020) connected with the Apennine chain extensional tectonics; moderate seismicity also affects the piedmont and Adriatic areas (Figure 2B). In the last decade, the area was affected by the major 2009 L’Aquila earthquake (max. Mw 6.1) and 2016–2017 central Italy earthquakes (max. Mw 6.5) (Figure 2B; Table 2). Specifically, on April 6, 2009, the main seismic event occurred (Mw 6.1). After that, four other shocks occurred with Mw > 5: on the night between 6 and 7 April (at 0:15 UTC+1, Mw 5.0), on 7 April (at 18:47, Mw 5.4), and on 9 April (at 1:52, Mw 5.2, and at 21:38, Mw 5.0). On April 2009, 17 more shocks (Mw > 4) occurred, and in all of 2009, over 20,000 total events were recorded. Between 2016 and 2017, central Italy was struck by a strong and long-lasting seismic sequence that comprised over 65,800 events from August 24, 2016 to April 30, 2017. Four main events occurred: August 24, 2016, two shocks of Mw 5.3 and 6.0; October 26, 2016, two shocks of Mw 5.4 and 5.9; October 30, 2016, the strongest, of Mw 6.5; and on January 18, 2017, four shocks of Mw 5.0–5.5 (INGV, 2016; Rovida et al., 2019).
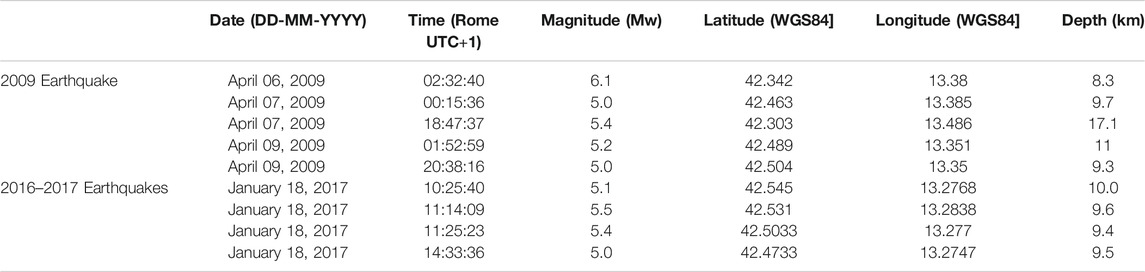
TABLE 2. Main earthquakes (Mw > 5) occurring in winter during the main seismic event (April 2009 and 2016–2017) (INGV, 2016; Rovida et al., 2019); location in Figure 2B.
The analysis then focused on the distribution of moderate-to-strong (Mw > 4) earthquakes occurred in winter to early spring (i.e., December to April) and in the mountain area (from 1950 to 2018) (INGV, 2016; Rovida et al., 2019) to check for a possible connection with the distribution of avalanches. Nine main shocks (one with Mw 6–7 and eight with Mw 5–6) in this selection are connected to the 2009 L’Aquila earthquake (five shocks occurred on 6, 7, and 9 April) and the last main one of the 2016–2017 central Italy seismic sequence (four shocks on January 18, 2017, Table 2). A total of 36 more events of Mw 4–5 occurred in the mountain areas (from 1950 to 2018, Supplementary Appendix A). Most of them occurred again in April 2009 (17) and January 2017 (7) sequences, in which a connection with the anomalous distribution of avalanches was identified. Other events occurred in December 1967, March 1, 1980, December 3, 1984, March 14, 1985, January 12, 1986, January 31, 1997, March 11, 2000, February 16, 2013, and April 25, 2018, but no connection was found with specific contemporaneous avalanches.
Materials and Methods
The study was carried out through an integrated multidisciplinary regional (Snow Avalanche vs. Earthquake Distribution in Central Italy) analysis combining: 1) regional meteorological and climatic analysis, 2) seismicity analysis, 3) avalanches distribution analysis, and 4) comparison between seismicity and avalanches in space and time (e.g., the cases of April 2009 and January 2017). Of the many avalanches, the Mt. Siella area was well documented, eyewitnessed, and constrained and was investigated in detail (The Mt. Siella Avalanches) combining: 1) morphometry of orography, 2) photogeological analysis through multitemporal and multiscale air photo interpretation, 3) geomorphological field mapping, and 4) numerical modeling and stability analysis in the detachment area. The multidisciplinary approach included different integrated investigations, from field-based to numerical (Miccadei et al., 2017; D’Alessandro et al., 2006).
The general meteorological and climatic analysis was based on the data from the weather stations provided by the Hydrographic Service of the Abruzzo region and specifically the snow depth data from 12 snow gauges in the Gran Sasso area (Table 1). The seismicity was analyzed based on the data provided by INGV, Istituto Nazionale di Geofisica e Vulcanologia (INGV, 2016; Luzi et al., 2017; Rovida et al., 2019). The snow avalanche inventory was provided by the State Forestry Corps of Italy and the Abruzzo Region (Regione Abruzzo, 2014).
Concerning the Mt. Siella area, the morphometric investigation was based on a digital elevation model (DEM) of the study area, derived from 1:5,000 topographic maps (DBTN of the Abruzzo Region from the Opendata service; Regione Abruzzo, 2017) and extracted through ArcGis software (ArcGis 10.6 Esri©, USA). The entire Rigopiano–Monte Siella slope was investigated using geomorphological field mapping at a 1:5,000 scale, focusing on the analysis and the comprehension of the surficial deposits and landform distributions.
The multitemporal-multiscale photogeological analysis performed on erial images allowed us to investigate the eastern Mt. Siella slope and the Rigopiano plain area, and to verify the evidence of geomorphological processes (with particular reference to pre-2017 avalanches). The survey was performed on eight series of erial images (erial photos and orthophotos, Table 3) in the 1945 to 2017 timespan, with scales ranging from 1:5,000 to 1:55,000. They were acquired from the Cartographic Portal and Opendata Portal of the Abruzzo Region (Abruzzo Region, 2017), the National Geoportal, from BING map services, or provided by the Geographic Military Institute of Italy (IGMI). The analysis was based on the criteria and methods of photogeology, defining the main photogeological parameters (i.e., tone, texture, shape, vegetation, and drainage) on each of the images analyzed and through the three-dimensional analysis by stereoscope on pairs of photographic images. For each of the images the identification and classification of features led to the erial photo interpretation. Through the deduction stage on the classified features, the photogeological analysis provided indications and evidence of geomorphological elements linked to instability. Specifically, avalanches and gravity-induced and water-related landforms, were investigated from the slope of Mt. Siella to the Rigopiano plain, as well as evidence of the anthropogenic changes.
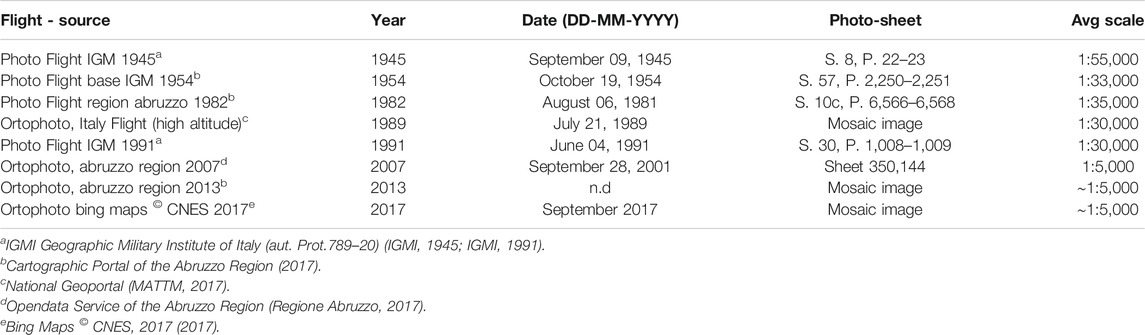
TABLE 3. Aerial photo and orthophotos used for the survey.
The numerical analysis specifically focused on the detachment area of the Rigopiano avalanche (Figure 4), which showed a possible connection with seismic shaking and was poorly constrained by the post-avalanche investigations with respect to the transit and accumulation area evident from field survey and erial photo analysis. The analysis included a combination of both 3D numerical modeling using FLAC3D software (Itasca, 2019) and stability analysis of the snow cover, which attempt to explain a different phase of the behavior of the snow layer. In the 3D modeling, we intended to verify the occurrence of important deformations in the snow cover with or without seismic shaking (investigating the factors controlling the avalanche trigger). With the desired stability index, we investigated the possible achievement of the ultimate conditions before the failure, considering gravity and seismic ground acceleration.
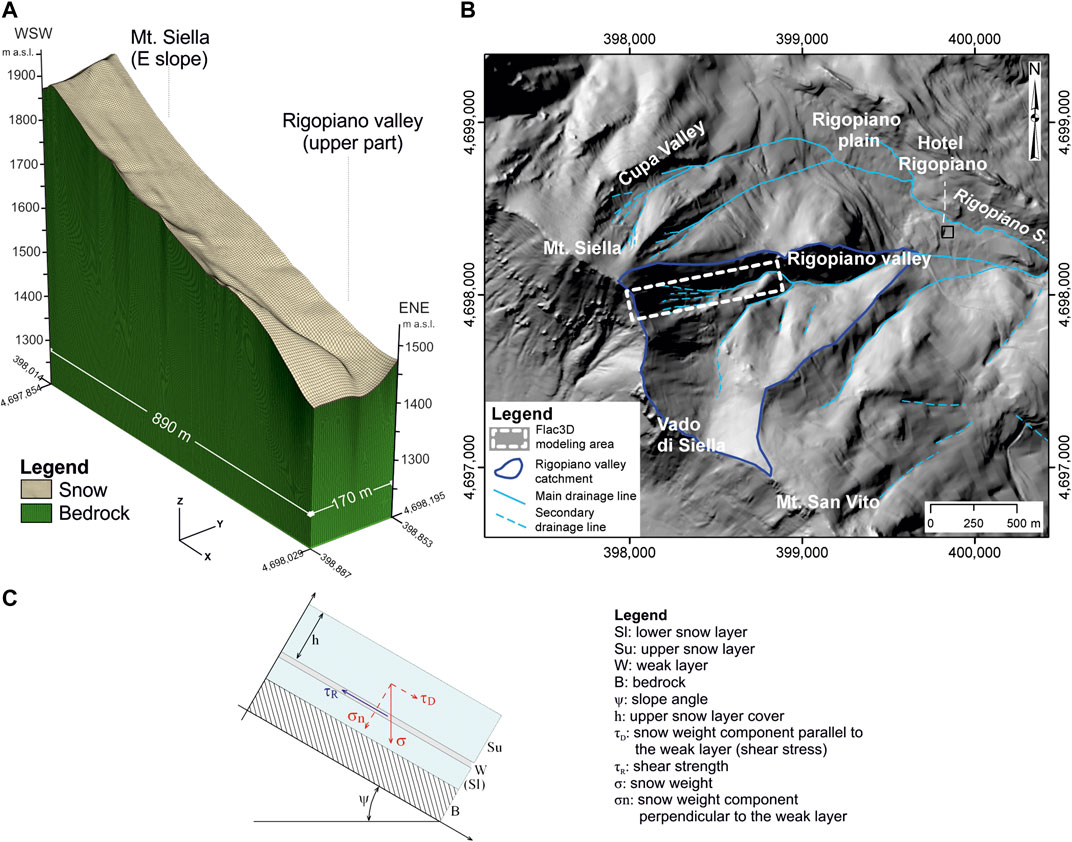
FIGURE 4. (A) 3D model of the upper part of the Rigopiano valley and discretization grid. (B) Location of the model. (C) Simplified scheme of the strength and strain within the snow cover.
FLAC3D is a numerical code mostly used for landslide investigations and slope modeling. In this work, the software features were exploited for modeling the deformation occurring within a thick snow cover on a steep slope both under static and dynamic conditions to investigate the detachment area and the role of the seismic shaking in the avalanche trigger. The nivological data (Bocchiola et al., 2018; NGI, 2018) do not provide an accurate definition of the snow cover and profile in the detachment area. For this reason, a plausible overall cover of 3.0 m was assumed over the entire slope. The snow and bedrock volumes were discretized by hexahedral meshes (bricks) parallel to the topographic surface; the bricks were 4 × 4 m wide and varied in height from 3 m at the base of the model to 0.5 m near the topographic surface (Figure 4A). The modeling area focused on the eastern Mt. Siella slope from the top to the mid-slope (Figure 4B).
The static numerical analysis was performed to investigate the slope before the avalanche and the occurrence of seismic shaking. The dynamic analysis was performed for assessing the influence of seismic shaking on the trigger of the avalanche. For the analysis, the four Mw > 5 shocks occurring on January 18, 2017 were considered combined in direct sequence with each other (Table 2). The accelerograms were acquired from the ITACA database for the Capestrano accelerometric station (Luzi et al., 2017), which is the closest to the study site (located ∼18 km south of the study area). From the input accelerograms (properly scaled according to Bindi et al. (2011)), the EW component was selected as representative of the most effective shaking on the slope, which is dipping from W to E. the EW component of the accelerogram was applied at the base of the model in the x direction (Figure 4A).
The stability analysis focused on the snow cover to control the fracture propagation in the slab avalanche detachment area (Heierli et al., 2008; Reuter and Schweizer, 2018). Fracture propagation is based on the traction tangential strain transfer in the snow slab from the shear plane to the detachment line, which produces the yield stress. The shear stress (τD) is derived as the snow weight component parallel to the slope acting on the shear plane. In slab avalanches, one or more weak layers are assumed between thick snow layers with cohesion and strength values higher than in the weak layer (Schweizer et al., 2003; Heierli et al., 2008; van Herwijnen and Heierli, 2009). The trigger of an avalanche must be investigated, defining the rupture within the weak layer through the stability index (S) as the ratio of the shear strength of the snow cover (τR due to cohesion and friction) along the weak layer over the shear stress (τD) along the shear plane (Figure 4C) (Supplementary Appendix B for details on the stability index calculation):
When S > 1, the system is stable; when S = 1, the system is in critical stability conditions and failure is incipient; when S < 1, the system is unstable and failure occurs. Failure occurs within a weak layer (W) between two snow layers (Sl and Su) with more cohesion or between a snow layer (Su) and the bedrock (B) if the lower snow layer (Sl) is not present (Schweizer et al., 2003).
The weight of the snow layer above the weak layer and the sliding surface, for the calculation of S, depends on the snow cover (h) due to the snow fall over time and on the layering of the snow profile. Without detailed snow profiles in the detachment area, the analysis is parametric. When additional forces occur (i.e., additional snow, wind, seismic acceleration), the calculation is completed by additional factors. The wind component is not considered in this case, since there are no detailed data and no strong winds were reported for the avalanche’s day. The seismic shaking induces inertial forces within the snow cover, varying the internal stress and increasing the shear stress. In these conditions, the stability index calculation can be varied as (Pérez-Guillén et al., 2014):
where Δτs is the additional shear stress due to seismic shaking. The denominator can be calculated as (Pérez-Guillén et al., 2014):
In the latter formula, the resulting shear stress is variable with time as a function of the seismic ground acceleration a(t) (i.e., the component parallel to the slope). The worst conditions within the weak layer and along the sliding surface occur at the maximum ground acceleration value (i.e., the peak ground acceleration, PGA).
The calculation of τR is based on the Abe (2004) diagram, considering the shear strength of the graupel snow expected to be present in the study area at the moment of the avalanche’s occurrence.
Snow Avalanche vs. Earthquake Distribution in Central Italy
In recent decades, some combined events were revealed with moderate-to-strong earthquakes affecting mountain areas in winter/early spring with moderate-to-deep snow cover (Figure 3C). From the historical dataset, the avalanches documented as possibly connected to seismic triggers are restricted to two main events: the April 2009 event in the Assergi area and the January 18, 2017 event in the entire Gran Sasso massif.
April 2009 in the Western Gran Sasso and Assergi Area
In April 2009, the Abruzzo region was struck by the second strongest earthquake in the Central Apennines. Specifically. On April 6, 2009, the L’Aquila area was hit by the main earthquake (Mw 6.1 at 2:32 UTC+1, Figure 2B). The main event was followed by four more (Mw > 5.0, Table 2). The highest part of the mountain area (i.e., >1,500–1,800 m a.s.l.) still had moderate snow cover, 0.5–1 m, preserved in mid-springtime with occasional avalanches of wet snow (Meteomont, 2017). The April 2009 earthquake, due to the serious damage to the L’Aquila area, was poorly investigated in term of avalanche distribution. Most of the geomorphological effects were, instead, related to co-seismic fractures and scarps, seismically induced landslides, ground collapse, and local liquefaction (Boncio et al., 2010; Miccadei et al., 2013). However, some data were derived from erial photo interpretation and eyewitnesses, particularly in the Assergi-Pizzo Cefalone area. The avalanches occurred in connection with the main seismic shocks from April 6–9, 2009 and at a distance from 10 to 20 km from the main epicenters (Table 4) in the western Gran Sasso area. More specifically, the Corno Piccolo and Prati di Tivo areas were affected by avalanches on April 6, 2009; the Assergi area was affected by avalanches (mixed snow and debris) during the shocks of April 6–7, 2009 (evidence derived from orthophotos taken on April 8, 2009; Figure 5). In the internal Gran Sasso area, other events were documented but without precise timing (Table 4).
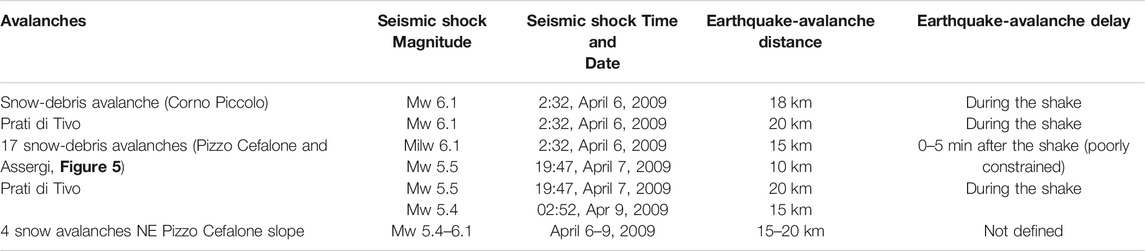
TABLE 4. Snow and snow-debris avalanches events documented on April 6–9, 2009 by orthophotos and eye-witness reports.
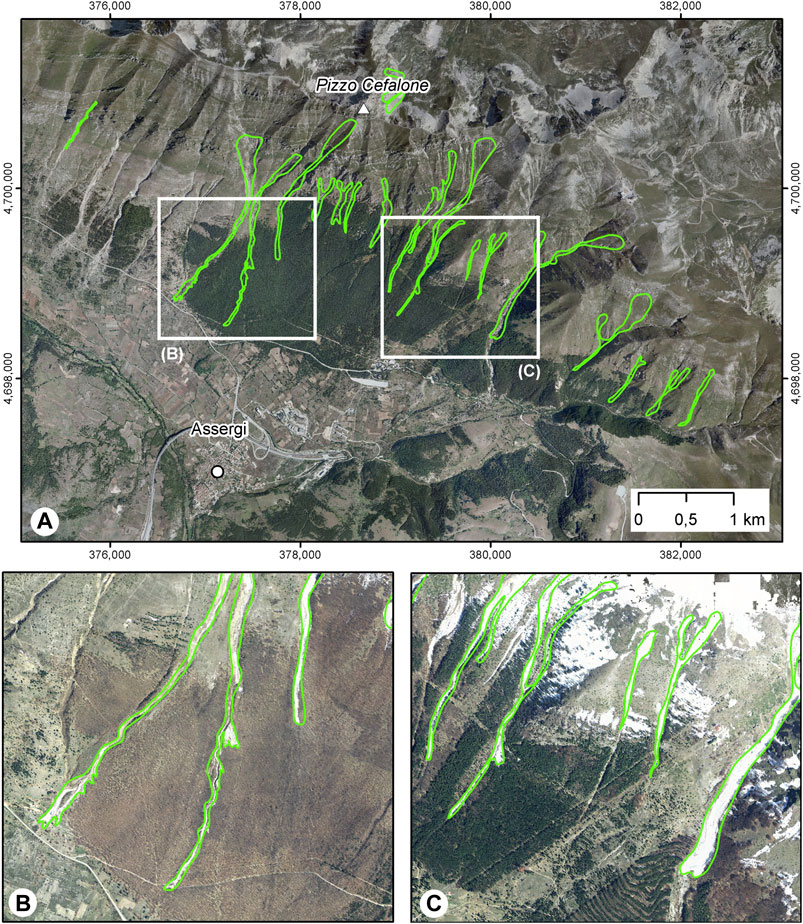
FIGURE 5. Evidence of snow avalanches (green lines) on April 2009. (A) Entire Assergi-Pizzo Cefalone area (on orthophotos taken April 8, 2009). (B) Detail of the evidence on SW slope of Pizzo Cefalone (west part, see A for location). (C) Detail of the evidence on SW slope of Pizzo Cefalone (east part, see A for location).
January 2017 in the Entire Gran Sasso Area
In January 2017, the eastern part of the Central Apennines and the hilly piedmont was affected by intense snowfall and rainfall. This event was part of a major cold meteorological event that affected central-eastern to southern Europe from 5 to January 21, 2017 (Di Lena and Giuliano, 2017; Regione Abruzzo, 2017; Calista et al., 2019). An intense snowfall event affected the Abruzzo area starting on 6 and 7 January (temperatures −10 to −13°C) with a snow cover of ∼1 m. A thermal collapse occurred on 11 January with temperatures down to −20°C, even at intermediate elevations (1,000–1,500 m a.s.l.). After a few days, mainly on 16–18 January, another perturbation affected central Italy, and specifically the Abruzzo, with a temperature drop and a heavy snowstorm (Di Lena and Giuliano, 2017; Regione Abruzzo, 2017; Calista et al., 2019). This combination of events created a >3 m snow cover along the eastern Abruzzo Apennines ridges, characterized mostly by graupel snow. In the hilly piedmont, the snow cover (wet snow) was up to 1.5 m and in the coastal area, it was >0.5 m. Finally, a temperature increase and a further perturbation with rainfalls induced a progressive rapid snowmelt.
On January 18, 2017, a moderately intense seismic event occurred during the main snowstorm, with more than 400 events in 24 h and 11 main events (Mw > 4) from 10:25 to 21:00 (UTC+1), with four strong shocks (Mw > 5) from 10:25 to 14:33 (Figure 2B; Table 2). In the Gran Sasso mountain area, these events induced a PGA up to 5.74 ms−2 (INGV, 2017). Specifically, in the Mt. Siella area, a PGA of 0.019–0.17 m s−2 (for the seismic shocks Mw > 4) was derived scaling the values recorded in the accelerometric stations according to Bindi et al. (2011). This combination of events induced a large number of avalanches on the main mountain slopes (mainly in the Gran Sasso ridge) on January 18–19, 2019. Some of the largest events occurred on the eastern side of Mt. Siella (the Rigopiano area, Bruciata valley) at an elevation ranging from 1750 m to 1,085 m a.s.l.
The distribution of the avalanches was provided by the Forestry Corp of Italy and supported by eyewitness reports and newspapers chronicles (Figures 6A, 7; Supplementary Appendix C). The analysis outlined a total of 76 events on January 18, 2017 (46 of which occurred in the Gran Sasso area). Two of the avalanches caused fatalities (29 in Rigopiano, one in Ortolano), and one person was injured (Pietracamela). Other main events occurred in Mt. Siella, Savina Valley, Assergi, and Prati di Tivo (Figure 7). During the night and morning of 19 January, 14 more events occurred, in particular (13 of them) on the NE side of the Gran Sasso ridge (e.g., Villa Santa Lucia, Figures 6A, 7; Supplementary Appendix C). On the morning of 20 January, 15 more avalanches were recorded, mostly (12 events) in the Corno Grande-Prati di Tivo area (Figure 6A). The temporal distribution of the avalanches (Supplementary Appendix C) was investigated in connection with the distribution of the seismic events on January 18, 2017 Rovida et al., 2019. Although the timing of the avalanche was not always precisely defined, a clear connection was found between the distribution of most of the avalanches and the major seismic shocks (i.e., Mw > 5.0). The analysis of the temporal distribution considered the uncertainty of the occurrence time of the avalanches (Supplementary Appendix C) as a proportional probability of occurrence in a specific time (Figure 6B). Several avalanches occurred in connection with the first main seismic event (Mw 5.1, 10:25) and most occurred in the period of the four main (Mw > 5) events; three more occurred after the last main (Mw > 5) event, including the Rigopiano avalanche, which occurred 135 min after the last Mw > 5 event and 32 min after an Mw 4.3 event (Figure 6B). Finally, for the documented avalanches, the analysis of the distance from the triggering earthquakes produced values of 9.4 to 50.2 km, which are mostly consistent with the seismically induced avalanches known in the literature (Podolskiy et al., 2010a; Podolskiy, 2010). This distribution again confirms the anomaly in the distribution of avalanches on January 18, 2017 and a clear connection between avalanches and seismic events, as well as delayed avalanches with respect to the main seismic events.
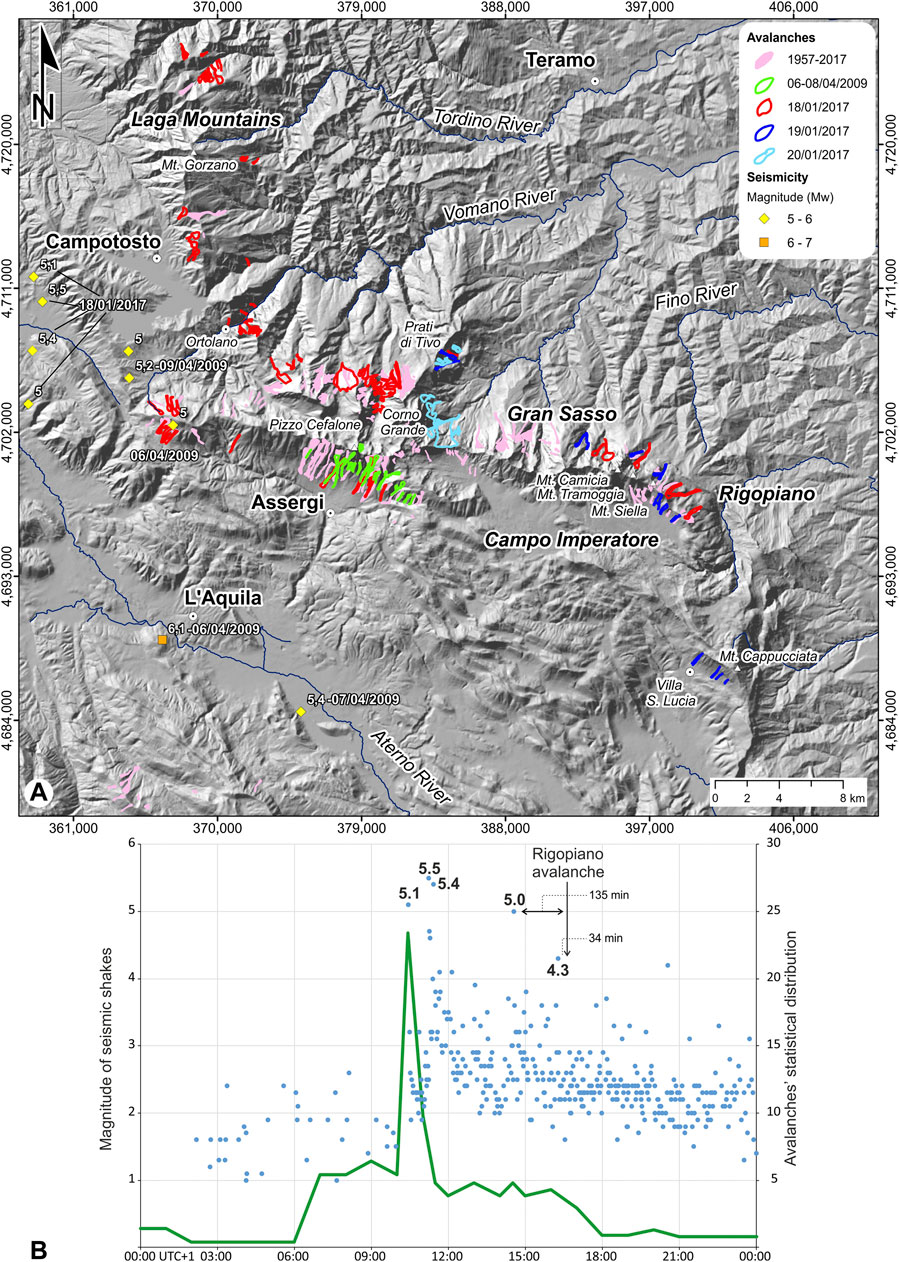
FIGURE 6. (A) Avalanche distribution from 1957 to 2017. The avalanches recorded on 18–20 January 2017 are highlighted (Supplementary Appendix C; Regione Abruzzo, 2014)). The seismicity (Mw > 5) in winter (i.e., December–April) is highlighted and is only recorded on 6–9 April 2009 and on January 18, 2017 (Table 2; Supplementary Appendix A). (B) Comparison of avalanches’ temporal distribution (green line derived from the processing of Supplementary Appendix C (Regione Abruzzo, 2014)) and seismic shocks time distribution on January 18, 2017 (blue dots, from CPTI18 in Rovida et al. (2019)).
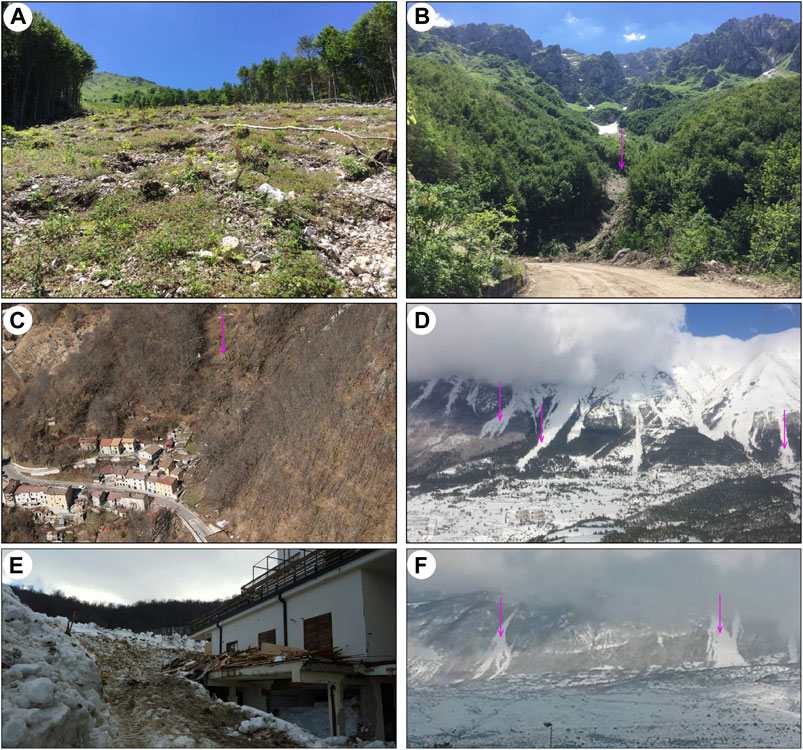
FIGURE 7. Examples of the avalanches on January 18–19, 2017 (pink arrows) or post snow-melt evidence (location in Figure 6): (A) NE slope of Monte Siella, (B) NE slope of Sella di Tramoggia, (C) Ortolano (TE) (source Youreporter, 2017), (D) Assergi (AQ) (source Il Capoluogo, 2017), (E) Prati di Tivo (TE) (source Il Martino, 2017), and (F) Villa Santa Lucia (AQ) (source Abruzzo Live, 2017).
The Mt. Siella Avalanches
The snowfall event occurred in the area (see January 2017 in the Entire Gran Sasso Area) created, in the Mt. Siella area, a thick snow cover, estimated up to >3 m thick (252 cm were documented at the lowest elevation on 20 January, Meteomont, 2017). The cover was composed of a lower layer (∼0.7–1 m) of more compacted and stronger snow (due to the snowfall occurred on 6–7 January) and an upper layer of softer, not compacted snow (due to the 16–18 January snowstorm). In these conditions, on the NE slope of Mt. Siella–Vado di Siella–Mt. San Vito (along the eastern part of the Gran Sasso ridge, Figure 6), three avalanches occurred on the afternoon of January 18, 2017 as large slab avalanches. One occurred at 16:48 UTC+1 (from local chronicles or 16:42-16:43 as recently defined geophysically by Braun et al., 2020) in the Rigopiano valley (also known as Bruciata valley), 135 min after the last main seismic shock of the four on 18 January (Mw 5.0 at 14:33) and 32 min after a moderate seismic event (Mw 4.3 at 16:16). It was one of the most significant, most damaging, and best constrained among those that occurred during the January 2017 event. It was confined within the Rigopiano valley and spread out along the Rigopiano plain, whereas the two additional avalanches on the NE slope of Mt. Siella and in the Cupa Valley affected the slope without reaching the plain (Figure 8).
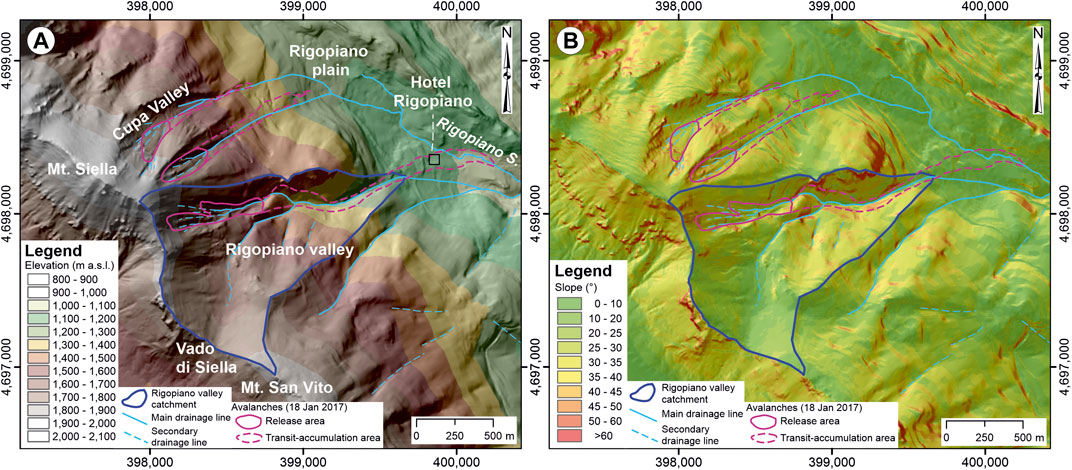
FIGURE 8. Orography of the Rigopiano study area: (A) elevation map; (B) slope map.
Geomorphology
Orography and Hydrography
The Mt. Siella–Vado di Siella–Mt. San Vito ridge is roughly NW–SE with an N–S segment in the Rigopiano valley area. From the ridge to the Rigopiano plain, the following orographic elements were identified (Figure 8):
The east side of Mt. Siella, an east-facing slope (from 1,970 to 1,650 m a.s.l., with a 30°–40° slope), from planar to undulated, with gentle E–W grooves.
The Vado di Siella valley, a gentle S–N concave hanging valley (1,850–1,650 m a.s.l.); to the north, joining the Rigopiano valley.
The Rigopiano valley: a WSW–ENE V-shaped valley in the upper part (1,650–1,450 m a.s.l., 15–20 m deep, longitudinal gradient 25°–30°); a WNW–ESE V-shaped valley in the middle part (1,450–1,280 m a.s.l., up to 600–400 m wide, 150 m deep, longitudinal gradient 15°–20°, side slopes ∼32°–35°); a WSW–ENE V-shaped valley in the lower part (1,280–1,180 m a.s.l., longitudinal gradient 10–15°, from 400 to 50 m wide, gradually less deep, from 150 to 5–10 m, side slopes ∼35°–38°).
The outlet of the Rigopiano valley toward the Rigopiano plain (1,180–1,170 m a.s.l., longitudinal gradient from 10°–15° to 5°–10°); anthropogenic activities have modified the original morphology.
The Rigopiano plain (1,200–1,080 m a.s.l.), gently undulating and carved by the Rigopiano Stream. Even in this sector, anthropic changes modified the original morphology.
Toward north and south, the slope of Mt Siella–Vado di Siella–Mt San Vito is carved by smaller WSW–ENE and SW–NE valleys (e.g., Cupa Valley).
The hydrographic network and the catchment trend from WSW–ENE to SW–NE, with an overall parallel drainage network pattern consistent with the slope dip.
Photogeological Analysis
The analysis allowed us to outline evidence of small avalanches and/or combined debris flows before the 2017 avalanches in some images (1945, 1989, 1991, and 2017; Figure 9). The other images only showed evidence of tree canopy regrowth in previous avalanche areas (1954, 1982, 2007, and 2013).
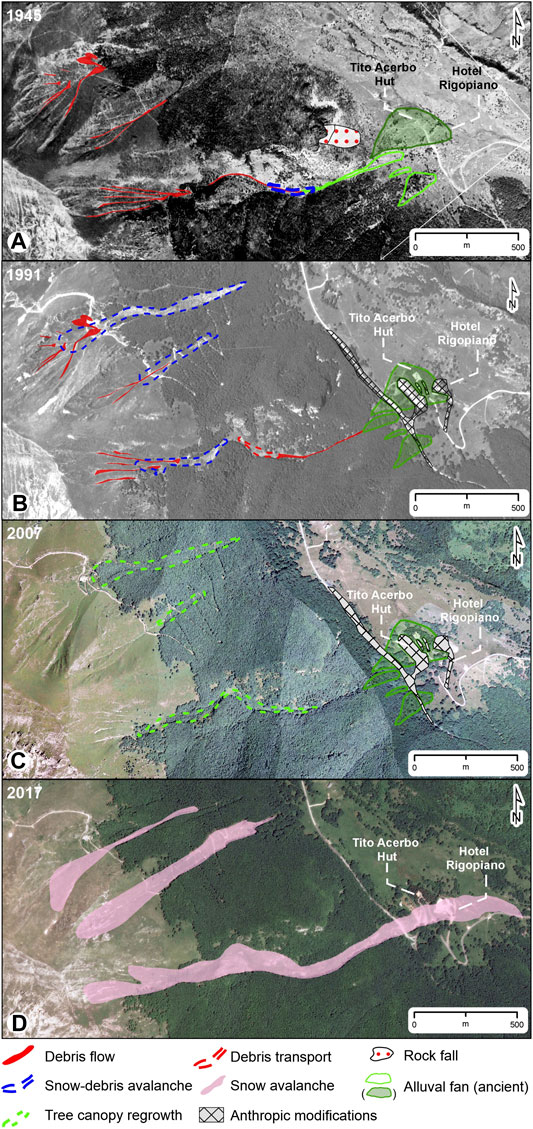
FIGURE 9. Photogeological scheme of the Rigopiano area: (A) 1945, (B) 1991, (C) 2007, and (D) 2017.
In 1945, the photogeological interpretation provided evidence of geomorphological processes connected to small avalanches and/or debris flows of limited extent (area ∼8,800 m2, length 460 m) and localized in the middle part of the Rigopiano valley (Figure 9A). The findings are not recent and can be likely attributed to processes occurred in the decade before the image was captured. In the lower part of the valley, at the junction with the Rigopiano plain, minor alluvial fans can be outlined, with evidence of minor debris accumulation, well entrenched in the valley and into an ancient inactive alluvial fan. From 1954 to 1982, the image analysis outlined progressive tree canopy growth in the Rigopiano valley and over the alluvial fans. In 1989, the image showed minor evidence of debris flows and/or small snow avalanches in the upper (area ∼18,200 m2, length 480 m) and middle (area ∼6,400 m2, length 220 m) parts of the Rigopiano valley. According to the freshness of the evidence, these processes were attributed to the year before the image (e.g., 1988–1989, and certainly not before 1982).
This evidence was better documented in high-resolution images from 1991 (Figure 9B). These images confirmed the minor evidence of debris flows and/or small avalanches in the upper and middle parts of the Rigopiano valley. They outline two more areas affected by avalanches and mixed snow-debris avalanches in minor valleys (e.g., Cupa Valley) to the north of the Rigopiano valley (NE slope of Mt. Siella). These elements were not documented in the 1989 image and should have occurred between 1989 and 1991. Specifically, the Cupa Valley was documented to be affected by a snow avalanche on February 1, 1991 in the regional map of avalanches (Regione Abruzzo, 2014). In 2007, the images again showed evidence of tree canopy regrowth in the areas affected by avalanches in 1989 and 1991 (Figure 9C), as also confirmed in the 2013 images.
Finally, the 2017 image (captured in September 2017), showed evidence of the January 18, 2017 avalanches (Figure 9D), which occurred in the Rigopiano valley and the minor northern valleys (e.g., Cupa Valley). The Rigopiano avalanche is large (area ∼191,500 m2, length 2,200 m), with a detachment area in the eastern slope of Mt. Siella, a transit area within the Rigopiano valley, and the accumulation area in the Rigopiano plain. This size is largely anomalous with respect to the avalanches documented from 1945 to before 2017.
Geomorphological Features
The bedrock lithologies of the Rigopiano valley consist of massive and layered Mesozoic–Cenozoic limestone and dolomites (Figure 10). The Rigopiano plain features a Neogene conglomerate and sand-clay bedrock. These lithologies were deformed by folds, thrusts, and normal faults, and are highly jointed. The bedrock is covered by thin surficial deposits consisting of slope debris and colluvial deposits at the base of the slopes and within the valleys and the plain. At the Mt. Siella slope–Rigopiano plain junction, patches of ancient alluvial fan deposits (cemented breccias and consistent gravel-debris) are present.
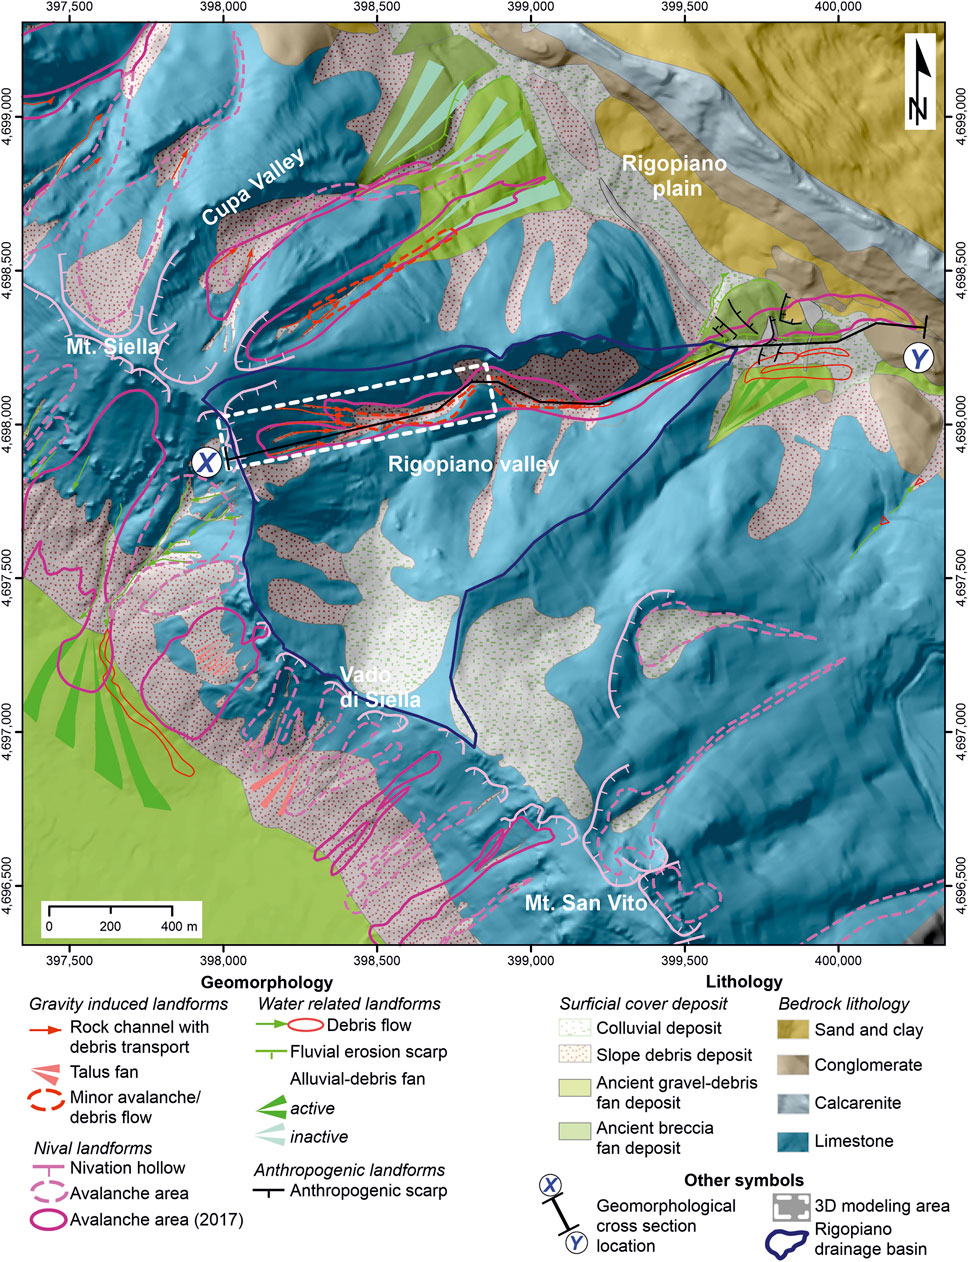
FIGURE 10. Geomorphological scheme of the Rigopiano area. The scheme outlines the scattered superficial deposits covering the east slope of Mt. Siella–Vado di Siella and the mostly exposed bedrock. The main nival (pink), gravity-induced (red), and water-related landforms (green) are mapped.
The main landforms (nival, gravity-induced, and water-related) are summarized in the geomorphological scheme of the Rigopiano valley (Figures 10, 11A), which combines the results of the field mapping and the photogeological analysis. The upper slope of Mt. Siella–Vado di Siella was affected by erosion incisions and grooves with transport and accumulation of slope debris (Figure 11B). In the upper part of the Rigopiano valley, a blanket of slope deposits was observed. The deposits feature a low thickness (not more than a few meters in alignment with the incisions). At the mouth of the Rigopiano valley in the plain area, an irregular convex shape was observed that consists of highly heterogeneous debris deposits (with centimetric to metric blocks) firmly cemented, indicating an ancient form and deposit. It is re-incized from the terminal part of the Rigopiano valley with a scarp up to 5–8 m high. This is assumed to be the remnant of an ancient debris fan, re-incized and no longer active in the current geomorphological conditions, possibly referable to the Late Pleistocene. Minor debris flows and alluvial fan are also present in the junction between Mt. Siella slope and Rigopiano plain (as well as on the SW slope of Mt. Siella).
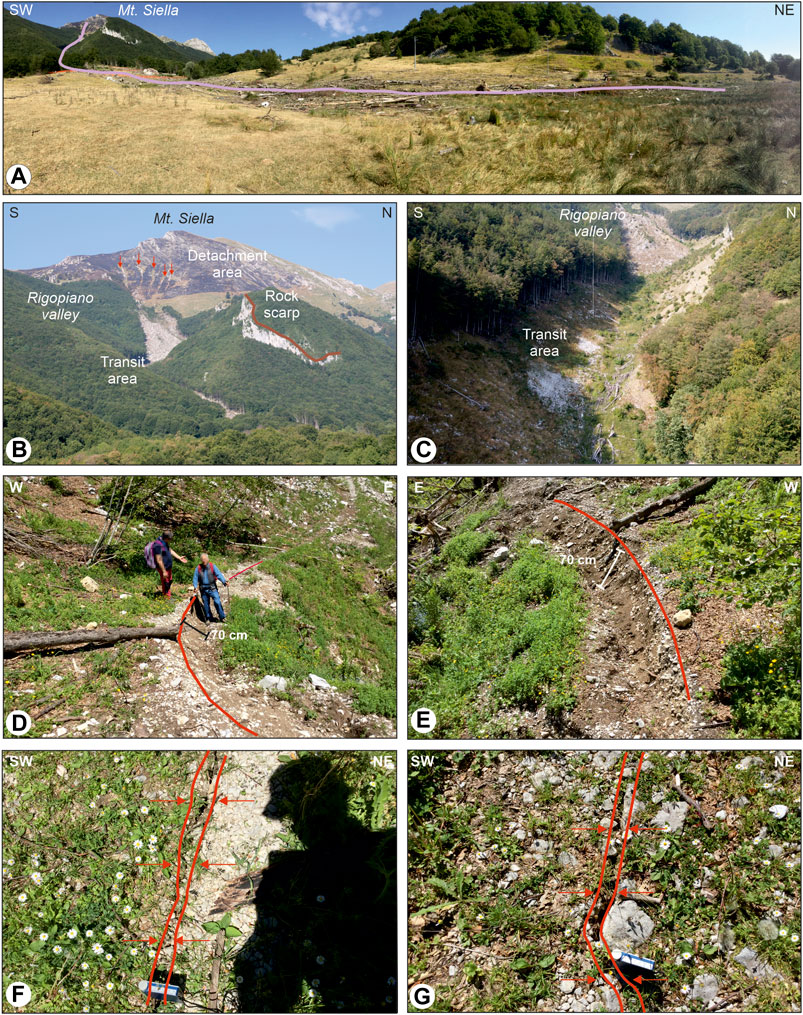
FIGURE 11. Geomorphological landforms in the Rigopiano area: (A) View of the Rigopiano valley from Mt. Siella to the Rigopiano plain (where the 2017 avalanche occurred, approximately indicated by the pink line). (B) Eastern Mt. Siella slope and Rigopiano V-shaped valley; the detachment and the transit area of the 2017 avalanche were evidenced, as well as a steep rock scarp on the northern side of the valley; the whitish striae (red arrows) in the detachment area are debris flows. (C) Rigopiano V-shaped valley and transit area of the 2017 avalanche. (D) Upper Rigopiano valley (1,535 m a.s.l.); scarp con-nected to the co-seismic shaking and avalanche triggering. (E) Upper Rigopiano valley (1,535 m a.s.l.); close up of the scarp connected to the co-seismic shaking and the avalanche triggering. (F) NE side of the Mt. Siella (1,465 m a.s.l.); co-seismic fracture 3–5 cm open. (G). NE side of the Mt. Siella (1,510 m a.s.l.); co-seismic fracture 2–3 cm open. The location of the co-seismic fractures is depicted in Figure 12.
The nival landforms consist of large nivation hollows and avalanches areas (pre-2017 and 2017 avalanches) along the Mt. Siella-Vado di Siella ridge. The SW slope is mostly affected by avalanche paths and accumulation areas. More specifically, the NE side of the slope is characterized by the landforms related to the avalanches that occurred on January 18, 2017 (Figures 11A–C). The detachment developed in the upper part of the slope with a 30°–40° gradient, consistent with the typical slope distribution of avalanche detachment (van Herwijnen and Heierli, 2009). The transit area develops from the upper to the lower part of the slope, confined in the Rigopiano valley and minor valleys. The minor avalanches (e.g., Cupa valley) feature transit areas within poorly incised valleys; the accumulation area is confined within the Mt. Siella slope and did not affect the underlying plain. The major Rigopiano avalanche features a sinuous plan shape confined within the valley; the section profile is concave (deeply incised in the valley); the transit channel is asymmetrical, particularly in the valley turns, where it is upraized on the outer side of the valley (Figure 11B). The accumulation area develops from the outlet of the Rigopiano valley and spread out over the entire plain (Figure 11A).
The upper part of the slope was investigated in detail to outline the evidence of the detachment area. It was defined through tree cover removal (Figures 11B,C, 12). No evidence of debris removal was found in the detachment area, suggesting that the snow slide involved the snowpack and poorly affected the slope debris deposits. However, the field survey allowed us to map new evidence of co-seismic deformation. Some scarps and fissures in the debris cover were documented. These features occur along the Rigopiano valley at 1,535 m a.s.l. in a roughly NNW–SSE orientation (Figures 11D,E) and the NE slope of Mt. Siella at 1,465–1,510 m a.s.l. in NW–SE orientation (Figures 11D,E). According to their distribution and pattern, these elements were interpreted as co-seismic fractures connected to the seismic shaking of the slope. This further confirmed the connection between this avalanche and the seismic trigger. For this reason, we investigated the detachment area of the Rigopiano avalanche using 3D numerical modeling and stability analysis.
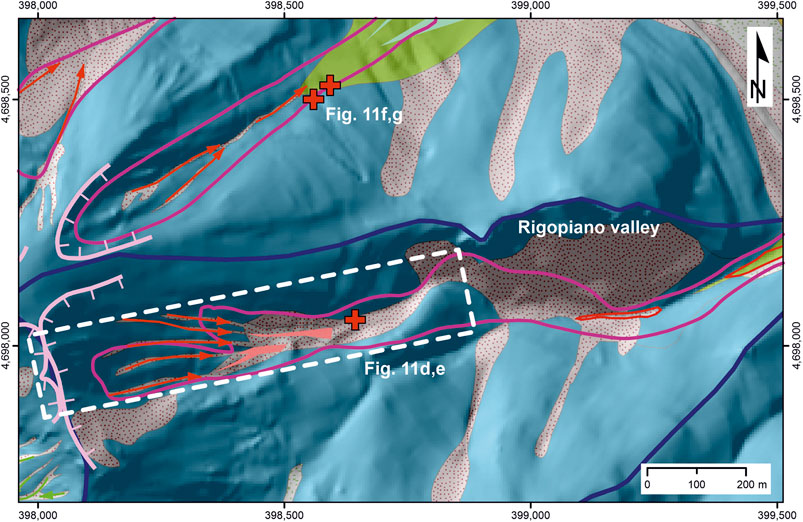
FIGURE 12. Geomorphological scheme of the Rigopiano avalanche detachment area (zoom of Figure 10). For the legend, see Figure 10; the red crosses mark the co-seismic fractures and scarps (Figures 11D–G).
Numerical Modeling
The numerical modeling focused on the investigation of the snow deformations, under static and dynamic conditions using FLAC3D software (Itasca, 2019), in the Rigopiano avalanche detachment area from the Mt. Siella slope to the upper Rigopiano valley (Figures 4, 12). Accurate dynamic modeling was conducted to verify the connection with the trigger of the snow avalanches and the mapped co-seismic fractures/scarps. The static analyses outlined a critical area in the snow cover, whereas the dynamic analyses highlighted the neoformation of permanent deformations inside the snowpack accumulated during the main seismic events. Combining the obtained result with a specific stability analysis on the snow cover, with a congruent calculation, we determined the overall conditions of the snow on the slope.
Numerical Modeling of Snow (FLAC3D)
The first analysis was carried out under static conditions (Figure 13A), which outlined that the overall slope is generally stable. Minor deformations were highlighted in the upper part of the slope (steepest part, with slope >35°). According to the modeling, these areas did not reach rupture conditions during the static analysis, as evidenced by the maximum unbalanced force graph (Figure 13A).
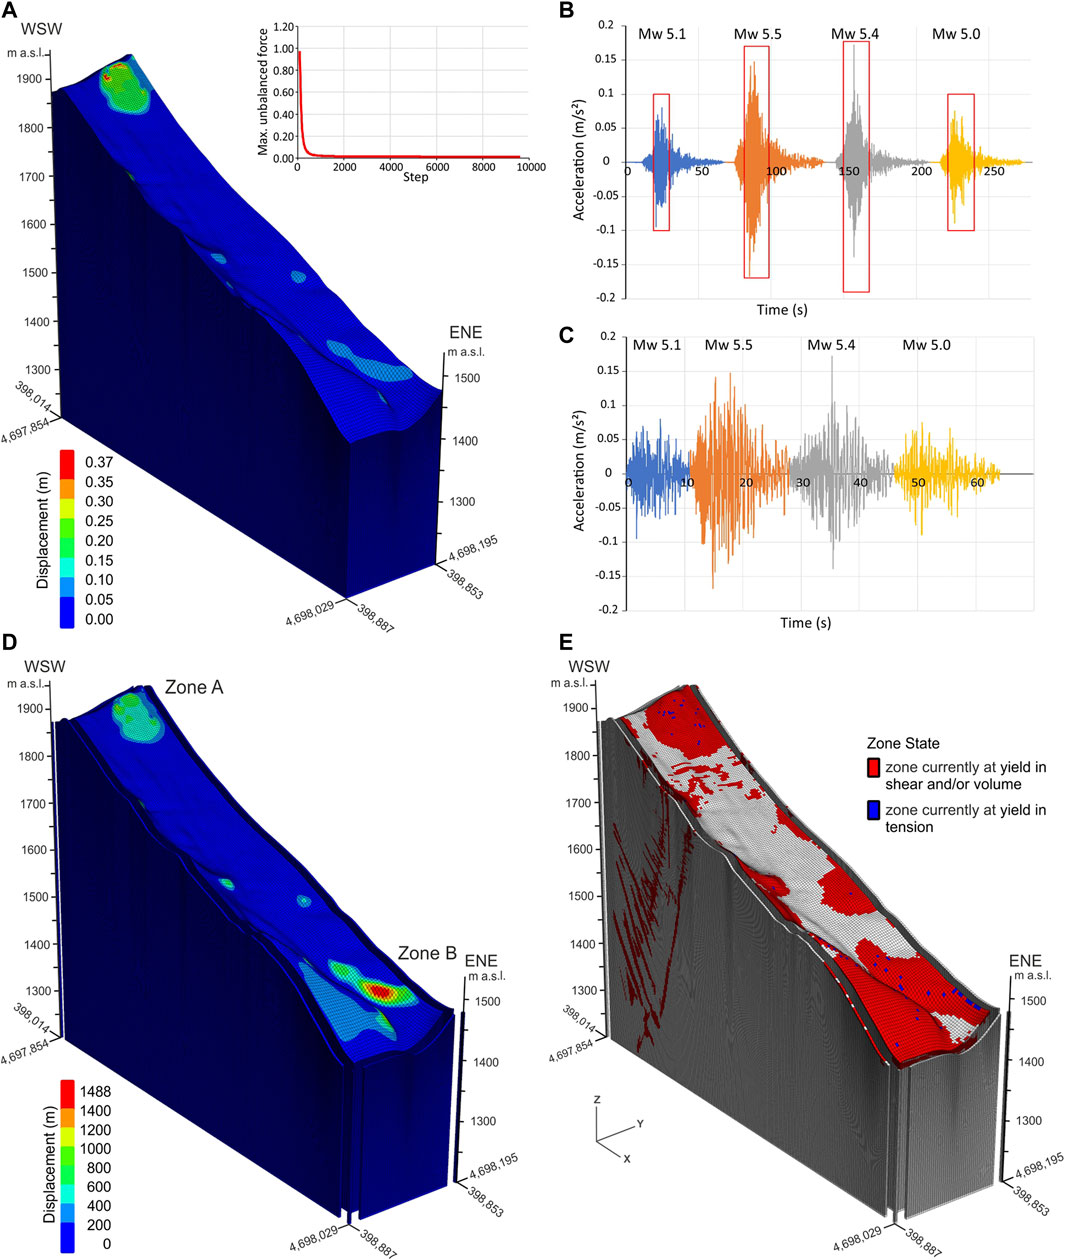
FIGURE 13. (A) Zone displacement magnitude predicted by the FLAC3D simulation run under static conditions with 3 m of snow; in the upper right maximum unbalanced force graph. (B) The sequence of the accelerograms (Capestrano Accelerometric Station (Luzi et al., 2017); Figure 5) of the Mw > 5 earthquakes on January 18, 2017. The red boxes show the significant sections of the four accelerograms. (C) Significant sections of the four accelerograms combined to define the input of the second analysis. (D) Displacement magnitude and (E) plastic state predicated by the FLAC3D simulation run under dynamic conditions with 3 m of snow; the images were extracted at the end of the simulation (input in B).
A second analysis was run under dynamic conditions. The analysis used as input an accelerogram derived from the inputs of the four Mw > 5.0 earthquakes on January 18, 2017 (Table 2, Figure 13B), combining the most significant part of the four main shocks (red boxes in Figure 13B, combined in Figure 13C). The accelerograms from the Capestrano station were scaled according to Bindi et al. (2011) obtaining a maximum acceleration of 0.17 m s−2. This input configuration was assumed to be representative of the effects of the entire seismic sequence on the snow stability. The resulting accelerogram was applied at the base of the model along the x-axis. The simulation was run for a total of 65 s of input. The dynamic analysis (Figure 13D) highlighted two critical areas of deformation within the modeled area. These critical areas were reached after 11 s of modeling run (i.e., at the end of the Mw 5.1 input; Figure 13D) and increased in terms of displacement amount for the entire input sequence. The first area was located in the upper part of the Mt. Siella slope, from 1925 to 1830 m a.s.l. (zone A in Figure 13D) in the steepest areas (>35°). It largely corresponds to the area affected by low deformation in the static simulation (Figure 13A). The second area was located in the lower part of the Mt. Siella slope and the upper part of the Rigopiano valley from 1,540 to 1,430 m a.s.l. (zone B in Figure 13D). This second area showed the largest displacements and corresponded to the upper and narrow part of the Rigopiano valley, where the co-seismic features were also documented. The areas in a plastic state (Figure 13E) were even larger than those highlighted by the displacement contour (Figure 13D). Not considering the possible side effects, the critical areas highlighted here are larger but correspond to those shown by the displacement diagram of the upper part of the Mt. Siella slope and the upper part of the Rigopiano valley.
Stability Analysis
For the stability analysis, without a detailed snow profile, a lower consistent layer (0.5–1.0 m thick) was assumed due to a first snowfall event around 6 and 7 January, ∼10 days before the avalanches. Above this layer, an upper less-consistent snow layer, related to the snowfall on 16–18 January 0–3 days before the avalanches, is defined with four different possible depths (0.5, 1.0, 1.5, and 2.0 m). The weak layer and initial sliding surface are assumed at the boundary between the upper and lower layers or at the soil snow boundary. In the analysis, a τR ranging from 1.5 to 1.65 kPa was used, as derived for a snow density above 200 kg/m3 according to Abe (2004). The stability index (S) was calculated for the four main seismic shocks on January 18, 2017 (Table 2) and considering the minor event (Mw 4.3) occurred at 16:16 (UTC+1), the closest in time to the triggering of the Rigopiano avalanche (16:48, UTC+1). From this analysis, we established, with weighted certainty, that as a result of the seismic shocks, a snow depth greater than ∼1.3 m over the sliding plane could have triggered the avalanche release (red values in Table 5). This corresponds to what occurred in the Rigopiano valley, except for the delayed trigger.
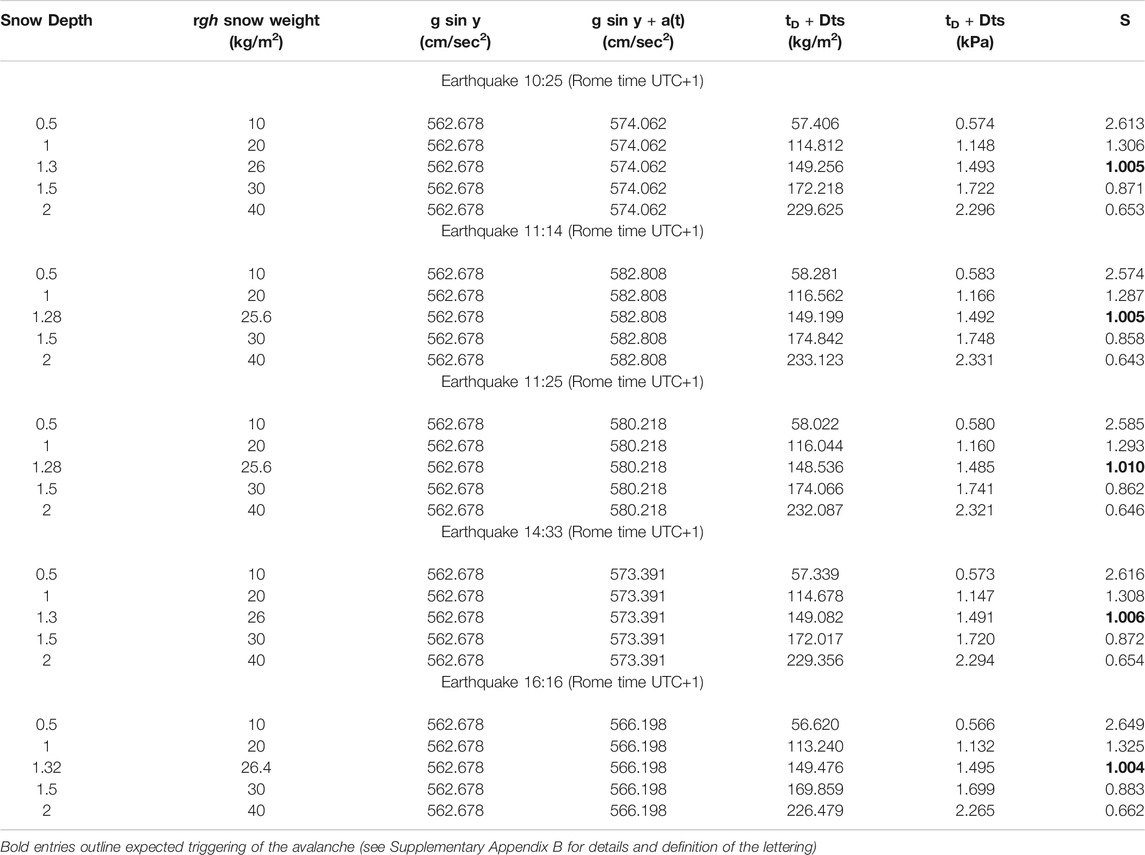
TABLE 5. Stability index calculation for the main January 18, 2017 earthquakes.
Discussion
We discussed the regional distribution of the snow avalanches vs. earthquakes and compared the findings with the detailed features of the Mt. Siella avalanches to outline the role of seismicity in the triggering of the avalanches. Finally, the delayed trigger of the Mt. Siella avalanches was discussed and compared with other documented cases.
Seismically Induced Snow Avalanches in Central Italy (Abruzzo Region)
The analysis of the snow avalanches vs. earthquakes distribution in central Italy (Abruzzo) documented two main events affected by seismically induced avalanches: the April 2009 event in the Assergi-Pizzo Cefalone area (western Gran Sasso, L’Aquila) and the January 2017 one (entire Gran Sasso area). On 6–9 April 2009, 24 snow avalanches in the western Gran Sasso out of 49 that occurred in the entire 2009 (in the Abruzzo mountain area) were connected, although without a precise timing, to the L’Aquila earthquake, the second strongest earthquake in the last decade in central Italy (five main shocks, Mw 6.1–5.4, from 6 to 9 April). Although the snow was present only at high elevation and the inventory of the avalanches was not systematic (heavy earthquake damages had just occurred), some events were documented through the analysis of post-earthquake erial photos and personal communications; for this reason, the number could be even underestimated. The 24 documented avalanches (i.e., mixed snow-debris avalanches) occurred from high elevation slopes (∼1700–2,150 m a.s.l.), with an estimated snow depth of 50–100 cm, through steep slopes and channels, down to gentle slope bases (elevation ∼1,000–1,450 m a.s.l.). The distribution in terms of avalanches number vs. snow thickness is moderately anomalous, even if compared with the yearly distribution (in the lower part of the graph, green dot, Figure 14A), indicating a low snow depth for the number of avalanches that had occurred. This is confirmed by the connections of avalanches with seismic shocks. The distance of the avalanches to the epicenters was ∼10–20 km for Mw 5.4–6.1, entirely falling within the range of the distance vs. magnitude of triggering earthquakes documented at a global level (Podolskiy et al., 2010a; Podolskiy, 2010).
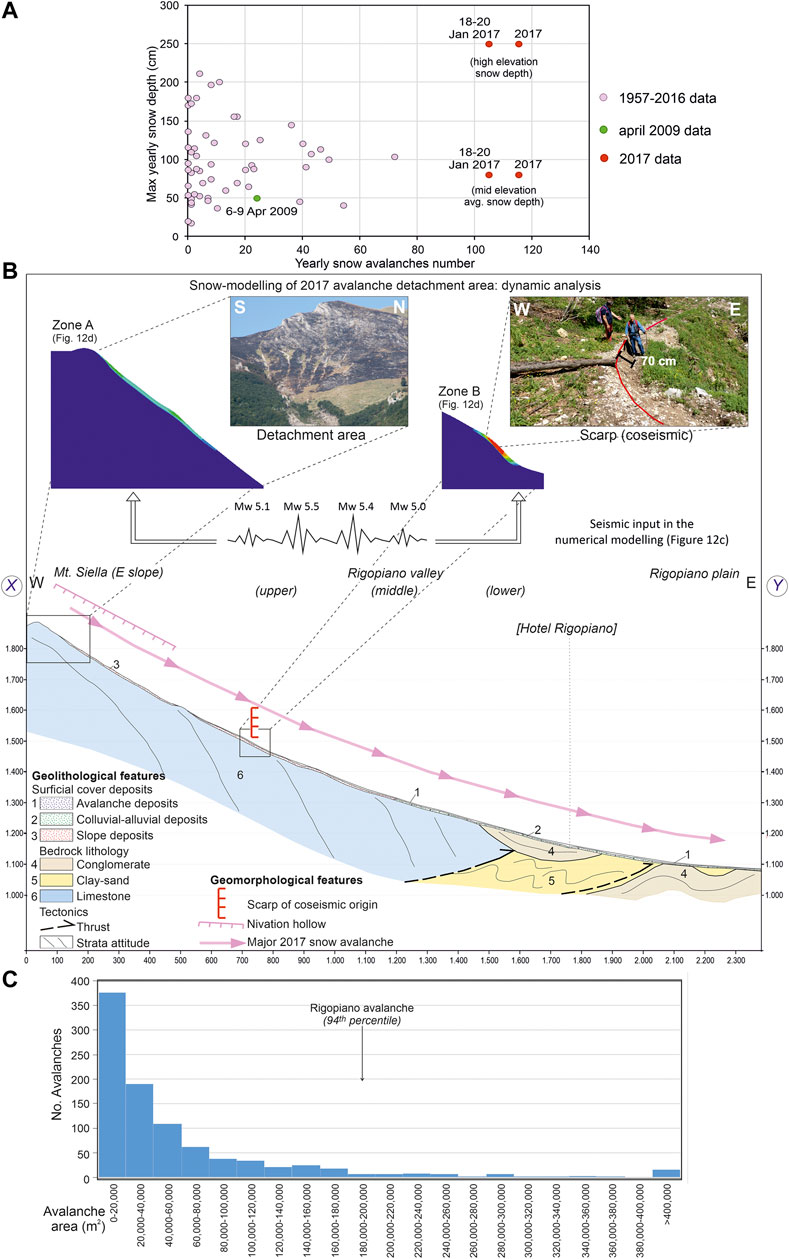
FIGURE 14. (A) Yearly avalanches distribution vs. maximum snow cover depth. (B) Schematic longitudinal cross-section of the post-2017 avalanche conditions along the Rigopiano valley (location in Figure 10), comparing geolithological and geomorphological features, and avalanche modeling of the detachment area. (C) Frequency histogram of the avalanches’ area from the 1957–2017 dataset.
In January 2017, an anomalous number of avalanches occurred in the entire Gran Sasso area. A total of 76 were documented on 18 January, 14 on 19 January, and 15 on 20 January. Only 10 more were recorded throughout the rest of the year. The avalanches occurred from slopes at elevation ∼1,200–2,400 m a.s.l., with an estimated snow depth of >250–300 cm, proceeding from steep slopes, channels, and deep valleys, down to gentle slope bases or valley floors (elevation ∼700–1,450 m a.s.l.). In this case, the distribution in terms of avalanches number vs. snow thickness was largely anomalous, considering both the average snow depth recorded by the snow gauges and the maximum snow depth recorded at high-elevation ski areas. A total of 115 avalanches (105 of which occurred on 18–20 January) were never recorded in the historical 1957–2017 dataset and this value is two/three times the maximum previous yearly values. The values are on the extreme right of the avalanches number vs. snow thickness graph considering both average and high-elevation snow depth (red dots, Figure 14A), indicating high snow depth but a very high number of avalanches. The avalanches were well documented (Supplementary Appendix C), confirming the definite time connection to the four main seismic shocks (Mw 5.0–5.5) on 18 January, with synchronous or delayed release (Figure 6B). During this event, the distance of the avalanches to the shocks’ epicenter was ∼10–50 km for Mw 5.0–5.5 shocks and the distribution again falls within the ranges documented at the global level (Podolskiy et al., 2010a; Podolskiy, 2010).
Finally, the comparison between the avalanches documented on April 6–9, 2009 and January 18–20, 2017 and those recorded from 1957 to 2017 revealed how the 2009 and 2017 events were anomalous within the decadal distribution (Figure 14A, Table 6, see Figure 3B for the yearly distribution). The general comparison between the yearly number of avalanches and the maximum recorded snow cover depth showed a poor connection of avalanche numbers with snow cover (scattered distribution in Figure 14). This could be due to several factors, mainly including the number of snow gauges and their low elevation, which may underestimate the snow cover on high-elevation slopes affected by avalanches (Figures 3A,B). This is also confirmed by the high elevation stations where snow depth above 2,5 m are common and only in 2017 a large number of avalanches occurred even if the snow thickness was lower than previous years (Figure 3C).
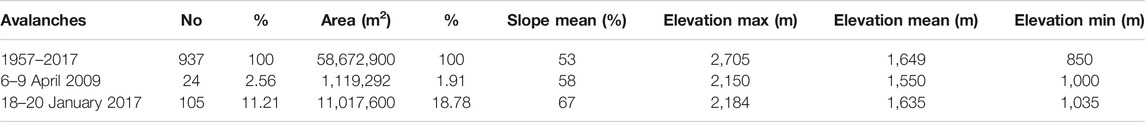
TABLE 6. Distribution and average morphometry of the avalanches on April 6–9, 2009, January 18–20, 2017, and from 1957 to 2016.
Moreover, on April 6–9, 2009, 24 events occurred in 4 days (2.56% of 938 avalanches recorded in 60 years). On 18–20 January 2017, 105 avalanches occurred in 3 days (11.19% of 938 recorded in 60 years), and the affected area was as high as ∼19% of the total area documented in the 60-years dataset (Table 6; Figure 6). In the April 2009 and definitely January 2017 events, the highly anomalous number of avalanches (red dots in Figure 14A) and related area (Table 6) are well evidenced, strongly indicating an anomalous trigger related to seismic shaking.
The 2017 Mt. Siella Avalanches
At a detailed scale for the specific and well-constrained case of the eastern Mt. Siella and Rigopiano avalanches, the combination and integration of the field geomorphological investigations, remote photogeological analysis, and 3D numerical modeling allowed us to contribute 1) to the definition of the geomorphological features of the area, 2) to the definition of pre-existing evidence of avalanches, and 3) to the assessment of the geomorphological, nivological, and seismical factors contributing to the avalanches’ triggering.
The eastern Mt. Siella slope is characterized by a combination of landforms: mainly nival and gravity-induced in the upper part and gravity-induced and water-related in the lower part (Figures 10, 12). The slope was affected before 2017 by snow (minor avalanches) and gravity-induced processes from Mt. Siella on the upper part of the slope and the Rigopiano valley; the lower part of the slope and valleys were only affected by gravity and water-related processes, as confirmed by the air photo interpretation and photogeological analysis (Figure 9). In January 2017, the entire valley was affected by the processes related to the Rigopiano avalanches, to which gravity-induced (upper part of the valley) and water-related processes (lower part of the valley) were largely overprinted. The comparison of photogeological and geomorphological features outlined the connection between the avalanche and the seismic shaking through a combined geomorphological cross-section (Figure 14B). The anomaly of the Rigopiano avalanche was also confirmed. The comparison of the evidence documented in images from 1945, 1989–1991, and 2017 (Figure 9) showed that the single Rigopiano valley 2017 avalanche was largely anomalous with respect to the previous events that occurred in the same valley. Specifically, the 2017 event area was 10.5 to 50 times bigger and 4.8 to 10.7 times longer than the events documented in the 1945 and 1989–1991 images (Table 7). Moreover, this avalanche is anomalous also within the general area frequency distribution of all the avalanches documented in the 1957–2017 dataset, corresponding to the 94th percentile of the 938 avalanches dataset (Figure 14C).
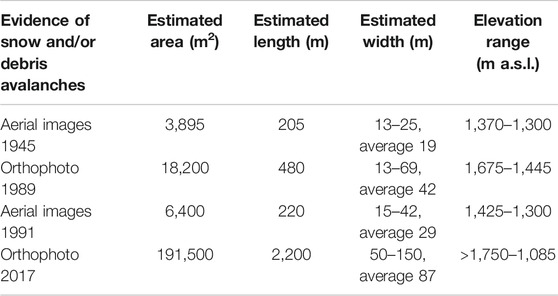
TABLE 7. Comparison of area, length, width, and elevation range of the January 18, 2017 Rigopiano avalanche with respect to the snow and/or debris avalanche documented on the 1945 and 1989–1991 images.
The avalanche modeling (Figure 14B) and the stability analysis showed that the detachment (eastern Mt. Siella slope and upper part of the Rigopiano valley) was triggered by seismic shaking combined with the considerable snow depth. The critical areas for displacement shown by the FLAC3D numerical modeling (Figure 13D) correspond to the detachment area (Zone A). This is also consistent with the distribution of the new surface evidence of co-seismic fractures and scarps documented in the geomorphological mapping. More specifically, the location of the co-seismic scarp observed in the field correspond to the lower part of the detachment area and the second critical area evidenced by the modeling (Zone B, with stability conditions worse than Zone A; Figure 14B). This suggests that the avalanche was triggered in the middle part of the slope (upper part of the Rigopiano valley), the snowpack was destabilized from middle part to the upper section of the slope of Mt. Siella and thus was able to release an exceptionally large avalanche.
Finally, the analysis of the Mt. Siella and Rigopiano avalanches outlined that the January 18, 2017 event was largely anomalous in terms of avalanche distribution and magnitude, even on a detailed scale, as shown for the regional distribution (Seismically Iinduced Ssnow Aavalanches in Ccentral Italy (Abruzzo Rregion)). This provides further confirmation that the 2017 event resulted from an anomalous combination of the heavy snowstorm (with high snow depth on the mid–high elevation slopes) and the seismic shaking induced by the January 18, 2017 earthquakes. This was confirmed even if the avalanches were delayed with respect to the closest main seismic shock.
Delay Between Earthquakes and Avalanche Trigger
The delay between earthquakes and avalanche trigger was explicitly investigated for the 2017 event, in which the time distribution of the avalanches was, at least in some cases, well documented. For the 2009 case, besides the avalanches being snow-debris mixed, their precise time distribution was poorly constrained. On January 18, 2017, the avalanche time distribution with respect to the main earthquakes showed that several avalanches occurred right after the first main (Mw > 5.0) seismic event (i.e., at 10:25 UTC+1); other events occurred in the timespan during the main shocks, whereas other events were triggered with a delay from a few minutes to tens or hundreds of minutes after the main seismic events (Figure 6B). For the latter, the Rigopiano avalanche is one of the temporally best-constrained avalanches on 18 January. Even if the snow slope was in poor stability condition, as suggested by the 3D numerical modeling and by the stability analysis, the avalanche was not triggered at the specific time of any of the main (Mw > 5.0) seismic events. It was delayed after the events, triggering 135 min after the last major seismic shock (Mw 5.0 at 14:33, distance ∼40 km) and 32 min after a moderate seismic shock (Mw 4.3 at 16:16, distance ∼44 km). The delays occurred in this event are largely consistent with those documented before in Western Himalaya, ranging from a few minutes to several hours (specifically, 7 min on January 16, 2000 and 36 min on February 12, 2000 in Drass area; 49 min on January 26, 1999 in Chadan; 82 min on January 21, 2000 in Jawala; 350 min on March 4, 1996 in Lagongama; several hours on February 1, 2000 and February 14, 1999 again in Drass area; Singh and Ganju, 2002 and Puzrin et al., 2019). However, in Western Himalaya cases, the magnitude of the seismic events was moderate (Mw 2.7–4.1, comparable or lower than in the 2017 event of Central Italy) and the distances were larger than in our case studies, so as for the cases with the largest distance (300–500 km) the direct earthquake-avalanche connection appears unlikely if compared with the analysis of Podolskiy et al. (2010a).
The occurrence and mechanism of the delayed seismically induced avalanche are consistent with what has already been documented in literature in the Himalayan area (Singh and Ganju, 2002) and for the Rigopiano avalanche (Puzrin et al., 2019). In particular, the new analytical model produced dynamics coherent with the documented case of Rigopiano. The proposed model, which is particularly complex and supported by a well-defined mathematical demonstration, calculates the mechanical development of the delayed release of earthquake-induced avalanches on the basis of the following points (Puzrin et al., 2019):
The earthquake induces an early shear fracture of length l0 within an existing weak layer.
Due to this fracture, the forces in the sliding slab assume a new distribution, and a Kelvin–Voigt constitutive model in the creeping mass and in the intact weak layer external of the shear fracture will activate.
This Kelvin–Voigt creep decays, producing a new defined growth-triggering length lg.
If l0 > lg, the same decaying creep will produce sufficient dislocation in the intact weak layer to activate its visco-plastic behavior. At time t0, the shear fracture increases with the rate of its development, which depends on the visco-plastic rate-hardening of the weak layer.
If the shear strength is rate-dependent (if not, the spread of the shear fracture would produce a catastrophic movement already at time t0), the rate-hardening experiences a gradually accelerating evolution of the shear fracture until a serious strain-rate is reached in the weak layer.
Once this critical strain-rate is reached, the shear strength in the weak layer depends on the visco-plastic rate-softening instead of the rate-hardening. At tf = t0 + Δtcr, the shear fracture reaches its critical extent lcr, which reveals the start of its catastrophic propagation mainly to avalanche release.
The results for Rigopiano are depicted in Figure 1C. A large range of realistic parameters were used for three potentially earthquake-triggered delayed avalanches. The parameter k that was introduced in Figure 1C represents the stress ratio (tanα/tan ϕ)–1, as derived by Gaume et al. (2013, 2018).
The model shows that delayed avalanches caused by earthquakes are rare but possible, and could lead to significant damage, especially on wide and milder slopes.
Conclusion
Seismicity has been one of the possible triggers of avalanches in mountain chains in recent and geodynamically active areas around the world (Figure 1). Seismically induced avalanches were documented through direct observations and statistical analysis for moderate-to-high seismicity (Mw > 4.5) and for distances as high as 350 km (Podolskiy et al., 2010a) with simultaneous or delayed triggers (Singh and Ganju, 2002; Puzrin et al., 2019).
In this study, we compared the regional seismically induced avalanche distribution in central Italy (April 2009 and January 2018 events) with the known global distribution (Figure 15A, Podolskiy et al., 2010a). We combined regional investigation with a detailed investigation of specific well-constrained avalanches (the eastern Mt. Siella and Rigopiano events, occurred on January 18, 2017), which were consistent with a delayed seismically induced avalanche. This combination contributed to a more general assessment of the seismically induced avalanches in the Apennines area and the Abruzzo region, providing new examples of seismically induced avalanches at both the regional and detailed scales, largely consistent with the world distribution.
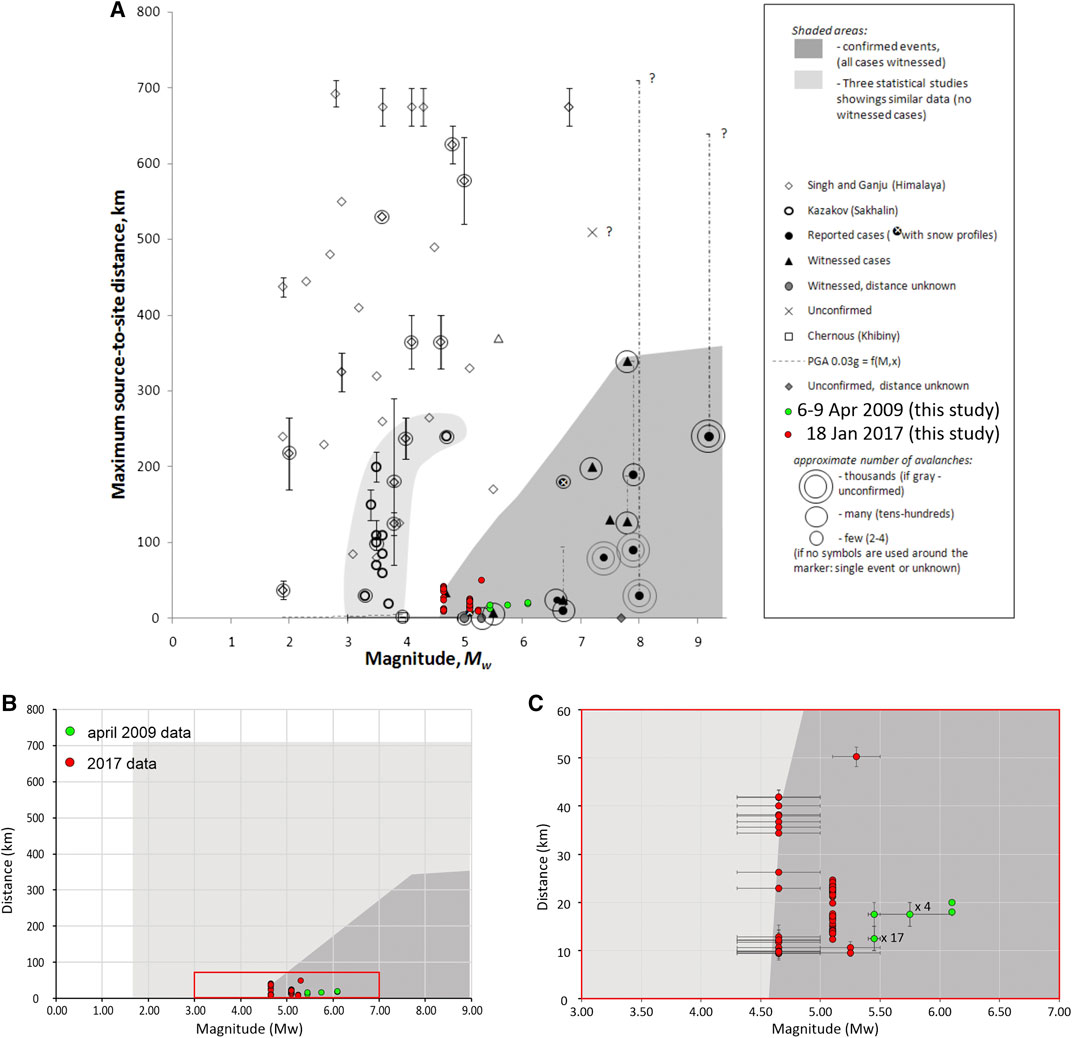
FIGURE 15. (A) Magnitude vs. maximum source to site distance; statistical distribution of the seismically induced snow-avalanches modified from Podolskiy (2010). (B) Magnitude vs. avalanches distance to the source of the avalanches on April 6–9, 2009 (green dots) and on January 18, 2017 (red dots). The gray shadows are the diagrams derived from Podolskiy (2010) (dark gray, the certain documented events; light gray, events derived from statistical distribution, see A). The red box indicates the detail of the diagram in C. (C) Detail of the diagram magnitude vs. avalanches' distance to the source (red box from B).
The regional and historical analysis showed that two main events of seismically induced avalanches occurred on April 6–9, 2009 (western Gran Sasso and Assergi area) and on January 18, 2017 (in the entire Gran Sasso area). The 2009 and definitely the 2017 events were largely anomalous in terms of regional distribution, number of avalanches, area affected, number of avalanches vs. snow cover depth, and in terms of local cases (e.g., eastern Mt. Siella and Rigopiano avalanches). This confirmed that the meteorological and nivological conditions were unable to explain the avalanches occurred in 2009 and 2017. An anomalous additional seismic triggering factor (i.e., the 6–9 April and January 18, 2017 earthquakes) was combined with the nivological condition for inducing such anomalous events. This is confirmed by the distance vs. magnitude of the earthquake distribution of the avalanches on April 6–9, 2009 and January 18, 2017. It mostly falls within the area documented at the global scale (Figures 15B,C) (Podolskiy, 2010).
On a detailed scale, the photogeological analysis of the eastern Mt. Siella showed that the January 18, 2017 avalanches (and specifically the Rigopiano one) were extremely anomalous with respect to previous avalanches occurred in the same site. The geomorphological mapping confirmed the lack of previous evidence of such large phenomena and the occurrence of minor inactive alluvial fans entrenched within the remnants of an ancient fan landform. Specifically, in the detachment area, fractures and scarps of co-seismic origin were documented for the first time, which possibly contributed to trigger the avalanche, which was likely to be released from the middle part of the slope (upper part of the Rigopiano valley) to the upper part creating an anomalous large event. This again confirms the role of seismic shaking in the development of these specific avalanches, even if with a delayed trigger (135 or 32 min from the previous Mw 5.1 and 4.3 seismic events for the Rigopiano avalanche, respectively). The 3D modeling and stability analyses provided further support of how the seismic shaking was responsible for the instability, failure, and deformation of the snow in the upper part of the Mt. Siella slope and Rigopiano valley.
Finally, even if some avalanches are not directly triggered by major seismic events, the evidence and results of this study and the new models proposed in the literature (Puzrin et al., 2019), show that delayed avalanches caused by earthquakes are rare but possible, as observed for several cases in the Abruzzo area and with the Mt. Siella-Rigopiano case, and can produce large anomalous avalances.
Data Availability Statement
Data are available upon request depending on the type of data requested and on the use indicated in the request. Requests to access the datasets should be directed to TP, dHBpYWNlbnRpbmlAdW5pY2guaXQ=.
Author Contributions
Funding acquisition: NS and EM; Conceptualization and Methodology: NS and EM; Investigation and field work: MC, EM, TP, and NS; GIS mapping, Software and data processing: MC and TP; Supervisions: UC, NS and EM; Writing of the original draft: TP and MC; Writing of the final version of the text: UC, NS, EM, TP, and MC.
Funding
This work was supported by the Università degli Studi “G. d’Annunzio” Chieti Pescara funds (Enrico Miccadei, Nicola Sciarra and Tommaso Piacentini funds).
Conflicts of Interest
The authors declare that the research was conducted in the absence of any commercial or financial relationships that could be construed as a potential conflict of interest.
Acknowledgments
The authors are grateful to the two reviewers whose precious suggestions and comments greatly improved the papers. The authors wish to thank the Cartographic Office of the Abruzzo Region (web portal http://geoportale.regione.abruzzo.it/Cartanet) and the Open Geodata Portal (http://opendata.regione.abruzzo.it/), for providing the topographic data, Digital Terrain Models, erial photos, and orthophotos used for this work. We are also grateful to the Ministero dell'Ambiente e della Tutela del Territorio e del Mare (http://www.minambiente.it/) and the National Geoportal (http://www.pcn.minambiente.it/mattm/) and Italian Geographic Military Institute (https://www.igmi.org/, see references for specific authorization) for providing the orthophotos and erial photo images. The snow data were provided by ISPRA Hydrological Annals (www.isprambiente.gov.it/it/progetti/cartella-progetti-in-corso/acque-interne-e-marino-costiere-1/progetto-annali) and by the Functional Center and Hydrographic Office of the Abruzzo Region (Centro Funzionale e Ufficio Idrografico Regione Abruzzo).
Supplementary Materials
The Supplementary Material for this article can be found online at: https://www.frontiersin.org/articles/10.3389/feart.2020.599611/full#supplementary-material
References
Abe, O. (2004). Shear strength and angle of repose of snow layers including graupel. Ann. Glaciol. 38, 305–308. doi:10.3189/172756404781815149
Abruzzo, Region (2017). Cartographic portal of the Abruzzo region. Available at: http://geoportale.regione.abruzzo.it/Cartanet/ (Accessed February 1, 2017)
Barbolini, M., Pagliardi, M., Ferro, F., and Corradeghini, P. (2011). Avalanche hazard mapping over large undocumented areas. Nat. Hazards 56 (2), 451–464. doi:10.1007/s11069-009-9434-8
Bigi, S., Calamita, F., and Centamore, E. (1997). Caratteristiche geologico–strutturali dell’area abruzzese ad oriente del Gran Sasso. Studi Geol. Camerti 1995/2, 67–76. doi:10.15165/studgeocam-919
Bindi, D., Pacor, F., Luzi, L., Puglia, R., Massa, M., Ameri, G., et al. (2011). Ground motion prediction equations derived from the Italian strong motion database - Bull. Earthq. Eng. 9, 1899–1920. doi:10.1007/s10518-011-9313-z
Bocchiola, D., Galizzi, M., Bombelli, G. M., and Soncini, A. (2018). Mapping snow avalanches hazard in poorly monitored areas. The case of Rigopiano avalanche, Apennines of Italy, Nat. Hazards Earth Syst. Sci. Discuss. doi:10.5194/nhess-2018-358.
Boncio, P., Pizzi, A., Brozzetti, F., Pomposo, G., Lavecchia, G., Di Naccio, D., et al. (2010). Coseismic ground deformation of the 6 April 2009 L'Aquila earthquake (central Italy, Mw6.3). Geophys. Res. Lett. 37 (6), L06308. doi:10.1029/2010GL042807
Braun, T., Frigo, B., Chiaia, B., Bartelt, P., Famiani, D., and Wassermann, J. (2020). Seismic signature of the deadly snow avalanche of January 18, 2017, at Rigopiano (Italy). Sci. Rep 10, 18563. doi:10.1038/s41598-020-75368-z
Bulajić, B. Đ., Bajić, S., and Stojnić, N. (2018). The effects of geological surroundings on earthquake-induced snow avalanche prone areas in the Kopaonik region. Cold Reg. Sci. Technol. 149, 29–45. doi:10.1016/j.coldregions.2018.02.005
Calista, M., Menna, V., Mancinelli, V., Sciarra, N., and Miccadei, E. (2020). Rockfall and debris flow hazard assessment in the SW escarpment of Montagna del Morrone ridge (Abruzzo, Central Italy). Water 12 (4), 1206. doi:10.3390/w12041206
Calista, M., Miccadei, E., Piacentini, T., and Sciarra, N. (2019). Morphostructural, meteorological and seismic factors controlling landslides in weak rocks: the case studies of Castelnuovo and Ponzano (north east Abruzzo, Central Italy). Geosciences 9, 122. doi:10.3390/geosciences9030122.
Cappabianca, F., Barbolini, M., and Natale, L. (2008). Snow avalanche risk assessment and mapping: a new method based on a combination of statistical analysis, avalanche dynamics simulation and empirically-based vulne-rability relations integrated in a GIS platform. Cold Reg. Sci. Technol. 54 (3), 193–205. doi:10.1016/j.coldregions.2008.06.005
Carabella, C., Miccadei, E., Paglia, G., and Sciarra, N. (2019). Post-wildfire landslide hazard assessment: the case of the 2017 Montagna del Morrone fire (Central Apennines, Italy). Geosciences 9 (4), 175. doi:10.3390/geosciences9040175.
Chiambretti, I., Chiaia, B., Frigo, B., Marello, S., Maggioni, M., Fantucci, R., et al. (2018). “The 18th January 2017 Rigopiano avalanche disaster in Italy–analysisof the applied forensic field investigation techniques,” in Proceedings of the international snow science workshop, Innsbruck, Austria, 2018. 1208–1212.
Chiaraluce, L., Di Stefano, R., Tinti, E., Scognamiglio, L., Michele, M., Casarotti, E., et al. (2017). The 2016 central Italy seismic sequence: a first look at the mainshocks, aftershocks, and source models. Seismol Res. Lett., 88, 757–771. doi:10.1785/0220160221
Chiaudani, A., Antenucci, F., and Di Lena, B. (2013). “Historical analysis of maximum intensity precipitation (1, 3, 6, 12 hours) in Abruzzo Region (Italy)–period 1951-2012,” in Proceedings of the Agrometeorologia per la sicurezza ambientale ed alimentare, Firenze, Italy, 4–6 june 2013.
Christen, M., Kowalski, J., and Bartelt, P. (2010). RAMMS: numerical simulation of dense snow avalanches in three-dimensional terrain. Cold Reg. Sci. Technol. 63 (1-2), 1–14. doi:10.1016/j.coldregions.2010.04.005
CNES(2017). Bing Maps © CNES. Available at: https://www.bing.com/maps/. Accessed March 21, 2017.
D’Alessandro, L., De Pippo, T., Donadio, C., Mazzarella, A., and Miccadei, E. (2006). Fractal dimension in Italy: a geomorphological key to interpretation. Zeitschrift für geomorphologie N.F. 50, 479–499.
D’Alessandro, L., Miccadei, E., and Piacentini, T. (2003). Morphostructural elements of central-eastern Abruzzi: contributions to the study of the role of tectonics on the morphogenesis of the Apennine chain. Quat. Int. 101–102, 115–124. doi:10.1016/S1040-6182(02)00094-0
Di Lena, B., Antenucci, F., and Mariani, L. (2012). Space and time evolution of the Abruzzo precipitation. It. J. Agrometeo. 1, 5–20.
Di Lena, B., and Giuliano, D. (2017). Report meteorologico del mese di Gennaio e Febbraio 2017 nella Regione Abruzzo. Servizio Presidi Tecnici di Supporto al Settore Agricolo Ufficio Coordinamento Servizi vivaistici e Agrometeo Scerni (Ch). Available at: https://www.regione.abruzzo.it/system/files/agricoltura/agrometereologia/Report_meteorologico_Febbraio_2017.pdf.
Frigo, B., Chiaia, B., Chiambretti, I., Bartelt, P., Maggioni, M., and Freppaz, M. (2018). “The January 18th 2017 Rigopiano disaster in Italy–analysis of the avalanche dynamics,” in Proceedings of the international snow science workshop, Innsbruck, Austria, October 7–12, 2018. pp. 6–10.
Gaume, J., Chambon, G., Eckert, N., and Naaim, M. (2013). Influence of weak-layer heterogeneity on snow slab avalanche release: application to the evaluation of avalanche release depths. J. Glaciol. 59, 423–437. doi:10.3189/2013JoG12J161
Gaume, J., Chambon, G., van Herwijnen, A., and Schweizer, J. (2018). Stress concentrations in weak snowpack layers and conditions for slab avalanche release. Geophys. Res. Lett., 45, 8363–8369. doi:10.1029/2018GL078900
Giardini, D., Gruenthal, G., Shedlock, K., and Zhang, P. (2003). “The GSHAP global seismic hazard map,” in International handbook of earthquake and engineering seismology, Part B. Editors W. H. K. Lee, H. Kanamori,P. C. Jennings, and C. Kisslinger. (London: Academic Press), 1233–1239.
Global seismic hazard map2011). Available at: http://gmo.gfz-potsdam.de. Accessed June 1, 2019.
Höller, P. (2017). Avalanche accidents and fatalities in Austria since 1946/47 with special regard to tourist avalanches in the period 1981/82 to 2015/16. Cold Reg. Sci. Technol. 144, 89–95. doi:10.5194/nhess-18-571-2018
Hackman, R. J. (1968). “Interpretation of Alaskan post-earthquake photographs,” in The great Alaska earthquake of 1964 (hydrology volume, part A). (Washington: National Academy of Sciences 1603), 40–46.
Heierli, J., Gumbsch, P., and Zaiser, M. (2008). Anticrack nucleation as triggering mechanism for snow slab avalanches. Science 11, 240–243. doi:10.1126/science.1153948
IGMI (1945). Air photo flight IGM 1945. Geographic Military Institute of Italy (aut.Prot.789-20). Available at: www.igmi.org.
IGMI (1991). Air photo flight IGM 1991. Geographic Military Institute of Italy (aut.Prot.789-20). Available at: www.igmi.org.
INGV (2017). Shake maps. Available at: http://shakemap.rm.ingv.it/shake/archive/2017.html. Accessed September 11, 2018.
ISPRA (2018). Hydrological Annals. Available at: http://www.isprambiente.gov.it/it/progetti/cartella-progetti-in-corso/acque-interne-e-marino-costiere-1/progetto-annali. Accessed March 26, 2018.
Itasca (2019). Fast Lagrangian analysis of continua in 3-dimension (FLAC3D V 7.0). Minnesota: Itasca Consulting Group.
Ito, Y., Naaim-Bouvet, F., Nishimura, K., Bellot, H., Thibert, E., Ravant, X., et al. (2016). Measurement of snow particle size and velocity in avalanche powder clouds, J. Glaciol. 63, 249–257. doi:10.1017/jog.2016.130
Keller, S., Issler, D., Gauer, P., and Schaer, M. (2019). Inferences on mixed snow avalanches from field observations. Geosciences 10, 2. doi:10.3390/geosciences10010002
Kotlyakov, V. M. (Editor). (1997). Atlas snezhno-ledovykh resursa mira [World atlas of snow and ice resources]. Moscow, Russian Academy of Sciences. Institute of Geography. Vols. 2 [In English and Russian].
Kumar, S., Srivastava, P. K., and Bhatiya, S. (2019). Geospatial probabilistic modelling for release area mapping of snow avalanches. Cold Reg. Sci. Technol. 165, 102813. doi:10.1016/j.coldregions.2019.102813
Luzi, L., Pacor, F., and Puglia, R. (2017). Italian accelerometric archive v 2.3. Istituto Nazionale di Geofisica e Vulcanologia, Dipartimento della Protezione Civile Nazionale. doi:10.13127/ITACA.2.3
MATTM (2017). National geoportal. Ministero dell’Ambiente e della Tutela del Territorio e del Mare. Available at: http://www.pcn.minambiente.it/mattm/. Accessed February 1, 2017.
Meteomont (2017). Servizio nazionale di previsione neve e valanghe. Available at: http://www.meteomont.gov.it/infoMeteo/. Accessed March 21, 2017.
Miccadei, E., Piacentini, T., and Buccolini, M. (2017). Long-term geomorphological evolution in the Abruzzo area (Central Apennines, Italy): twenty years of research. Geol. Carpathica 68 (1), 19–28. doi:10.1515/geoca-2017-0002
Miccadei, E., Piacentini, T., Sciarra, N., and Di Michele, R. (2013). “Seismically induced landslides in Abruzzo (Central Italy): morphostructural control,” in Editor C. Margottini, et al. Landslide science and practice. Springer-Verlag Berlin Heidelber, Vol. 5, 315–320.
NGI (2018). Teknisk notat. Field survey of the 2017 Rigopiano avalanche. Norges Geotekniske Institut.
Pérez-Guillén, C., Tapia, M., Furdada, G., Suriñach, E., McElwaine, J. N., Steinkogler, W., et al. (2014). Evaluation of a snow avalanche possibly triggered by a local earthquake at Vallee de la Sionne,Switzerland. Cold Reg. Sci. Technol. 108, 149–162. doi:10.1007/s11069-016-2707-0
Pace, P., Domenica, A. D., and Calamita, F. (2014). Summit low‐angle faults in the Central Apennines of Italy: younger‐on‐older thrusts or rotated normal faults? Constraints for defining the tectonic style of thrust belts, Tectonics 33, 756–785. doi:10.1002/2013TC003385
Parshad, R., Kumar, P., Snehmani, , and Srivastva, P. K. (2019). Seismically induced snow avalanches at nubra–shyok region of western Himalaya, India. Nat. Hazards 99 (2), 843–855.
Peel, M. C., Finlayson, B. L., and McMahon, T. A. (2007). Updated world map of the Köppen-Geiger climate classification. Hydrol. Earth Syst. Sci. 11, 1633–1644. doi:10.5194/hess-11-1633-2007
Piacentini, T., Galli, A., Marsala, V., and Miccadei, E. (2018). Analysis of soil erosion induced by heavy rainfall: a case study from the NE Abruzzo hills area in Central Italy. Water, 10, 1314. doi:10.3390/w10101314
Podolskiy, E. A. (2010). Experimental studies on earthquake-induced snow avalanches. [PhD thesis]. Japan: Nagoya University.
Podolskiy, E. A., Nishimura, K., Abe, O., and Chernous, P. A. (2010a). Earthquake-induced snow avalanches: I. Historical case studies. J. Glaciol. 56, 431–446. doi:10.3189/002214310792447815
Podolskiy, E. A., Nishimura, K., Abe, O., and Chernous, P. A. (2010b). Earthquake-induced snow avalanches: II. Experimental study. J. Glaciol. 56, 447–458. doi:10.3189/002214310792447833.
Puzrin, A. M., Faug, T., and Einav, I. (2019). The mechanism of delayed release in earthquake-induced avalanches. Proc. R. Soc. A 475, 20190092. doi:10.1098/rspa.2019.0092
Regione Abruzzo (2014). Carta storica delle valanghe. Available at: http://opendata.regione.abruzzo.it/content/carta-storica-della-valanghe. Accessed March 1, 2018.
Regione Abruzzo (2017). Opendata service. Available at: http://opendata.regione.abruzzo.it/. Accessed February 21, 2017.
Regione Abruzzo (2017). Calamità naturali. Available at: https://www.regione.abruzzo.it/content/calamit%C3%A0-naturali-riconosciute. Accessed August 10, 2018.
Reuter, B., and Schweizer, J. (2018). Describing snow instability by failure initiation, crack propagation, and slab tensile support. Geophys. Res. Lett. 45 (14), 7019–7027. doi:10.1029/2018GL078069
Romeo, V., Cagnati, A., and Valt, M. (2018). “Destructive Avalanches in the mediterranea region,” in Proceedings of the international snow science workshop, Innsbruck, Austria, October 7–12, 2018.
Rovida, A., Locati, M., Camassi, R., Lolli, B., and Gasperini, P. (2020). The Italian earthquake catalogue CPTI15. Bull. Earthq. Eng. 18, 2953–2984. doi:10.1007/s10518-020-00818-y
Rovida, A., Locati, M., Camassi, R., Lolli, B., and Gasperini, P. (2019). Catalogo Parametrico dei Terremoti Italiani (CPTI15), versione 2.0. Istituto Nazionale di Geofisica e Vulcanologia (INGV).
Schweizer, J., Jamieson, J. B., and Schneebeli, M. (2003). Snow avalanche formation. Rev. Geophys. 41 (4), 2–1–2–25.
Schweizer, J. (2017). On recent advances in avalanche research. Cold Reg. Sci. Technol. 144, 1–5. doi:10.1016/j.coldregions.2017.10.014
Schweizer, J., Reuter, B., van Herwijnen, A., and Gaume, J. (2016). “Avalanche release 101,” in Proceedings ISSW 2016. International snow science workshop, Breckenridge: CO, USA, October 3–7, 2016. E. Greene (Editor), 1–11.
Singh, A., and Ganju, A. (2002). Earthquakes and avalanches in western Himalaya,” in Proceedings of the 12th symposium on earthquake engineering, Roorkee, India, December 16–18, 2002. D. K. Paul, A. Kumar,and M. L. Sharma (Editors). Roorkee: Indian Institute of Technology.
Solari, L., Raspini, F., Del Soldato, M., Bianchini, S., Ciampalini, A., Ferrigno, F., et al. (2018). Satellite radar data for back-analysing a landslide event: the Ponzano (Central Italy) case study. Landslide 15, 773–782. doi:10.1007/s10346-018-0952-x
Stucchi, M., Meletti, C., Montaldo, V., Akinci, A., Faccioli, E., Gasperini, P., et al. (2004). Pericolosità sismica di riferimento per il territorio nazionale MPS04 [Data set]. Istituto Nazionale di Geofisica e Vulcanologia. Available at: . Accessed February 5, 2018].
Techel, F., and Schweizer, J. (2017). On using local avalanche danger level estimates for regional forecast verification. Cold Reg. Sci. Technol., 144, 52–62. doi:10.1016/j.coldregions.2017.07.012
van Herwijnen, A., and Heierli, J. (2009). Measurement of crack-face friction in collapsed weak snow layers. Geophys. Res. Lett., 36 (23), L23502. doi:10.1029/2009GL040389
Vezzani, L., Festa, A., and Ghisetti, F. C. (2010). Geology and tectonic evolution of the central-southern Apennines, Italy. Special Paper. Geol. Soc. Am. 469, 1–58. doi:10.1111/ter.12000
Vriend, N. M., McElwaine, J. N., Sovilla, B., Keylock, C. J., Ash, M., and Brennan, P. V. (2013). High-resolution radar measurements of snow avalanches. Geophys. Res. Lett. 40 (4), 727–731. doi:10.1002/grl.50134
Wang, C., Marui, H., and Watanabe, N. (2015). “Comparisons and numerical simulations of two debris-flow events induced by the 2011 northern nagano Prefecture earthquake and by the 2008 iwate-miyagi nairiku earth-quake,” in G. Lollino, et al. (Editors) Engineering geology for society and territory, Vol. 2. Cham: Springer.
Keywords: snow avalanches, snowstorms, earthquakes, delayed avalanches, Rigopiano, Gran Sasso, Abruzzo (central Italy)
Citation: Piacentini T, Calista M, Crescenti U, Miccadei E and Sciarra N (2020) Seismically Induced Snow Avalanches: The Central Italy Case. Front. Earth Sci. 8:599611. doi: 10.3389/feart.2020.599611
Received: 27 August 2020; Accepted: 07 October 2020;
Published: 11 November 2020.
Edited by:
Adam Emmer, University of Graz, AustriaReviewed by:
Jan Blahůt, Institute of Rock Structure and Mechanics (ASCR), CzechiaDavid R. Butler, Texas State University, United States
Copyright © 2020 Piacentini, Calista, Crescenti, Miccadei and Sciarra. This is an open-access article distributed under the terms of the Creative Commons Attribution License (CC BY). The use, distribution or reproduction in other forums is permitted, provided the original author(s) and the copyright owner(s) are credited and that the original publication in this journal is cited, in accordance with accepted academic practice. No use, distribution or reproduction is permitted which does not comply with these terms.
*Correspondence: Tommaso Piacentini, dG9tbWFzby5waWFjZW50aW5pQHVuaWNoLml0