 G. Djoumna
 S. H. Mernild2,3,4,5
- 1New York University Abu Dhabi, Abu Dhabi, United Arab Emirates
- 2University of Southern Denmark, The Vice-Chancellor’s Office, Odense, Denmark
- 3Nansen Environmental and Remote Sensing Center, Bergen, Norway
- 4Geophysical Institute, University of Bergen, Bergen, Norway
- 5Direction of Antarctic and Sub-Antarctic Programs, Universidad de Magallanes, Punta Arenas, Chile
- 6Courant Institute of Mathematical Science, New York University, New York, NY, United States
The surface radiation budget is an essential component of the total energy exchange between the atmosphere and the Earth’s surface. Measurements of radiative fluxes near/on ice surfaces are sparse in the polar regions, including on the Greenland Ice Sheet (GrIS), and the effects of cloud on radiative fluxes are still poorly studied. In this work, we assess the impacts of cloud on radiative fluxes using two metrics: the longwave-equivalent cloudiness, derived from long-wave radiation measurements, and the cloud transmittance factor, obtained from short-wave radiation data. The metrics are applied to radiation data from two automatic weather stations located over the bare ground near the ice front of Helheim (HG, 66.3290°N, 38.1460°W) and Jakobshavn Isbræ(JI, 69.2220°N, 49.8150°W) on the GrIS. Comparisons of meteorological parameters, surface radiation fluxes, and cloud metrics show significant differences between the two sites. The cloud transmittance factor is higher at HG than at JI, and the incoming short-wave radiation in the summer at HG is about 50.0 W m−2 larger than at JI. Cloud metrics derived at the two sites reveal partly cloudy conditions were frequent (42 and 65% of the period at HG and JI) with a high dependency on the wind direction. The total cloud radiative effect (CREnet) generally increases during melt season at the two stations due to long-wave CRE enhancement by cloud fraction. CREnet decreases from May to June and increases afterward, due to the strengthened short-wave CRE. The annually averaged CREnet were 3.0 ± 7.4 W m−2 and 1.9±15.1 W m−2 at JI and HG. CREnet estimated from AWS indicates that clouds cool the JI and HG during melt season at different rates.
1 Introduction
Changes in the surface radiation budget partially drive the amplified warming observed in the Arctic over the last 2 decades and the recent decrease in sea ice (Francis and Hunter, 2007; Screen and Simmonds, 2010; Pithan and Mauritsen, 2014; Overland et al., 2017). The Greenland Ice Sheet (GrIS) is particularly sensitive to the effects of warming in the Arctic. The mass loss from the GrIS now accounts for one-quarter of the observed global sea-level rise (Church et al., 2011; Hanna et al., 2013; van den Broeke et al., 2017; The IMBIE team, 2019). This mass loss is attributed to two processes: a decrease in the surface mass balance caused by a persistent increase in surface melt along the southeast and west coast of Greenland (van den Broeke et al., 2009; The IMBIE team, 2019); and the thinning and retreat of marine-terminating glaciers in the southeast, west, and northwest Greenland which is driven by the change in oceanic temperature (Krabill et al., 2004; Rignot and Kanagaratnam, 2006; Straneo and Heimbach, 2013). In a recent study, Hofer et al. (2017) suggested that the abrupt reduction in the GrIS’s surface mass balance since 1995 coincided with a decreasing summer cloud cover trend’s enhancing the melt-albedo feedback. It has also been proposed that cloud cover generates positive feedback on melt rates by regulating long-wave fluxes (Van Tricht et al., 2015). Helheim Glacier (HG) and Jakobshavn Isbræ(JI) are among the largest outlet glaciers in Greenland (Howat et al., 2011). From 2000 through 2010, the JI lost an equivalent of 11 times the average annual surface mass balance of the GrIS (Howat et al., 2011). Between 2000 and 2012, the HG accounted for
The cloud effects on the incoming short- and long-wave radiation can be assessed using high-quality surface radiation measurements by automatic weather stations (AWS). Over the last 2 decades, many metrics have been developed to quantify the cloud effects on surface radiative fluxes. The atmospheric transmissivity (Hock and Holmgren, 2005), the cloud transmittance factor (Greuell and Knap, 1997), the effective cloud fraction (Mölg et al., 2009b), and the cloud optical depth (Fitzpatrick et al., 2004) were used to assess the effects of cloud on the short-wave radiation. The cloud-free index (Dürr and Philipona, 2004), the longwave-equivalent cloudiness (van den Broeke et al., 2004; Kuipers Munneke et al., 2011), and the cloud factor (Sicart et al., 2006) are commonly used to estimate the cloud effects on the incoming long-wave. Over the GrIS, the temporal and spatial coverage of surface radiation measurements and cloud properties remain sparse. Some networks of observations exist, including the Greenland Climate Network (GC-Net) of AWS located on the ice sheet (Steffen and Box, 2001); the Danish Meteorological Institute network of AWS is positioned in the surroundings of the ice sheet (Cappelen et al., 2001). The Institute for Marine and Atmospheric Research of Utrecht University maintained a K-transect of AWS across the ablation zone in the southwest Greenland (van den Broeke et al., 2008); and the network of about twenty AWS from the Program for Monitoring of the Greenland Ice Sheet (PROMICE (Fausto and van As, 2019)) of the Geological Survey of Denmark and Greenland (GEUS), the Integrated Characterization of Energy, Clouds, Atmospheric state, and Precipitation at Summit project (Shupe et al., 2013). Andersen et al. (2010) deployed an AWS on the HG during summertime in 2007 and 2008. Their study focused on examining the effect of the glacier melt variability on glacier dynamics, without further addressing clouds’ impact on the glacier surface melting.
In this work, a unique set of near-surface measurements is used to assess ways the atmosphere influences the surface radiation budget over HG and JI. The longwave-equivalent cloudiness (van den Broeke et al., 2004), which can be obtained from the apparent emissivity and measurements of the near-surface temperature, was employed. The cloud transmittance factor (Greuell and Knap, 1997), which depends on the observed short-wave radiation and theoretical clear-sky radiation, was also used. The two metrics were combined because the cloud transmittance factor is limited to daytime periods, while the longwave-equivalent cloudiness provides knowledge about year-round radiative cloud properties. They have been used to examine cloud optical properties over glaciers in Greenland (van den Broeke et al., 2008; Kuipers Munneke et al., 2011), Southern Norway (Giesen et al., 2009), the Southern Alps of New Zealand (Conway et al., 2015), and in the Western Qilian Mountains, China (Chen et al., 2018). Other methods exist, but their accuracy still debatable (Kuipers Munneke et al., 2011). To our knowledge, this study provides the first multi-year measurements of near-surface meteorological parameters and radiative fluxes at HG and JI. It complements earlier works on the general description of meteorological conditions and radiative fluxes over the GrIS (Steffen and Box, 2001; Hanna and Valdes, 2001; van den Broeke et al., 2008; Cox et al., 2014). This work is organized as follows: we present the AWS data and methodology in section 2. The near-surface meteorological and radiative features and the impact of cloud on the surface radiation budget at the two sites are presented in Section 3. Finally, we discuss our findings and conclude in Sections 4 and 5.
2 Data and Methods
2.1 Physical Setting
HG (66.38°N, 38.8°W; Figure 1C) is one of the largest outlet glaciers in Greenland. Its catchment represents about 4% (48,000 km2) of the ice sheet’s total area (Straneo et al., 2016), and receives some of Greenland’s highest snowfall (>1 m yr−1 water equivalent, Burgess et al. (2010)). The inland perimeter of the catchment is located about 200 km from the coast at an elevation of roughly 2500 m. Southeast Greenland is characterized by downslope wind events that can reach hurricane intensity (Rasmussen, 1989; Mernild et al., 2008; Oltmanns et al., 2014). These wind events are pronounced in the valley of Ammassalik, located about 85 km south of the HG. The downslope winds are supported by a synoptic-scale cyclone that advects cold air from the ice sheet down the steep coastal topography (Oltmanns et al., 2014). Near-surface temperatures in this region are affected by the East Greenland Polar Sea Current, which has a surface temperature close to zero degrees throughout the year and brings along drift ice most of the time (Cappelen et al., 2001).
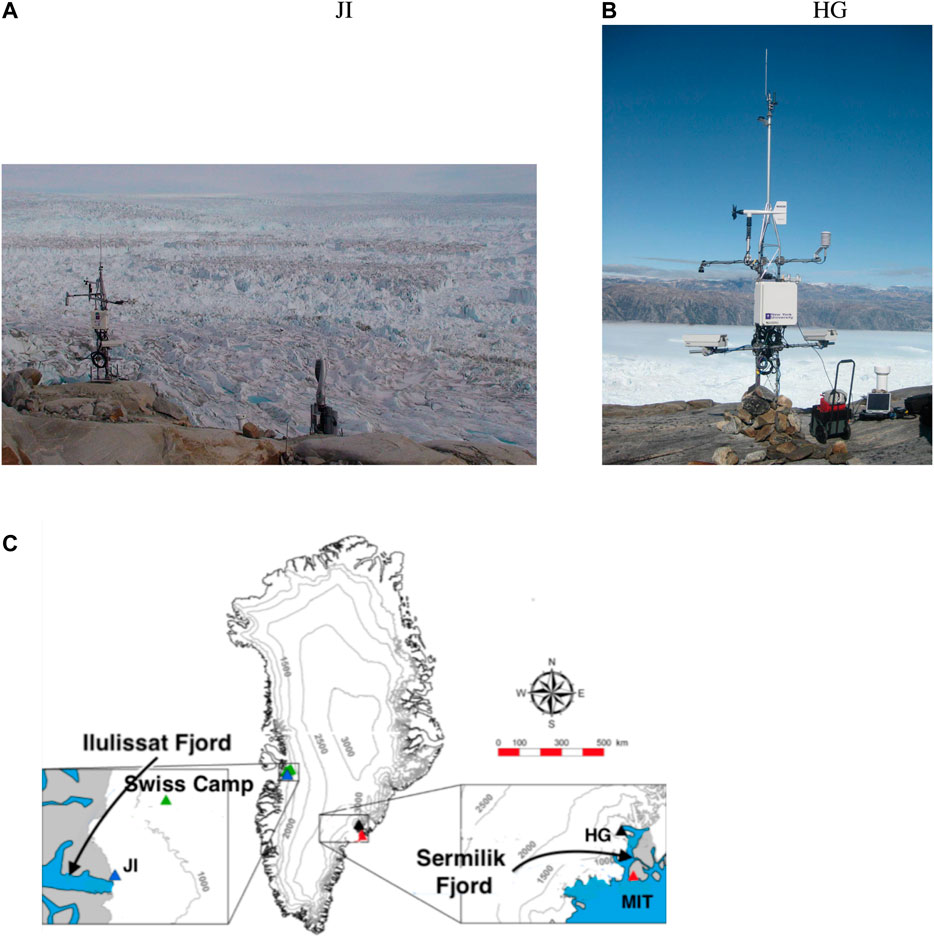
FIGURE 1. Photographs (A and B) of the AWS location at Jakobshavn Isbræ and Helheim Glacier (Photo: Denise Holland) (C) Location of the automatic weather stations used in this study. The blue and black triangles represent the geographic location of the New York University AWS. The green triangle denotes the position of the Swiss Camp station (maintained by the Greenland Climate Network (GC-NET)) in western Greenland. The red triangle is the MIT station (managed by the Program for Monitoring of the Greenland Ice Sheet). The locations of Sermilik Fjord and Illulisat Fjord are marked.
The JI (69.17°N, 49.83°W; Figure 1C), the largest Greenland’s glacier, flows west from the center of the GrIS to
2.2 The AWS Site Description and Instrumentation
An AWS (JI) was deployed in 2007 on the northeast of the Ilulissat Ice Fjord (69.2220°N, 49.8150°W) at a low altitude of 30 m a. s. l. [above sea level (Holland and Holland, 2016b)]. The AWS at HG was installed in 2009 on the south shore of the Helheim Ice Fjord (66.3290°N, 38.1460°W), at an altitude
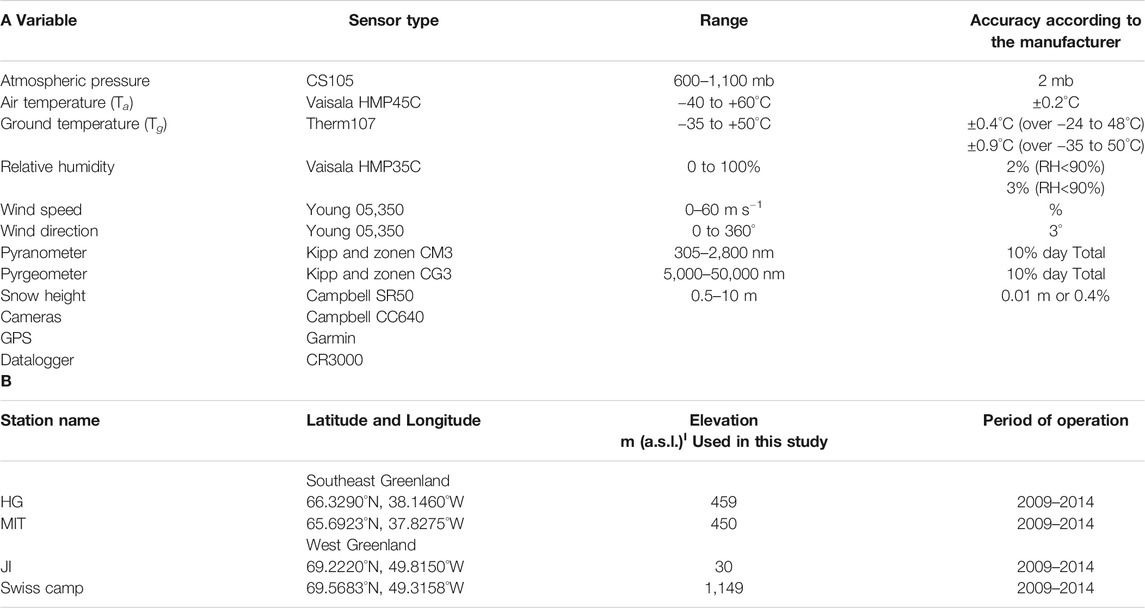
TABLE 1. (A) Automatic weather station (located near the ice front of Helheim and Jakobshavn Isbræ and Glaciers) sensor specifications (B) Characteristics (latitude, longitude, and elevation above sea level) of the AWS on the southeast and west Greenland used in this study.I a.s.l. means above sea level.
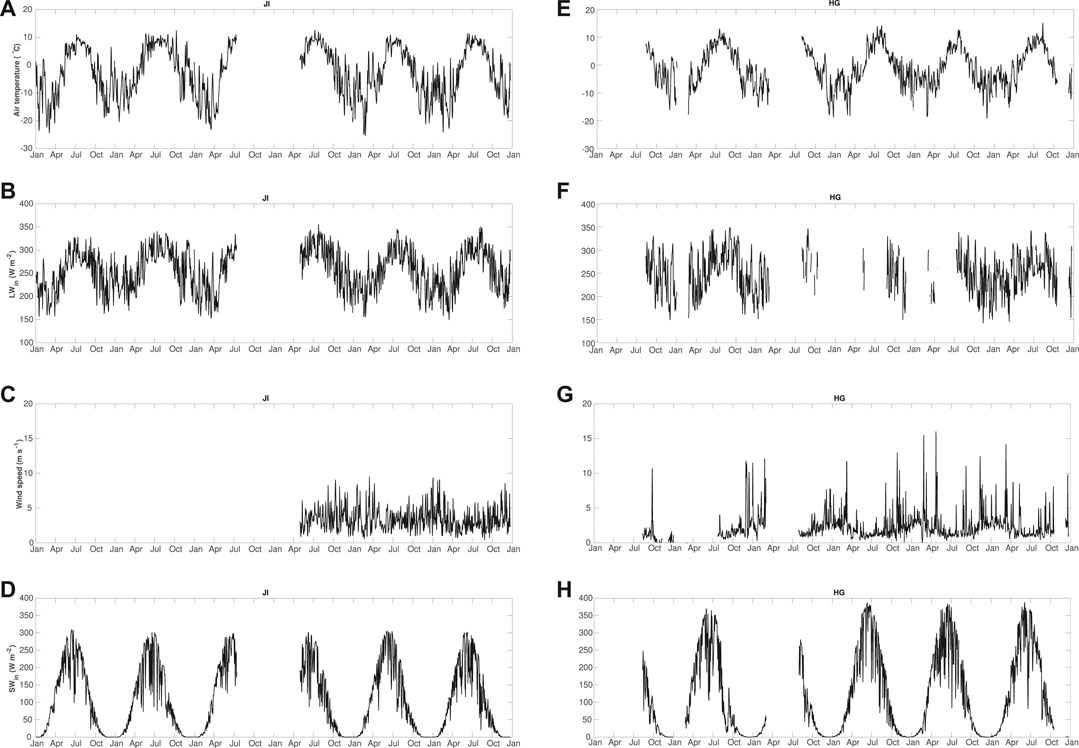
FIGURE 2. Daily mean values of meteorological parameters and radiative fluxes at Jakobshavn Isbræ (JI) and Helheim Glacier (HG) from 2009 to 2014: air temperature (A) and (E), incoming long-wave radiation (B) and (F), wind speed (C) and (G), and incoming short-wave radiation (D) and (H).
The large percentage missing wind data at JI implies that the analysis of wind data at the two stations was limited to 2012, 2013, and 2014. To fill the missing data for the air temperature, relative humidity, and surface radiation, we performed a linear interpolate over a 1-h interval and then employed spline interpolation to fill gaps less than a half-day. Finally, the daily average of radiation data was computed using only days with less than 12 h of missing data.
Meteorological data from other stations in the study area were used to put our data into perspective. In southeast Greenland, we employ data from MIT station (450 m a. s. l., operated on the mountain Glacier Mitivakkat Gletscher (Mernild et al., 2011)), maintained by GEUS, and located at
2.3 Quality Control of AWS Measurements at JI and HG
AWS radiation measurements in the polar region are usually affected by errors associated with the ice accretion, station tilt, rime formation, and low Sun angle (van den Broeke et al., 2004). These errors can lead to an underestimation of
The pyrgeometer was equipped with an internal temperature sensor that measured the radiometer temperature. This temperature was used to correct both LWout and LWin fluxes. The wintertime riming of the pyrometer sensor’s upward-facing sensor was checked using a standard method to identify points for which
The relative humidity with respect to liquid water (RHw) was corrected for the unrealistic records at a temperature below 0°C to values with respect to ice (RHi) using the method introduced by (Anderson, 1994) and referred to by others such as Makkonen and Laakso (2005). At first, the RHw values were multiplied by the ratio of the saturation pressures for water and ice. The resulting maximum (RHi,max) was still below
2.4 Clear-Sky Conditions
The clear-sky conditions were defined using incoming long-wave radiation data (Marty and Philipona, 2000). This approach has been widely used in the literature [e.g., (Ruckstuhl and Philipona, 2008; Kuipers Munneke et al., 2011; Juszak and Pellicciotti, 2013)], and it is closely related to sky emissivity, rather than the fraction of the sky covered by clouds. Therefore, it is not a cloud cover classification in the usual meteorological sense (Kuipers Munneke et al., 2011). A cloud fraction varying between 0.4 and 0.6 represents the partly cloudy sky. During overcast conditions, the cloud fraction was above 0.8, and periods of clear-sky conditions have a cloud fraction lower than 0.2.
2.5 Clear-Sky Short-Wave Radiation Model
The effect of clouds on SWin was assessed using a cloud transmittance factor (trc) (Greuell and Knap, 1997). The cloud transmittance factor is commonly used to separate the scattering and absorption of radiation by clouds from those of clear-sky (Greuell and Knap, 1997; van den Broeke et al., 2008; Mölg et al., 2009b; Kuipers Munneke et al., 2011; Pellicciotti et al., 2011; Conway et al., 2015; Chen et al., 2018). It is defined by
where SWin,cs denotes the clear-sky short-wave radiation. SWin,cs was calculated using Bird and Hulstrom (1981) method, further modified by Iqbal (1983). In this method, SWin is related to the transmission coefficients for Rayleigh scattering, absorption by water vapor, other molecular gases, and aerosols. Denoting by
where
where the
2.6 Clear-Sky Long-Wave Radiation Model and Longwave-Equivalent Cloudiness
The LWin depends on the temperature and emissivity throughout the atmospheric column, but as the atmosphere is relatively opaque in the infrared, it is strongly weighted to conditions near the surface. In clear-sky conditions, the change in the effective emissivity (
where
Measurements of the long-wave radiation by an AWS can be used to derive data for cloud cover (van den Broeke et al., 2004; Kuipers Munneke et al., 2011; Conway et al., 2015; Chen et al., 2018). The longwave-equivalent cloudiness (Nϵ) metric (van den Broeke et al., 2004) is used to assess the effect of clouds on LWin. Nϵ depends on the disparities in the emissivity of a clear-sky and a cloudy one (van den Broeke et al., 2004).
Figure 3 presents a scatter plot of air temperature against LWin, for hourly data at JI and HG in 2013 and 2014. At JI, about 5 to 7% of the
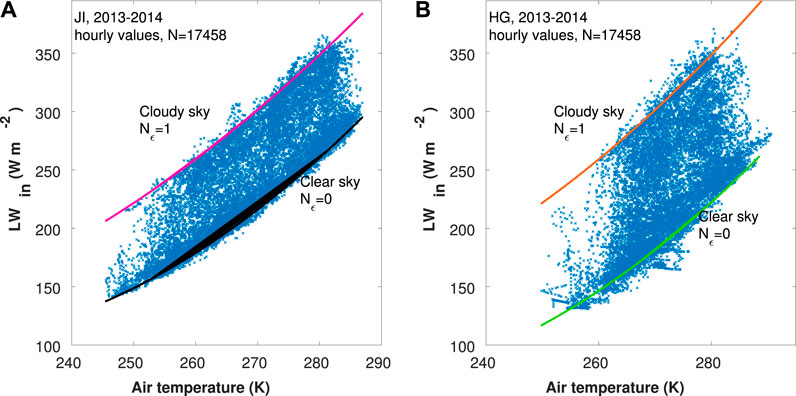
FIGURE 3. Scatter plot of the hourly values of air temperature against downwelling long-wave radiation at Jakobshavn Isbræ (JI) (A) and Helheim Glacier (HG) (B) for 2013–2014. The upper curve of the scatter plot
A set of cloud-free data was constructed from the AWS records at JI and HG following Conway et al. (2015) to validate the clear-sky radiation models. The cloud-free days were selected using a monotonic increase in
2.7 Cloud Effect on the Surface Energy Budget at the Two Stations
The cloud’s impact on the surface radiation fluxes was assessed using the instantaneous effect of clouds on the surface energy budget compared to clear skies (Intrieri et al., 2002; Cox et al., 2016b; Wang et al., 2018). The CRE is estimated as the difference between the radiation at the surface under all-sky conditions and clear skies, assuming unchanged meteorological conditions. We chose this approach instead of the cloud radiative forcing because our data were collected over the land adjacent to the glaciers and not over the glacier themselves. The outgoing (and thus also net) fluxes are not representative of the glaciers. Clear-sky conditions were determined as periods where daily mean Nϵ was less than 0.2. The “instantaneous CRE” assumptions are reasonable and practical for investigating clouds’ contributions to the surface radiation budget (Shupe and Intrieri, 2004; Cox et al., 2016b; Wang et al., 2018). We compute the CRE using the following formulas:
CRE’s positive values express that clouds’ presence increased radiative flux at the surface, and negative values mark a radiative energy loss. Positive and negative CRE lead to warming and cooling propensities, respectively (Dong et al., 2010).
3 Results
3.1 Near-Surface Meteorological and Radiative Features at JI and HG
The general near-surface meteorological conditions (air temperature, humidity, and atmospheric pressure) at JI and HG are presented in the Supplementary Material.
3.1.1 Wind Regimes
Over the GrIS, the wind regime is dominated generally by katabatic flow (Steffen and Box, 2001; Oltmanns et al., 2014). Winds are strongest in winter, and the ample surface radiation cooling results in stronger winds at the higher elevation (Steffen and Box, 2001; Van As, 2011). For the 2012–2014 period, the annual mean wind speed was 4.1 m s−1 at JI and 4.4 m s−1 at HG (Table 2). Winds with a daily mean speed higher than 10 m s−1 were observed only at HG. No strong wind (daily mean WS
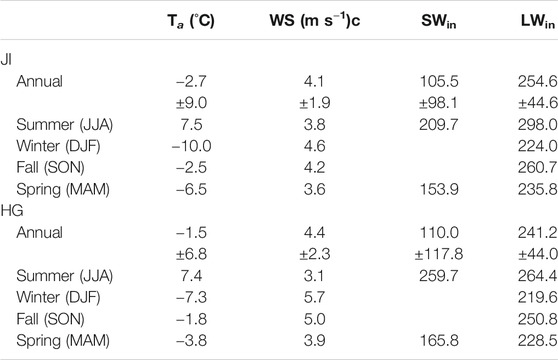
TABLE 2. Surface-based observations: Summary statistics of the air temperature (Ta), wind speed (WS), and radiative fluxes (downwelling short- and long-wave: SWin and LWin) at Jakobshavn Isbræ (JI) and Helheim Glacier (HG), from January 2009 to December 2014. c Because of the missing data at JI for the first two years of operation, the wind speed was averaged over three years (2012–2014). Radiative fluxes are in W m−2. December-January-February (DJF), March-April-May (MAM), Juin-Juillet-August (JJA), and September-October-November (SON).
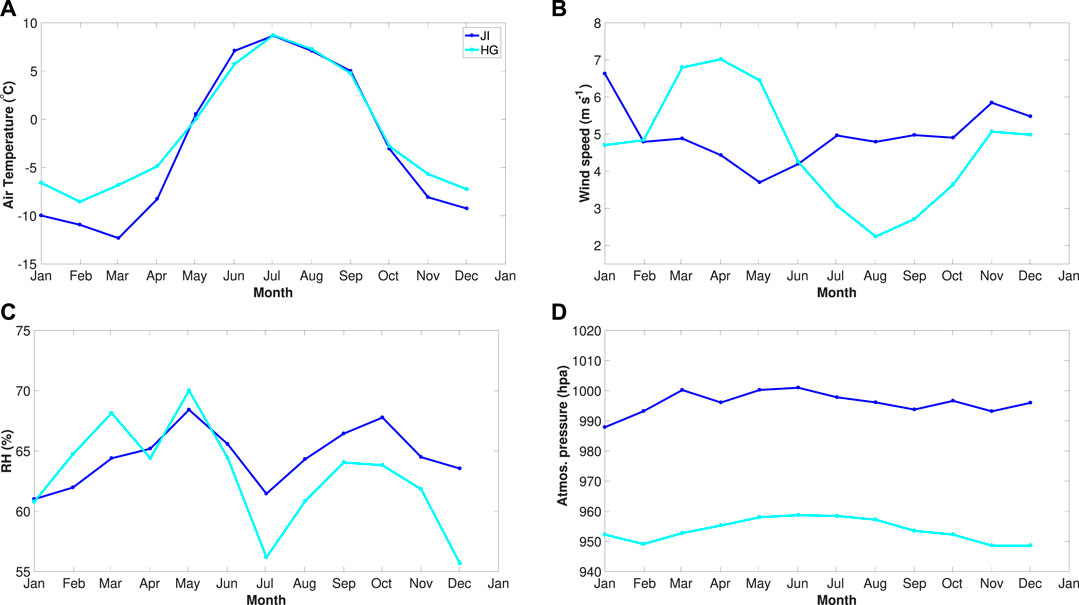
FIGURE 4. Monthly mean values for the air temperature (A), wind speed (B), relative humidity (C), and atmospheric pressure (D) for the five years of the study 2009 to 2014. Jakobshavn Isbræ (JI) in blue, Helheim Glacier (HG) in cyan.
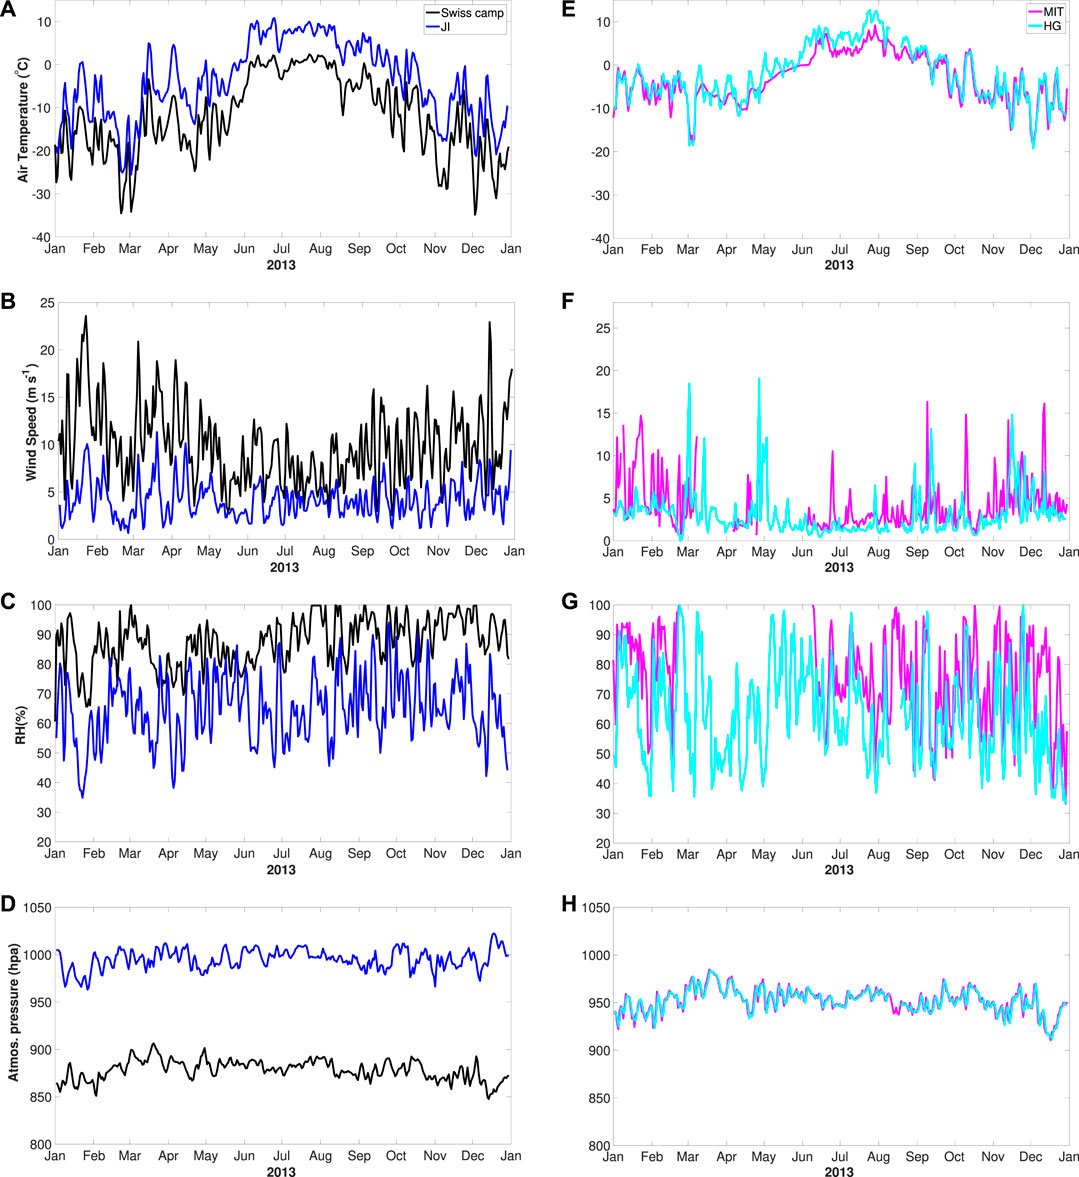
FIGURE 5. Daily mean near-surface observations at four stations in 2013: Jakobshavn Isbræ (JI, blue), Swiss Camp (black), Helheim Glacier (HG, cyan), and MIT (magenta) (A and E) air temperature (B and F) wind speed (C and G) relative humidity, and (D and H) atmospheric pressure.
From 2012 to 2013, the wind direction at JI varied between 50° and 150° with a favorable southeast direction. In 2014, the predominant wind direction ranged from 200° to 250° (Figure 6A). At HG, the dominant wind direction varied from 180° to 250° for five consecutive years (Figure 6C) and came from the glaciers. We conclude that for six straight years (2009–2014), the HG’s dominant wind direction was from the northeast to the southwest, and the wind was coming from the ice sheet. At JI, eastward winds dominated in 2012 and 2013, while in 2014, the dominant wind direction was south-westward. The predominated wind direction at JI was from the fjord to the ice sheet in 2012 and 2013, and a reserve situation occurred in 2014.
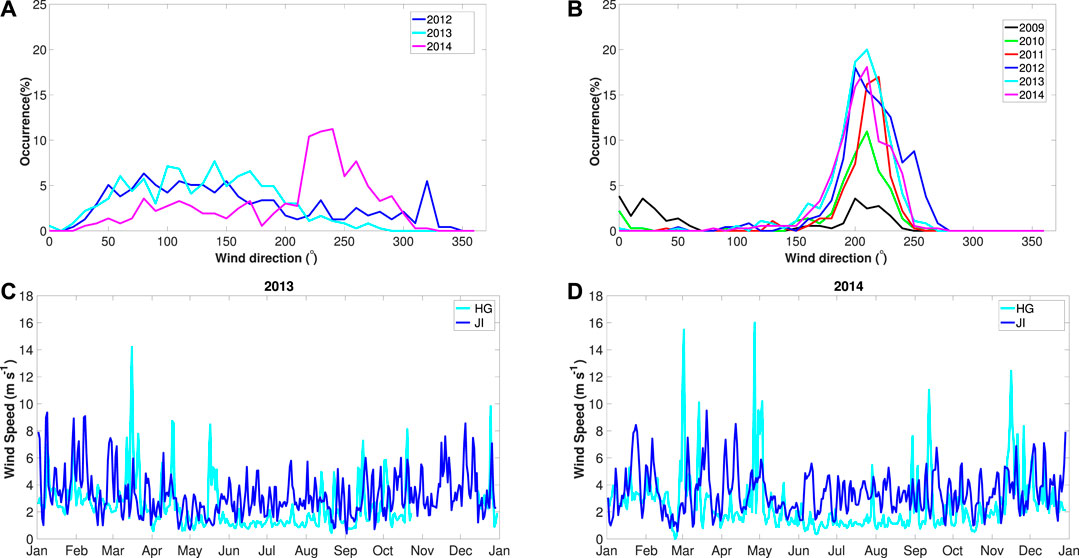
FIGURE 6. (A) and (C), daily wind direction distributions at Jakobshavn Isbræ (JI), and Helheim Glacier (HG) automatic weather stations. Panels (B) and (D) show the wind speed at JI and HG in 2013 and 2014.
3.1.2 Incoming Short- and Long-Wave Radiation
Figure 7A shows the hourly values of SWin for the year 2013 at JI and HG, respectively. Daily mean values of the incoming short-wave radiation for the study period are shown in Figures 2D,H. The annual mean
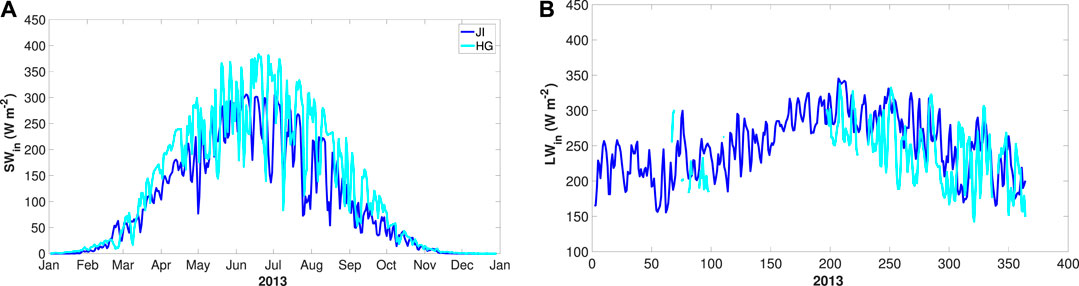
FIGURE 7. Same as in Figure 5, but for the incoming short- and long-wave radiation (A and B).
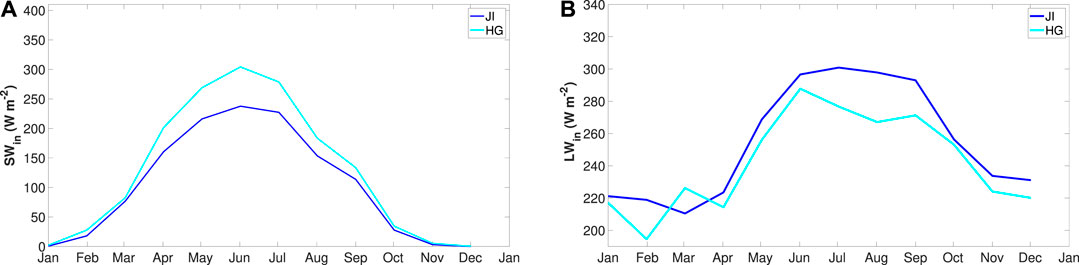
FIGURE 8. Same as in Figure 4, but for (A and B) the incoming short- and long-wave radiation.
3.2 Impact of Clouds on the Surface Radiation Budget From Observations
3.2.1 Longwave-Equivalent Cloudiness
Daily means and 30-days running means (red) of Nϵ at the two stations are shown in Figures 9A–D for 2013–2014. Noticeable changes can be seen in both daily and 30-days running means. A different cloud fraction was observed at the two sites. For example, during spring 2014, the fraction of the cloud at HG was about two times the value found at JI. Figure 9E compares the 30-days running mean of Nϵ at JI and HG for the 2013–2014 period. High values of Nϵ are seen in the spring and fall at the two stations during the 2013–2014 period. The average Nϵ over the 2013–2014 period (0.41 at JI and 0.47 at HG) was smaller than that observed over glacier surface in the Southern Alps of New Zealand (Conway et al., 2015) and was in the range of values obtained over glacier surfaces in Dronning Maud Land, East Antarctica (van den Broeke et al., 2006). We compare our results to studies of the Southern Hemisphere because there are no similar studies in the Northern Hemisphere to the authors’ knowledge. The mean values of LWin and LWin,cs (Section 3.2.1) over the study area suggested that during the 2013–2014 period, the increase in LWin due to clouds was up to 28.0 and 43.0 W m−2 at HG and JI (Table 3), respectively.
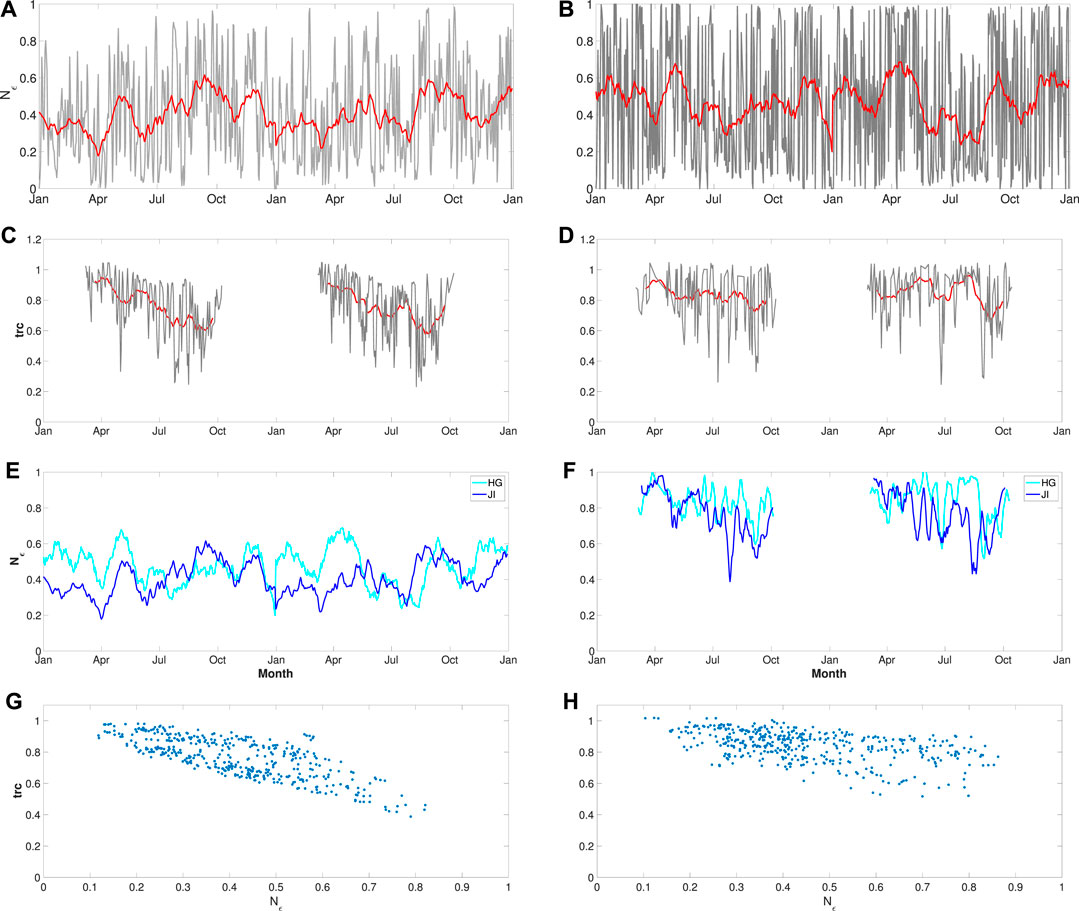
FIGURE 9. Daily values of the longwave-equivalent cloudiness (Nϵ) and the cloud transmittance factor (trc) at (A and C) Jakobshavn Isbræ (JI) and (B and D) Helheim Glacier (HG), for the 2013–2014 period. The thick red lines denote the 30-days running mean of each metric. Panels (E) and (F) present a comparison between the 30-days running mean Nϵ and
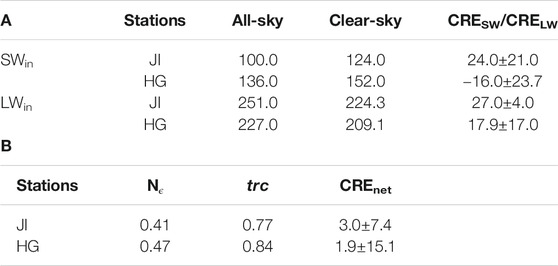
TABLE 3. Annual means of (A) downwelling radiation fluxes (in W m−2) and cloud radiative effect (CRE, in W m−2) for long-wave (CRELW), short-wave (CRELW), at Jakobshavn Isbræ(JI) and Helheim Glacier (HG) for the 2013–2014 period. Panel (B) denotes annual means cloud metrics (Nϵ,
The observed
3.2.2 Transmission of Short-Wave Radiation by Clouds
The cloud-free data set constructed in Section 3.2.1 was used to validate the clear-sky short-wave radiation. The modeled and observed short-wave radiation obtained from the cloud-free data show a good agreement. Correlation coefficients of 0.95 and 0.91 were obtained from hourly data for the 2013–2014 period at JI and HG. The RMSE between modeled and observed radiation was 12% (JI) and 17% (HG) of the mean (276.0 W m−2 at JI, and 387.0 W m−2 at HG) for the hourly resolution data.
Daily average values of
3.2.3 Variability in the Cloud Effects
In this section, we use values of Nϵ (Figures 9A.E) to analyze the seasonal variability in the cloud for the 2013–2014 period. The majority of overcast days were observed in winter (December-February) and early spring (March). A relatively large fraction of clear-sky conditions was also seen in July and October. On average, overcast conditions accounted for 24% and 9% of the 2013–2014 period at HG and JI, while partly cloudy conditions occurred 42% and 65% of the time at HG and JI, respectively.
The downwelling short-wave cloud radiative effect (CRESW) values decrease from May to June and increase afterward at the two stations (Figure 10). The annual means
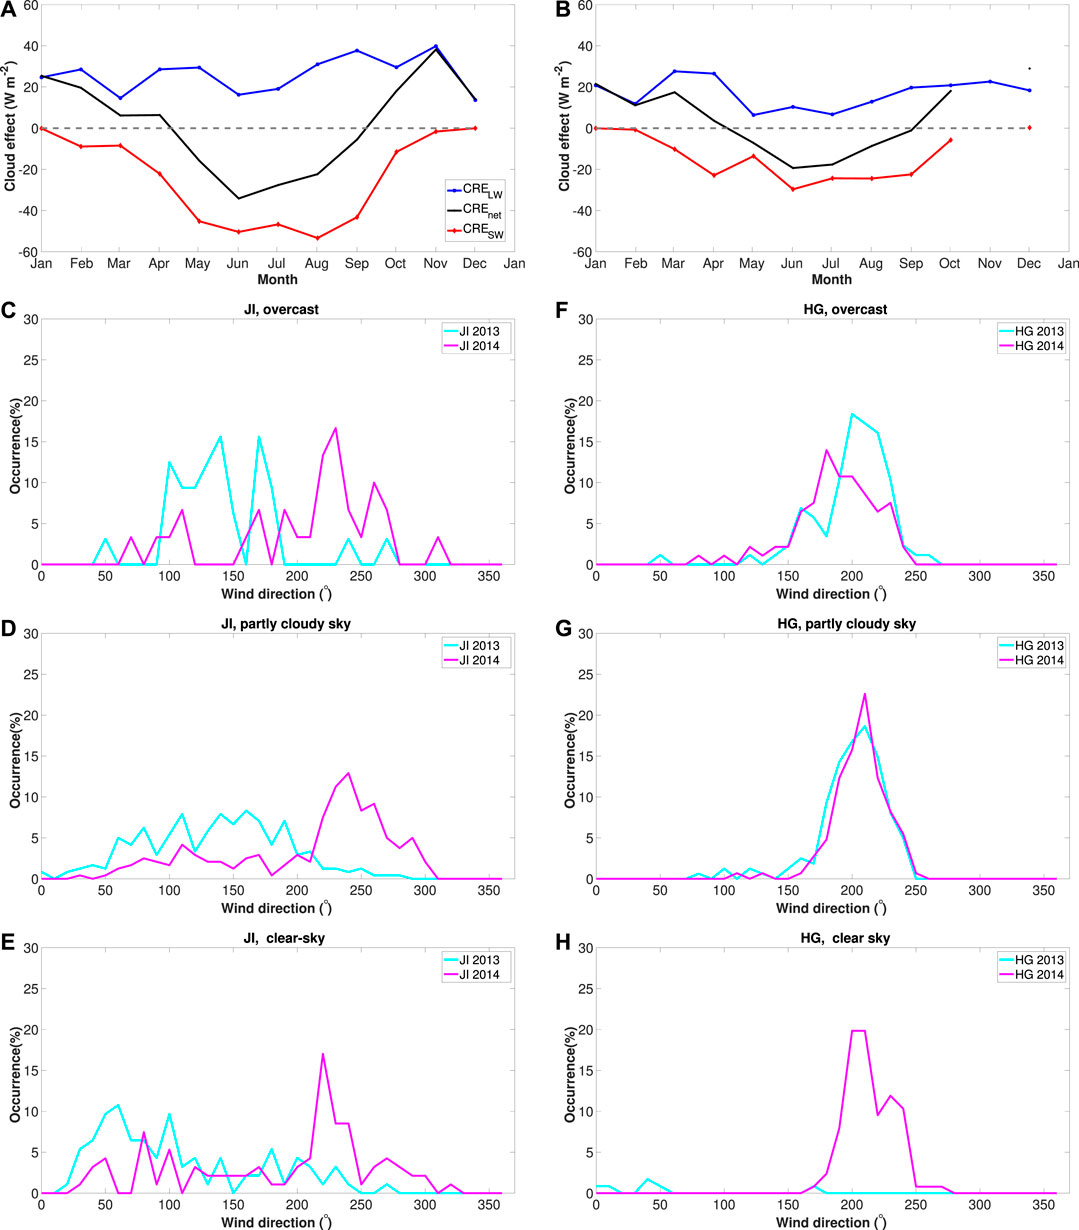
FIGURE 10. Monthly means cloud radiative effect (CRE) for the short-wave (CRESW, red line), long-wave (CRELW, blue line), and the total cloud effect (CREnet, black line) at (A) Jakobshavn Isbræ (JI) and (B) Helheim Glacier (HG). The gray dash line in panels (A) and (B) represents the 0 W m2. Variation of cloudiness with wind direction at JI and HG for the 2013–2014 period (JI in cyan, HG in magenta): overcast conditions (C and F), partly cloudy conditions (D and G), and clear-sky conditions (E and H).
The long-wave cloud radiative effect seasonal cycle decreases from May to June and increases from July to September. However, a minimum of 6.4 W m−2 was obtained at HG in June and 16.2 W m−2 at JI in June. The annual means
In contrast to the cloudiness distribution, the
4 Discussion
4.1 Meteorological Parameters
The average near-surface air temperature over the GrIS varies seasonally. The minimum temperature usually occurs in winter, with values between −40°C and −20°C. During the summertime, temperatures are often around −5°C Van As (2011). However, since 2008, the ice-sheet average air temperature above 0°C has only been observed for five days in July 2012 (11–13 and 28–29), during which the surface melting occurred over nearly the entire ice sheet (Nghiem et al., 2012; Hanna et al., 2014). The observed air temperature varied between −10 and −7.3°C in winter. The geographical location (on rock outcrops) of the AWS, among other factors, maintained this range of air temperature. During summertime, the mean observed air temperature at JI and HG was about 7.4°C. JI is located at a relatively low altitude (
Winds with speed larger than 10 m s−1 were observed only at HG during the winter and the spring. The interaction of wintertime synoptic storms with Greenland’s steep topography generates strong mesoscale tip jets and barrier winds along the Greenland’s southeastern coast (Moore and Renfrew, 2005; Orr et al., 2005; Harden et al., 2011). Winds with speed larger than 10 m s−1 observed at HG are consistent because winds are stronger at the higher-elevation over the GrIS (Steffen and Box, 2001; Van As, 2011). Katabatic drainage winds are a common feature of the GrIS. HG is located near sea-level, and it has been shown that multiple katabatic wind events occur in Sermilik fjord (Spall et al., 2017). As the cold air drains off the high mountains approaches the coast, the topographic gradient steepens, and the wind speed increases.
To improve AWS data quality, we evaluate measurements using physical limits and modify data to reduce biases induced by AWS problems such as the ice accretion, station tilt, riming of the pyrgeometer sensor’s upward-facing, and unrealistic records of
4.2 Cloud Impact on the Wind for the 2013–2014 Period
To discuss the cloud effects on the wind, we have analyzed the wind direction vs. the cloud types in Figures 10C–H. We mentioned in Section 3.1.1 that for six consecutive years (2009–2014), the wind at HG was coming from the ice sheet. At JI, the predominated wind direction at JI was from the fjord/ocean to the ice sheet in 2012 and 2013, and a reverse situation occurred in 2014. A strong relation between cloudiness and the wind direction was observed at JI and HG. Northerly winds were more frequent at HG and had a higher occurrence during partly cloudy conditions than in clear-sky conditions (Figures 10G,H). A persistent northerly wind at HG during each cloud type is consistent with the fact that downslope wind events are frequent in southeast Greenland (Rasmussen, 1989; Mernild et al., 2008; Oltmanns et al., 2014). Northerly winds were most common at JI in 2014 and had a higher occurrence in clear-sky conditions. Moreover, during clear-sky conditions, westerly winds were dominant at JI with a large percentage of appearance compared to overcast and partly cloudy conditions. In contrast, north-westerly winds were prevailing during overcast conditions. Both regional and local airflow also influences the wind direction at both sites. A synoptic-scale cyclone advects cold air from the ice sheet down the steep coastal topography in southeast Greenland (Oltmanns et al., 2014). On west Greenland, cyclonic systems that move toward the Baffin Bay from southern and western directions during the winter had been reported (Cappelen et al., 2001). These cyclonic systems may also influence the relation between cloudiness and wind direction at both HG and JI. Oltmanns et al. (2019) documented the advection of heat and moisture over large portions of the GrIS during the summer and wintertime. They suggested that theses cyclonic moisture intrusions increase cloud cover and precipitation, enhance the long-wave radiation, and decrease the albedo in the south and near the coast.
4.3 Cloud Impact on Radiative Fluxes for the 2013–2014 Period
Larger values of
The observed cloud effect on both
The seasonal variability in the total cloud effects at JI and HG is consistent with findings by Shupe and Intrieri (2004). These authors reported that over the entire Arctic, clouds induce surface warming through most of the year and a short period of surface cooling in the middle of summer when cloud shading effects overwhelm cloud greenhouse effects.
Over the GrIS, the melt season peaks during the summer months (van den Broeke et al., 2009). An observation-based study suggested that cloud cover has positive feedback on melt rates by controlling long-wave fluxes (Van Tricht et al., 2015). Our AWS stations are located the glaciers, and the data represents the seasonally snow-covered bare ground, not representative of the glaciers. However, the stations are close to the ice and might be positively influenced by snow and ice. Additional data are needed to examine whether clouds are optically thicker above JI compared to HG. The cloud radiative forcing varies seasonally at the two locations, which is consistent with Wang et al. (2018, 2019) results.
A recent study by Hofer et al. (2017) suggested that the sudden reduction in the surface mass balance of the GrIS since about 1995 can be attributed to decreasing summer cloud cover enhancing the melt-albedo feedback. Permanent deployment of AWS on the two glaciers could provide more insights into the effects of cloud on surface melt rates. Wang et al. (2018) reported that the net cloud radiative effect generally increases during melt season in the north of Greenland because the long-wave cloud radiative effect is enhanced by cloud fraction and liquid water. In the middle and south of Greenland, they found that from late spring to early fall seasons, the net cloud radiative effect showed a non-monotonic pattern, attributed to the strengthened short-wave cloud radiative effect caused by surface albedo reduction. The southern and western coasts of Greenland experience frequent surface melts in summer (e.g., (van den Broeke et al., 2009; Hall et al., 2009)). The interplay between surface albedo and cloud properties in driving the cloud radiative effect is still challenging (Wang et al., 2018). Moreover, it has been shown that overcast conditions and atmospheric river events triggered surface melting on the GrIS [e.g., (Oltmanns et al., 2019)]. Further study is required to assess the impacts of atmospheric river events on cloud radiative effects. The cloud fraction calculations used in this study do not account for cloud types, ice content, or optical thickness. Additionally, cloud cover classification was derived using the incoming long-wave radiation, and differences in long-wave radiation among cloud conditions should be interpreted with caution (Lund et al., 2017).
The representation of microphysical processes in general circulation models remains a considerable challenge leading to uncertainty in numerical weather forecasts and climate simulations (see the review by (Morrison et al., 2020)). For example, in a recent paper, Hofer et al. (2019) showed that the liquid and ice phases of cloud particles had a strong influence on simulations of future GrIS melting. Accurate modeling of the elevation of clouds continues to challenge the general circulation models community. The atmospheric moisture elevation can contribute to significantly different radiative effects between low thick clouds and high thin clouds. HG is 429 m higher than JI (located at an altitude of 30 m). From the pictures taken by the cameras, we can conclude that JI gets relatively more stratocirrus than HG. The stratocirrus clouds radiatively behave very differently from cumulus clouds (Klinger et al., 2017). The differences in cloud elevation, among other factors, could contribute to differences between HG and JI. The degree of the impact of the differences in cloud elevation on radiative properties at JI and HG is uncertain because their frequency was not monitored, but understanding their effects is of great interest and requires a new study.
5 Conclusion
In this study, we have presented new near-surface observations of meteorological parameters and radiative fluxes obtained from two AWS located on the southeast and west Greenland near two outlet glaciers, JI and HG. We have assessed cloud impacts on the surface radiation at JI and HG stations from January 2013 to December 2014. In winter and spring, the air temperature at JI was 2 to 5°C cooler than HG’s monthly values. However, from July to October, both sites’ mean air temperature showed only slight differences (the mean fall Ta at HG about 0.7°C warmer than at JI). The monthly mean atmospheric pressure at JI was 50 hPa larger than the value obtained at HG. Weak to moderate winds at HG were, in general, lower than values at JI. No strong winds (
Because of a lower cloud transmittance factor at JI than HG, the observed summer
The uncertainty in AWS radiation, such as measurements and data quality procedures, the geographical location of the JI and HG AWS, still affect our findings, despite the efforts to improve data quality. The characteristics of clouds and their impact on the surface melt at JI and HG require further ground-based observations on the surface of the two glaciers. Direct measurements of sensible and latent heat fluxes, ice and liquid water contents (that determine cloud optical depth), and cloud types/elevations, among others, may help to give a complete picture.
Data Availability Statement
The datasets presented in this study can be found in online repositories. The names of the repository/repositories and accession number(s) can be found below: Data for HG and JIG AWS are available from the National Centers for Environmental Information (NCEI Accession 0148760 and 0148759).
Author Contributions
GD, conceptualization, methodology, and formal analysis; SM, validation, supervision; DH, funding acquisition, deployment of the automatic weather stations at Helheim Glacier and Jakobshavn Isbræ, data collection, and supervision; GD and SM, writing—original draft preparation; GD and SM, writing—review, and editing. All authors contributed to the article and approved the submitted version.
Funding
This work was supported by grants from the National Science Foundation Office of Polar Programs grant PLR-1739003, NASA Polar Programs grant NNX08AN52G, and the New York University Abu Dhabi Center for Global Sea Level Change grant G1204. SM. was funded by the Japan Society for the Promotion of Science, under Project no. S17096.
Conflict of Interest
The authors declare that the research was conducted in the absence of any commercial or financial relationships that could be construed as a potential conflict of interest.
Acknowledgments
We thank the Program for Monitoring of the Greenland Ice Sheet (PROMICE) for providing access to meteorological data at MIT station. PROMICE data are freely accessible at http://promice.org. The Greenland Climate Network provided data for stations Swiss Camp. The authors wish to thank J. P. Conway for helpful discussions about cloud metrics.
Supplementary Material
The Supplementary Material for this article can be found online at: https://www.frontiersin.org/articles/10.3389/feart.2020.616105/full#supplementary-material.
References
Andersen, M. L., Larsen, T. B., Nettles, M., Elosegui, P., van As, D., Hamilton, G. S., et al. (2010). Spatial and temporal melt variability at Helheim Glacier, East Greenland, and its effect on ice dynamics. J. Geophys. Res. 115, F04041. doi:10.1029/2010JF001760
Anderson, P. S. (1994). A method for rescaling humidity sensors at temperatures well below freezing. J. Atmos. Ocean. Technol. 11, 1388–1391. doi:10.1175/1520-0426(1994)011<1388:AMFRHS>2.0.CO;2
Bird, R. E., and Hulstrom, R. L. (1981). Technical Report. Simplified clear sky model for direct and diffuse insolation on horizontal surfaces. Golden, CO: Solar Energy Research Institute.
Burgess, E. W., Forster, R. R., Box, J. E., Mosley-Thompson, E., Bromwich, D. H., Bales, R. C., et al. (2010). A spatially calibrated model of annual accumulation rate on the Greenland Ice Sheet (1958–2007). J. Geophys. Res. 115, F02004. doi:10.1029/2009JF001293
Cappelen, J., Jorgensen, B. V., Laursen, E. V., Stannius, L. S., and Thomsen, R. S. (2001). The observed climate of Greenland, 1958–1999, with climatological standard normals, 1961–1990 Tech. Rep. 00–18. Copenhagen, Denmark: Dan. Meteorol. Inst.
Chen, J., Qin, X., Kang, S., Du, W., Sun, W., and Liu, Y. (2018). Effects of clouds on surface melting of Laohugou glacier No. 12, western Qilian Mountains, China. J. Glaciol. 64, 1–11. doi:10.1017/jog.2017.82
Church, J. A., White, N. J., Konikow, L. F., Domingues, C. M., Cogley, J. G., Rignot, E., et al. (2011). Revisiting the Earth’s sea-level and energy budgets from 1961 to 2008. Geophys. Res. Lett. 38, L18601. doi:10.1029/2011GL048794
Conway, J. P., Cullen, N. J., Spronken-Smith, R. A., and Fitzsimons, S. J. (2015). All-sky radiation over a glacier surface in the Southern Alps of New Zealand: characterizing cloud effects on incoming shortwave, longwave and net radiation. Int. J. Climatol. 35, 699–713. doi:10.1002/joc.4014
Cox, C. J., Walden, V. P., Rowe, P. M., and Shupe, M. D. (2015). Humidity trends imply increased sensitivity to clouds in a warming Arctic. Nat. Commun. 6, 10117. doi:10.1038/ncomms10117
Cox, C. J., Rowe, P. M., Neshyba, S. P., and Walden, V. P. (2016a). A synthetic data set of high-spectral-resolution infrared spectra for the Arctic atmosphere. Earth Syst. Sci. Data 8, 199–211. doi:10.5194/essd-8-199-2016
Cox, C. J., Uttal, T., Long, C. N., Shupe, M. D., Stone, R. S., and Starkweather, S. (2016b). The role of springtime Arctic clouds in determining autumn sea ice extent. J. Clim. 29, 6581–6596. doi:10.1175/JCLI-D-16-0136.1
Cox, C. J., Walden, V. P., Compo, G. P., Rowe, P. M., Shupe, M. D., and Steffen, K. (2014). Downwelling longwave flux over Summit, Greenland, 2010-2012: analysis of surface-based observations and evaluation of ERA-Interim using wavelets. J. Geophys. Res. 119, 12317–12337. doi:10.1002/2014JD021975
Curry, J. A., Rossow, W. B., Randall, D., and Schramm, J. L. (1996). Overview of Arctic cloud and radiation characteristics. J. Clim., 9. doi:10.1175/1520-0442(1996)009˂1731.OOACAR˃2.0.CO;2
Dong, X., Xi, B., Crosby, K., Long, C. N., Stone, R. S., and Shupe, M. D. (2010). A 10 year climatology of Arctic cloud fraction and radiative forcing at Barrow, Alaska. J. Geophys. Res. 115. D17212. doi:10.1029/2009JD013489
Dürr, B., and Philipona, R. (2004). Automatic cloud amount detection by surface longwave downward radiation measurements. J. Geophys. Res. 109, D05201. doi:10.1029/2003JD004182
Enderlin, E. M., Howat, I. M., Jeong, S., Noh, M.-J., Angelen, J. H., and van den Broeke, M. R. (2014). An improved mass budget for the Greenland ice sheet. Geophys. Res. Lett. 41, 866–872. doi:10.1002/2013GL059010
Fausto, R., and van As, D. (2019). Programme for monitoring of the Greenland ice sheet (promice): automatic weather station datadoi:10.22008/promice/data/awsversion: v03, dataset published via geological survey of denmark and greenland
Fitzpatrick, M., Brandt, R., and Warren, S. (2004). Transmission of solar radiation by clouds over snow and ice surfaces: a parameterization in terms of optical depth, solar zenith angle, and surface albedo. J. Clim. 17, 266–275. doi:10.1175/1520-0442(2004)017<0266:TOSRBC>2.0.CO;2
Francis, J. A., and Hunter, E. (2007). Changes in the fabric of the Arctic’s greenhouse blanket. Environ. Res. Lett. 2, 045011. doi:10.1088/1748-9326/2/4/045011
Giesen, R. H., Andreassen, L. M., van den Broeke, M. R., and Oerlemans, J. (2009). Comparison of the meterology and surface energy balance at Storbreen and Midtdalsbreen, two glaciers in southern Norway. Cryosphere 3, 57–74. doi:10.5194/tc-3-57-2009
Greuell, W., and Knap, W. H. (1997). Elevational changes in meteorological variables along a midlatitude glacier during summer. J. Geophys. Res. 102, 25941–25954. doi:10.1029/97JD02083
Hall, D. K., Nghiem, S. V., Schaaf, C. B., DiGirolamo, N. E., and Neumann, G. (2009). Evaluation of surface and near-surface melt characteristics on the Greenland ice sheet using MODIS and QuikSCAT data. J. Geophys. Res. 114, F04006. doi:10.1029/2009JF001287
Hanna, E., Fettweis, X., Mernild, S. H., Cappelen, J., Ribergaard, M., Shuman, C., et al. (2014). Atmospheric and oceanic climate forcing of the exceptional Greenland ice sheet surface melt in summer 2012. Int. J. Climatol. 34, 1022–1103. doi:10.1002/joc.3743
Hanna, E., Jones, J. M., Cappelen, J., Mernild, S. H., Wood, L., Steffen, K., et al. (2013). The influence of North Atlantic atmospheric and oceanic forcing effects on 1900-2010 Greenland summer climate and ice melt/runoff. Int. J. Climatol. 33, 862–880. doi:10.1002/joc.3475
Hanna, E., and Valdes, P. (2001). Validation of ECMWF (RE)analysis surface climate data, 1979-1998, for Greenland and implications for mass balance modeling of the ice sheet. Int. J. Climatol. 21, 171–195. 10.1002/joc.609
Harden, B. E., Renfrew, I. A., and Petersen, G. N. (2011). A climatology of wintertime barrier winds off southeast Greenland. J. Clim. 24, 4701–4717. doi:10.1175/2011JCLI4113.1
Hock, R., and Holmgren, B. (2005). A distributed surface energy-balance model for complex topography and its application to Storglaciaren, Sweden. J. Glaciol. 51, 25–36. doi:10.3189/172756505781829566
Hofer, S., Tedstone, A., Fettweis, X., and Bamber, J. (2017). Decreasing cloud cover drives the recent mass loss on the Greenland ice sheet. Sci Adv. 3, e1700584. doi:10.1126/sciadv.1700584
Hofer, S., Tedstone, A. J., Fettweis, X., and Bamber, J. L. (2019). Cloud microphysics and circulation anomalies control differences in future Greenland melt. Nat. Clim. Change 9, 523–528 doi:10.1038/s41558-019-0507-8
Holland, D. M., and Holland, D. (2016a). Version 1.1. Air temperature, relative humidity, and others collected from automatic weather station installed on rock outcrop in helheim glacier ice front from 2009-08-11 to 2016-02-20 (NCEI Accession 0148759). NOAA National Centers for Environmental Information.
Holland, D. M., and Holland, D. (2016b). Version 1.1. Air temperature, relative humidity, and others collected from automatic weather station installed on rock outcrop in jakobshavn glacier ice front from 2007-10-13 to 2016-02-14 (NCEI Accession 0148760). NOAA National Centers for Environmental Information.
Houghton, H. G. (1954). On the annual heat balance of the northern hemisphere. J. Meteorol 11, 1–9. doi:10.1175/1520-0469(1954)011<0001:OTAHBO>2.0.CO;2
Howat, I. M., Ahn, Y., Joughin, I., van den Broeke, M. R., Lenaerts, J. T. M., and Smith, B. (2011). Mass balance of Greenland’s three largest outlet glaciers, 2000-2010. Geophys. Res. Lett. 38, L12501. doi:10.1029/2011GL047565
Intrieri, J. M., Fairall, C. W., Shupe, M., Persson, P. O. G., Andreas, E. L., Guest, P. S., et al. (2002). An annual cycle of Arctic surface cloud forcing at SHEBA. J. Geophys. Res. 107, 8039. doi:10.1029/2000JC000439
Juszak, I., and Pellicciotti, F. (2013). A comparison of parameterizations of incoming longwave radiation over melting glaciers: model robustness and seasonal variability. J. Geophys. Res. Atmos. 118, 3066–3084. doi:10.1002/jgrd.50277
Klinger, C., Mayer, B., Jakub, F., Zinner, T., Park, S., and Gentine, P. (2017). Effects of 3-D thermal radiation on the development of a shallow cumulus cloud field. Atmos. Chem. Phys. 17, 5477–5500. doi:10.5194/acp-17-5477-2017
Konzelmann, T., van de Wal, R. S. W., Greuell, W., Bintanja, R., Henneken, A. A. C., and Abe-Ouchi, A. (1994). Parameterisation of global and longwave incoming radiation for the Greenland ice sheet. Global Planet. Change 7, 143–164. doi:10.1016/0921-8181(94)90013-2
Krabill, W., Hanna, E., Huybrechts, P., Abdalati, W., Cappelen, J., Csatho, B., et al. (2004). Greenland ice sheet: increased coastal thinning. Geophys. Res. Lett. 31, L24402. doi:10.1029/2004GL021533
Kuipers Munneke, P., Reijmer, C. H., and van den Broeke, M. R. (2011). Assessing the retrieval of cloud properties from radiation measurements over snow and ice. Int. J. Climatol. 31, 756–769. doi:10.1002/joc.2114
Lund, M., Stiegler, C., Abermann, J., Citterio, M., Hansen, B. U., and van As, D. (2017). Spatiotemporal variability in surface energy balance across tundra, snow and ice in Greenland. Ambio 46, 81. doi:10.1007/s13280-016-0867-5
Makkonen, L., and Laakso, T. (2005). Humidity measurements in cold and humid environments. Boundary-Layer Meteorol 116, 131–147. doi:10.1007/s10546-004-7955-y
Marty, C., and Philipona, R. (2000). The clear-sky index to separate clear-sky from cloudy-sky situations in climate research. Geophys. Res. Lett. 27, 2649–2652. doi:10.1029/2000GL011743
Mernild, S. H., Hansen, B. U., Jakobsen, B. H., and Hasholt, B. (2008). Climatic conditions at the mittivakkat glacier catchment (1994-2006), Ammassalik island, SE Greenland, and in a 109 years term perspective (1898-2006). Geografisk Tidsskrift-Danish Journal of Geography 108, 51–72. doi:10.1080/00167223.2008.10649574
Mernild, S. H., Knudsen, N. T., Lipscomb, W. H., Yde, J. C., Malmros, J. K., Jakobsen, B. H., et al. (2011). Increasing mass loss from Greenland’s Mittivakkat Gletscher. Cryosphere 5, 341–348. doi:10.5194/tc-5-341-2011
Miller, N., Shupe, M., Cox, C., Walden, V., Turner, D., and Steffen, K. (2015). Cloud radiative forcing at Summit, Greenland. J. Clim. 28, 6267–6280. doi:10.1175/JCLI-D-15-0076.1
Mölg, T., Cullen, N. J., and Kaser, G. (2009b). Solar radiation, cloudiness and longwave radiation over low-latitude glaciers: implications for mass-balance modelling. J. Glaciol. 55, 292–302. doi:10.3189/002214309788608822
Moore, G. W. K., and Renfrew, I. A. (2005). Tip jets and barrier winds: a QuikSCAT climatology of high wind speed events around Greenland. J. Clim. 18, 3713–3725. doi:10.1175/JCLI3455.1
Morrison, H., van Lier-Walqui, M., Fridlind, A. M., Grabowski, W. W., Harrington, J. Y., Hoose, C., et al. (2020). Confronting the challenge of modeling cloud and precipitation microphysics. J. Adv. Model. Earth Syst. 12, e2019MS001689. doi:10.1029/2019MS001689
Neff, W., Compo, G. P., Ralph, R. M., and Shupe, M. D. (2014). Continental heat anomalies and the extreme melting of the Greenland ice surface in 2012 and 1889. J. Geophys. Res. Atmos. 119, 6520–6536. doi:10.1002/2014JD021470
Nghiem, S. V., Hall, D. K., Mote, T. L., Tedesco, M., Albert, M. R., Keegan, K., et al. (2012). The extreme melt across the Greenland ice sheet in 2012. Geophys. Res. Lett. 39, 6520–6536. doi:10.1029/2012GL053611
Oltmanns, M., Straneo, F., Moore, G. W. K., and Mernild, S. H. (2014). Strong downslope wind events in Ammassalik, southeast Greenland. J. Clim. 27, 977–993. doi:10.1175/JCLI-D-13-00067.1
Oltmanns, M., Straneo, F., and Tedesco, M. (2019). Increased Greenland melt triggered by large-scale, year-round cyclonic moisture intrusions. Cryosphere 13, 815–825. doi:10.5194/tc-13-815-2019
Orr, A., Hanna, E., Hunt, J., Cappelen, J., Steffen, K., and Stephens, A. (2005). Characteristics of stable flows over Southern Greenland. Pure Appl. GeoPhys. 162, 1747–1778. doi:10.1007/s00024-005-2691-x
Overland, J., Hanna, E., Hanssen-Bauer, I., Kim, S. J., Walsh, J. E., Wang, M., et al. (2017). Surface air temperature [in Arctic Report Card 2017]. Available at: http://www.arctic.noaa.gov/Report-Card (Accessed December 6, 2017).
Parta, A. J. (1996). A new long-wave formula for estimating downward clear-sky radiation at the surface. Q. J. Roy. Meteorol. Soc. 122, 1127–1151. doi:10.1002/qj.49712454903
Pellicciotti, F., Raschle, T., Huerlimann, T., Carenzo, M., and Burlando, P. (2011). Transmission of solar radiation through clouds on melting glaciers: a comparison of parameterizations and their impact on melt modelling. J. Glaciol. 57, 367–381. doi:10.3189/002214311796406013
Pfister, G., McKenzie, R., Liley, J. B., Thomas, A., Forgan, B. W., and Long, C. N. (2003). Cloud coverage based on all-sky imaging and its impact on surface solar irradiance. J. Appl. Meteorol 42, 1421–1434. doi:10.1175/1520-0450(2003)042<1421:CCBOAI>2.0.CO;2
Pithan, F., and Mauritsen, T. (2014). Arctic amplification dominated by temperature feedbacks in contemporary climate models. Nat. Geosci. 7, 181–184. doi:10.1038/ngeo2071
Ramanathan, V., Cess, R. D., Harrison, E. F., Minnis, P., Barkstrom, B. R., Ahmad, E., and et al. Hartmann, D. (1989). Cloud-radiative forcing and climate: results from the earth radiation budget experiment. Science 243, 57–63. doi:10.1126/science.243.4887.57
Rasmussen, L. (1989). “Greenland winds and satellite imagery. Scientific report,” in VEJRET. Editor N. W. Nilsen (Copenhagen: Danish Meteorological Society).
Rignot, E., and Kanagaratnam, P. (2006). Changes in the velocity structure of the Greenland ice sheet. Science 31, 986–990. doi:10.1126/science.1121381
Ruckstuhl, C., and Philipona, R. (2008). Detection of cloud-free skies based on sunshine duration and on the variation of global solar irradiance. Meteorol. Z 17, 181–186. doi:10.1127/0941-2948/2008/0271
Ruckstuhl, C., Philipona, R., Morland, J., and Ohmura, A. (2007). Observed relationship between surface specific humidity, integrated water vapor, and longwave downward radiation at different altitudes. J. Geophys. Res. 112, D03302. doi:10.1029/2006JD007850
Screen, J. A., and Simmonds, I. (2010). The central role of diminishing sea ice in recent Arctic temperature amplification. Nature 464, 1334–1337. doi:10.1038/nature09051
Shepherd, A., Ivins, E., Rignot, E., Smith, B., van den Broeke, M., Velicogna, I., et al. The IMBIE Team (2019). Mass balance of the antarctic ice sheet from 1992 to 2018. Nature 579, 219–222. doi:10.1038/s41586-019-1855-2
Shupe, M. D., and Intrieri, J. M. (2004). Cloud radiative forcing of the Arctic surface: the influence of cloud properties, surface albedo, and solar zenith angle. J. Clim. 17, 616–628. doi:10.1175/1520-0442(2004)017<0616:CRFOTA>2.0.CO;2
Shupe, M. D., Turner, D. D., Walden, V. P., Bennartz, R., Cadeddu, M. P., Castellani, B. B., et al. (2013). High and dry: new observations of tropospheric and cloud properties above the Greenland ice sheet. Bull. Am. Meteorol. Soc. 94, 169–186. doi:10.1175/BAMS-D-11-00249.1
Sicart, J. E., Pomeroy, J. W., Essery, R. L. H., and Bewley, D. (2006). Incoming long-wave radiation to melting snow: observations, sensitivity and estimation in northern environments. Hydrol. Process 20, 3697–3708. 10.1002/hyp.6383
Smeets, P. C. J. P., Munneke, P. K., van As, D., van den Broeke, M. R., Boot, W., Oerlemans, H., et al. (2018). The K-transect in west Greenland: automatic weather station data (1993-2016). Arctic Antarct. Alpine Res. 50. doi:10.1080/15230430.2017.1420954
Spall, M. A., Jackson, R. H., and Straneo, F. (2017). Katabatic wind-driven exchange in fjords. J. Geophys. Res. Ocean 112, 8246–8262. doi:10.1002/̵2017JC013026
Steffen, K., and Box, J. (2001). Surface climatology of the Greenland ice sheet: Greenland climate network 1995–1999. J. Geophys. Res. 106, 33951–33964. doi:10.1029/2001JD900161
Straneo, F., Hamilton, G., Stearns, L., and Sutherland, D. (2016). Connecting the Greenland ice sheet and the ocean: a case study of Helheim Glacier and Sermilik fjord. Oceanography 29, 34–45. doi:10.5670/oceanog.2016.97
Straneo, F., and Heimbach, P. (2013). North Atlantic warming and the retreat of Greenland’s outlet glaciers. Nature 504, 36–43. doi:10.1038/nature12854
Shepherd, A., Ivins, E., Rignot, E., Smith, B., van den Broeke, M., Velicogna, I., et al. The IMBIE team (2019). Mass balance of the Antarctic Ice Sheet from 1992 to 2018. Nature 579, 233–239. doi:10.1038/s41586-019-1855-2
Van As, D. (2011). Warming, glacier melt and surface energy budget from weather station observations in the Melville Bay region of northwest Greenland. J. Glaciol. 57, 208–220. doi:10.3189/002214311796405898
van den Broeke, M., Bamber, J., Rignot, E., Schrama, E., van de Berg, W. J., van Mejigaard, E., et al. (2009). Partitioning recent Greenland mass loss. Science 326, 984–986. doi:10.1126/science.1178176
van den Broeke, M., Box, J., Fettweis, X., Hanna, E., Noël, B., Tesdesco, M., et al. (2017). Greenland ice sheet surface mass loss: recent developments in observation and modeling. Curr. Clim. Change Rep. 3, 345–356. doi:10.1007/s40641-017-0084-8
van den Broeke, M. R., Reijmer, C., As, D. V., and Boot, W. (2006). Daily cycle of the surface energy balance in Antarctica and the influence of clouds. Int. J. Climatol. 26, 1587–1605. doi:10.1002/joc.1323
van den Broeke, M., Smeets, P., Ettema, J., and Munneke, P. K. (2008). Surface radiation balance in the ablation zone of the west Greenland ice sheet. J. Geophys. Res. 113, D13105. doi:10.1029/2007JD009283
van den Broeke, M., van As, D., Reijmer, C., and van de Wal, R. (2004). Assessing and improving the quality of unattended radiation observations in Antarctica. J. Atmos. Ocean. Technol. 2, 1417–1431. doi:10.1175/1520-0426(2004)021<1417:AAITQO>2.0.CO;2
Van Tricht, K., Lhermitte, S., Lenaerts, J. T. M., Gorodetskaya, I., L’Ecuyer, T. S., Noel, B., et al. (2015). Clouds enhance Greenland ice sheet meltwater runoff. Nat. Commun. 7, 10266. doi:10.1038/ncomms10266
Wang, W., Zender, C. S., van As, D., and Miller, N. B. (2019). Spatial distribution of melt season cloud radiative effects over Greenland: evaluating satellite observations, reanalyses, and model simulations against in situ measurements. J. Geophys. Res. Atmos. 124, 57–71. doi:10.1029/2018JD028919
Wang, W., Zender, C. S., and van As, D. (2018). Temporal characteristics of cloud radiative effects on the Greenland ice sheet: discoveries from multiyear automatic weather station measurements. J. Geophys. Res. Atmos. 123 (348–11), 11. doi:10.1029/2018JD028540.361
Keywords: surface radiation, longwave-equivalent cloudiness, cloud transmittance factor, meteorological conditions, cloud effects on radiation
Citation: Djoumna G, Mernild SH and Holland DM (2021) Meteorological Conditions and Cloud Effects on Surface Radiation Balance Near Helheim Glacier and Jakobshavn Isbræ (Greenland) Using Ground-Based Observations. Front. Earth Sci. 8:616105. doi: 10.3389/feart.2020.616105
Received: 11 October 2020; Accepted: 17 December 2020;
Published: 27 January 2021.
Edited by:
Alun Hubbard, Arctic University of Norway, NorwayReviewed by:
William Colgan, Geological Survey of Denmark and Greenland, DenmarkChris Cox, National Oceanic and Atmospheric Administration (NOAA), United States
Copyright © 2021 Djoumna, Mernild and Holland. This is an open-access article distributed under the terms of the Creative Commons Attribution License (CC BY). The use, distribution or reproduction in other forums is permitted, provided the original author(s) and the copyright owner(s) are credited and that the original publication in this journal is cited, in accordance with accepted academic practice. No use, distribution or reproduction is permitted which does not comply with these terms.
*Correspondence: G. Djoumna, Z2Rqb3VtbmFAZ21haWwuY29t