 Willem G. M. van der Bilt1,2*
 Jan Magne Cederstrøm1
 Eivind W. N. Støren1,2
 Sarah M. P. Berben1,2
 Sunniva Rutledal1,2
- 1Department of Earth Science, University of Bergen, Bergen, Norway
- 2Bjerknes Centre for Climate Research, Bergen, Norway
Volcanic ash (tephra) horizons represent powerful chronological and stratigraphic markers: rapid and widespread deposition allows for correlation of geological records in time and space. Recent analytical advances enable identification of invisible ash (cryptotephra) up to thousands of kilometers from its volcanic source. This momentum has greatly expanded the reach and potential of tephrochronology: some deposits can now be traced across continents and oceans. However, the laborious laboratory procedures required to identify tephra horizons in geological archives hold back the pace of progress. By allowing the rapid visualization of ash at micrometer (µm) scales, computed tomography (CT) holds great promise to overcome these restrictions. In this study, we further demonstrate the potential of this tool for the tephra community with experimental results and applications on conventionally analyzed archives. A custom-made scanner helps us strike a balance between the convenience of whole-core medical scanners and the µm-resolution of micro-CT systems. Using basic image processing tools that can be readily mastered by tephrochronologists, we identified invisible horizons down to ∼500 shards in synthetic cores. In addition, procedures for the removal of image artifacts can be used to visualize other paleoenvironmental indicators such as bioturbation burrows, ice rafted debris or mineral dust. When applied on segments of manually counted natural archives, our approach captures cryptic glass shard maxima down to ∼300 shards/cm3. We also highlight the value of CT to help optimize sampling strategies by identifying micrometer-scale ash horizons that were not detected in shard count profiles. In conclusion, this work helps broaden the applicability of CT as a promising frontier in tephrochronology that can advance the field by optimizing the efficiency and accuracy of isochron detection.
Introduction
Tephrochronology, the use of rapidly deposited and geochemically distinct volcanic ash (tephra) markers to date and correlate geological archives, is an invaluable tool in many fields of Quaternary research (Lowe, 2011). Indeed, widespread application and analytical advances have positioned tephrochronology at the forefront of Quaternary geochronology (Turney, 1998; Hayward, 2011). Over the past decades, tephra work has evolved from the investigation of visible ash layers near their source volcanoes to the detection of fine-grained shards that traveled thousands of kilometres (Davies, 2015). These include cryptotephras; “hidden” glass shard concentrations insufficiently numerous to be visible as a layer to the naked eye (Paterne et al., 1988; Lowe and Hunt, 2001). These deposits can sometimes be traced across continents or oceans, and tephra frameworks now cover large swaths of our planet.
The pace of progress is, however, held back by the laborious and time-consuming laboratory procedures required to locate cryptotephra horizons in their host sediments. These typically involve contiguous sampling of records followed by multiple separation steps (e.g., Mackie et al., 2002; Blockley et al., 2005; Bigler et al., 2007). Such procedures are repeated thousands of times to produce high-resolution tephra chronologies for meters-long geological archives, while only a few samples contain the shard concentration peaks indicative of marker horizons (e.g., Berben et al., 2020). Hence, diagnostic (rangefinder) approaches that permit the rapid detection of (invisible) volcanic ash layers can advance the field of tephrochronology. However, past efforts using magnetic, spectrophotometric or X-ray-based approaches produced mixed results at low ash concentrations (Andrews et al., 2006; Gehrels et al., 2008 and references there in; Peters et al., 2010; Kylander et al., 2012; Balascio et al., 2015).
Our study explores the potential of computed tomography (CT) for the rapid detection of tephra. This approach distinguishes volcanic ash from its host material based on density differences—captured by CT grayscale values. Recent pioneering work has successfully applied this approach to detect visible ash deposits in sediment archives (Griggs et al., 2015; Evans et al., 2017; Loame et al., 2018). To further advance the ability of CT to identify tephra, we designed a controlled experiment using multiple synthetic cores (phantoms) made of different common host materials (minerogenic, peat and ice) spiked with multiple horizons of visible and invisible (cryptic) volcanic ash of basaltic and intermediate composition. Our findings, acquired with an industrial CT scanner customized for the analysis of max. 1.5 m long core segments, show that invisible horizons down to ∼500 shards can be identified with easily applicable basic image processing tools. We also validate these results by comparing CT scans and manually counted glass shard profiles from published cryptotephra investigations for the first time.
Materials and Methods
Experimental Design
To assess the ability of CT scans to detect (crypto) tephra horizons, we designed a controlled laboratory-based experiment. A set of synthetic cores (phantoms) with different host sediments and varying tephra shard numbers was created. For this purpose, we used 50 ml conical centrifuge tubes and filled these with alternating layers of sediment and volcanic ash. To reflect the broad range of materials that make up natural geological archives, we added tephra to synthetic minerogenic, peat and ice cores (Figure 1). Conventional methods for tephra identification primarily rely on the characteristic densities of the mineral and glass components of volcanic ash to separate shards from host sediments (Turney, 1998; Blockley et al., 2005). To cover the density range found in natural archives, we created two sets of synthetic cores that were spiked with intermediate (2.3–2.5 g/cm3) and mafic (>2.5 g/cm3) ash, respectively. Our intermediate member consists of phonolitic-trachytic (∼60 wt% SiO2) ash from the ∼39 ka BP Campanian Ignimbrite (CI) that was sampled in Romania ∼1,000 km from its source (Veres et al., 2013). Our mafic member comprises proximally-sourced dark-colored basaltic ash (∼48 wt% SiO2) from the first eruption phase of the 2010 CE Eyjafjallajökull (Ey) eruption (Sigmundsson et al., 2010). To ascertain these compositional differences and concentrate glass shards, we relied on stepped heavy liquid flotation in sodium polytungstate (SPT) after Blockley et al. (2005). This analysis confirmed that 79.24 wt% of CI material falls in the typical 2.3–2.5 g/cm3 density range of felsic or intermediate tephra, while 97 wt% of our Ey ash is denser than 2.5 g/cm3, which is characteristic for basaltic material (Griggs et al., 2014). Both deposits were sieved to ensure the detection of size fractions that are relevant to the tephra community. We retained all shards larger than 25 µm for the CI tephra. Basaltic Ey was separated into three fractions (25–80, 80–125, and >125 µm) following the recommendations of Abbott et al. (2018) for similar deposits. For our experiment, we used the intermediate 80–125 µm size range. To spike synthetic cores with a known number of shards, we counted 0.1 g of material from each sieved deposit on a 1 mm2 gridded picking tray using an optical microscope under ×40 magnification. Relying on these weight-shard count relations, we added four (a–d) tephra horizons with known shard numbers to each synthetic core at semi-regular (∼1 cm) intervals (Figure 1). These layers ranged from barely visible (a) at the bottom to invisible (d) at the top. The boundary between visible and invisible horizons differs significantly; for example, low shard counts of basaltic tephra are highly visible in ice cores, while large amounts of the same ash are difficult to observe in minerogenic sediments. Based on visual assessment of the visibility of different ash types per host sediment, the lowermost visible layer (a) in our synthetic cores consist of 70,000 intermediate and 170,000 basaltic shards (Figure 1). The overlaying cryptic horizons contain 17–18,000, 8–9,000, and 500 shards. In the next paragraphs, we report on the specifics of our synthetic core design.
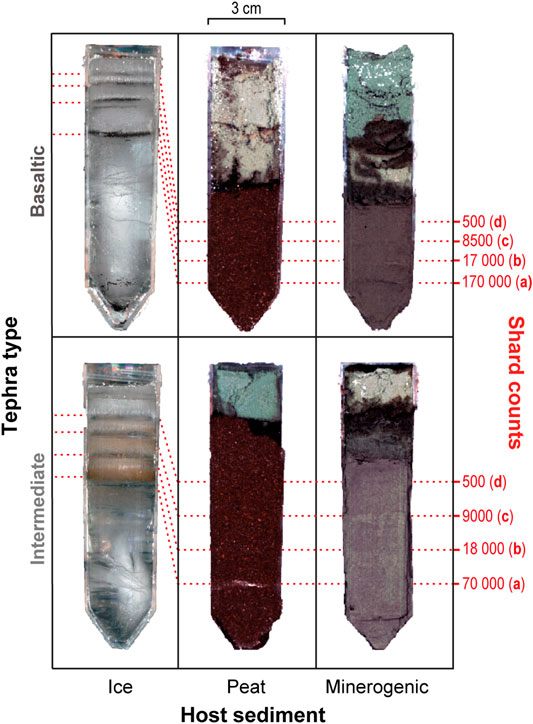
FIGURE 1. Overview of the synthetic sediment cores (phantoms) created for this study in 50 ml centrifuge tubes, organized per glass type (row) and host sediment (column). The position, shard counts and names (A–D) of the four glass shard horizons added to each core are highlighted in red on the right.
Ice
The detection of known tephra markers in annually resolved ice cores allows precise dating and correlation to refine the age models of archives that contain these horizons. This unique potential for high-precision dating, set against a backdrop of major advances in tephrochronology (Davies, 2015), has sparked great interest in the analysis of cryptotephra in ice cores (e.g., Abbott and Davies, 2012). Localization of cryptic horizons requires sub-sampling and melting of centimeter-scale layers (Bourne et al., 2015); considering the kilometer-long length of many ice cores, rapid and non-destructive detection would be advantageous. Because we could not simulate the transformation from snow to ice, we used distilled water and a freezer set to −18°C to create synthetic ice cores. We found that filling the utilized 50 ml centrifuge tubes with ∼30 ml of ice prior to adding ash minimized disturbance introduced by cracking. The four glass-dominated samples were then added by pipetting water onto the ice surface and sprinkling ash on top. After the shards had settled, this layer was frozen before repeating these steps. To prevent melt during scanning, we placed the resulting synthetic ice cores inside an insulated plastic tube filled with liquid nitrogen (Figures 2B, 3). As evaporating liquid nitrogen has an expansion rate of 1:694 at room temperature (∼20°C), we fitted a pressure valve.
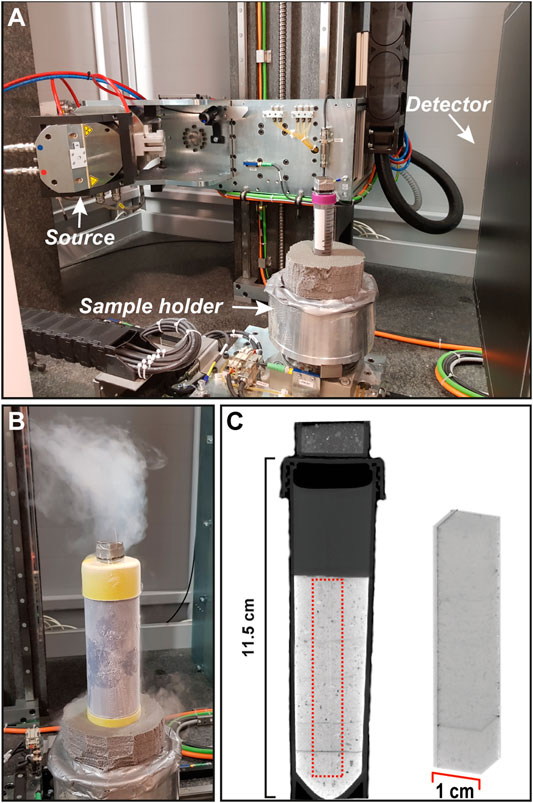
FIGURE 2. Photographs highlighting key aspects of our experimental setup. (A) The inside of the ProCon CT-ALPHA system we used for scanning, showing the position of the X-ray source (tube) and detector in relation to the sample holder mounted with one of our synthetic cores and calibration standards. (B) Close-up of the liquid-nitrogen filled casing used to scan our ice core phantoms. (C) A 2-D CT orthoslice of one of our synthetic cores, highlighting the section used for 3-D reconstruction–visualized on the right side of the panel—in red.
Peat
Ever since the first discoveries of invisible volcanic ash deposits in peats (e.g., Persson, 1970; Lowe et al., 1981; Dugmore, 1989), peatlands have established a reputation as comprehensive cryptotephra archives (Watson et al., 2016). Extraction of glass-dominated shards from peat is, however, particularly time-consuming as it involves (a combination of) combustion, acid digestion or density separation of contiguous samples (e.g., Hall and Pilcher, 2002). Because of these limitations, and the large compositional difference between minerogenic ash and organic peat (Dugmore and Newton, 1992), different rapid-assay techniques have been tested on natural peat archives, with mixed results (Gehrels et al., 2008). For our first attempt to test the potential of CT scans, we created synthetic peat cores with Sphagnum moss potting mix. We first homogenized this material with a grinder to emulate the porosity of natural peat sequences, and prevent shard migration (Payne and Gehrels, 2010). We added this homogenized material to our 50 ml centrifuge tubes with a customized piston to create a peat-like structure by gently tapping it down. Shards were subsequently sprinkled onto this surface before repeating the fore-going steps for overlying volcanic ash horizons.
Minerogenic
The potential of tephrochronology is significant in minerogenic sediments as a lack of organic material often precludes radiocarbon dating (e.g., van der Bilt and Lane, 2019). However, especially in case of poorly sorted fine-grained sediments, multiple rounds of sieving and density separation are required to extract glass (Turney, 1998). Clearly, rapid and non-destructive detection approaches hold significant merit. To create our synthetic minerogenic cores, we used natural sediments from a tephra-free deglacial sequence from lake Ingulsjø in southern Norway (61°31′N, 9°01′E). This material was selected because of its low (<2%) organic content and homogenous grain size distribution. To further reduce the undesirable imprint of grading introduced during core creation, we sieved the Ingulsjø sediments to exclusively retain the mud (<63 µm) fraction. To remove remaining organic particles, we treated the Ingulsjø sediments with 95°C aliquots of aqueous (35%) hydrogen peroxide (H2O2) until reaction ceased (Leifeld and Kögel-Knabner, 2001). To mimic natural deposition in the lacustrine environments that are typically targeted for cryptotephra investigations in minerogenic sediments (Balascio et al., 2015), we relied on the gravity settling protocol by Poppe et al. (2001). Sediment and volcanic ash were alternately sprinkled on top of distilled water-filled centrifuge tubes at 30 min intervals. To allow all glass shards to settle, we added green soap to break the surface tension of water.
Conventionally Analyzed Natural Archives
To further assess the potential of CT scanning for cryptotephra detection, we applied the insights gained from our controlled experiment on sections of natural archives where invisible ash horizons were identified with conventional methods. As we could not obtain valuable ice core material, this effort was focused on peat and minerogenic cores. We scanned the 95–120 cm section of peat core DB-2 from sub-Antarctic South Georgia (54°13′S, 36°38′W), which was previously investigated at 1 cm intervals by Oppedal et al. (2018). This interval contains a distinct 304 shards per cubic centimetre rhyolitic (avg. 71.26 wt% SiO2) cryptotephra isochron at 112 cm depth that has a similar (2.3–2.5 g/cm3) density as the CI ash used for our experiments (Experimental Design section). We also scanned a 41 cm interval of minerogenic core GS15-198-36CC, which was taken east of Greenland in the Denmark Strait (67°51′N, 21°52′W). In this case, conventional tephra work was carried out in tandem with CT scanning to identify areas of interest. Basaltic shards (Supplementary Table S1: avg. 50.39 wt% SiO2) have been counted at 1–2 cm intervals for this section. To optimize scanning resolution (CT Scanning section), we took out ∼2 cm wide U-channels from both cores for our CT work.
CT Scanning
CT characterizes materials based on the same property used to isolate tephra with conventional methods—density. Fundamentally, CT harnesses the relation between object density and the attenuation of X-rays. The potential of this principle for non-destructive imaging of internal structure has been a cornerstone of medical diagnosis for over a century (Jones, 1897). The degree of X-Ray attenuation is expressed using grayscale values: X-ray photons easily penetrate light (black; radiolucent) materials, while more radiation is absorbed by dense (white; radiopaque) objects. Medical CT scanners acquire images from different angles as an X-ray source (tube) and detector rotate around patients. These radiographs can be reconstructed to create 2-D cross-sections (orthoslices) or 3-D visualizations (volume rendering), e.g., Kalender (2011). Despite significant progress, features smaller than ∼200 µm (including cryptotephra) normally cannot be resolved with medical scanners (Cnudde et al., 2006). To improve scanning resolution, geoscientists often rely on micro-CT systems (Cnudde and Boone, 2013; Du Plessis et al., 2016). This relatively new technique has been successfully used to characterize fine-grained and barely visible basaltic tephra horizons. However, sample size restrictions (max. ∼70 cm) often limit the use of typical micro-CT systems for rapid and non-destructive scanning along the entire length of geological archives like sediments or ice cores. For this study, we used a one-of-its-kind ProCon CT-ALPHA CORE system that allows the large sample sizes of medical scanners while attaining the high-resolution of micro-CT. This custom-built scanner, located at the Earth Surface Sediment laboratory (EARTHLAB) of the University of Bergen in Norway, was specifically designed to scan sediment archives. Core sections up to 150 cm long and 11 cm wide are mounted in an upright position for scanning with a 240 kV microfocus X-Ray source and 9 MP detector that move vertically while the scanned object rotates (Figure 2A). While it is possible to further optimize signal strength by optimizing individual scan parameters, we acquired helical scans of all cores presented in this study at 850 μA and 100 kV with an exposure time of 267 ms for the sake of consistency, generating 1,600 projections per rotation. By scanning narrow (2–3 cm wide) U-channels and centrifuge tubes, we minimized the distance between detector and source to achieve ∼20 µm resolution scans (opposed to max. 60 µm for a 110 mm diameter core). To aid correct characterization of tephra CT grayscale (density) distributions, which may vary between scans (Bryant et al., 2012), we created calibration standards. For this purpose, we embedded the intermediate (phonolitic-trachytic) CI and mafic (basaltic) Ey ash used for our experiment (Experimental Design section) in epoxy resin with the help of 1 cm3 casting molds. These cubes were placed on top of our cores during scanning (Figure 2). Following scanning, CT projections were reconstructed for 3-D analysis with the Fraunhofer Volex X-RayOffice software suite. We used version 9.1.1 of the Thermo Scientific Avizo software for all subsequent processing: specific tools and modules are described and referenced throughout Discussion section (in italics). By capturing 65,536 CT grayscale values, 16 bit output imagery helps us to capture density contrasts between tephra shards and host sediment. Prior to image analysis, we clipped all 3-D reconstructions to 1 cm wide squares (Figure 2C) to limit the inclusion of surface beam hardening effects (Brooks and Di Chiro, 1976) and remove core barrel material.
Discussion
Calibration
As outlined in CT Scanning section, we used epoxy-embedded standards for our synthetic cores to aid rapid identification the CT grayscale range of tephra horizons. This calibration attempt was, however, thwarted by partial volume effects—the blurring of density values when materials of different specific densities occupy a single volumetric pixel or voxel (Glover and Pelc, 1980). In the context of our study, an inter-voxel mixture of glass-dominated shards and sediment particles can generate an intermediate CT grayscale value that is proportional to the volume that both materials occupy. As further discussed in Peat and Minerogenic section, we argue that the majority of CT cryptotephra visualizations in our experiments are influenced by partial volume effects as most horizons are sufficiently thin, fine-grained or porous to allow inter-voxel blurring of glass shards and host material. However, this blended CT grayscale range is sufficiently distinct from the surrounding material to isolate volcanic ash (e.g., Figures 4, 5). In contrast, the inside of our standards (and visible glass-dominated horizons) remains unaffected and records the CT density of pure ash. As shown in Supplementary Figure S1, this grayscale range differs from the blended signature of cryptic horizons, limiting their use for calibration purposes.
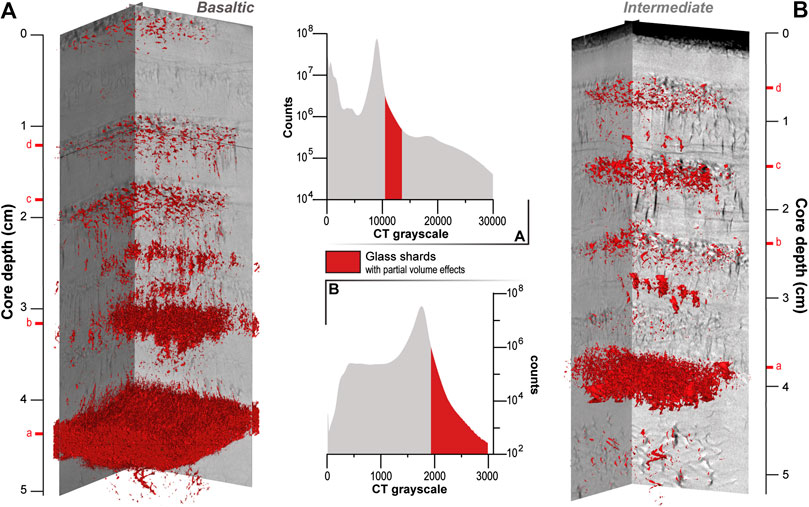
FIGURE 3. Interlocking 2-D CT orthoslices and 3-D representations of horizons of basaltic (A) and intermediate (B) glass composition in the synthetic ice cores scanned for this study. The histograms show the grayscale value distribution of each scan in gray, while highlighting the range of tephra in red. The position of each added tephra horizon is highlighted with a red dash (and letter; Figure 1).
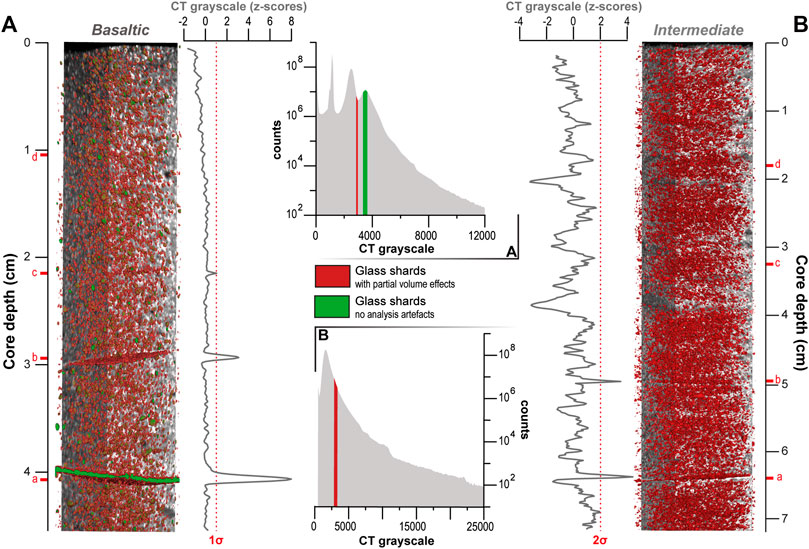
FIGURE 4. Inter-connected 2-D CT orthoslices and 3-D representations of horizons of basaltic (A) and intermediate (B) glass in the synthetic peat cores scanned for this study. The histograms show the grayscale value distribution of each scan in gray, while highlighting the range of partial-volume affected glass in red and pure glass in green. Down-core CT grayscale variability is plotted as standardized z-score values, marking one to two standard deviations (σ) with a stippled red line. The position of each artificial (crypto) tephra horizon is highlighted with a red dash (and letter).
Partial volume effects can be avoided by scanning at a resolution that is finer than the smallest detected particle volume (Maret et al., 2012). However, because of computational and analytical limitations (CT Scanning section), we could not achieve smaller (<20 µm) voxel sizes for this study. Instead, we opted for a different approach by spiking one of our analyzed natural sediment archives, core DB-2 from South Georgia (Oppedal et al., 2018; Conventionally Analyzed Natural Archives and Application on Natural Sediment Archives sections), with a cryptic (∼1,000 shard) CI horizon near the core top (Figure 6). In this way, partial volume effects impact the CT grayscale values of tephra standards and horizons in equal measure, so that the former can still be used to help pinpoint the density range of volcanic ash.
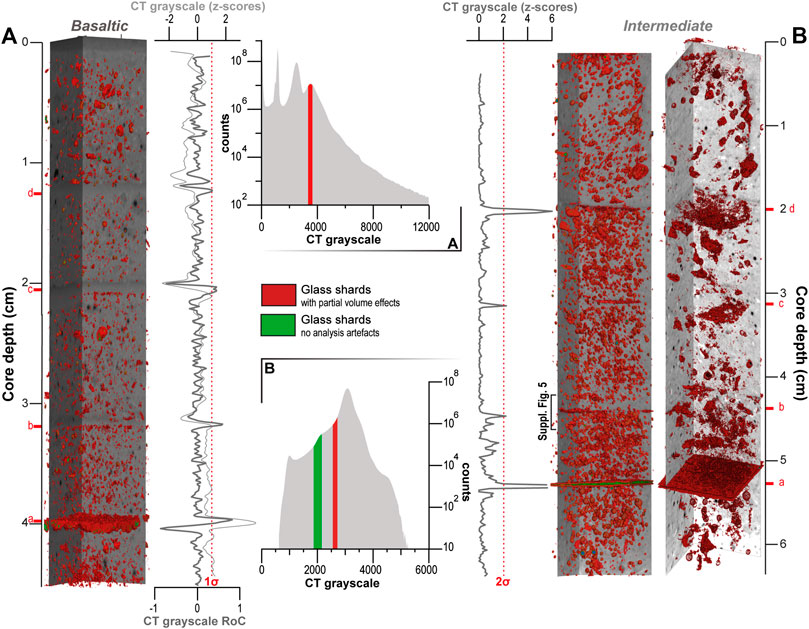
FIGURE 5. Inter-connected 2-D CT orthoslices and 3-D representations of horizons of basaltic (A) and intermediate (B) glass in the synthetic minerogenic cores scanned for this study. For the scanned intermediate phantom, we show visualizations based on unprocessed data (left) and following the extraction of porosity (right; also see Minerogenic section). The histograms show the grayscale value distribution of each scan in gray, while highlighting the range of partial-volume affected glass in red and pure glass in green. Down-core CT grayscale variability is plotted as standardized z-score values, and Rates of Change [RoC; panel (A) also see Minerogenic section]. A red stippled line shows the one to two σ range of RoC [panel (A)] and z-scores [panel (B)]. The position of each added glass horizon is highlighted with a red dash (and letter; Figure 1).
Experimental Findings
In general, our controlled experiment identified two easy and promising pathways to identify or highlight (cryptic) tephra horizons in comparatively homogenous sediments. First, by defining the CT grayscale distribution of volcanic ash using simple threshold-based segmentation before highlighting this range with a distinct color (red). Because of the different grayscale range of our epoxy-embedded standards (Calibration section) and as glass-dominated shards make up only ∼1% of scanned volumes, different density phases are often not captured by clear peaks in the histograms of Figures 3, 4, 5. This complicates objective identification of threshold values and compelled us to use synthetic horizons at known depths for reference. While this iterative approach may introduce significant levels of noise (Minerogenic section), it did allow us to detect cryptotephra horizons in most scanned phantoms and natural archives (also see Application on Natural Sediment Archives section). We would, however, like to stress that the analysis of more heterogeneous sediments with smaller amounts of ash requires a more advanced segmentation process (also see Bendle et al., 2015). We complement segmentation by a second means to quickly identify areas of interests: analyzing down-core variations in average CT grayscale values. For both approaches, we relied on a selected number of tools and modules in the Thermo Scientific Avizo software (specified in italics). As we will further discuss in the following paragraphs, the potential and limitations of both methods mostly depend on host sediment type and tephra layer thickness (shard count).
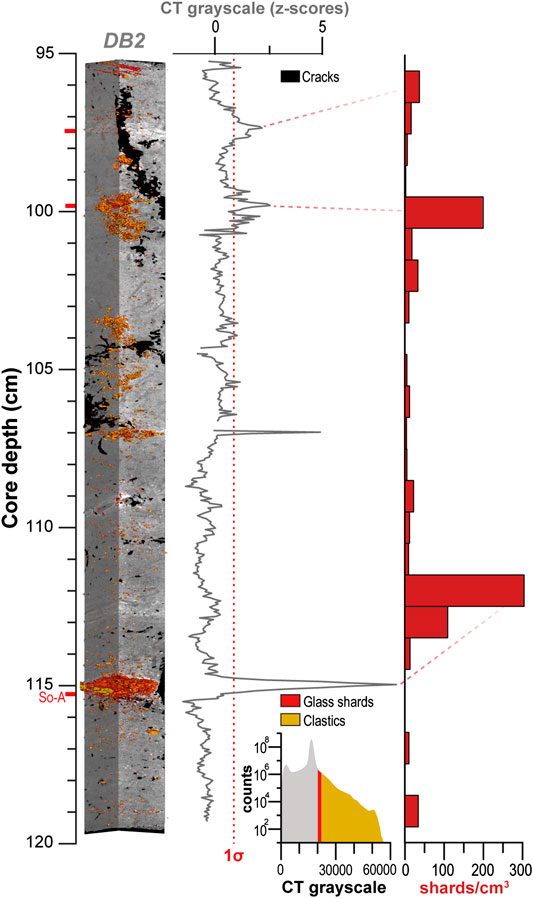
FIGURE 6. CT scans (2-D orthoslices and 3-D representations) and 1 cm resolution manual shard (>20 μm) counts of the analyzed 95–120 cm section of peat core DB-2 with red bars (Oppedal, van der Bilt, Balascio et al., 2018; Conventionally Analyzed Natural Archives section). The histogram highlights the grayscale value distribution of rhyolitic glass (red) and heavier clastic material (orange) dispersed throughout the core (including partial volume effects). We also highlight the color of cracks (black). Down-core CT grayscale variability is plotted as standardized (z-score) values, and the red stippled line shows the 1σ range of z-scores. Red dashes indicate horizons detected in both scans and counts.
Ice
In both our intermediate and basaltic synthetic ice cores, only the uppermost ∼500 shard horizon is invisible as can be seen in Figure 1—please note that light refraction between ice laminae creates a dark color contrast observed along transitions in both archives. Because of the substantial density difference between ice (∼0.9 g/cm3) and intermediate (2.3–2.5 g/cm3) as well as basaltic (>2.5 g/cm3) ash, even our most cryptic layer could be visualized with ease. The grayscale distribution of glass was determined from the reconstructed CT scans (or volume rendering in the Avizo software) using iterative threshold-based segmentation in the colormap editor of Avizo as detailed in Experimental Findings section. As observed in Figure 3, glass shards appear to have scattered vertically from the four horizons in each ice core. We attribute this to a combination of freezing before all shards could settle (reflected by the veneer of ash on top of our basaltic-glass-containing ice core; Figure 3A), and subsequent cracking of ice. While undesired and absent from natural ice archives, these artefacts highlight the ability of our setup to identify cryptic horizons that contain far fewer shards than ∼500.
Peat
With the exception of the grey-colored ∼70,000 shard basal intermediate layer (Figure 1), all horizons in our synthetic peat cores are invisible to the naked eye. In light of the similarly large density contrast between glass shards and the potting medium used as host sediment (∼1 g/cm3; Khan et al., 2006), we initially used the same simple threshold-based segmentation routine applied on the previously discussed phantom ice cores (Ice section) to help visualize cryptic deposits. Iterative assessment of the grayscale density distributions of volume-rendered 3-D scans allowed us to isolate the density range of glass, and highlight it in red with the Colormap editor. As seen in Figure 4, here this approach proved far less successful as we could only clearly visualize the lowermost tephra layers. In addition, the central part of the basal basaltic horizon—with ∼170,000 shards the thickest marker included in our experiment (Figure 1)—records higher grayscale values (green in Figure 4A). We argue that this deposit is sufficiently voluminous to remain unaffected by partial volume effects (Calibration section): voxels in the innermost section of this visible horizon capture the density of pure basaltic ash. Based on the highlighted grayscale data range, it also appears that material with a density that overlaps with the range of glass is dispersed throughout the host sediment of both scans. Contact with the manufacturer of the used potting medium revealed that pulverized chalk (garden lime) was added. This material has a density (∼2.5 g/cm3) that is near-identical to that of basaltic glass and overlaps with the range of glasses of intermediate composition, which explains the particularly noisy rendering of the synthetic core spiked with CI ash (Figure 4B). As with our basal basaltic glass horizon, the inner part of the largest particles appears unaffected by partial volume effects and yields higher density values owing to their large size. When host sediment (grain) size distributions are sufficiently different from the analyzed glass shards, which was not the case in our experiment (25–80 vs. 60 µm), it is possible to filter these particles out by specifying their volume range in the sieve analysis tool in Avizo. With the help of the Arithmetic module, selected grains can then be removed from CT reconstructions. This straightforward protocol can also be applied to natural peat archives, which often contain materials of a density near-similar to glass shards—for example wind-blown mineral dust (e.g., Kylander et al., 2016). In addition, statistical approaches such as unmixing techniques may help disentangle overlapping grayscale distributions into separate object classes (e.g., Paterson and Heslop, 2015). Hence, as with the scattering of shards in our phantom ice cores (Ice section), we gained valuable insight from the unintentional contamination of our peat phantoms with pulverized chalk. To help identify the thinner cryptic horizons, we also applied the SplineProbe module—plotting down-core density variability along a straight line at 180 µm resolution. As we show in Figure 4, this procedure only marginally improved detection by highlighting the second-thinnest ∼8,500 shard basaltic horizon as a peak outside the 1σ grayscale range. Our peat phantom spiked with intermediate ash reveals particularly noisy spline-probe data, likely because of the previously noted density overlap with chalk.
Minerogenic
Only the ∼170,000 shard basal basaltic tephra layer can be readily discerned with the naked eye in our minerogenic cores owing to its thickness and contrasting color (Figure 1). To identify the other horizons without the need for complex image processing approaches, we once again relied on a combination of segmentation, highlighting tephra grayscale values using the Colormap editor, as well as plotting down-core variations in CT grayscale values with the SplineProbe module, This proved challenging because of the minimal density difference between the silty clay host sediments (∼2.65 g/cm3) and intermediate (2.3–2.5 g/cm3) or basaltic (>2.5 g/cm3) glass. As discussed in Experimental Findings section, our iterative threshold-based approach to highlight the grayscale range of glass may introduce significant levels of noise in such cases. Figure 5 reveals that we could unambiguously visualize one (semi) cryptic deposit with the Colormap editor—the ∼70,000 shard lowermost horizon of intermediate composition. Imagery and histogram data furthermore reveal a bimodal CT grayscale distribution of ash in this layer. In line with previous interpretations (Calibration and Peat sections), we argue that voxel values inside this comparatively thick deposit are not affected by partial volume effects. The lower values here capture the true range of intermediate glass (2.3–2.5 g/cm3), unaffected by blending with grayscale values of denser (∼2.65 g/cm3) silty clay. As with our peat phantoms (Peat section), objects with a density that overlaps with the range of glass are scattered throughout our minerogenic cores, obscuring cryptotephra. This potential artifact is particularly visible amid intermediate horizons (Figure 5B). Closer investigation of the physical and visualized sediment texture of this core reveals a high degree of porosity (Supplementary Figure S2). We speculate that this may stem from our settling protocol as little compaction pressure could be applied owing to a low water column and a short period between sedimentation and scanning (Experimental Design section). Along the transition between air-filled pores (∼0.001 g/cm3) and silty clay (∼2.65 g/cm3), partial volume effects (Calibration section) create a gradient of different CT grayscale values. The specific density of intermediate ash (∼2.3–2.5 g/cm3) falls in this range, and is therefore also highlighted along the boundary of pores. To minimize this noise, we applied a porosity-extraction protocol in cooperation with Thermo Scientific (P. Westenberger, personal communication). Fundamentally, this approach identifies pores based on their size and shape with a closing operation, before subtracting them from the reconstructed CT scan with the Arithmetic module. A step-by-step overview of the entire operation is provided in the Supplementary Material (Supplementary Section 1.1; Supplementary Figure S3). As shown in Figure 5B, porosity extraction greatly improves the visibility of cryptic intermediate glass: while noise remains, all horizons can now be identified on the 3-D volume rendering. This approach could be complemented using established edge detection filters to remove the mixed grayscale values along the gradient between pores and sediment (e.g., Schlüter et al., 2010). To demonstrate this, we also applied the Sobel operator following the recommendations of Houston et al. (2013). As seen in Supplementary Figure S4, this further reduces noise levels. In natural archives, the applied protocols for identification and removal of pores could offer a promising avenue to highlight the presence of bioturbation burrows—a major source of reworking in marine tephra records. To further improve our ability to detect cryptotephra in both minerogenic phantoms, we plotted down-core changes in CT grayscale values with the SplineProbe module at 200 µm resolution. In case of the core spiked with basaltic ash, low-amplitude maxima that fall well within the 1σ range of variability mark the cryptic horizons (Figure 5A). Strikingly, these inconspicuous peaks are superseded by distinct minima. Based on the presence of faint contorted beds on CT orthoslices, we hypothesize that these low-density layers result from soft-sediment deformation (Mills, 1983)—formed when larger (∼80–125 µm) and heavier basaltic shards sink through the lighter underlying finer-grained (<63 µm) silty clay particles (Minerogenic section). Grain size analyses around the second-lowest cryptotephra horizon (n = 5), carried out at 0.1 cm intervals (Supplementary Section 1.1), confirm this notion by revealing a fining upward sequence (Supplementary Figure S5). To overcome the imprint of this secondary process and highlight sharp positive CT grayscale excursions associated with cryptic horizons, we calculated rates of change (RoC) for constant 200 µm depth intervals from the bottom up. As revealed in Figure 5A, this basic statistic distinguishes all cryptic horizons from background variability. Owing to the greater density difference between ash (∼2.3–2.5 g/cm3) and silty clay host sediment (∼2.65 g/cm3), CT grayscale data from our intermediate phantom required no processing. As seen in Figure 5B, normalized values from all cryptic horizons exceed the 2σ range. Following from the above, the SplineProbe module provides a promising and convenient approach to identify cryptotephra deposits down to ∼500 shards in minerogenic sediments.
Application on Natural Sediment Archives
The discussed results from our synthetic cores highlight the potential of CT data to distinguish invisible glass shard horizons (cryptotephra) from materials that make up the bulk of natural archives—ice, peat and minerogenic sediment. In the following paragraphs, we apply lessons learnt from this experiment on natural sediments where cryptotephras were previously identified using conventional methods. To raise the bar for this exercise, we focus on ash-host combinations that proved most complicated in our experiment: rhyolitic tephra in peat (core DB-2) and basaltic glass in minerogenic sediment (core GS15-198-36CC). We also try to improve upon our calibration effort (Calibration section) by spiking both cores with a cryptic (∼1,000 shard) horizon to locate the grayscale range of glass.
As seen in Figure 6, the approaches we successfully applied on our synthetic cores reasonably reproduce manual counts in peat core DB2. Especially toward the top, the density distribution of ash—highlighted using a synthetic cryptic horizon for reference (Calibration section)—and peaks in down-core CT grayscale values line up with shard maxima. Notable discrepancies do, however, exist between scans and counts. For example, offsets exist: this is particularly noticeable toward the lower part of the analyzed section of core DB2. As shown in Figure 6, the shard maximum of the So-A horizon presented by Oppedal et al. (2018) sits ∼2.5 cm higher up than its likely expression in our scan (115 cm). We argue that this disparity stems from a combination of 1) differences in sampling resolution—while manual samples were extracted at 1 cm intervals, DB2 was scanned at ∼20 µm resolution, 2) disturbance imparted during storage or (U-channel) sampling—Figure 6 shows the presence of cracks that were not present when glass shards were extracted, and 3) layer tilting—close investigation of the volume rendering of the So-A horizon at 115 cm reveals a ∼18° angle. In addition, millimeter-scale glass horizons detected on our scan, notably the ∼0.15 cm horizon at 107 cm depth, are not captured by shard maxima (Figure 6). We argue that such fine deposits are smoothed out by the coarser (max. 1 cm) sampling resolution of conventional analysis.
As seen in Figure 7, both volume rendering and SplineProbe data identify the manually counted cryptic basaltic shard maximum in the analyzed section of minerogenic core GS15-198-36CC. However, material of a near-similar density introduces noise and limits the usefulness of down-core CT grayscale variations for glass detection. Visual analysis of the sediments reveals the presence of unsorted sand-to gravel-sized clasts. Based on the core site near the glaciated East Greenland margin (Conventionally Analyzed Natural Archives section), we argue this IRD. While there is a detectable density difference (max. 0.3 g/cm3) between this material and basalt, partial volume effects complicate matters. The grayscale range of glass shards falls between that of the dense quartz of IRD and the porous silty clay of the surrounding sediment, and is therefore highlighted along the gradient of blended values found between both materials (Minerogenic section). We could thus visualize partial volume effects (Figure 7), reducing the need for advanced image analysis. In contrast with core DB2, offsets between CT data and shard maxima are small (∼1 cm) in core GS15-198-36CC and can be explained by differences in resolution between manual sampling (max. 1 cm) and scans (∼20 µm). Scanning and counting were carried out in rapid succession, limiting the potential for disturbance during storage. Finally, close inspection of imagery from the shard maximum around 20 cm depth reveals the presence of three closely-spaced cryptotephra horizons (Figure 7). Recent work shows that such series may represent successive eruptions instead of single isochrons (e.g., Óladóttir et al., 2019). Our results thus demonstrate the potential of CT scanning to help prevent such miscorrelation. Together with the discussed detection of millimeter-scale deposits in core DB2 that are not reflected by shard maxima, this finding highlights the potential of CT to ensure a suitable sampling strategy—contiguous 1 cm slices clearly do not always suffice.
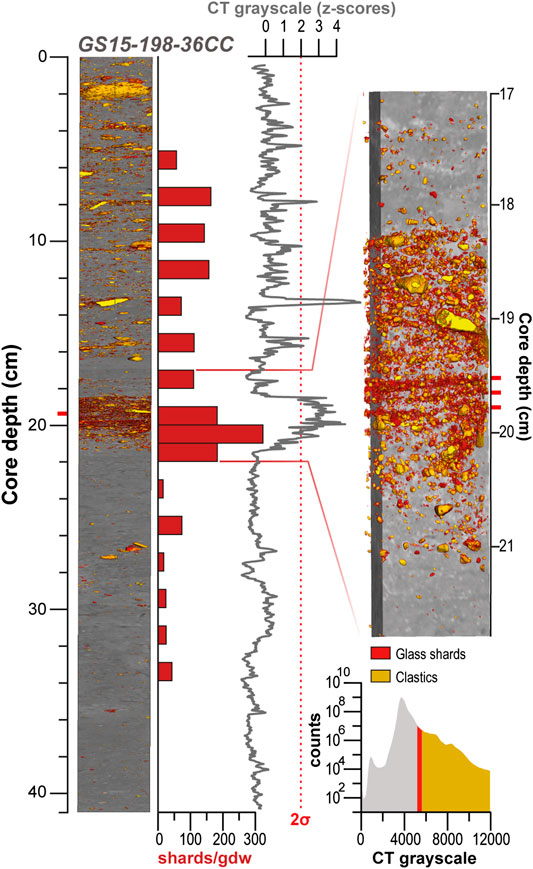
FIGURE 7. CT scans (2-D orthoslices and 3-D representations) with 1 cm resolution manual shard (>80 µm) counts of the analyzed 41 cm section of minerogenic marine core GS15-198-36CC with red bars. The histogram highlights the grayscale value distribution of basaltic tephra (red) and heavier clastic material (orange) dispersed throughout the core (including partial volume effects). Down-core CT grayscale variability is plotted as standardized (z-score) values, and the red stippled line shows the 2σ range of z-scores. Red dashes indicate horizons detected in both scans and counts. The inset on the right-hand side shows a close-up of the shard maximum around 20 cm depth, highlighting the presence of three closely-spaced cryptotephra horizons or series with red dashes.
Conclusion
This study highlights the potential of CT scanning to find cryptotephra horizons with glass-shard concentrations as low as ∼500 shards in three common geological archives—ice cores, peat and minerogenic sediments. The presented approach is broadly applicable as we generated most of the presented results with two basic image processing techniques—plotting down-core grayscale variability and simple threshold-based segmentation using the SplineProbe module and Colormap editor, respectively, in the Avizo software—that can be readily mastered by tephrochronologists. Using these easily applicable tools in our experimental setup, we were able to identify every cryptotephra in all but our peat phantoms (Peat section). Here, chalk in the Sphagnum potting mix used as host sediment introduces noise as this material has a density that is near-identical to glass. While undesired, this and other experimental design flaws provided valuable insights for CT analysis of natural archives to 1) visualize individual shards in ice cores (Ice section), 2) remove material of a density similar to glass such as wind-blown aerosols or IRD (Peat section), and 3) highlight porous structures including bioturbation burrows (Minerogenic section). From a technical perspective, we show that the use of narrow extracts like U-channels allows us to combine the convenience of whole-core medical scans with the µm-resolution of micro-CT systems. The use of a CT scanner customized for core analysis was critical to help strike this balance. Applying lessons learnt on natural archives with manually counted cryptotephra horizons, we achieved encouraging results on ash-host sediment combinations that proved most complicated in our experiment—notably intermediate and rhyolitic glass shard horizons in peat. Scanning of natural sediment archives furthermore underscores the value of CT scanning to optimize sampling strategies by 1) highlighting ultra-thin tephra horizons that are not captured in 1 cm resolution shard concentration profiles, and 2) identifying tephra series—closely-spaced cryptic deposits that may be misinterpreted as single horizons (Óladóttir et al., 2019). Finally, we identify four promising avenues for future work: 1) further expansion of our experimental design, for example by using a broader range of glass compositions and host sediment types, amounts or size fractions, 2) application on natural archives selected for tephra analysis to help design an optimal sampling strategy, focus sample extraction for geochemical analysis and assess replicability between scans and counts, 3) usage of different scanning settings (e.g., exposure time, current, voltage) or filters to reduce image noise or improve contrast, and 4) closer collaboration with image processing experts, notably to develop more sophisticated segmentation approaches to distinguish tephra from host sediments.
Data Availability Statement
The raw data supporting the conclusions of this article will be made available by the authors, without undue reservation.
Author Contributions
All authors contributed to each section of this manuscript. WB, ES, and JC designed this study. JC generated the synthetic phantoms, CT-scanned all cores and processed the data with WB and ES. SB and SR provided natural manually counted archives and analyzed the ash that was used to spike our synthetic records. WB led the writing process and drafted all figures.
Funding
This work has been supported by the European Research Council (ERC) H2020 program (Grant No. 610055: ice2ice), the Research Council of Norway (NFR) grant 267719 (SOUTHSPHERE), and the Centre for Climate Dynamics at the Bjerknes Centre (SKD) as part of the DISECT project.
Conflict of Interest
The authors declare that the research was conducted in the absence of any commercial or financial relationships that could be construed as a potential conflict of interest
Acknowledgments
We want to thank Christine Lane, Haflidi Haflidason, and Lea Oppedal for sharing material. Finally, we would like to express our gratitude to all reviewers that helped improve this manuscript.
Supplementary Material
The Supplementary Material for this article can be found online at: https://www.frontiersin.org/articles/10.3389/feart.2020.622386/full#supplementary-material.
References
Abbott, P. M., and Davies, S. M. (2012). Volcanism and the Greenland ice-cores: the tephra record. Earth Sci. Rev 115, 173–191. doi:10.1016/j.earscirev.2012.09.001
Abbott, P. M., Griggs, A. J., Bourne, A. J., Chapman, M. R., and Davies, S. M. (2018). Tracing marine cryptotephras in the North Atlantic during the last glacial period: improving the North Atlantic marine tephrostratigraphic framework. Quat. Sci. Rev 189, 169–186. doi:10.1016/j.quascirev.2018.03.023
Andrews, J. T., Eberl, D., and Kristjansdottir, G. B. (2006). An exploratory method to detect tephras from quantitative XRD scans: examples from Iceland and east Greenland marine sediments. Holocene 16, 1035–1042. doi:10.1177/0959683606069384
Balascio, N. L., Francus, P., Bradley, R. S., Schupack, B. B., Miller, G. H., Kvisvik, B. C., et al. (2015). “Investigating the use of scanning X-ray fluorescence to locate cryptotephra in minerogenic lacustrine sediment: experimental results,” in Micro-XRF studies of sediment cores Editors I. W. Croudace, and R. G. Rothwell (Berlin, Germany: Springer), 305–324.
Bendle, J. M., Palmer, A. P., and Carr, S. J. (2015). A comparison of micro-CT and thin section analysis of Lateglacial glaciolacustrine varves from Glen Roy, Scotland. Quat. Sci. Rev 114, 61–77. doi:10.1016/j.quascirev.2015.02.008
Berben, S. M. P., Dokken, T. M., Abbott, P. M., Cook, E., Sadatzki, H., Simon, M. H., et al. (2020). Independent tephrochronological evidence for rapid and synchronous oceanic and atmospheric temperature rises over the Greenland stadial-interstadial transitions between ca. 32 and 40 ka b2k. Quat. Sci. Rev 236, 106277. doi:10.1016/j.quascirev.2020.106277
Bigler, M., Svensson, A., Steffensen, J. P., and Kaufmann, P. (2007). A new continuous high-resolution detection system for sulphate in ice cores. Ann. Glaciol 45, 178–182. 10.3189/17275640778228247
Blockley, S. P. E., Pyne-O’donnell, S. D. F., Lowe, J. J., Matthews, I. P., Stone, A., Pollard, A. M., et al. (2005). A new and less destructive laboratory procedure for the physical separation of distal glass tephra shards from sediments. Quat. Sci. Rev 24, 1952–1960. doi:10.1016/j.quascirev.2004.12.008
Bourne, A., Cook, E., Abbott, P., Seierstad, I. K., Steffensen, J. P., Svensson, A., et al. (2015). A tephra lattice for Greenland and a reconstruction of volcanic events spanning 25–45 ka b2k. Quat. Sci. Rev 118, 122–141. doi:10.1016/j.quascirev.2014.07.017
Brooks, R. A., and Di Chiro, G. (1976). Beam hardening in x-ray reconstructive tomography. Phys. Med. Biol 21, 390–398. doi:10.1088/0031-9155/21/3/004
Bryant, J. A., Drage, N. A., and Richmond, S. (2012). CT number definition. Radiat. Phys. Chem 81, 358–361. doi:10.1016/j.radphyschem.2011.12.026
Cnudde, V., and Boone, M. N. (2013). High-resolution X-ray computed tomography in geosciences: a review of the current technology and applications. Earth Sci. Rev 123, 1–17. doi:10.1016/j.earscirev.2013.04.003
Cnudde, V., Masschaele, B., Dierick, M., Vlassenbroeck, J., Van Hoorebeke, L., and Jacobs, P. (2006). Recent progress in X-ray CT as a geosciences tool. Appl. Geochem 21, 826–832. doi:10.1016/j.apgeochem.2006.02.010
Davies, S. M. (2015). Cryptotephras: the revolution in correlation and precision dating. J. Quat. Sci 30, 114–130. doi:10.1002/jqs.2766
Du Plessis, A., Le Roux, S. G., and Guelpa, A. (2016). Comparison of medical and industrial X-ray computed tomography for non-destructive testing. Case Stud. Nondestr. Test. Eval 6, 17–25. doi:10.1016/j.csndt.2016.07.001
Dugmore, A. (1989). Icelandic volcanic ash in Scotland. Scot. Geogr. Mag 105, 168–172. doi:10.1080/14702548908554430
Dugmore, A., and Newton, A. (1992). Thin tephra layers in peat revealed by X-radiography. J. Archaeol. Sci 19, 163–170. doi:10.1016/0305-4403(92)90047-7
Evans, E. E., Davies, S. M., and Johnston, R. (2017). Phantom creation and analysis: improving x-ray microtomography scanning of soft sediment cores containing volcanic ash. J. Phys.: Conf. Ser 849, 012012. doi:10.1088/1742-6596/849/1/012012
Gehrels, M. J., Newnham, R. M., Lowe, D. J., Wynne, S., Hazell, Z. J., and Caseldine, C. (2008). Towards rapid assay of cryptotephra in peat cores: review and evaluation of various methods. Quat. Int 178, 68–84. doi:10.1016/j.quaint.2006.10.014
Glover, G., and Pelc, N. (1980). Nonlinear partial volume artifacts in x-ray computed tomography. Med. Phys 7, 238–248. doi:10.1118/1.594678
Griggs, A. J., Davies, S. M., Abbott, P. M., Coleman, M., Palmer, A. P., Rasmussen, T. L., et al. (2015). Visualizing tephra deposits and sedimentary processes in the marine environment: the potential of X-ray microtomography. Geochem. Geophys. Geosyst 16, 4329–4343. doi:10.1002/2015GC006073
Griggs, A. J., Davies, S. M., Abbott, P. M., Rasmussen, T. L., and Palmer, A. P. (2014). Optimising the use of marine tephrochronology in the North Atlantic: a detailed investigation of the Faroe Marine Ash Zones II, III and IV. Quat. Sci. Rev 106, 122–139. doi:10.1016/j.quascirev.2014.04.031
Hall, V. A., and Pilcher, J. R. (2002). Late-Quaternary Icelandic tephras in Ireland and great Britain: detection, characterization and usefulness. Holocene 12, 223–230. doi:10.1191/0959683602hl538rr
Hayward, C. (2011). High spatial resolution electron probe microanalysis of tephras and melt inclusions without beam-induced chemical modification. Holocene 22, 119–125. doi:10.1177/0959683611409777
Houston, A. N., Schmidt, S., Tarquis, A. M., Otten, W., Baveye, P. C., and Hapca, S. M. (2013). Effect of scanning and image reconstruction settings in X-ray computed microtomography on quality and segmentation of 3D soil images. Geoderma 207, 154–165. doi:10.1016/j.geoderma.2013.05.017
Kalender, W. A. (2011). Computed tomography: fundamentals, system technology, image quality, applications (Hoboken, United States: John Wiley & Sons).
Khan, M. M., Khan, M. A., Abbas, M., Jaskani, M. J., Ali, M. A., and Abbas, H. (2006). Evaluation of potting media for the production of rough lemon nursery stock. Pak. J. Bot 38, 623–629.
Kylander, M. E., Lind, E. M., Wastegård, S., and Löwemark, L. (2012). Recommendations for using XRF core scanning as a tool in tephrochronology. Holocene 22, 371–375. doi:10.1177/0959683611423688
Leifeld, J., and Kögel-Knabner, I. (2001). Organic carbon and nitrogen in fine soil fractions after treatment with hydrogen peroxide. Soil Biol. Biochem 33, 2155–2158. doi:10.1016/S0038-0717(01)00127-4
Loame, R., Lowe, D., Johnston, R., Evans, E., Pittari, A., Moon, V., et al. (2018). “CT and micro‐CT scanning of liquefied tephra deposits in∼ 22,000‐yr‐old lake sediments, central Waikato region, New Zealand, and implications,” in Book of abstracts, crossing new frontiers: INTAV international field conference on tephrochronology,‘tephra hunt in transylvania,’ Moieciu de Sus, RO, June 24–July 1, 2018, 93.
Lowe, D. J. (2011). Tephrochronology and its application: a review. Quat. Geochronol 6, 107–153. doi:10.1016/j.quageo.2010.08.003
Lowe, D. J., Hogg, A. G., and Hendy, C. H. (1980). “Detection of thin tephra deposits in peat and organic lake sediments by rapid X-radiography and X-ray fluorescence techniques,” in Tephra workshop (Kelbum, New Zealand: Victoria University of Wellington), 74–77.
Lowe, D. J., and Hunt, J. B. (2001). “A summary of terminology used in tephra-related studies,” in Tephras: chronology, archaeology Editors E. T. Juvigne, and J.-P. Raynal (Les Dossiers de l’Archeo-Logis), 1, 17–22.
Mackie, E. A. V., Davies, S. M., Turney, C. S. M., Dobbyn, K., Lowe, J. J., and Hill, P. G. (2002). The use of magnetic separation techniques to detect basaltic microtephra in last glacial-interglacial transition (LGIT; 15–10 ka cal. BP) sediment sequences in Scotland. Scot. J. Geol 38, 21–30. doi:10.1144/sjg38010021
Maret, D., Telmon, N., Peters, O. A., Lepage, B., Treil, J., Inglèse, J., et al. (2012). Effect of voxel size on the accuracy of 3D reconstructions with cone beam CT. Dentomaxillofac. Radiol 41, 649–655. doi:10.1259/dmfr/81804525
Mills, P. C. (1983). Genesis and diagnostic value of soft-sediment deformation structures—a review. Sediment. Geol 35, 83–104. doi:10.1016/0037-0738(83)90046-5
Óladóttir, B. A., Thordarson, T., Geirsdóttir, Á., Jóhannsdóttir, G. E., and Mangerud, J. (2019). The Saksunarvatn Ash and the G10ka series tephra. Review and current state of knowledge. Quat. Geochronol 56, 101041. doi:10.1016/j.quageo.2019.101041
Oppedal, L. T., Van Der Bilt, W. G. M., Balascio, N. L., and Bakke, J. (2018). Patagonian ash on sub‐Antarctic South Georgia: expanding the tephrostratigraphy of southern South America into the Atlantic sector of the Southern Ocean. J. Quat. Sci 33, 482–486. doi:10.1002/jqs.3035
Paterne, M., Guichard, F., and Labeyrie, J. (1988). Explosive activity of the South Italian volcanoes during the past 80,000 years as determined by marine tephrochronology. J. Volcanol. Geoth. Res 34, 153–172. doi:10.1016/0377-0273(88)90030-3
Paterson, G. A., and Heslop, D. ((2015). New methods for unmixing sediment grain size data. Geochemistry, Geophysics, Geosystems (G3). 16, 4494–4506. doi:10.1002/2015GC006070
Payne, R., and Gehrels, M. (2010). The formation of tephra layers in peatlands: an experimental approach. Catena 81, 12–23. doi:10.1016/j.catena.2009.12.001
Persson, C. (1970). Tephrochronological investigation of peat deposits in Scandinavia and on the Faroe Islands (Uppsala: The Geological Survey of Sweden).
Peters, C., Austin, W. E., Walden, J., and Hibbert, F. D. (2010). Magnetic characterisation and correlation of a younger dryas tephra in North Atlantic marine sediments. J. Quat. Sci 25, 339–347. doi:10.1002/jqs.1320
Poppe, L., Paskevich, V., Hathaway, J., and Blackwood, D. (2001). A laboratory manual for x-ray powder diffraction. US Geological Survey Open-File Report No.: 1, 1–88.
Schlüter, S., Weller, U., and Vogel, H.-J. (2010). Segmentation of x-ray microtomography images of soil using gradient masks. Comput. Geosci 36, 1246–1251. doi:10.1016/j.cageo.2010.02.007
Sigmundsson, F., Hreinsdóttir, S., Hooper, A., Arnadóttir, T., Pedersen, R., Roberts, M. J., et al. (2010). Intrusion triggering of the 2010 Eyjafjallajökull explosive eruption. Nature 468, 426–430. doi:10.1038/nature09558
Turney, C. S. M. (1998). Extraction of rhyolitic component of Vedde microtephra from minerogenic lake sediments. J. Paleolimnol 19, 199–206. doi:10.1023/A:1007926322026
Van Der Bilt, W. G. M., and Lane, C. S. (2019). Lake sediments with Azorean tephra reveal ice-free conditions on coastal northwest Spitsbergen during the Last Glacial Maximum. Sci. Adv 5, eaaw5980. doi:10.1126/sciadv.aaw5980
Veres, D., Lane, C. S., Timar-Gabor, A., Hambach, U., Constantin, D., Szakács, A., et al. (2013). The campanian ignimbrite/Y5 tephra layer–a regional stratigraphic marker for isotope stage 3 deposits in the Lower Danube region, Romania. Quat. Int 293, 22–33. doi:10.1016/j.quaint.2012.02.042
Keywords: tephra, synthetic cores (phantoms), CT X-ray, peat, minerogenic, ice core
Citation: van der Bilt WGM, Cederstrøm JM, Støren EWN, Berben SMP and Rutledal S (2021) Rapid Tephra Identification in Geological Archives With Computed Tomography: Experimental Results and Natural Applications. Front. Earth Sci. 8:622386. doi: 10.3389/feart.2020.622386
Received: 28 October 2020; Accepted: 17 December 2020;
Published: 28 January 2021.
Edited by:
Roberto Sulpizio, University of Bari Aldo Moro, ItalyReviewed by:
David James Lowe, University of Waikato, New ZealandDaniela Mele, University of Bari Aldo Moro, Italy
Copyright © 2021 van der Bilt, Cederstrøm, Støren, Berben and Rutledal. This is an open-access article distributed under the terms of the Creative Commons Attribution License (CC BY). The use, distribution or reproduction in other forums is permitted, provided the original author(s) and the copyright owner(s) are credited and that the original publication in this journal is cited, in accordance with accepted academic practice. No use, distribution or reproduction is permitted which does not comply with these terms.
*Correspondence: Willem G. M. van der Bilt, d2lsbGVtdmFuZGVyYmlsdEB1aWIubm8=