 Zhou Zhao
 Zeng yuan Liu1
 Chong Xu
- 1College of Geology and Environment, Xi'an University of Science and Technology, Xi'an, China
- 2National Institute of Natural Hazards, Ministry of Emergency Management of China, Beijing, China
Landslide susceptibility mapping is very important for landslide risk evaluation and land use planning. Toward this end, this paper presents a case study in Ningqiang County, Shanxi Province, China. Slope units were selected as the basic mapping units. A traditional statistical certainty factor model (CF), a machine learning support vector machine model (SVM) and random forest model (RF), along with a hybrid CF-SVM model and a CF-RF model were applied to analyze landslide susceptibility. Firstly, 10 landslide conditioning factors were selected, namely slope-angle, altitude, slope aspect, degree of relief, lithology, distance to rivers, distance to faults, distance to roads, average annual rainfall and normalized difference vegetation index. The 23,169 slope units were generated from a Digital Elevation Model and the corresponding 10 conditioning factor layers were produced from both geological and geographical data. Then, landslide susceptibility mapping was carried out using the five models, respectively. Next, the landslide density (LD), frequency ratio (FR), the area under the curve (AUC) and other indicators were used to validate the rationality, performance and accuracy of the models. The results showed that the susceptibility maps produced from the different models were all reasonable. In each map, the LD and FR were greatest in the zones classed as having very high landslide susceptibility, followed by the high, moderate, low and very low landslide susceptibility classes, respectively. From the comparison of the different maps and ROC curves, the RF model based on slope units was the most appropriate for landslide susceptibility mapping in the study area. It was also found that the combination of weaker learner model (CF model here) with a stronger learner model (SVM and RF model here) can impact the applicability of the stronger model.
Introduction
As one of Earth’s major geological hazards, landslides are widely distributed and occur at a high frequency, causing heavy damage, which often leads to huge economic losses and casualties. Landslide susceptibility mapping is important for the prevention and mitigation of such hazards. In recent years, landslide susceptibility mapping based on GIS technology has gradually become the focus of landslide research (Tien Bui et al., 2012; Chen et al., 2014; Chen and Li, 2020; Chen et al., 2021). In this field of research, the selection of the mapping unit and the choice of the susceptibility analysis method are two main components which impact the accuracy of the resulting landslide susceptibility map.
The mapping unit is the smallest indivisible unit of space used in the landslide susceptibility analysis, which can be either regular or irregular. According to current research, all units can be classified into five types (Table 1): grid units, terrain units, unique condition units, slope units and topographic units (Guzzetti et al., 1999). The advantages and limitations of each type of unit are just shown in Table 1. Among all of these types of mapping units, grid units are the most widely used for medium or small-scale landslide susceptibility zonation because they are easy to calculate and use for spatial analysis (Feizizadeh et al., 2017; Dang et al., 2019; Nam and Wang, 2020; Chen et al., 2021). However, grid units are not related closely to geological environments. For large-scale studies, with the support of abundant geological and geomorphic data, high-resolution satellite images and detailed landslide survey data, a more accurate landslide susceptibility map can be obtained by using GIS-based slope units (Guzzetti et al., 1999; Erener and Düzgün, 2011; Ba et al., 2018).
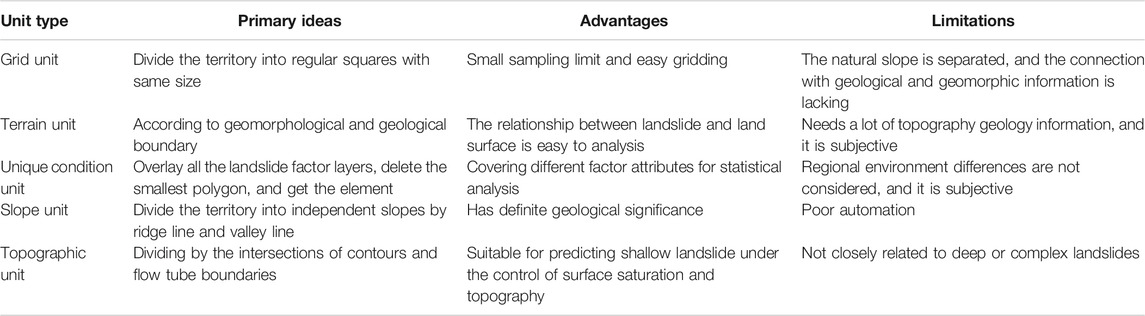
TABLE 1. Classification and characteristics of different mapping units.
The analysis methods for landslide susceptibility mapping can be categorized into statistical and machine learning methods. The learning ability of the first type of method is relatively weak and mainly includes the analytic hierarchy process model (Park et al., 2012; Kayastha et al., 2013), the information value model (Lin and Tung, 2004; Sarkar et al., 2013; Sharma et al., 2014; Tan et al., 2015), the certainty factor model (Binaghi et al., 1998; Pistocchi et al., 2002) and the logistic regression model (Ohlmacher and Davis, 2003; Ercanoglu and Temiz, 2011; Das et al., 2012; Regmi et al., 2013; Lee et al., 2014). The second type of method generally has a stronger learning ability and mainly includes the support vector machine model (Tien Bui et al., 2012; Feizizadeh et al., 2017), the random forest model (Youssef et al., 2016; Behnia and Blais-Stevens, 2018; Dang et al., 2019; Nam and Wang, 2020) and the adaptive-network-based fuzzy inference model (Chen et al., 2021), among others. Although certain models have been used for landslide susceptibility mapping in specific areas, there has been no model put forward that can be used across all kinds of landslide conditions. Therefore, in recent years, landslide mapping methods have changed from single-model to hybrid-model approaches (Nieto et al., 2015; Meng et al., 2016; Zhou et al., 2016; Moayedi et al., 2018; Mokarram and Zarei, 2018; Dou et al., 2020; Li and Chen, 2020; Zhao and Chen, 2020). In this way, not only can different models learn from each other, allowing optimization of the evaluation results, but they can also be applied to different geological conditions.
This study was based on Ningqiang County, which is located in the hinterland of the Qinba Mountains of China. Landslides are one of the most frequent and severe geological hazards in the area, and geological and geomorphological conditions in the area have a significant impact on landslide occurrence and distribution. Initially, we completed a 1:50,000 scale landslide survey, documenting detailed landslide characteristics and geological data about the area. How to make full use of such materials to obtain more accurate landslide susceptibility zonation maps is of great practical significance for landslide risk evaluation and land use planning in Ningqiang County. Based on the above comparison of the different types of mapping units, combined with knowledge from the landslide survey, we choose slope units as the basic unit type for the landslide susceptibility mapping. For the analysis methods, we focused mainly on the application of existing mature models to produce more reliable landslide susceptibility maps, rather than exploring and trying the latest models. Therefore, the certainty factor model (CF), the support vector machine model (SVM) and the random forest model (RF) were applied. The CF model is a widely used statistical model with a weak learning ability, while the SVM and RF models are two machine learning models which have been often used in recent years and have strong learning abilities. In addition, in order to explore the effects of a hybrid approach, the CF model was coupled with the SVM model (named the CF-SVM model) and the RF model (named the CF-RF model), respectively, and these were also applied to analyze landslide susceptibility in this area.
Study Area
Ningqiang County is located in the southwest corner of Shaanxi Province, between 105°21°10″–106°35°18″ N and 32°37°06 ″–33°12°42″ E, with a total area of about 3246 km2 (Figure 1). It lies in the Qinba Mountains, with an elevation from 520 m to 2103 m above sea level according to Digital Elevation Model (DEM) data. This area has a subtropical humid monsoon climate, with an annual average temperature 13.5°C and annual precipitation of 960–1600 mm. Two major river systems, the Jialing River and the Han River, flow through this district with a network density of 1.4 km/km2. Geologically, the lithology in the study area included phyllite, sandstone, shale and limestone. While, alluvium, eluvium, slopewash and some clay materials (collectively referred to as accumulations) are extensively distributed in the area. Tectonically, the Kunlun-Qinling fold system and other major faults may have a large influence on slope stability in the study area. Due to these complex geological conditions, Ningqiang County has become a well-studied area for landslide susceptibility analysis in the Qinba Mountains. There were 332 landslides (including landslides and potential landslides) recorded in the landslide survey of the region, which were largely affected by the surrounding geological conditions, especially the fault lines, lithology, rainfall and slope characteristics (Zhao et al., 2012).
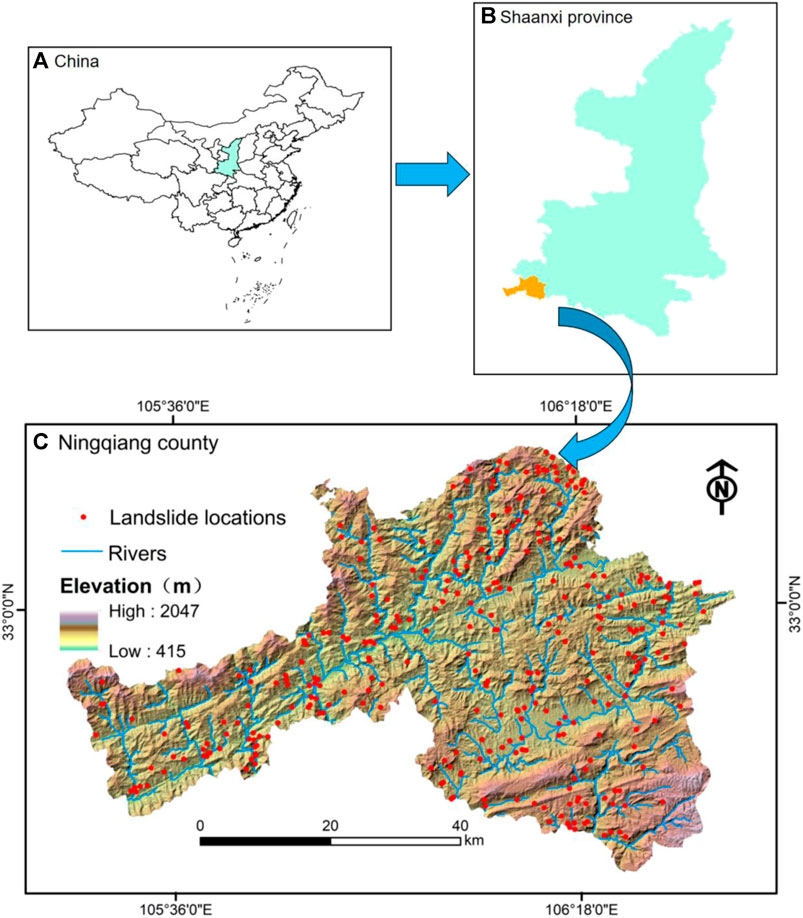
FIGURE 1. The location of Ningqiang County, Shaanxi Province and distribution of landslides.
Methodology
The objective of this work was to produce a more accurate landslide susceptibility map for Ningqiang County by comparative analysis of the certainty factor model (CF), the support vector machine model (SVM), the random forest model (RF), the certainty factor-support vector machine model (CF-SVM) and the certainty factor-random forest model (CF-RF) based on slope units. A flowchart of the applied methodology is shown in Figure 2, which shows the key steps undertaken in the study, which include the landslide survey, preparation of the landslide conditioning factors, model evaluation and map generation, results comparison, model choice, and determination of the final landslide susceptibility map.
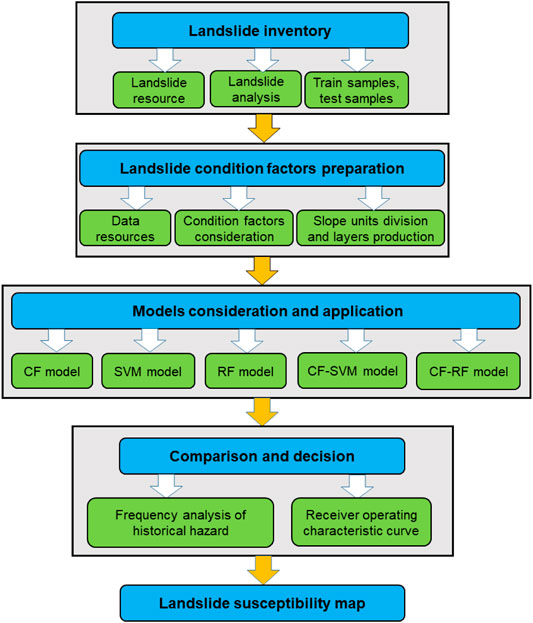
FIGURE 2. Flow chart of the study.
Data Preparation
Data Resources
The data sources used in this study included: 1) 30 m resolution DEM; 2) Landsat-8 satellite remote sensing images; 3) topographic and geological maps of 1: 50,000 scale; 4) real-time monitoring data of rainfall; and 5) existing reports and field survey data of landslides.
Slope Unit Production
Compared with traditional grid cells, slope units are able to better reflect the actual environmental conditions that lead to landslide development and have definite geological significance. In this work, the hydrological analysis module of ArcGIS was used to produce the slope units for the landslide susceptibility mapping from DEM data. A total of 23,169 slope units were obtained, of which the minimum area was 900 m2 and the maximum area was 1,690,200 m2 (Figure 3).
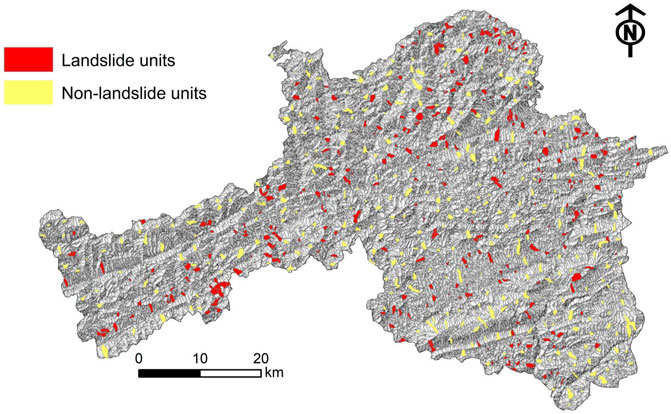
FIGURE 3. Slope unit division of the map.
Landslide Inventory
A landslide inventory map defines the location and type of existing landslides. It is very important to determine the location of landslides during landslide susceptibility mapping. In order to produce a detailed and reliable landslides inventory map, a comprehensive field survey on the scale of 1:50,000 was performed in the study area, in addition to the collection of relevant reports and photos that were available.
A total of 332 landslides were identified and mapped (Figure 1) (landslide location is indicated by the centroids on the map). An analysis of the map showed a large proportion (98%) of these landslides were shallow landslides, with slide body thicknesses of less than 10 m. The smallest landslide was about 120 m2, the largest was about 5.0 × 10⁵ m2 and the average was about 2.5 × 10⁴ m2. Centroids were used to represent the corresponding landslide locations. There were 198 landslides distributed on convex slopes, 84 on concave slopes, 150 on 30°–40° slopes and 166 on 10–60 m high slopes.
For training and testing the models, the same number of non-landslides (332 non-landslides) were generated on ArcGIS and all of the landslides and non-landslides were randomly divided into two datasets: 70% (a total of 464 samples) for training the models and 30% (a total of 200 samples) for validation.
Conditioning Factor Preparation
From the data available and the characteristics of the surveyed landslides, this study selected 10 factors of landslide susceptibility: slope-angle, altitude, slope aspect, degree of relief, lithology, distance to rivers, distance to faults, distance to roads, average annual rainfall and the normalized difference vegetation index (NDVI).
When a map of slope units is formed, thematic layers for each landslide conditioning factor are produced. As some conditioning factors were extracted from grid data sources, such as altitude data from DEM, these layers had to be converted into slope units. This was done using the regional analysis function of ArcGIS (Figure 4).
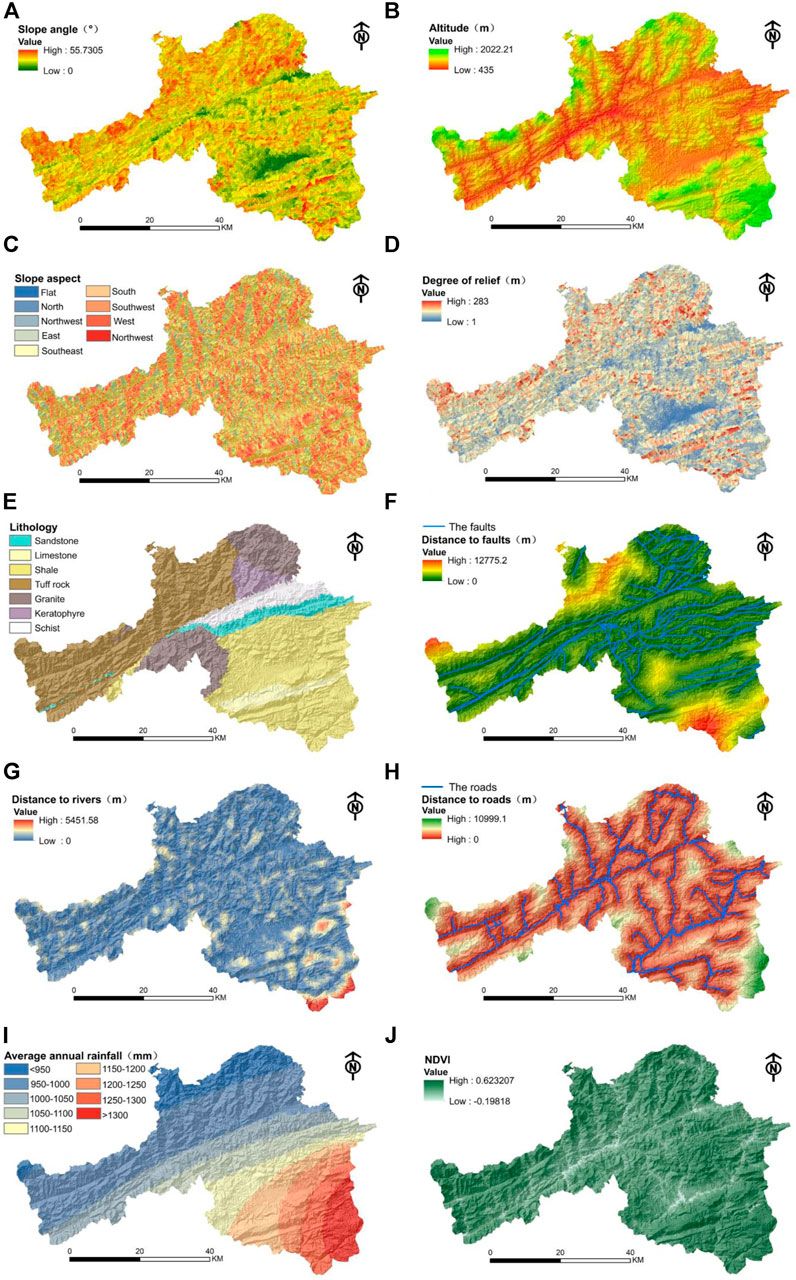
FIGURE 4. Conditioning factor maps based on slope units. (A) slope-angle, (B) altitude, (C) slope-aspect, (D) degree of relief, (E) lithology, (F) distance to faults, (G) distance to rivers, (H) distance to roads, (I) annual average rainfall, (J) Normalized difference vegetation index (NDVI).
(1) Digital Elevation Model and Derivatives
The DEM of the study area was used to extract different conditioning factors such as slope-angle, altitude, slope-aspect, degree of relief, etc. Slope-angle is the degree of steepness of the surface unit, which is often expressed by the ratio of the vertical height of the slope to the horizontal distance. The size of the slope-angle has an impact on the stability of the slope, which affects the occurrence of landslides. From the DEM data of Ningqiang County, the slope information in the study area was extracted using ArcGIS terrain analysis and divided into the following four categories: 0–15°, 15–20°, 20–25°and >25° (Figure 4A; Table 2). The altitude information was extracted and divided into the following five categories: < 800m, 800m–1000m, 1000m–1200m, 1200m–1400m, 1400m–1600 m and >1600 m (Figure 4B; Table 2).
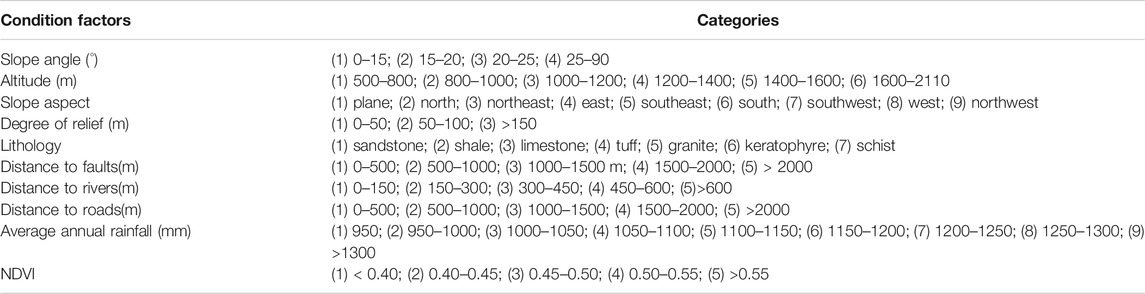
TABLE 2. Conditioning factor categories.
The slope aspect information was divided into the following nine categories: plane, north, northeast, east, southeast, south, southwest, west and northwest (Figure 4C; Table 2). The degree of relief was divided into three categories: 0–50 m, 50–100 m and >150 m (Figure 4D; Table 2).
(2)Lithology
Lithology describes the source material that the landslide is formed from, and different types of lithology have different influences on landslides. Based on the 1:50,000 geological map of Ningqiang County, the lithology in the study area can be divided into the following seven categories: sandstone, shale, limestone, tuff, granite, keratophyre and schist (Figure 4E; Table 2).
(3)Distance to Faults, Rivers and Roads
Due to the effect of stress, many cracks can be produced in rock and soil around fault zones, providing channels for infiltration and recharge of groundwater. This can enhance erosion of river banks, reducing the rock strength of slopes. Engineering activities during road construction can also affect the stability of slopes and induce landslides. Based on buffer analysis, the distance to faults was divided into five categories: 0–500 m, 500–1000 m, 1000–1500 m, 1500–2000 m and >2000 m (Figure 4F; Table 2); the distance to rivers was divided into five categories: 0–150 m,150–300 m,300–450 m, 450–600 m and >600 m (Figure 4G; Table 2); and the distance to roads was divided into five categories: 0–500 m, 500–1000 m, 1000–1500 m, 1500–2000 m and >2000 m (Figure 4H; Table 2).
(4)Rainfall
Rainfall is one of the main factors that induces landslides, as it can increase the weight of the sliding body and decrease the strength of rock and soil on the slope. Based on data collected from meteorological stations in the study area the annual average rainfall was divided into the following nine categories: <950 mm, 950–1000 mm, 1000–1050 mm, 1050–1100 mm, 1100–1150 mm, 1150–1200 mm, 1200–1250 mm, 1250–1300 mm and >1300 mm (Figure 4I; Table 2).
(5)Normalized Difference Vegetation Index (NDVI)
Normalized difference vegetation index (NDVI) is an indicator of vegetation growth and spatial distribution, which characterizes the surface vegetation cover. Based on the Landsat-8 satellite remote sensing images in the study area, the NDVI was divided into five categories: < 0.40, 0.40–0.45, 0.45–0.50, 0.50–0.55 and >0.55 (Figure 4J; Table 2).
Multi-Collinearity Diagnostics
All the training data and test data were imported into SPSS software for multi-collinear diagnostic analysis, and the diagnostic results were shown in Table 3. It can be seen from the table that among the 10 landslide condition factors selected this time, the slope has the largest VIF and the smallest TOL (VIF = 3.665,TOL = 0.273), which is still in the normal range (when VIF value <10 or Tol value >0.1, it indicates that there is no serious collinearity problem). Therefore, it can be proved that the 10 landslide condition factors involved in this study are reasonable and can be used in the study of landslide susceptibility assessment.
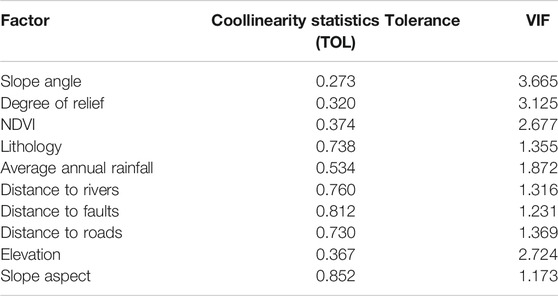
TABLE 3. Multi-collinerity diagnostics of factors.
Model Formulation and Application
CF Model
Principle
The certainty factor (CF) method is a probability function which analyses the sensitivity of various factors that affect an event and it has been widely used in the evaluation of landslide susceptibility. This method was first proposed by Shortliffe and Buchanan (1975) and then gradually improved by subsequent researchers. The principle of the CF model is expressed as follows:
where Pa is the conditional probability of a landslide event of category a (e.g., this category could refer to slopes in the range of 20°–30°). In practical applications, this parameter can be represented by the ratio of the landslide area to the total land area in category a. Ps is the prior probability of the total number of landslide events in the study area, expressed by the ratio of the total landslide area to the total land area. It can be seen that the CF value is in the range of [- 1,1]. The closer the CF value is to 1, the greater the probability of landslide occurrence is; and the closer the CF value is to -1, the smaller the probability of landslide occurrence is. When the CF value is 0, the possibility of landslide occurrence is equal to that of non-occurrence. For each slope unit, the CF values of the corresponding 10 conditioning factors were unique, so the sum of the CF values for each slope unit was calculated to express the landslide sensitivity index (LSI) as
Application
The classification information and the corresponding CF values of the 10 conditioning factors selected in this paper were calculated (Table 4).
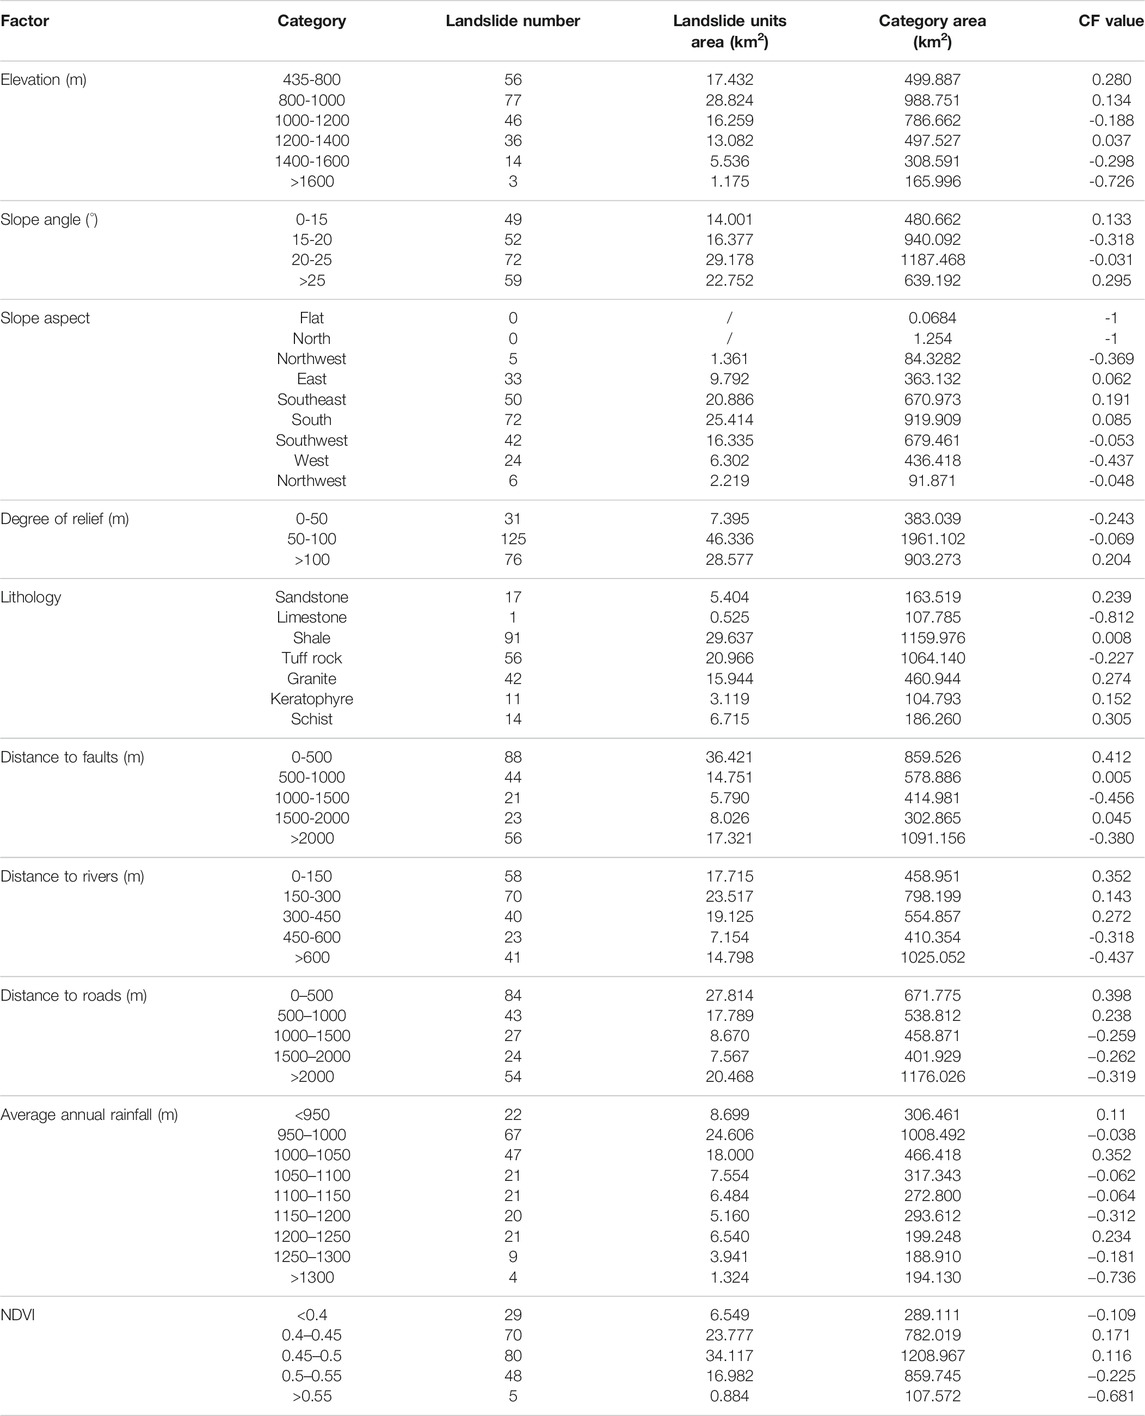
TABLE 4. CF values of the conditioning factors.
The distance to faults, distance to roads, distance to rivers, rainfall and lithology were the main conditioning factors of landslide susceptibility in Ningqiang County, as shown in Table 4, which is consistent with the conclusions obtained by Zhao et al., 2012 using an information quantity model.
SVM Model
Principle
Support Vector Machine (SVM) is a supervised learning method based on statistical learning theory. Its core premise involves constructing an optimal hyperplane to distinguish different samples by maximizing the interval between them, which is often used to solve binary classification problems. For the purposes of classification, support vector machines can be used to divide data that is linearly separable or linearly inseparable according to what best distinguishes the samples.
Suppose there is a linearly separable training sample,
In the formula,
In the formula, the relaxation variable
Where
Application
By using the grid search algorithm, C = 1.3195 and
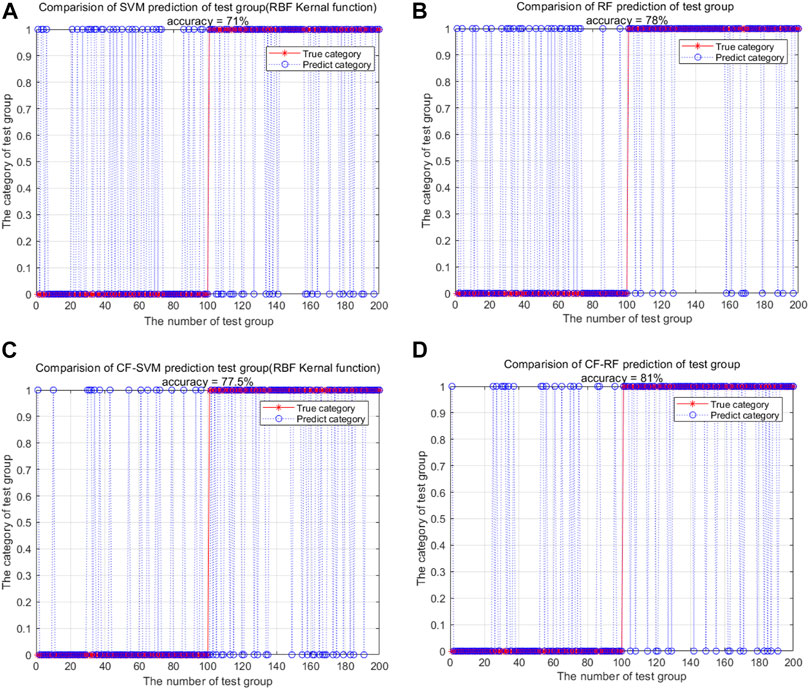
FIGURE 5. The test results from the: (A) SVM model, (B) RF model, (C) CF-SVM model and (D) CF-RF model.
RF Model
Principle
Random forest (RF) is an ensemble learning technique based on decision trees (Youssef et al., 2016; Chu et al., 2019), which was first proposed by Breiman (2001). This method decides which category each sample belongs to by using multiple classification regression trees generated from a large number of sample data sets. Each decision tree represents a classifier, so the classification and predictive ability of an RF model is better than that of a single decision tree based on traditional classification and regression.
In the RF model, the bootstrap resampling method is used to extract n samples (generally 2/3 of the original sample set) from the original sample set T to generate a new training sample set. A corresponding decision tree is generated for each independent training sample, and n decision trees were generated from the new training sample set to constitute the forest. The remaining samples (generally 1/3 of the original sample set) are called Out of Bag (OOB) samples, which constitute the test sample set and are used to verify the performance of the model. All of the decision tree categories in the forest are counted, and the class for which the sample receives the largest number of votes is denoted as its category. Further details of the RF model can be found in Breiman (2001).
Application
In this paper, the attribute values of each landslide conditioning factor were extracted from the original 464 training sample to construct the new training sample data set. The number of decision trees and the number of variables selected at random were set to 500 and 3, respectively. The RF model was constructed and then tested with the set of 200 test samples. Among them, 156 samples were successfully predicted, with a prediction success rate of 78.0% (Figure 5B). This shows that the established RF model also had good predictive performance.
CF-SVM and CF-RF Models
Principle
In order to explore the effects of hybrid statistical and machine learning methods for landslide susceptibility analysis in Ningqiang County, the CF values of all of the training samples (including landslide samples and non-landslide samples) calculated by the CF model were taken as a new sample dataset. On this basis, SVM and RF were applied to construct an ensemble CF-SVM model and CF-RF model, respectively.
Application
In this study, the CF values of the conditioning factors were extracted from the 464 original training samples (232 landslide samples and 232 non-landslide samples) to construct a new set of training data. The CF values of the conditioning factors were also extracted from the 200 original test samples (100 landslide samples and 100 non-landslide samples) to construct a new set of test data. For the CF-SVM model, the optimal value for C was found to be 1.4142 and
Results and Discussion
Results
Landslide Susceptibility Maps
After implementing the models, LSI values for all of the 23,169 slope units were calculated based on the five different models and these were reclassified by the natural break classification scheme in ArcGIS; the results are shown in Table 5.
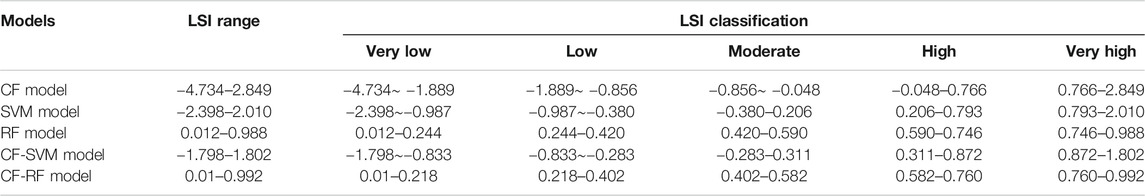
TABLE 5. Classification of LSI for the different models.
Based on the CF model, the LSI values of all 23,169 slope units were in the range of -4.734∼2.849. According to the natural break classification scheme, these were divided into five grades from low to high (-4.734, -1.889), (-1.889, -0.856), (-0.856, -0.048), (-0.048, 0.766) and (0.766, 2.849), which represent the very low susceptibility, low susceptibility, moderate susceptibility, high susceptibility and very high susceptibility classes respectively. A landslide susceptibility map was derived from the LSI values of the CF model (Figure 6A).
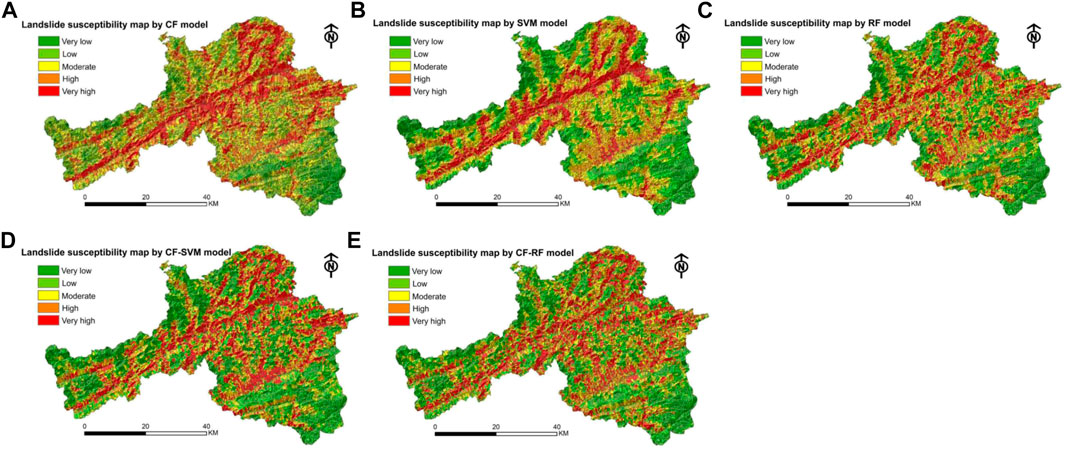
FIGURE 6. Landslide susceptibility maps produced from: (A) the CF model, (B) the SVM model, (C) the RF model, (D) the CF-SVM model and (E) the CF-RF model.
Based on the SVM model, the LSI values of all of the slopes were in the range of -2.398–2.010, and these were again divided into five grades representing very low to very high susceptibility (-2.398,-0.987), (-0.987, -0.380), (-0.380,0.206), (0.206,0.793) and (0.793, 2.010). The landslide susceptibility map based on the SVM model is shown in Figure 6B.
The LSI values of all of the slopes based on the RF model were in the range of 0.012–0.988, and these were divided into the following five sections (0.012, 0.244), (0.244, 0.420), (0.420,0.590), (0.590,0.746) and (0.746, 0.988) (Figure 6C).
The LSI values of all 23,169 slope units for the CF-SVM model were in the range of -1.798–1.802, and were divided into the following five grades from very low susceptibility to very high susceptibility (-1.798,-0.833), (-0.833,-0.283), (-0.283, 0.311), (0.311, 0.872) and (0.872, 1.802). The landslide susceptibility map is shown in Figure 6D.
For the CF-RF model, the LSI values of all of the slopes were in the range of 0.01–0.992, and were divided into the following five sections (0.01, 0.218), (0.218, 0.402), (0.402,0.582), (0.582,0.760) and (0.760, 0.992). The landslide susceptibility map is shown in Figure 6E.
ROC Curves
The receiver operator curve (ROC) and the area under the curve (AUC) are generally utilized for evaluating the accuracy of the landslide susceptibility analysis model. In this study, ROC was represented by the success-rate and prediction-rate curves separately, which were generated from the corresponding training and test datasets. The cumulative percentage area of the ordered index values in descending order was categorized into 100 classes with 1% cumulative intervals as the horizontal axis, and the cumulative percentage of landslides corresponding to the range of the LSI values as the vertical axis. In this way, the success-rate and prediction-rate curves were obtained from the intersecting values and were displayed as continuous lines. The AUC was obtained for both the training data and the validation data (Figure 7).
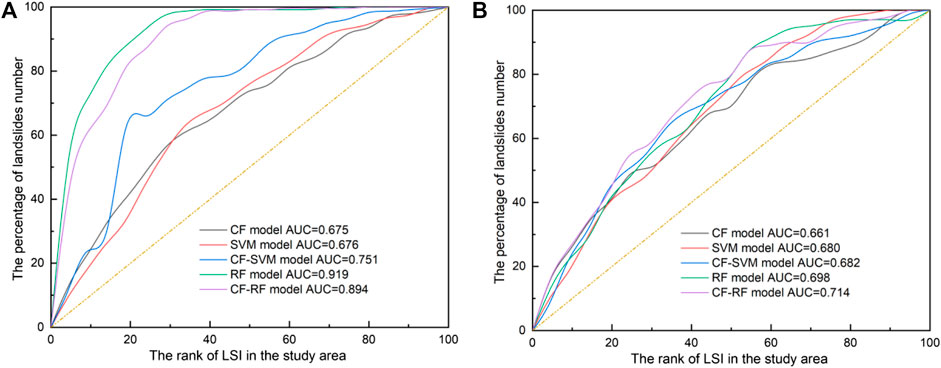
FIGURE 7. Analysis of the ROC curves of the five models: (A) success rate curves. (B) prediction rate curves.
Discussion
Landslide Susceptibility Map Rationality
The rationality of the landslide susceptibility maps was evaluated by looking at correlating in landslide locations via overlay analysis. Detailed information of each zonation in the maps produced by the different models can be obtained from Figure 8 and Table 6.
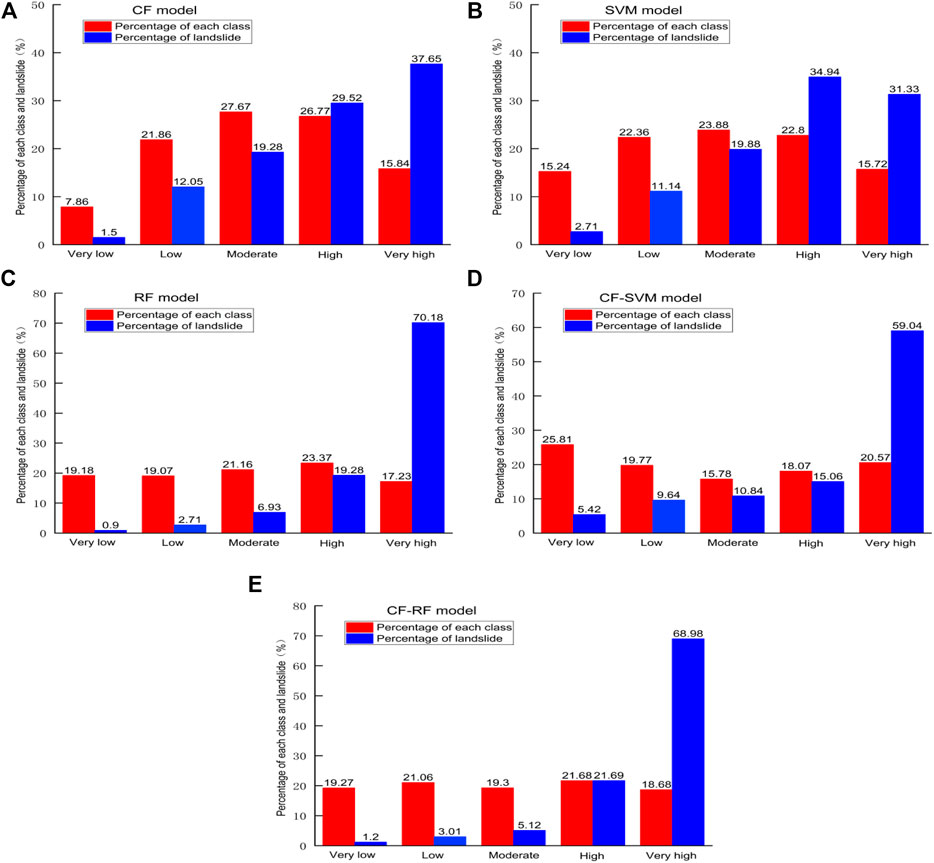
FIGURE 8. Landslide susceptibility classes and the percentages of landslides as determined by the: (A) CF model, (B) SVM model, (C) RF model, (D) CF-SVM model and (E) CF-RF model.
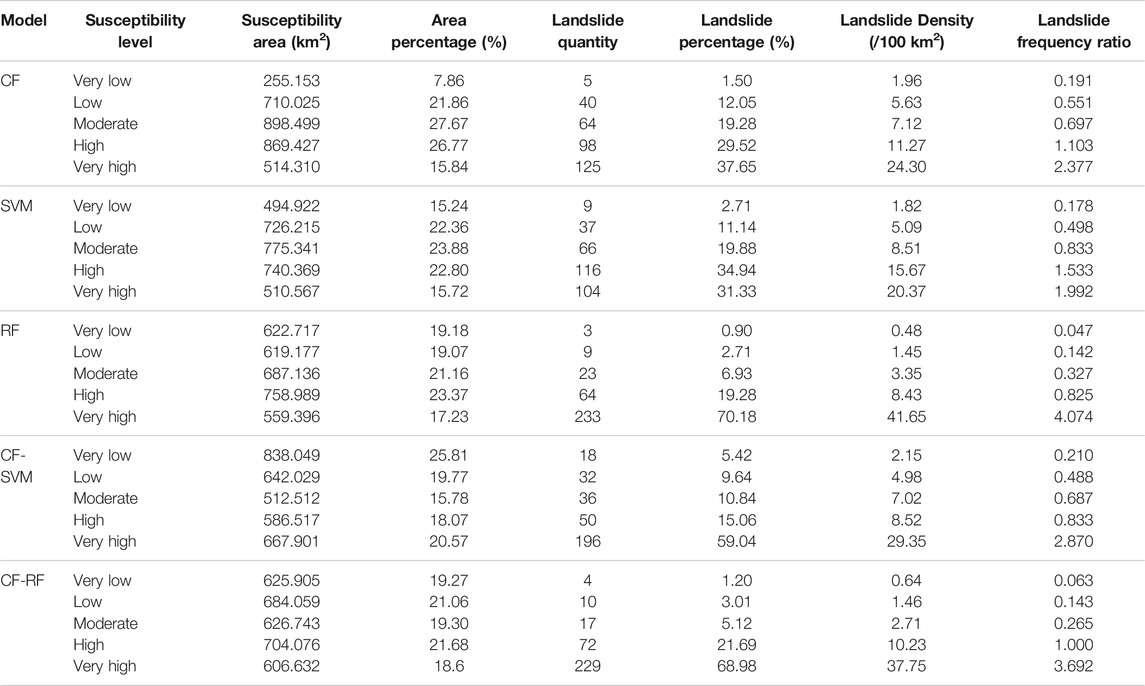
TABLE 6. Comparison of the results of the different models.
The moderate class of the CF model covered the largest area by percentage (27.67%), followed by the high (26.77%), low (21.86%), very high (15.84%) and very low (7.86%) classes, respectively. Moreover, the largest number of landslides was observed in the very high class (37.65%), followed by the high (29.52%), moderate (19.28%), low (12.05%) and very low (1.50%) classes, respectively. In the SVM model, the percentage area of land that belonged to each susceptibility class followed the same sequence as for CF. However, the largest number of landslides was obtained in the high susceptibility class (34.94%), and then the very high (31.33%), moderate (19.88%), low (11.14%), and very low (2.71%) classes. In terms of the RF model, the high class was found to cover the largest area (23.37%), followed by the moderate (21.16%), very low (19.18%), low (19.07%) and very high (17.23) classes, respectively. However, contrary to these results, the largest number of landslides was observed in the very high class (70.18%), this was then followed by the high (19.28%), moderate 6.93%), low (2.71%) and very low (0.90%) classes, respectively. In the CF-SVM model, 25.81% of the land area was assigned to the very low class, followed by the very high (20.57%), low (19.77%), high (18.07%) and moderate (15.78%) classes. Moreover, 59.04% of landslides were assigned to the very high susceptibility class. This was followed by the high (15.06%), moderate (10.84%), low (9.64%) and very low (5.42%) classes, respectively. For the CF-FR model, the high-susceptibility class covered the largest area (21.68%), followed by the low (21.06%), moderate (19.30%), very low (19.27%) and very high (18.6%) classes. The percentage of landslides in these areas were as follows: very high (68.98%), high (21.69%), moderate (5.12%), low (3.01%) and very low (1.20%). These analyses show that the landslide susceptibility maps produced by most of the above models were reasonable, and the percentage of landslides progressively increased from the very low susceptibility class to the very high susceptibility class. However, the map produced by the RF model overall seemed the most reasonable in comparison to the other models.
Landslide density (LD, number of landslides per 100 km2) and landslide frequency ratio (FR, FR = the percentage of landslides/the percentage of area per susceptibility class) were another two important indexes used to evaluate the rationality of the mapping results. The larger the LD or FR value, the higher the landslide susceptibility. The LD and FR of each model are summarized in Table 6 and shown in Figure 9 and Figure 10. The results show that both the LD and FR values were greatest in the very high susceptibility class > high susceptibility > moderate susceptibility > low susceptibility > very low susceptibility, for all of the five models. This further indicates that the five models selected in this study were reasonable. However, from the prediction results of each model, in the very high susceptibility class, the RF model predicted the largest LD and FR (41.65 and 4.074, respectively), followed by the CF-RF model (37.75 and 3.692), the CF-SVM model (29.35 and 2.87), the CF model (24.3 and 2.377) and the SVM model (20.37 and 1.992). For the very low susceptibility class, the LD and FR generated from the RF model were the lowest (0.48 and 0.047, respectively), followed by the CF-RF model (0.64 and 0.063), the SVM model (1.82 and 0.178), the CF model (1.96 and 0.191) and the CF-SVM model (2.15 and 0.21), respectively. Therefore, in terms of the LD and FR, the RF model was the most reasonable, followed by the CF-RF model, the SVM model, the CF model and the CF-SVM model. This shows that the use of the ensemble approach in the form of CF-RF and CF-SVM reduced the reliability compared to these models on their own.
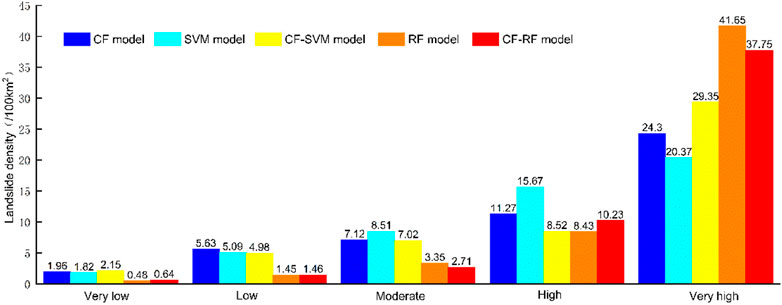
FIGURE 9. Comparison of the LD of the susceptibility maps from the five models.
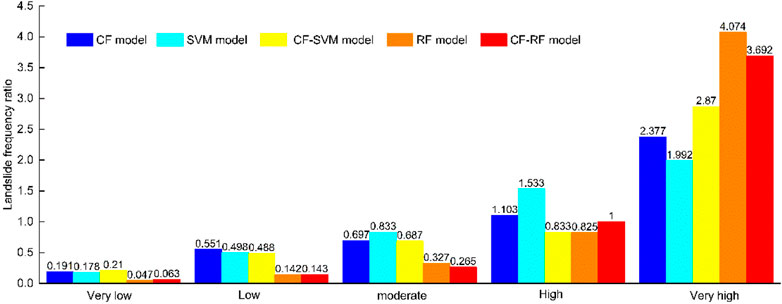
FIGURE 10. Comparison of the FR of the susceptibility maps from five models.
Landslide Susceptibility Map Accuracy
As shown in Figure 7A, the highest AUC value for the success rate curve was obtained for the RF model (0.919), followed by the CF-RF model (0.894), the CF-SVM model (0.751), the SVM model (0.676) and the CF model (0.675). The prediction rate curve is shown in Figure 7B. It can be seen that the CF-RF model had the highest prediction rate (0.714). Prediction rates of 0.698, 0.682, 0.680 and 0.661 were obtained for the RF, CF-SVM, SVM and CF models, respectively. Therefore, both the success rates and the prediction rates showed that the RF model based on slope units had a better degree of fit to the data than the other models.
Overall, based on the above comparisons and analyses, the susceptibility map produced from the RF model had the highest rationality and accuracy, followed by the CF-RF model. This is consistent with the conclusions of previous studies that found that tree-based models achieve excellent results compared to other models (Merghadi et al., 2020; Hong et al., 2020). Unfortunately, the two hybrid models (the CF-SVM model and the CF-RF model) did not meet our expectations. That is to say, the combination of the weaker learner model (he CF model here) to the stronger learner model (the SVM and RF models here) impacted the applicability of the stronger model on its own, which has been a concern of researchers (Dou et al., 2019). Though, in most cases, the hybrid model is better than the single model (Hong et al., 2017; Pradhan et al., 2017; Mallick et al., 2018; Xiao et al., 2019; Fang et al., 2020; Napoli et al., 2020; Saha and Saha, 2020).
Conclusion
Landslides are a highly dangerous and hugely destructive hazard that occurs all around the world. For this reason, landslide susceptibility analysis is very important for local government agencies. In the mapping of landslide susceptibility based on GIS, scientists have put forward many models and used many different types of mapping units. However, until now, there has been no model that could incorporate any type of landslide conditions for susceptibility mapping. Additionally, this arge-scale susceptibility analysis using detailed data has shown that slope units have better mapping properties than other units. In this paper, taking slope units as the basic analysis units, landslide susceptibility mapping of Ningqiang County was carried out using a CF model, SVM model, RF model, CF-SVM model and CF-RF model. The results found that the RF model performed better than the other. In addition, this paper provides valuable information for local government agencies for landslide risk evaluation and land utilization planning in the study area and other similar areas in the Qinba Mountains. It also shows the value of using slope units for landslide susceptibility mapping.
Data Availability Statement
The raw data supporting the conclusions of this will be made available by the authors, without undue reservation, to any qualified researcher.
Author Contributions
ZZ provided all the basic data of this manuscript, determined the research ideas and methods, discussed the related research progress, and completed the landslide susceptibility calculation based on CF model. ZL completed the calculation based on SVM, RF, CF-SVM and CF-RF models. CX discussed the results.
Funding
This work was supported by the National Key Research and Development Program of China (2017YFB0504104), the National Natural Science Foundation of China (41661144037), the National Natural Science Foundation of China (41302276), and the Scientific Research Project of Geological Research Institute for Coal Green Mining, Xi'an University of Science and Technology (MTy 2019–22).
Conflict of Interest
The authors declare that the research was conducted in the absence of any commercial or financial relationships that could be construed as a potential conflict of interest.
References
Ba, Q., Chen, Y., Deng, S., Yang, J., and Li, H. (2018). A comparison of slope units and grid cells as mapping units for landslide susceptibility assessment. Earth Sci. Inform. 11 (3), 373–388. doi:10.1007/s12145-018-0335-9
Behnia, P., and Blais-Stevens, A. (2018). Landslide susceptibility modelling using the quantitative random forest method along the northern portion of the Yukon Alaska Highway Corridor, Canada. Nat. Hazards 90 (3), 1407–1426. doi:10.1007/s11069-017-3104-z
Binaghi, E., Luzi, L., Madella, P., Pergalani, F., and Rampini, A. (1998). Slope instability zonation- a comparison between certainty factor and fuzzy dempster–shafer approaches. Nat. Hazards 17, 77–97. doi:10.1023/a:1008001724538
Chen, W., Chen, X., Peng, J., Panahi, M., and Lee, S. (2021). Landslide susceptibility modeling based on ANFIS with teaching-learning-based optimization and Satin bowerbird optimizer. Geosci. Front. 12, 93. doi:10.1016/j.gsf.2020.07.012
Chen, W., Li, W., Hou, E., and Li, X. (2014). Retracted article: GIS-based landslide susceptibility mapping using analytical hierarchy process (AHP) and certainty factor (CF) models for the Baozhong region of Baoji City, China. Environ. Earth Sci. 73 (7), 3951. doi:10.1007/s12665-014-3749-9
Chen, W., and Li, Y. (2020). GIS-based evaluation of landslide susceptibility using hybrid computational intelligence models. CATENA 195, 104777. doi:10.1016/j.catena.2020.104777
Chu, L., Wang, L. J., Jiang, J., Liu, X., Sawada, K., and Zhang, J. (2019). Comparison of landslide susceptibility maps using random forest and multivariate adaptive regression spline models in combination with catchment map units. Geosci. J. 23 (2), 341–355. doi:10.1007/s12303-018-0038-8
Dang, V. H., Dieu, T. B., Tran, X. L., and Hoang, N. D. (2019). Enhancing the accuracy of rainfall-induced landslide prediction along mountain roads with a GIS-based random forest classifier. Bull. Eng. Geol. Environ. 78 (4), 2835–2849. doi:10.1007/s10064-018-1273-y
Das, I., Stein, A., Kerle, N., and Dadhwal, V. K. V. (2012). Landslide susceptibility mapping along road corridors in the Indian Himalayas using Bayesian logistic regression models. Geomorphology 179, 116–125. doi:10.1016/j.geomorph.2012.08.004
Dou, J., Yunus, A. P., Tien Bui, D., Merghadi, A., Sahana, M., Zhu, Z., et al. (2019). Assessment of advanced random forest and decision tree algorithms for modeling rainfall-induced landslide susceptibility in the Izu-Oshima Volcanic Island, Japan. Sci. Total Environ. 662, 332–346. doi:10.1016/j.scitotenv.2019.01.221
Dou, J., Yunus, A. P., Tien Bui, D., Merghadi, A., Sahana, M., Zhu, Z., et al. (2020). Improved landslide assessment using support vector machine with bagging, boosting, and stacking ensemble machine learning framework in a mountainous watershed, Japan. Landslides 17, 641–658. doi:10.1007/s10346-019-01286-5
Ercanoglu, M., and Temiz, F. A. (2011). Application of logistic regression and fuzzy operators to landslide susceptibility assessment in Azdavay (Kastamonu, Turkey). Environ. Earth Sci. 64 (4), 949–964. doi:10.1007/s12665-011-0912-4
Erener, A., and Düzgün, H. S. B. (2011). Landslide susceptibility assessment: what are the effects of mapping unit and mapping method? Environ. Earth Sci. 66 (3), 859–877. doi:10.1007/s12665-011-1297-0
Fang, Z., Wang, Y., Peng, L., and Hong, H. (2020). Integration of convolutional neural network and conventional machine learning classifiers for landslide susceptibility mapping. Comput. Geosciences 139, 104470. doi:10.1016/j.cageo.2020.104470
Feizizadeh, B., Roodposhti, M. S., Blaschke, T., and Aryal, J. (2017). Comparing GIS-based support vector machine kernel functions for landslide susceptibility mapping. Arabian J. Geosciences 10 (5), 122. doi:10.1007/s12517-017-2918-z
Guzzetti, F., Carrara, A., Cardinali, M., and Reichenbach, P. (1999). Landslide hazard evaluation: a review of current techniques and their application in a multi-scale study, Central Italy. Geomorphology 31, 181–216. doi:10.1016/s0169-555x(99)00078-1
Hong, H., Liu, J., and Zhu, A. X. (2020). Modeling landslide susceptibility using LogitBoost alternating decision trees and forest by penalizing attributes with the bagging ensemble. Sci. Total Environ. 718, 137231. doi:10.1016/j.scitotenv.2020.137231
Hong, H., Liu, J., Zhu, A. X., Shahabi, H., Pham, B. T., Chen, W., et al. (2017). A novel hybrid integration model using support vector machines and random subspace for weather-triggered landslide susceptibility assessment in the Wuning area (China). Environ. Earth Sci. 76, 652. doi:10.1007/s12665-017-6981-2
Kayastha, P., Dhital, M. R., and De Smedt, F. (2013). Application of the analytical hierarchy process (AHP) for landslide susceptibility mapping: a case study from the Tinau watershed, west Nepal. Comput. Geosci. 52, 398–408. doi:10.1016/j.cageo.2012.11.003
Lee, S., Won, J. S., Jeon, S. W., Park, I., and Lee, M. J. (2014). Spatial landslide hazard prediction using rainfall probability and a logistic regression model. Math. Geosci. 47 (5), 565–589. doi:10.1007/s11004-014-9560-z
Li, Y., and Chen, W. (2020). Landslide susceptibility evaluation using hybrid integration of evidential belief function and machine learning techniques. Water 12, 113. doi:10.3390/w12010113
Lin, M. L., and Tung, C. C. (2004). A GIS-based potential analysis of the landslides induced by the Chi-Chi earthquake. Eng. Geol. 71 (1-2), 63–77. doi:10.1016/s0013-7952(03)00126-1
Mallick, J., Singh, R. K., AlAwadh, M. A., Islam, S., Khan, R. A., and Qureshi, M. N. (2018). GIS-based landslide susceptibility evaluation using fuzzy-AHP multi-criteria decision-making techniques in the Abha Watershed, Saudi Arabia. Environ. Earth Sci. 77, 276. doi:10.1007/s12665-018-7451-1
Meng, Q., Miao, F., Zhen, J., Wang, X., Wang, A., Peng, Y., et al. (2016). GIS-based landslide susceptibility mapping with logistic regression, analytical hierarchy process, and combined fuzzy and support vector machine methods: a case study from Wolong Giant Panda Natural Reserve, China. Bull. Eng. Geol. Environ. 75 (3), 923–944. doi:10.1007/s10064-015-0786-x
Merghadi, A., Yunus, A. P., Dou, J., Whiteley, J., ThaiPham, B., Tian Bui, D., et al. (2020). Machine learning methods for landslide susceptibility studies: a comparative overview of algorithm performance. Earth-Science Rev. 207, 103225. doi:10.1016/j.earscirev.2020.103225
Moayedi, H., Mehrabi, M., Mosallanezhad, M., Rashid, A. S. A., and Pradhan, B. (2018). Modification of landslide susceptibility mapping using optimized PSO-ANN technique. Eng. Comput. 35 (3), 967–984. doi:10.1007/s00366-018-0644-0
Mokarram, M., and Zarei, A. R. (2018). Landslide susceptibility mapping using fuzzy-AHP. Geotech. Geol. Eng. 36 (6), 3931–3943. doi:10.1007/s10706-018-0583-y
Nam, K., and Wang, F. (2020). An extreme rainfall-induced landslide susceptibility assessment using autoencoder combined with random forest in Shimane Prefecture, Japan. Geoenviron. Disasters 7 (1), 6. doi:10.1186/s40677-020-0143-7
Napoli, M. D., Carotenuto, F., Cevasco, A., Confuorto, P., Martire, D. D., Firpo, M., et al. (2020). Machine learning ensemble modelling as a tool to improve landslide susceptibility mapping reliability. Landslides 17, 1897–1914. doi:10.1007/s10346-020-01392-9
Nieto, P. J. G., García–Gonzalo, E., Fernández, J. R. A., and Muñiz, C. D. (2015). Hybrid PSO-MARS-based model for forecasting a successful growth cycle of the Spirulina platensis from experimental data in open raceway ponds. Ecol. Eng. 81, 534–542. doi:10.1016/j.ecoleng.2015.04.064
Ohlmacher, G. C., and Davis, J. C. (2003). Using multiple logistic regression and GIS technology to predict landslide hazard in northeast Kansas, USA. Eng. Geol. 69 (3-4), 331–343. doi:10.1016/s0013-7952(03)00069-3
Park, S., Choi, C., Kim, B., and Kim, J. (2012). Landslide susceptibility mapping using frequency ratio, analytic hierarchy process, logistic regression, and artificial neural network methods at the Inje area, Korea. Environ. Earth Sci. 68 (5), 1443–1464. doi:10.1007/s12665-012-1842-5
Pistocchi, A., Luzi, L., and Napolitano, P. (2002). The use of predictive modeling techniques for optimal exploitation of spatial databases: a case study in landslide hazard mapping with expert system-like methods. Environ. Geol. 41 (7), 765–775.
Pradhan, B., Seeni, M. I., and Kalantar, B. (2017). “Performance evaluation and sensitivity analysis of expert-based, statistical, machine learning, and hybrid models for producing landslide susceptibility maps,” in Laser scanning applications in landslide assessment. Editor B. Pradhan (Cham: Springer).
Regmi, N. R., Giardino, J. R., McDonald, E. V., and Vitek, J. D. (2013). A comparison of logistic regression-based models of susceptibility to landslides in western Colorado, USA. Landslides 11 (2), 247–262. doi:10.1007/s10346-012-0380-2
Saha, A., and Saha, S. (2020). Comparing the efficiency of weight of evidence, support vector machine and their ensemble approaches in landslide susceptibility modelling: a study on Kurseong region of Darjeeling Himalaya, India. Remote Sensing Appl. Soc. Environ. 19, 100323. doi:10.1016/j.rsase.2020.100323
Sarkar, S., Roy, A. K., and Martha, T. R. (2013). Landslide susceptibility assessment using information value method in parts of the darjeeling himalayas. J. Geol. Soc. India 82 (4), 351–362. doi:10.1007/s12594-013-0162-z
Sharma, L. P., Patel, N., Ghose, M. K., and Debnath, P. (2014). Development and application of Shannon's entropy integrated information value model for landslide susceptibility assessment and zonation in Sikkim Himalayas in India. Nat. Hazards 75 (2), 1555–1576. doi:10.1007/s11069-014-1378-y
Shortliffe, E. H., and Buchanan, B. G. (1975). A model of inexact reasoning in medicine. Math. Biosciences 23 (3-4), 351–379. doi:10.1016/0025-5564(75)90047-4
Tan, Y., Guo, D., and Xu, B. (2015). A geospatial information quantity model for regional landslide risk assessment. Nat. Hazards 79 (2), 1385–1398. doi:10.1007/s11069-015-1909-1
Tien Bui, D., Pradhan, B., Lofman, O., and Revhaug, I. (2012). Landslide susceptibility assessment in Vietnam using support vector machines, decision tree, and naïve bayes models. Math. Probl. Eng. 2012, 1–26. doi:10.1155/2012/974638
Xiao, T., Yin, K., Yao, T., and Liu, S. (2019). Spatial prediction of landslide susceptibility using GIS-based statistical and machine learning models in Wanzhou County, Three Gorges Reservoir, China. Acta Geochim 38 (5), 654–669. doi:10.1007/s11631-019-00341-1
Youssef, A. M., Pourghasemi, H. R., Pourtaghi, Z. S., and Al-Katheeri, M. M. (2016). Landslide susceptibility mapping using random forest, boosted regression tree, classification and regression tree, and general linear models and comparison of their performance at Wadi Tayyah Basin, Asir Region, Saudi Arabia. Landslides 13 (5), 839–856. doi:10.1007/s10346-015-0614-1
Zhao, X., and Chen, W. (2020). GIS-based evaluation of landslide susceptibility models using certainty factors and functional trees-based ensemble techniques. Appl. Sci. 10, 16. doi:10.3390/app10010016
Zhao, Z., Hou, E., and Wang, J. (2012). Research on landslide hazard in Ningqiang county of Wenchuan earthquake affected area. J. Xi’an Univ. Sci. Technol. 32 (5), 548–555. doi:10.13800/j.cnki.xakjdxxb.2012.05.005
Keywords: landslide susceptibility mapping, certainty factor, random forest, support vector machine, slope units
Citation: Zhao Z, Liu Zy and Xu C (2021) Slope Unit-Based Landslide Susceptibility Mapping Using Certainty Factor, Support Vector Machine, Random Forest, CF-SVM and CF-RF Models. Front. Earth Sci. 9:589630. doi: 10.3389/feart.2021.589630
Received: 31 July 2020; Accepted: 08 February 2021;
Published: 31 March 2021.
Edited by:
Binh Thai Pham, University of Transport Technology, VietnamReviewed by:
Hong Haoyuan, University of Vienna, AustriaJie Dou, Nagaoka University of Technology, Japan
Copyright © 2021 Zhao, Liu and Xu. This is an open-access article distributed under the terms of the Creative Commons Attribution License (CC BY). The use, distribution or reproduction in other forums is permitted, provided the original author(s) and the copyright owner(s) are credited and that the original publication in this journal is cited, in accordance with accepted academic practice. No use, distribution or reproduction is permitted which does not comply with these terms.
*Correspondence: Zhou Zhao, NTk0NjgyMTU5QHFxLmNvbQ==