 Nobuaki Fuji1,3
 Hyoihn Jang2
 Atsushi Nakao3,4
 YoungHee Kim2*
 David Fernández-Blanco1†Sang-Mook Lee2Alexia Schroeder1Kensuke Konishi5
- 1Université de Paris, Institut de Physique du Globe de Paris, CNRS, Paris, France
- 2School of Earth and Environmental Sciences, Seoul National University, Seoul, Republic of Korea
- 3Earthquake Research Institute, University of Tokyo, Bunkyo-ku, Japan
- 4Department of Earth Sciences, The University of Hong Kong, Hong Kong, Hong Kong
- 5Institute of Earth Sciences, Academia Sinica, Nangang, Taiwan
The shape of a subducting slab varies as a function of trench motion. Two end-members of subduction modes are geodynamically possible: roll-back mode underneath neighboring plates and roll-over mode underneath the plate itself. Whereas most of major slabs seem to roll back while the Pacific plate shows a slab piling behavior down to ∼1,000 km depth under the Mariana trench, no clear evidence of slab roll-over in nature has been reported so far. Here we show a possible roll-over slab beneath the Caroline microplate, revealed from its three-dimensional seismic velocity structure derived by analyzing teleseismic reverberating SS phases. We suggest that slab roll-over is driven by at least two factors: 1) the overall buoyancy and fragility of the Caroline microplate at the surface, induced by a thin hot mantle plume that rises from depths ≥800 km; and 2) the pushing force of the Pacific plate acting on the trailing edge of the Caroline plate.
Introduction
Seismic tomographic studies have imaged various subduction patterns (e.g., Okino et al., 1989; Fukao and Obayashi, 2013; French and Romanowicz, 2015; Hosseini et al., 2020). Whereas a slab with a retreating trench is dominant for the Pacific plate going under the North American plate in the north-eastern Japan arc (e.g., Lallemand et al., 2008; Fukao and Obayashi, 2013), a steep slab with a slab piling geometry of recumbent folds is also possible, as below the advancing Mariana trench (e.g., Widiyantoro et al., 1999; Barklage et al., 2015). These observed subduction modes have motivated the community of geodynamics to foster the interpretation of slab physics, with the aid of global and regional numerical simulation and analogue laboratory experiments. Geodynamical modeling studies, both numerical and experimental, show that the geometry of subducting slabs is closely related to the motion of converging plates (Christensen, 1996; Schellart, 2011): the roll-back mode occurs when trench moves oceanward (“retreats”), whereas the roll-over mode occurs when trench moves landward (“advances”; Replumaz et al., 2004; Manea and Gurnis, 2007) (Schellart, 2008). It is also shown that slabs may not only roll back beneath neighboring plates, as has been observed beneath the Mariana trench, but that it could also roll over below themselves (Schellart, 2008).
One of the possible mechanisms for a slab to roll over is by a large pushing force along the trailing edge of a subducting oceanic plate (Schellart, 2005; Stegman et al., 2010a). This mechanism may not apply to the major subducting plates on the Earth, given that the pushing force at the trailing-edge of large, old oceanic plates is normally much smaller than their gravity, which is a principal engine of plate motions (e.g., Forsyth and Uyeda, 1975). In addition, heavy, stiff, old subducting slabs may not achieve the slab roll-over mode, which is likely to occur in buoyant and highly deformable slabs (Stegman et al., 2010b). Hot plumes can contribute to such pushing forces by providing heat under oceanic plates, thereby making them more buoyant and deformable. Microplates are thus worth exploring to better understand the geodynamics of subducting slabs which may exhibit roll-over mode.
In this paper, we explore the Caroline microplate as a good candidate for slab roll-over mode. This oceanic microplate is surrounded by three major old plates and fed by a plume. We investigate the mode of subduction of this small plate by first developing and applying a new seismological imaging technique particularly adapted to the region of interest. We then propose the geodynamical model to reconcile the seismological and tectonic models.
Background
Tectonic Setting of the Caroline Plate
The Caroline plate has a complex and discussed geologic history, that includes tectonic rotations, protracted and recent subduction, former rift jumping and abortion, young spreading centers, plate boundaries of unknown geometry and kinematics, and hotspot and volcanic activity (Gaina and Muller, 2007). This microplate is roughly hexagonal (approximately 1,800 km × 1,000 km) and is trapped among three major converging plates (Figure 1): the Australian (south), Philippine (west and north-west), and Pacific (east and north-east) plates (Weissel and Anderson, 1978). The Philippine-Caroline plate boundary, located in the west, consists of convergent boundaries to the north, marked as the Yap and Palau trenches, and the Ayu trough extensional plate boundary to the south (Weissel and Anderson, 1978). The south and east boundaries of the Caroline plate evolve in an obliquely and rapidly converging plate boundary zone (Baldwin et al., 2012). Tectonic accommodation seems to occur by lithospheric shortening along the New Guinea, Manus, and Mussau trenches. The Caroline plate is underthrusting beneath the Indo-Australian and Pacific plates. To the north, its contact with the Pacific plate is unclear but may be dominated by a spreading center controlling the evolution of the Sorol trough (Weissel and Anderson, 1978). The transition between this plate boundary and the Mussau trench is of complexity, potentially due to its interaction with the Caroline hotspot track (CHT in Figure 1; Gaina and Muller, 2007; Wu et al., 2016). The dating of the CHT could be the trace of the Caroline plume from the core-mantle boundary (CMB), which might have been a source for the Caroline ridge, and probably the Sorol trough.
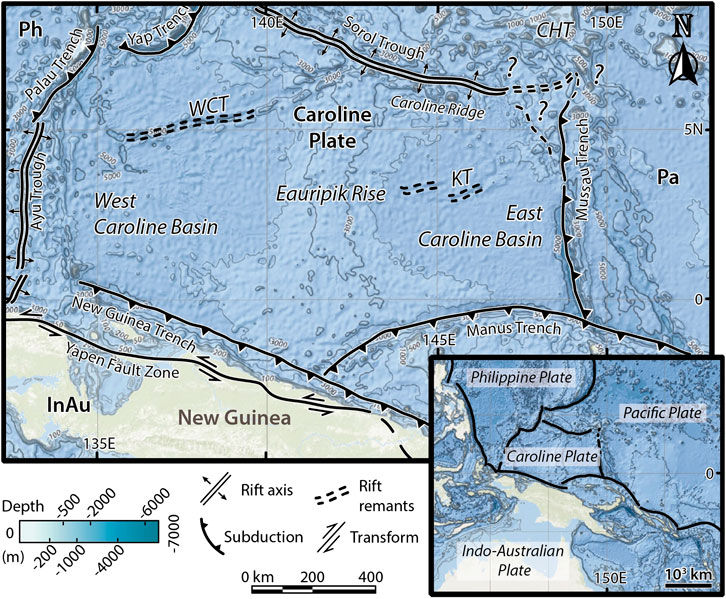
FIGURE 1. Tectonic setting of the Caroline plate. The lower-right inset shows the larger tectonic framework of the Caroline plate. The main panel depicts the nature of the main tectonic boundaries around the Caroline plate (Cooper and Taylor, 1987; Gaina and Muller, 2007; Baldwin et al., 2012). Ph, Pa, and InAu are the acronyms for Philippine, Pacific, and Indo-Australian plates, respectively, the three major plates surrounding the Caroline Plate. WCT and KT are the West Caroline and Kiilsgaard troughs, remnants of a former spreading center. CHT stands for Caroline Hotspot Track. The bathymetric shaded-relief visualization of the GEBCO 2014 grid is shown as produced by NOAA/NCEI. Bathymetric depths and major morphologies are marked with equal-depth contours in kilometers.
Subducting features of the Caroline plate are observable at its southern plate boundaries, along the New Guinea and Manus trenches. Although the lack of geodetic data hinders further details, east-west trending magnetic anomalies within the Caroline plate seafloor indicate southward plate motion (Maus, 2009). A north-south volcanic ridge, called the Eauripik rise, rises from the consistently flat seafloor bathymetry at ∼4.5 km depth, while the seafloor shallows by more than 2 km around the center of the Caroline plate (Figure 1; Weissel and Anderson, 1978). The Eauripik rise has a relatively constant width of ∼250 km in its northern and central sectors that triples in its southern sector, as the ridge becomes shallower and more distributed (Figure 1). The Eauripik rise disrupted the north-south spreading center that originally formed this oceanic microplate and defined the east and west Caroline basins during the Oligocene (Weissel and Anderson, 1978; Gaina and Muller, 2007). This rise was once thought to be a dead divergent boundary (Winterer et al., 1971). However, the magnetic exploration and borehole analyses suggest that the Eauripik rise may be related to magma that leaked through faults and cracks when the plate was created (Weissel and Anderson, 1978; Hegarty and Weissel, 1988). Another interpretation suggests a link between the Eauripik rise and the tracks of the Manus plume (Macpherson and Hall, 2001). Subsurface and seismic data leading to high-resolution imaging can resolve the mantle structure underlying this complex tectonic framework at present, and help understanding potential links between lithospheric and surface processes.
Previous Seismological Observations
Looking from the bottom of the mantle, global whole-mantle waveform inversion studies indicate the existence of a plume with a maximum size of 10° × 10° (French and Romanowicz, 2015; Garnero et al., 2016). As imaged by these studies, the Caroline plume is a vertical pile of low shear velocity (VS) rooted at the western tip of the Pacific Large Low Shear Velocity Province. Body-wave waveform inversion studies imaged the detailed elastic and anelastic structure of the plume, suggesting that the Caroline plume is iron rich at the base of mantle (at least until ∼1,000 km above the CMB), probably due to chemical interaction with the CMB (Konishi et al., 2017; Deschamps et al., 2019; Konishi et al., 2020). It is thus interesting, from the geodynamical point of view as well, to trace this Caroline plume up to the surface and to explore its link to the Caroline ridge.
The fine structure of the upper mantle and mantle transition zone beneath the Caroline plate has not been imaged, for there is not any dense array of seismometers nor seismicity around the region except near its south-western boundary. Long-wavelength global tomography models have overcome this difficulty and, using all the seismic phases that sample any region of the globe, have successfully shown a large high-velocity anomaly in the transition zone beneath the Caroline plate (e.g., O’Neill et al., 2005; French and Romanowicz, 2015). However, the detailed structure within the region is still unrevealed. Several factors are responsible for the lack of resolution: 1) previous studies use low-frequency contents (shortest periods of 32–128 s, i.e. larger than ∼150 km) in their inversions and thus have a poor sensitivity in resolving ∼100 km-scale structure; and 2) due to a heavy regularization, smoothing scheme and data weighting factors, to stabilize inversions for a number of parameters within the whole Earth domain, it can bias the obtained results and broaden the anomaly images (e.g., Bozdağ et al., 2016; Marjanović et al., 2017). Global tomography can also prevent from imaging sharp interfaces that can be observable from forward modeling (e.g., Ni et al., 2005). This results in the difficulty to assess the error for each single point in global tomographic models. In order to overcome these limitations, we develop a Monte Carlo (MC) inversion using SS–S differential traveltimes and waveforms, specially designed for the purpose of exploration of the interior of the upper mantle and the transition zone beneath the Caroline plate. We apply it to a large dataset of waveforms that sample the region of interest.
Given the distribution of teleseismic earthquakes (Supplementary Figure S1), we provide the first three-dimensional (3D) mantle structure to reveal slab roll-over geometry beneath the Caroline plate and understand subduction dynamics. On the basis of our model, we aim to understand the structure and evolution of the Caroline plate, which are affected by several major plates that collide and subduct one beneath another. We will further focus on the following questions with the aid of seismology and geodynamics: 1) which mechanism is supplying the materials at the Caroline ridge and what is the link between the hot iron-rich Caroline plume at the mantle (e.g., O’Neill et al., 2005; Konishi et al., 2017; Deschamps et al., 2019; Konishi et al., 2020)? and 2) how has the Eauripik rise been formed at the center of the Caroline plate?
Methods
Monte Carlo Inversions Using SS–S-phase Double-Difference Traveltime and Waveform Similarity
Teleseismic waveform data that sample only inside the upper mantle and the mantle transition zone beneath the Caroline plate will not provide enough information on its structure, given the small number of seismic stations and earthquakes inside the region. We thus specifically chose an SS seismic phase for retrieving VS structure, for it reverberates at the surface of the plate once between the source and the receiver. As the direct S and SS phases sample similar regions at both the source and receiver sides, the differential traveltime between their arrivals is mainly due to the bouncing point of the SS phase. We aim to obtain preferred 1D model(s) for the bouncing point region by using a MC approach which retrieves as much robust information as possible from the data and avoids biasing the inversion with a priori information, such as initial models.
We collected a dataset consisting of 2,540 transverse-component waveforms from 482 teleseismic earthquakes whose SS phase bounced within and around the Caroline plate (Supplementary Figure S1). The collected events have Mw 5.5–7.0 and focal depths of <75 km, and occurred in 2001–2015. We filtered the observed waveforms at 20–100 s, and the data were quality checked. We retained only waveforms with a signal-to-noise ratio exceeding 2.5 for S and 1.5 for SS, and divided the dataset based on bouncing points of the SS phase. We computed traveltime kernels for S and SS arrival times of the data and their differences using DSM Kernel Suite (Fuji et al., 2012; Fuji et al., 2016). For epicentral distances of 50–90°, the sensitivity of SS phase is focused inside a cylindrical column of a radius of 5° beneath the bouncing point. The kernels show that SS phases exhibit significant sensitivity to structure, indicating a possibility of extracting information on localized inner structure of SS bouncing point region (Supplementary Table S2). We note that we cannot fully eliminate influences to SS traveltimes from the source-side, receiver-side and lower mantle heterogeneities even with the data covering a wide range of azimuths (Supplementary Figure S1). We thus test statistical robustness of our inversion a posteriori as a function of the number of models chosen, that are represented as covariance of our inverted models. We further note that we did not use any partial derivatives or kernels during the inversions, although both can be the indices for the determination of an adequate binning of sub-regions and for that of frequency ranges.
We then generated synthetic seismograms for a family of 1,000 1D models of VS with a ±4% anomaly in the depth range of 0–850 km for the Preliminary Reference Earth Model (PREM; Dziewonski and Anderson, 1981), allowing discontinuities anywhere. We fixed the number of layers to be 9, but the velocity (and its gradient) of each layer can be changed randomly (Supplementary Figure S2). We computed the synthetic seismograms using the 1D direct solution method (Geller and Ohminato, 1994; Geller and Takeuchi, 1995). The MC inversion was aimed at finding a 1D model(s) for each sub-region by minimizing the misfit function:
where
Looking at various epicentral distance seismograms has the advantage that their sensitivity of SS phases with respect to each depth differs from one to another, and thus results in a quasi-orthogonal sensitivity, when using a large number of waveforms (Konishi et al., 2014). Furthermore, our MC method allows us to not depend on a priori information, or an initial model, resulting in a global minimum search of the misfit function (Eq. 1). As shown in the Results section, we also evaluate the covariances for our preferred models, thereby providing an index of confidence level of each model parameter.
Geodynamic Simulation
We conducted numerical simulations to constrain controlling factors in the geometry of a subducting microplate. We considered a 2D trench-normal cross section, as trench-normal motion between converging plates is the primary factor in the geometry of subducting slabs (e.g., Christensen, 1996; Torii and Yoshioka, 2007; Stegman et al., 2010a; Stegman et al., 2010b; Schellart, 2011; Cizkova and Bina, 2015). We set up a 2D model of a subducting slab with an infinitely large width, given that 3D simulations of subduction conclude that slab behavior is sustained when their width is >1200 km, which is the case for the Caroline plate (Stegman et al., 2010a). Our model includes an overlying plate, a subducting microplate, and a pushing plate in a whole-mantle domain (Supplementary Figure S3). Each plate is decoupled by fracture zones characterized by weak strength (e.g., Manea et al., 2014). In addition, low-viscosity weak zones were set at the top-left and top-right corners of our model domain to allow horizontal plate motions. Each plate consists of overlying crustal and underlying mantle rocks with their proper densities and heat generation rates (e.g., Turcotte and Schubert, 2002). The model includes two discontinuities associated with the olivine/wadsleyite and ringwoodite/bridgmanite phase changes: the subducting microplate acquires negative buoyancy at the 410 km depth and positive buoyancy at the 660 km depth, resulting in slab deformation.
We used basic equations and numerical solvers of previous studies (Nakao et al., 2016; Nakao et al., 2018): mantle flows were derived from a Stokes equation for an incompressible viscous continuum with an infinite Prandtl number; and mantle temperature was solved using the extended Boussinesq approximation (see Supplementary Material text). Note that, contrary to the previous studies, we excluded water transport of the simulation for simplification. In order to solve mantle flows along four model boundaries, free slip conditions are imposed, except for the top of the pushing plate. Along the pushing plate surface, a landward constant velocity (Vpush) is imposed instead. We set a constant temperature of 0°C as boundary conditions along the top boundary, whereas the insulating condition is imposed at the bottom, right and left boundaries (Supplementary Figure S3). We set initial conditions as follows: 1) the overlying plate is 10 Myr old and 3,500 km in length; 2) the subducting microplate is 10 or 50 Myr old and 2,000 km in length; 3) the pushing plate is 100 Myr old and 3,700 km in length; 4) the fracture zone is placed between the overlying and the subducting plates; and 5) another fracture zone is assigned between the subducting and the pushing plates (Supplementary Figure S3). Lastly, in these models, we varied the pushing velocity Vpush (3, 6, or 9 cm/yr) and the initial thermal age of the subducting microplate (10 or 50 Myr) as variable parameters to examine subduction modes.
Results
Individual DDTT values show that SS phases arrive much faster than PREM prediction and S phases arrive as predicted by PREM (Supplementary Figure S4A). The averaged DDTT over the whole region is 7.6 s, implying the presence of a fast VS anomaly beneath the Caroline plate, which is consistent with global studies (e.g., O’Neill et al., 2005; French and Romanowicz, 2015). DDTT variations as a function of SS bouncing points are relatively small (<2 s) at the southern and western plate boundaries (Supplementary Figure S4B).
Our MC inversion outputs preferred depth-dependent VS models for each sub-region, defined by the reverberating points of SS phases. Figure 2 shows a final seismic velocity model compiled from all preferred 1D models. We obtain error estimates by means of the MC inversion scheme that directly compares observed and synthetic data generated for 1,000 models. The final model shows high-velocity anomalies throughout the upper mantle and the transition zone, which are, again, consistent with the global models. However, more detailed small-scale features are visible in our reconstructed 3D model due to the shorter-period contents and our optimized inversion scheme that maximized resolving power and particularly targeted the inner structure beneath the SS bouncing points.
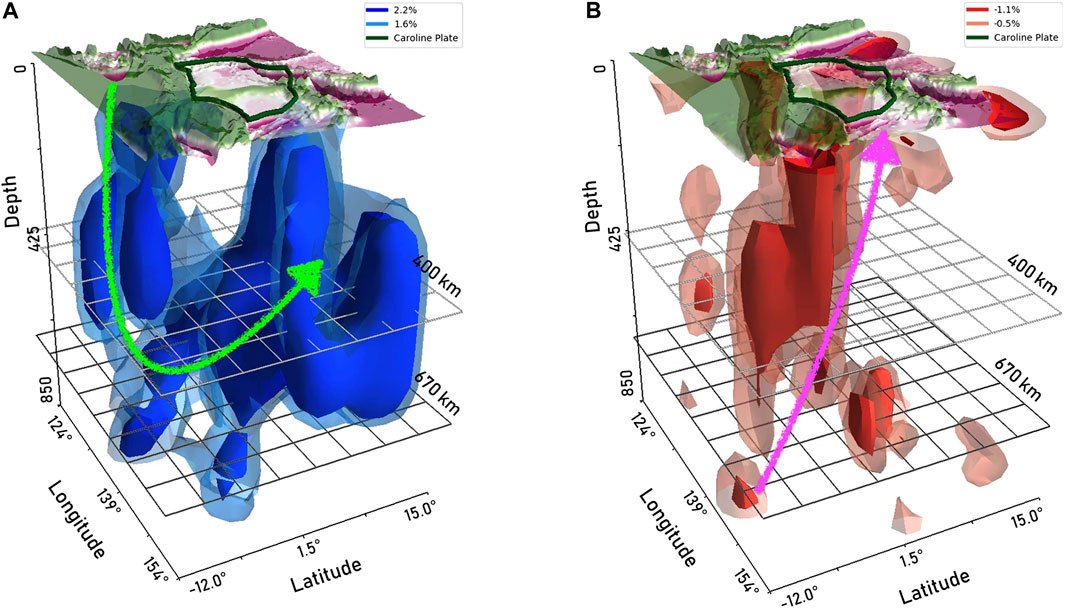
FIGURE 2. Three-dimensional S-wave velocity (VS) structure beneath the Caroline plate down to 850 km depth with interpretation (arrows). The green perimeter at the surface (0 km depth) indicates the Caroline plate boundaries. (A) The region in blue has VS 2.2 and 1.6% faster than PREM (Dziewonski and Anderson, 1981). (B) The region in red has VS 1.1 and 0.5% slower than PREM. Our model suggests the presence of subducting and stagnant slabs (blue regions) from the neighboring plate boundaries, and the plume (red regions) emerging from the base of the model domain (850 km depth) and extending to the surface. See Supplementary Figure S5 for horizontal slices of the model and Supplementary Figures S6–S8 for vertical slices of the model. A green arrow in a panel (A) indicates the slab imaged with high seismic velocities, and a magenta arrow in (B) indicates slow-velocity material.
Faster velocity features (1.6–2.2% faster than the PREM) are clear, especially around the 200–750 km depths (Figure 2A, Supplementary Figures S5–S7) and mostly concentrated below the southern plate boundaries of Caroline (Figure 2A, Supplementary Figures S5–S8). Below the northern plate boundaries, fast VS features observed around the 200–850 km depths can be also recovered from the best 10 and 30 models (Supplementary Figures S9A, S10A, respectively). On the other hand, a smaller-scale low-VS structure (0.5–1.1% slower than PREM) is observed from bottom to top of our model domain (0–850 km depths). Low VS features are more prominent at shallower depths (0–200 km) and are dominant merely below the Eauripik rise at 50 km depth (Figure 2B, Supplementary Figures S5–S8, S9B, S10B). The standard deviations for both 10 and 30 preferred models are <1.5% beneath the Caroline plate, supporting the confidence level of our model (Supplementary Figures S11, S12).
Our 2D geodynamic simulation demonstrates that the geometry of a subducting oceanic plate is critically dependent on the magnitude of landward velocity (Vpush) and the age of the slab (Figure 3). Subduction of a 50 Myr-old oceanic plate can lead to a variety of slab geometries, depending on the Vpush in the range for actual oceanic plate motions (Lallemand et al., 2008). A small Vpush (3 cm/year) results in a slab-draping geometry with a horizontal slab segment in the transition zone (Figure 3A), similar to the Pacific slab geometry in north-eastern Japan (e.g., Huang and Zhao, 2006). An intermediate Vpush (6 cm/year) develops a draping geometry with recumbent folds (Figure 3B), similar to that in the southern Izu–Bonin arc (e.g., Huang and Zhao, 2006). A large Vpush (9 cm/year) develops a slab piling geometry of recumbent folds at the transition zone (Figure 3C), similar to the one in the Mariana arc (Widiyantoro et al., 1999).
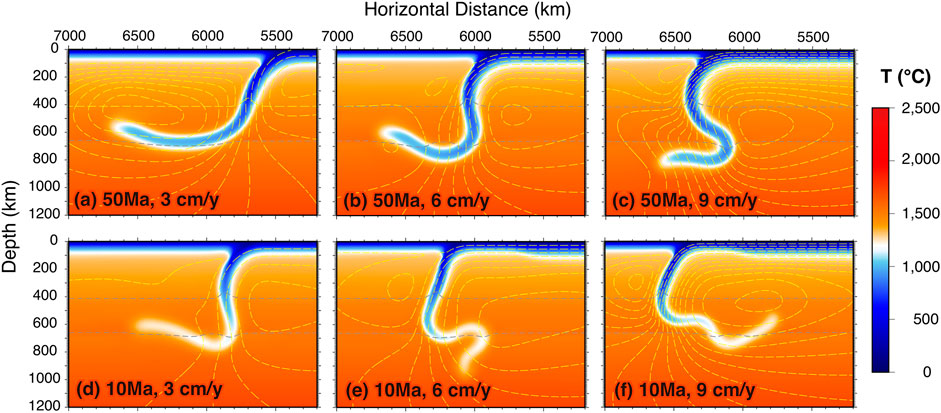
FIGURE 3. Thermal structures simulated by six runs with different pushing velocities (Vpush) (from left to right, 3, 6, and 9 cm/year) and thermal ages of the subducting microplate (50 Myr at top row and 10 Myr at bottom row). Grey dashed lines represent the 410 and 660 km depth boundaries. Thin yellow dashed lines are stream functions of mantle flows (5 × 10⁻⁵ m2/s intervals). See Supplementary Figure S3 for a schematic illustration of the simulation and Supplementary Videos 1–6 for the six simulation results.
The transition between the above-mentioned slab geometries is different for the case of a young, hot oceanic plate. Subduction of a 10 Myr-old plate with a fast velocity (Vpush = 3 cm/year) exhibits a draping geometry with recumbent folds (Figure 3D). With intermediate to fast velocities (Vpush = 6 and 9 cm/year), the 10 Myr-old plate exhibits a roll-over geometry with a horizontal slab segment in the transition zone, resulting in trench advance (Figures 3E,F). In this case, the oceanic plate is continuously supplied to the converging plate boundary due to the large pushing velocity, whereas the convergence velocity slows down by the large thermal buoyancy of the subducting slab. Consequently, the overlying plate is pushed backward, resulting in the advancing trench and the roll-over geometry.
To sum up, our seismic model indicates possible roll-over slab subductions from the southern boundary and feasibly also from the northern boundary, as well as the presence of the plume-like low-velocity anomalies extending from (at least) 800 km depth beneath the Caroline plate. Our geodynamical simulations further demonstrate that the roll-over subduction needs a young, hot oceanic plate and relatively fast landward pushing velocity.
Discussion and Conclusions
Our seismic model, derived from MC inversion of teleseismic SS phases, shows a high VS feature in the upper mantle and transition zone beneath the Caroline oceanic microplate. We observe a near-vertically continuous high-velocity anomaly throughout the upper mantle (Figure 2, Supplementary Figure S8, green arrow), and we consider it as a subducting slab from the southern boundaries of the Caroline plate. This “slab” seems to fall down vertically, deflect at 660 km discontinuity and advance backwards beneath the plate itself in the transition zone. Meanwhile, geodynamical modeling predicts that a young, hot oceanic plate with a fast pushing velocity can roll over, and such a geometry is inferred from our seismic model. On this basis, our model could provide a rare observation of a case of roll-over subduction due to the particular plate geometry surrounding the Caroline plate. The geometry of subducted slabs depends critically on the partitioning of the convergent velocity at the surface into its subducting plate motion component and trench migration component (Schellart, 2011), as confirmed here in this study. Hence, the pushing force due to the Pacific plate motion may have been enhanced, resulting in roll-over plate geometry. The roll-over mode is uncommon in actual subduction zones but is predicted to appear where 1) a subducting plate is very hot; and 2) the trailing edge of the subducting plate is vigorously pushed by another oceanic plate.
Another notable feature in our seismic model is the slow-velocity material that ascends from the bottom of the model space and detours around the slabs, reaching the surface (Figure 2B, magenta arrow). This slow-velocity feature might be the upper end of the Caroline plume, coming either directly from the CMB or rooted at some shallower depth. This plume may be significantly less rigid than the subducting slabs and thus rise upwards through the upper mantle. Its close proximity to the Eauripik rise may indicate that the rise provides a magma pathway to the Caroline ridge. Furthermore, the large hot material just beneath the Caroline plate can heat the plate itself and can thus make the plate buoyant, causing the roll-over regime to occur efficiently, as shown in Figures 3E,F. Or, it might be achievable that the plume itself is advected with the mantle flow and faster convection allows little time for the slab to heat up (e.g., Steinberger and O’Connell, 1998).
Based on our seismic model (Figure 2) and the geodynamic simulation results (Figure 3), we developed a schematic interpretation (Figure 4, Supplementary Figure S13). The Caroline plume rises upward from the deep mantle, detouring around the cold and rigid bodies and perhaps feeding the Caroline ridge (Supplementary Figure S13, magenta arrow). The Caroline ridge, that spreads at higher rates (Muller et al., 2008), causes the plate to move southward. The microplate is probably pushed southward by Pacific plate and fed by the mantle plumes, and subducts at its southern boundaries, possibly resulting in a roll-over subduction mode beneath the microplate itself. However, the shape of the slab depends on the tectonic history and there are other possible scenarios that can create the imaged slab shape (see Supplementary Material text).
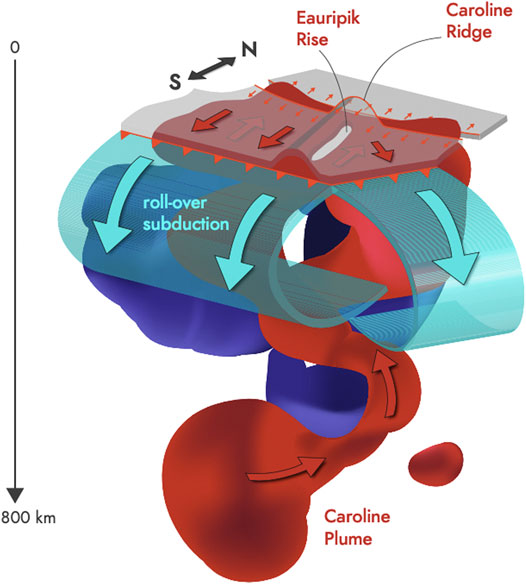
FIGURE 4. Schematic interpretation of the dynamics of upper mantle and mantle transition zone beneath the Caroline plate. The figure illustrates that the Caroline plate is moving southward, subducting under the Australian plate. The ridge push force is much larger than the trench migration velocity from the Australian plate, due to a relatively large volume of plume supplied from the base. This can lead to an advancing subduction regime and a roll-over slab geometry, as observed in our seismic velocity model (Figure 2). The Caroline plume upwelling from the core–mantle boundary or deep mantle is hot and soft, and thus takes a detouring path that avoids the subducting slabs within the region. See Supplementary Figure S13 for interpretation.
To date, the active effect of mantle plumes on the subducting slabs (e.g., Chang et al., 2016) and interactions with the mantle and neighboring slabs (e.g., Kiraly et al., 2018) remain poorly understood. Thus, the link between the plume from the CMB and the complex features of the upper mantle structure beneath the Caroline plate remain unclear. Hence, the ocean-bottom geophysical data on the plate (e.g., “Pacific Array”; Forsyth and Detrick, 2003; Kawakatsu et al., 2016) will help to better probe the upper-mantle interaction between plumes and slabs. As we showed in our models, an interplay between the upwelling plume and the oceanic microplates can have features uncommon to major plates, whose dynamics are not yet well constrained.
Data Availability Statement
Seismic waveform data can be obtained from the IRIS Data Management Center at www.iris.edu. See Supplementary Tables S3, S4 for data we used in this study.
Author Contributions
NF and S-ML organized binational workshops between the Université de Paris and Seoul National University on the 13th of November 2015, in Paris and on the 3rd of May 2016, in Seoul, to set up the project. NF developed and designed the research, and HJ carried out the data collection and analysis under the supervision of NF, YHK, and S-ML. AN conducted geodynamic modelling. HJ, NF, and YHK prepared the first draft. DF-B interpreted the tectonic setting of the region, did Figure 1, and improved the overall quality of manuscript, and AS provided the schematic interpretation of our model. S-ML provided thorough knowledge about the Caroline plate and encouraged all of the authors to investigate the detailed mantle structure beneath the plate. KK and NF maintained the seismological numerical tools for the analysis conducted in this work.
Funding
YHK and HJ acknowledge funding sources from Creative-Pioneering Researchers Program through Seoul National University (SNU SRnD 3345–20160014) and National Research Foundation of Korea (No. NRF-2019R1G1A1094833), and YHK, HJ, and S-ML acknowledge funding sources (PE99656 and PE99796) from Korea Institute of Ocean Science and Technology (KIOST) for the work.
Conflict of Interest
The authors declare that the research was conducted in the absence of any commercial or financial relationships that could be construed as a potential conflict of interest.
Supplementary Material
The Supplementary Material for this article can be found online at: https://www.frontiersin.org/articles/10.3389/feart.2021.593947/full#supplementary-material.
Acknowledgments
This is IPGP contribution 4187. NF, YHK, and S-ML acknowledge Université de Paris–Seoul National University joint workshop funding 2015–2016. AN thanks Tomoeki Nakakuki for providing his numerical code. Numerical simulations were conducted by DA systems of the Japan Agency for Marine-Earth Science and Technology (JAMSTEC). Numerical computations were performed on the S-CAPAD platform, IPGP, France.
References
Baldwin, S. L., Fitzgerald, P. G., and Webb, L. E. (2012). Tectonics of the new Guinea region. Annu. Rev. Earth Planet. Sci. 40, 495–520. doi:10.1146/annurev-earth-040809-152540
Barklage, M., Wiens, D. A., Conder, J. A., Pozgay, S., Shiobara, H., and Sugioka, H. (2015). PandSvelocity tomography of the Mariana subduction system from a combined land-sea seismic deployment. Geochem. Geophys. Geosyst. 16, 681–704. doi:10.1002/2014GC005627
Bozdağ, E., Peter, D., Lefebvre, M., Komatitsch, D., Tromp, J., Hill, J., et al. (2016). Global adjoint tomography: first-generation model. Geophys. J. Int. 207 (3), 1739–1766. doi:10.1093/gji/ggw356
Chang, S. J., Ferreira, A. M. G., and Faccenda, M. (2016). Upper- and mid-mantle interaction between the Samoan plume and the Tonga–Kermadec slabs. Nat. Commun. 7. doi:10.1038/ncomms10799
Christensen, U. R. (1996). The influence of trench migration on slab penetration into the lower mantle. Earth Planet. Sci. Lett. 140, 27–39. doi:10.1016/0012-821x(96)00023-4
Cizkova, H., and Bina, C. R. (2015). Geodynamics of trench advance: insights from a Philippine-Sea-style geometry. Earth Planet. Sci. Lett. 430, 408–415.
Cooper, P., and Taylor, B. (1987). Seismotectonics of New Guinea: a model for arc reversal following arc-continent collision. Tectonics 6, 53–67. doi:10.1029/tc006i001p00053
Deschamps, F., Konishi, K., Fuji, N., and Cobden, L. (2019). Radial thermo-chemical structure beneath Western and Northern Pacific from seismic waveform inversion. Earth Planet. Sci. Lett. 520, 153–163. doi:10.1016/j.epsl.2019.05.040
Dziewonski, A. M., and Anderson, D. L. (1981). Preliminary reference Earth model. Phys. Earth Planet. Interiors 25, 297–356. doi:10.1016/0031-9201(81)90046-7
Forsyth, D., and Uyeda, S. (1975). On the relative importance of the driving forces of plate motion. Geophys. J. Int. 43, 163–200. doi:10.1111/j.1365-246x.1975.tb00631.x
Forsyth, D. W., and Detrick, R. S. (2003). Probing geodynamic processes beneath the sea floor. Eos Trans. AGU 84 (47), 517–523. doi:10.1029/2003eo470001
French, S. W., and Romanowicz, B. (2015). Broad plumes rooted at the base of the Earth's mantle beneath major hotspots. Nature 525, 95–99. doi:10.1038/nature14876
Fuji, N., Chevrot, S., Zhao, L., Geller, R. J., and Kawai, K. (2012). Finite-frequency structural sensitivities of short-period compressional body waves. Geophys. J. Int. 190 (1), 522–540. doi:10.1111/j.1365-246x.2012.05495.x
Fuji, N., Meschede, M., Konishi, K., Jaegler, H., Kawai, K., Zhao, L., et al. (2016). DSM kernel suite. Available from: https://github.com/IPGP/DSM-Kernel. doi:10.5281/zenodo.439651
Fukao, Y., and Obayashi, M. (2013). Subducted slabs stagnant above, penetrating through, and trapped below the 660 km discontinuity. J. Geophys. Res. Solid Earth 118, 5920–5938. doi:10.1002/2013jb010466
Gaina, C., and Müller, D. (2007). Cenozoic tectonic and depth/age evolution of the Indonesian gateway and associated back-arc basins. Earth-Science Rev. 83, 177–203. doi:10.1016/j.earscirev.2007.04.004
Garnero, E. J., McNamara, A. K., and Shim, S.-H. (2016). Continent-sized anomalous zones with low seismic velocity at the base of Earth's mantle. Nat. Geosci 9, 481–489. doi:10.1038/ngeo2733
Geller, R. J., and Takeuchi, N. (1995). A new method for computing highly accurate DSM synthetic seismograms. Geophys. J. Int. 123, 449–470. doi:10.1111/j.1365-246x.1995.tb06865.x
Geller, R., and Ohminato, T. (1994). Computation of synthetic seismograms and their partial derivatives for heterogeneous media with arbitrary natural boundary conditions using the Direct Solution Method. Geophys. J. Int. 116. doi:10.1111/j.1365-246x.1994.tb01807.x
Hegarty, K. A., and Weissel, J. K. (1988). “Complexities in the development of the Caroline plate region, western equatorial pacific,” in The Ocean basins and margins. Editors A. E. M. Nairn, F. G. Stehli, and S. Uyeda (Boston, MA: Springer).
Hosseini, K., Sigloch, K., Tsekhmistrenko, M., Zaheri, A., Nissen-Meyer, T., and Igel, H. (2020). Global mantle structure from multifrequency tomography using P, PP and P-diffracted waves. Geophys. J. Int. 220 (1), 96–141. doi:10.1093/gji/ggz394
Huang, J., and Zhao, D. (2006). High-resolution mantle tomography of China and surrounding regions. J. Geophys. Res. 111, B09305. doi:10.1029/2005jb004066
Kawakatsu, H., Ekstrom, G., Evans, R., Forsyth, D., Gaherty, J., Kennett, B., et al. (2016). Pacific array (transportable broadband ocean floor array). Vienna, Austria: Abstract EPSC2016-2514 presented at the EGU General Assembly 2016, 17–22. April 2016.
Király, Á., Holt, A. F., Funiciello, F., Faccenna, C., and Capitanio, F. A. (2018). Modeling slab-slab interactions: dynamics of outward dipping double-sided subduction systems. Geochem. Geophys. Geosyst. 19, 693–714. doi:10.1002/2017gc007199
Konishi, K., Fuji, N., and Deschamps, F. (2017). Elastic and anelastic structure of the lowermost mantle beneath the Western Pacific from waveform inversion. Geophys. J. Int. 208, 1290–1304. doi:10.1093/gji/ggw450
Konishi, K., Fuji, N., and Deschamps, F. (2020). Three-dimensional elastic and anelastic structure of the lowermost mantle beneath the western pacific from finite-frequency tomography. J. Geophys. Res. Solid Earth 125. doi:10.1029/2019jb018089
Konishi, K., Kawai, K., Geller, R. J., and Fuji, N. (2014). Waveform inversion for localized three-dimensional seismic velocity structure in the lowermost mantle beneath the Western Pacific. Geophys. J. Int. 199, 1245–1267. doi:10.1093/gji/ggu288
Lallemand, S., Heuret, A., Faccenna, C., and Funiciello, F. (2008). Subduction dynamics as revealed by trench migration. Tectonics 27. doi:10.1029/2007tc002212
Macpherson, G. C., and Hall, R. (2001). Tectonic setting of Eocene boninite magmatism in the Izu-Bonin-Mariana forearc. Earth Planet. Sci. Lett. 186, 215–230.
Manea, V., and Gurnis, M. (2007). Subduction zone evolution and low viscosity wedges and channels. Earth Planet. Sci. Lett. 264 (1-2), 22–45. doi:10.1016/j.epsl.2007.08.030
Manea, V., Leeman, W., Gerya, T., Manea, M., and Zhu, G. (2014). Subduction of fracture zones controls mantle melting and geochemical signature above slabs. Nat. Commun. 5, 5095. doi:10.1038/ncomms6095
Marjanović, M., Fuji, N., Singh, S. C., Belahi, T., and Escartín, J. (2017). Seismic signatures of hydrothermal pathways along the east pacific rise between 9°16′ and 9°56′N. J. Geophys. Res. Solid Earth 122 (10241–10), 262. doi:10.1002/2017JB015004
Maus, S. (2009). Earth magnetic anomaly grid released. Eos Trans. AGU 90, 239. doi:10.1029/2009eo280003
Muller, R. D., Sdrolias, M., Gaina, C., and Roest, W. R. (2008). Age, spreading rates, and spreading asymmetry of the world’s ocean crust. Geochem. Geophys. Geosystems 9. doi:10.1029/2007gc001743
Nakao, A., Iwamori, H., and Nakakuki, T. (2016). Effects of water transportation on subduction dynamics: roles of viscosity and density reduction. Earth Planet. Sci. Lett. 454, 178–191. doi:10.1016/j.epsl.2016.08.016
Nakao, A., Iwamori, H., Nakakuki, T., Suzuki, Y. J., and Nakamura, H. (2018). Roles of hydrous lithospheric mantle in deep water transportation and subduction dynamics. Geophys. Res. Lett. 45, 5336–5343. doi:10.1029/2017gl076953
Ni, S., V. Helmberger, D., and Tromp, J. (2005). Three-dimensional structure of the African superplume from waveform modelling. Geophys. J. Int. 161, 283–294. doi:10.1111/j.1365-246X.2005.02508.x
Okino, K., Ando, M., Kaneshima, S., and Hirahara, K. (1989). The horizontally lying slab. Geophys. Res. Lett. 16, 1059–1062. doi:10.1029/gl016i009p01059
O’Neill, C., Muller, D., and Steinberger, B. (2005). On the uncertainties in hot spot reconstructions and the significance of moving hot spot reference frames. Geochem. Geophys. Geosystems 6.
Replumaz, A., Kárason, H., van der Hilst, R. D., Besse, J., and Tapponnier, P. (2004). 4-D evolution of SE Asia's mantle from geological reconstructions and seismic tomography. Earth Planet. Sci. Lett. 221, 103–115. doi:10.1016/s0012-821x(04)00070-6
Schellart, W. (2011). A subduction zone reference frame based on slab geometry and subduction partitioning of plate motion and trench migration. Geophys. Res. Lett. 38. doi:10.1029/2011gl048197
Schellart, W. P. (2005). Influence of the subducting plate velocity on the geometry of the slab and migration of the subduction hinge. Earth Planet. Sci. Lett. 231, 197–219. doi:10.1016/j.epsl.2004.12.019
Schellart, W. P. (2008). Kinematics and flow patterns in deep mantle and upper mantle subduction models: influence of the mantle depth and slab to mantle viscosity ratio. Geochem. Geophys. Geosyst. 9, a. doi:10.1029/2007GC001656
Stegman, D. R., Farrington, R., Capitanio, F. A., and Schellart, W. P. (2010b). A regime diagram for subduction styles from 3-D numerical models of free subduction. Tectonophysics 483, 29–45. doi:10.1016/j.tecto.2009.08.041
Stegman, D. R., Schellart, W. P., and Freeman, J. (2010a). Competing influences of plate width and far-field boundary conditions on trench migration and morphology of subducted slabs in the upper mantle. Tectonophysics 483, 46–57. doi:10.1016/j.tecto.2009.08.026
Steinberger, B., and O’Connell, R. J. (1998). Advection of plumes in mantle flow: implications for hotspot motion, mantle viscosity and plume distribution. Geophys. J. Int. 132 (2), 412–434. doi:10.1046/j.1365-246x.1998.00447.x
Torii, Y., and Yoshioka, S. (2007). Physical conditions producing slab stagnation: constraints of the Clapeyron slope, mantle viscosity, trench retreat, and dip angles. Tectonophysics 445, 200–209. doi:10.1016/j.tecto.2007.08.003
Turcotte, D. L., and Schubert, D. (2002). Geodynamics. 2nd ed. Cambridge, New York, Melbourne: Cambridge University Press.
Weissel, J. K., and Anderson, R. N. (1978). Is there a Caroline plate?. Earth Planet. Sci. Lett. 41, 143–158. doi:10.1016/0012-821x(78)90004-3
Widiyantoro, S., Kennett, B. L. N., and van der Hilst, R. D. (1999). Seismic tomography with P and S data reveals lateral variations in the rigidity of deep slabs. Earth Planet. Sci. Lett. 173, 91–100. doi:10.1016/s0012-821x(99)00216-2
Winterer, E. L., Riedel, W. R., Moberly, R. M., Resig, J. M., Kroenke, L. W., Gealy, E. L., et al. (1971). Site 63 shipboard Report. Washington, D. C: U.S. Gov. Print. Off., 323–340. doi:10.2973/dsdp.proc.7.1971
Keywords: Caroline plate, teleseismic SS phase, geodynamic simulation, finite-frequency traveltime inversion, roll-over slab geometry, mantle structure
Citation: Fuji N, Jang H, Nakao A, Kim Y, Fernández-Blanco D, Lee S-M, Schroeder A and Konishi K (2021) A Possible Roll-Over Slab Geometry Under the Caroline Plate Imaged by Monte Carlo Finite-Frequency Traveltime Inversion of Teleseismic SS Phases. Front. Earth Sci. 9:593947. doi: 10.3389/feart.2021.593947
Received: 12 August 2020; Accepted: 13 January 2021;
Published: 15 March 2021.
Edited by:
Susanne Buiter, RWTH Aachen University, GermanyReviewed by:
Maureen Long, Yale University, United StatesVlad Constantin Manea, National Autonomous University of Mexico, Mexico
Valentina Magni, University of Oslo, Norway
Copyright © 2021 Fuji, Jang, Nakao, Kim, Fernández-Blanco, Lee, Schroeder and Konishi. This is an open-access article distributed under the terms of the Creative Commons Attribution License (CC BY). The use, distribution or reproduction in other forums is permitted, provided the original author(s) and the copyright owner(s) are credited and that the original publication in this journal is cited, in accordance with accepted academic practice. No use, distribution or reproduction is permitted which does not comply with these terms.
*Correspondence: YoungHee Kim, eW91bmdoa2ltQHNudS5hYy5rcg==
†Present address: David Fernández-Blanco Consejo Superior de Investigaciones Científicas (CSIC), Instituto de Ciencias del Mar (ICM), Barcelona, Spain