 Shyam Ranjan
 Markus C. Leuenberger
- 1Division of Climate and Environmental Physics, Physics Institute and Oeschger Centre for Climate Change Research, University of Bern, Bern, Switzerland
- 2School of Environmental Sciences, Jawaharlal Nehru University, New Delhi, India
The widespread method for measuring Δ17O (17O-excess) is an offline CoF3 (Cobalt tri-fluoride) conversion of water to molecular oxygen with subsequent isotope determination by dual inlet mass spectrometry. High precisions for Δ17O measurements, using CoF3 water conversion, are so far only possible with off-line methods. Here we report on an improved and modified online continuous flow method intended for high precision triple oxygen isotope analysis. This method is improved by optimizing the reactor (site for conversion of H2O into oxygen through the chemical reaction) compositions, size of the fused silica capillary, flow regulator, and data treatment. Our modified online continuous method was further compared with the recently developed cavity ring down measurement principle. The precision is significantly better for the commercially available laser-based system than our current version of improved online CoF3 conversion method using mass spectrometry. Factors identified for limiting precision in our continuous flow system are: (i) compaction of the reactor with time that leads to the restriction of flow rate of carrier gas, (ii) the CoF3 treatment, (iii) the amount of CoF3 inside the reactor, (iv) the pore size of the steel frit, and (v) the metallic tube. Changes in all of these items as well as the dimension of the fused silica capillary, the positioning of the fused silica capillary in the open split, and the memory effect can also lead to a declining precision. These limiting factors for precision still provide us enough space for further improvement of our improved online method which will be worthwhile for the measurement of smaller aliquot samples as fluid inclusions for palaeoclimatic applications. With present improvement, multiple injections (n = 15 or even more) should be applied to obtain a precision better than 10 per meg for Δ17O. Furthermore, a comparison of the laser-based system with an improved conventional equilibration method has been made on precipitation samples originating from Jungfraujoch.
Introduction
Water stable isotopes (primarily oxygen isotopic ratio) are being used as an ideal tracer to reveal the underlying processes in the hydrologic cycle as well as past climatic information through their sensitive character during evaporation, condensation, mixing, and moisture transport (Dansgaard, 1964; Galewsky et al., 2016). Water is a naturally circulating resource that is constantly recharged (Oki, 2006) and exists in different phases (solid, liquid, and vaporized form) to play a vital role to sustain life on Earth. Concomitant differences in mass and symmetry of the stable isotopologues (HH16O, HH17O, HD18O, etc.) of the water during phase changes result in isotopic fractionations (mass dependent) that is being used as a tool to understand the hydrological cycle and its link to climate (Epstein and Mayeda, 1953; Dansgaard, 1954; Craig, 1961). For mass dependent fractionation (also known as terrestrial fractionation) changes in 17O would be approximately half of the changes in 18O relative to 16O (Luz et al., 1999). The isotopic ratios of 18O/16O or 17O/16O in samples are denoted with 18R or 17R which is commonly reported to an international reference (i.e., VSMOW) standard through eqs. 1 and 2 where delta values have become a standard tracer for environmental studies generally denoted in permil (‰) (Dansgaard, 1954).
Anomalies from an assumed dependence are expressed by eq. (3), in which λ corresponds to an arbitrary number obtained from the scaling, i.e., 0.528 from meteoric waters.
High precision and accuracy (0.02 to 0.03‰, 95% confidence) are required for the above-mentioned hydrological applications related to water stable isotope exchange (Barkan and Luz, 2005) in order to understand the underlying processes.
Several methods were investigated for water stable isotope analysis that includes conventional equilibration with CO2, fluorination, or electrolysis to O2 with subsequent isotope determination by mass spectrometry or laser-based systems and direct laser-based isotope analysis on water vapor briefly summarized in the following.
Equilibration method was for long the method of choice for water stable oxygen isotopes, in particular for δ18O. Yet, it was limited for δ17O analysis due to the 13C interferences of the used CO2 during the equilibration process. Elsig and Leuenberger (2008) improved the equilibration method for measurements of δ18O and δ17O using a chemical buffering of the water samples to keep the pH value lower than 4.3 for which the carbon is by far present as carbonic acid (H2CO3) or dissolved CO2 compared to bi-carbonate (HCO3–) or carbonate (CO3–) and helps to control the masking effect of the 14 times more abundant 13C on mass 45. Therefore, fractionation during the equilibration process of the 13C remains constant. They estimated the precision of δ18O to be 0.03‰, while for 17O-excess better than 0.1‰ at 95% confidence interval. Although precision improved in Elsig and Leuenberger (2008) equilibration method, the amount of samples (5000 μl) required for analysis is still very large for the above-mentioned application. Irrespective of this improvement, precision is not good enough to clearly disentangle the relevant influences on water samples, as documented in Elsig and Leuenberger (2008). Only recently, a further significant improvement of the equilibration method by freezing out the CO2 under liquid nitrogen temperature (Affek and Barkan, 2018) was published. Unfortunately, it was too late to be applied to our method, since we already performed all the measurements discussed in the present study.
O’Neil and Epstein (1966) were the first to use water fluorination with BrF5 for oxygen isotopic measurements of water samples by following the reaction:
Using micro-liter sized water samples with isotope ratio reproducibilities for both δ17O and δ18O of ±0.1‰ (95% confidence interval), this method is free of fractionation and memory effects. Instead of BrF5, Brenninkmeijer and Röckmann (1998) used a fluorination method using 5% F2 in helium rather than pure F2 in order to enhance safety procedure. Instead of BrF5 and F2, a less hazardous solid reagent CoF3 was first used by Lantz (1967) who produced molecular oxygen through the following reaction:
In his first study, the precision for δ18O was only moderate with ∼ 0.7‰ (95% confidence).
New developments by Sano et al. (1976) and Matthews and Hayes (1978) that were the first to use an online application of isotopic ratio mass spectrometry by using a continuous flow of the carrier gas for the preparation and analysis of the samples opened up new versions of the above-mentioned conversions. Namely, CoF3 method became attractive for reasons of safety and was later applied by Baker et al. (2002) to determine δ18O and δ17O through a continuous flow isotope ratio technique using 0.02 μL of the H2O sample. The reproducibility for δ18O and δ17O was 0.54‰ and 0.33‰, respectively (68% confidence interval). Franz and Röckmann (2004) successfully modified this method for direct air sample application and extended it to hydrogen isotopes for small samples (∼120 nL of water) but with less precision (∼0.7 and ∼1.3‰ for δ17O and δ18O, respectively).
Barkan and Luz (2005) successfully modified the method of Baker et al. (2002) using a molecular sieve and liquid helium for trapping and storage of the produced oxygen, so as to obtain the highest precision through the dual inlet mass spectrometer technique. The precision obtained for δ18O and δ17O is 0.003 and 0.006‰ (at 95% confidence interval), respectively. Although results by this method are excellent and were already successfully applied to the above-mentioned applications related to water stable isotope exchange processes in hydrologic cycle, it is laborious and quite costly, in particular the liquid helium. To our best knowledge, high precision determination like Barkan and Luz (2005) has not been obtained by the continuous flow principle using IRMS. Here we will try to explain in detail of the continuous flow principle using an open split transfer in order to reach high precision results for further applications.
Using the electrolysis method, with CuSO4 as an electrolyte, Meijer and Li (1998) determined the δ17O and δ18O variations in meteoric waters with a precision of 0.07 and 0.1‰, respectively, but the required sample amount is relatively large (700 μL) which is often limiting. Furthermore, δ17O with a precision of ±0.3‰ in CO2 gas was obtained by Assonov and Brenninkmeijer (2003) but this precision is insufficient for the above-mentioned applications.
A new method based on laser absorption spectroscopy has been developed in recent years and is known to achieve the precision (Steig et al., 2014) close to the dual inlet IRMS (Barkan and Luz, 2005). The working principle and technical setup to obtain the triple oxygen isotopic composition of water from laser-based absorption spectroscopy have already been discussed in detail (Schoenemann et al., 2013; Affolter et al., 2014, 2015; Steig et al., 2014) and therefore is beyond the scope of this article. In this article, three measurement principles, namely continuous flow method (ConFlow), laser-based system (LBS), and CO2-H2O equilibrium method were run to test their precision and comparison among each other’s, whereas real samples were intentionally run only using already established laser-based system (PICARRO L2I40i) (Schoenemann et al., 2013; Steig et al., 2013; Affolter et al., 2015) and CO2-H2O equilibrium method (Elsig and Leuenberger, 2008) to avoid precious sample shortage during several trial and error test on ConFlow optimization.
Experimental
Instrumentation for the Continuous Flow System
In our experiment, an Isoprime mass spectrometer (GV Instruments, Manchester, United Kingdom) is used with an accelerating voltage of 4.1 kV to measure the isotopic abundance in O2. Ion currents are collected continuously by Faraday cups for 32, 33, and 34 m/z with resistors being set at 5 × 10⁻⁸, 5 × 10⁻¹⁰, and 1 × 10⁻⁸ Ω, respectively. With these settings, we found an overall ionization efficiency of our mass spectrometer of 0.5‰, corresponding to the detection of a single O2 molecule out of 2,000 molecules entering the mass spectrometer. The number of detected O2 molecules can only be increased at the expense of overall precision. Sample and reference gas were allowed to pass through a single open split. We used an open split closed at one end, i.e., a glass tube with a length of 7.3 cm having inner and outer diameters of 1 and 2 mm, respectively. Since fractionations are associated with open split settings (Elsig and Leuenberger, 2010), care must be taken with the correct referencing as well as with the protection against contamination with laboratory air. Five fused silica capillaries with varying diameter were used: (i) the reference capillary, attached to a movable piston, allows admission of a working standard (pure O2); (ii) the background capillary is set to a fixed position, with a constant flow of a working standard of known isotopic composition in order to minimize adsorption effects; (iii) the He capillary, a high flow of helium enters the open split, acting as a dynamic seal to the laboratory air; (iv) the mass spectrometer capillary, connected to the mass spectrometer inlet valve; (v) the sample capillary, eluted O2 signals from H2O conversion are transferred through it. Only the reference capillary can be lifted and lowered within the open split. The dimensions and fluxes of all capillaries used in our experiment are summarized in Supplementary Table 1.
The setup used for this study is shown in Figure 1, manual or autosampler (H/Device) injections (2 μl H2O) are possible. Prior to injection into a purified (carbagas, purity, 99.999%) helium flow through a high temperature septum (BGB analytic, part no SM11), the syringe (Hamilton, part no 80300-00) is flushed two times with 5 μL of the water sample to minimize the memory effect. The helium flow is maintained at a constant level by a mass flow controller (Analyt-MTC, model no 35827). Sample and helium lines are attached to the injection port (Swagelok, T-union). The reaction of H2O with CoF3 takes place in a nickel tube (0.250″ outer diameter (hereafter o.d.) × 0.056″ inner diameter (hereafter, i.d.) of 5.4″ in length). The upper and the lower end of the nickel tube are attached to the 1.7″ (0.250″ o.d × 0.056″ i.d.) and 2.2″ (0.250″ o.d × 0.056″ i.d.) length of a stainless steel tube through connectors (Swagelok. part no SS-400-6), respectively; 10 μm of steel frit (Grace, port no 703125) is attached to the lower end of the upper steel tube for the convenient filling of a new batch of CoF3 to the inside of the nickel tube. Nickel wool (Säntis analytical) is placed at ∼2 cm above the bottom end of the nickel tube after filling CoF3 (approximately 3 g) and Ni grains in such a way that the reagents are ideally placed to reach a constant temperature of 643 K (370 °C) in the reacting furnace. The HF produced as a byproduct of the reaction is removed by a NaF trap (Franz and Röckmann, 2004) by the following reaction:
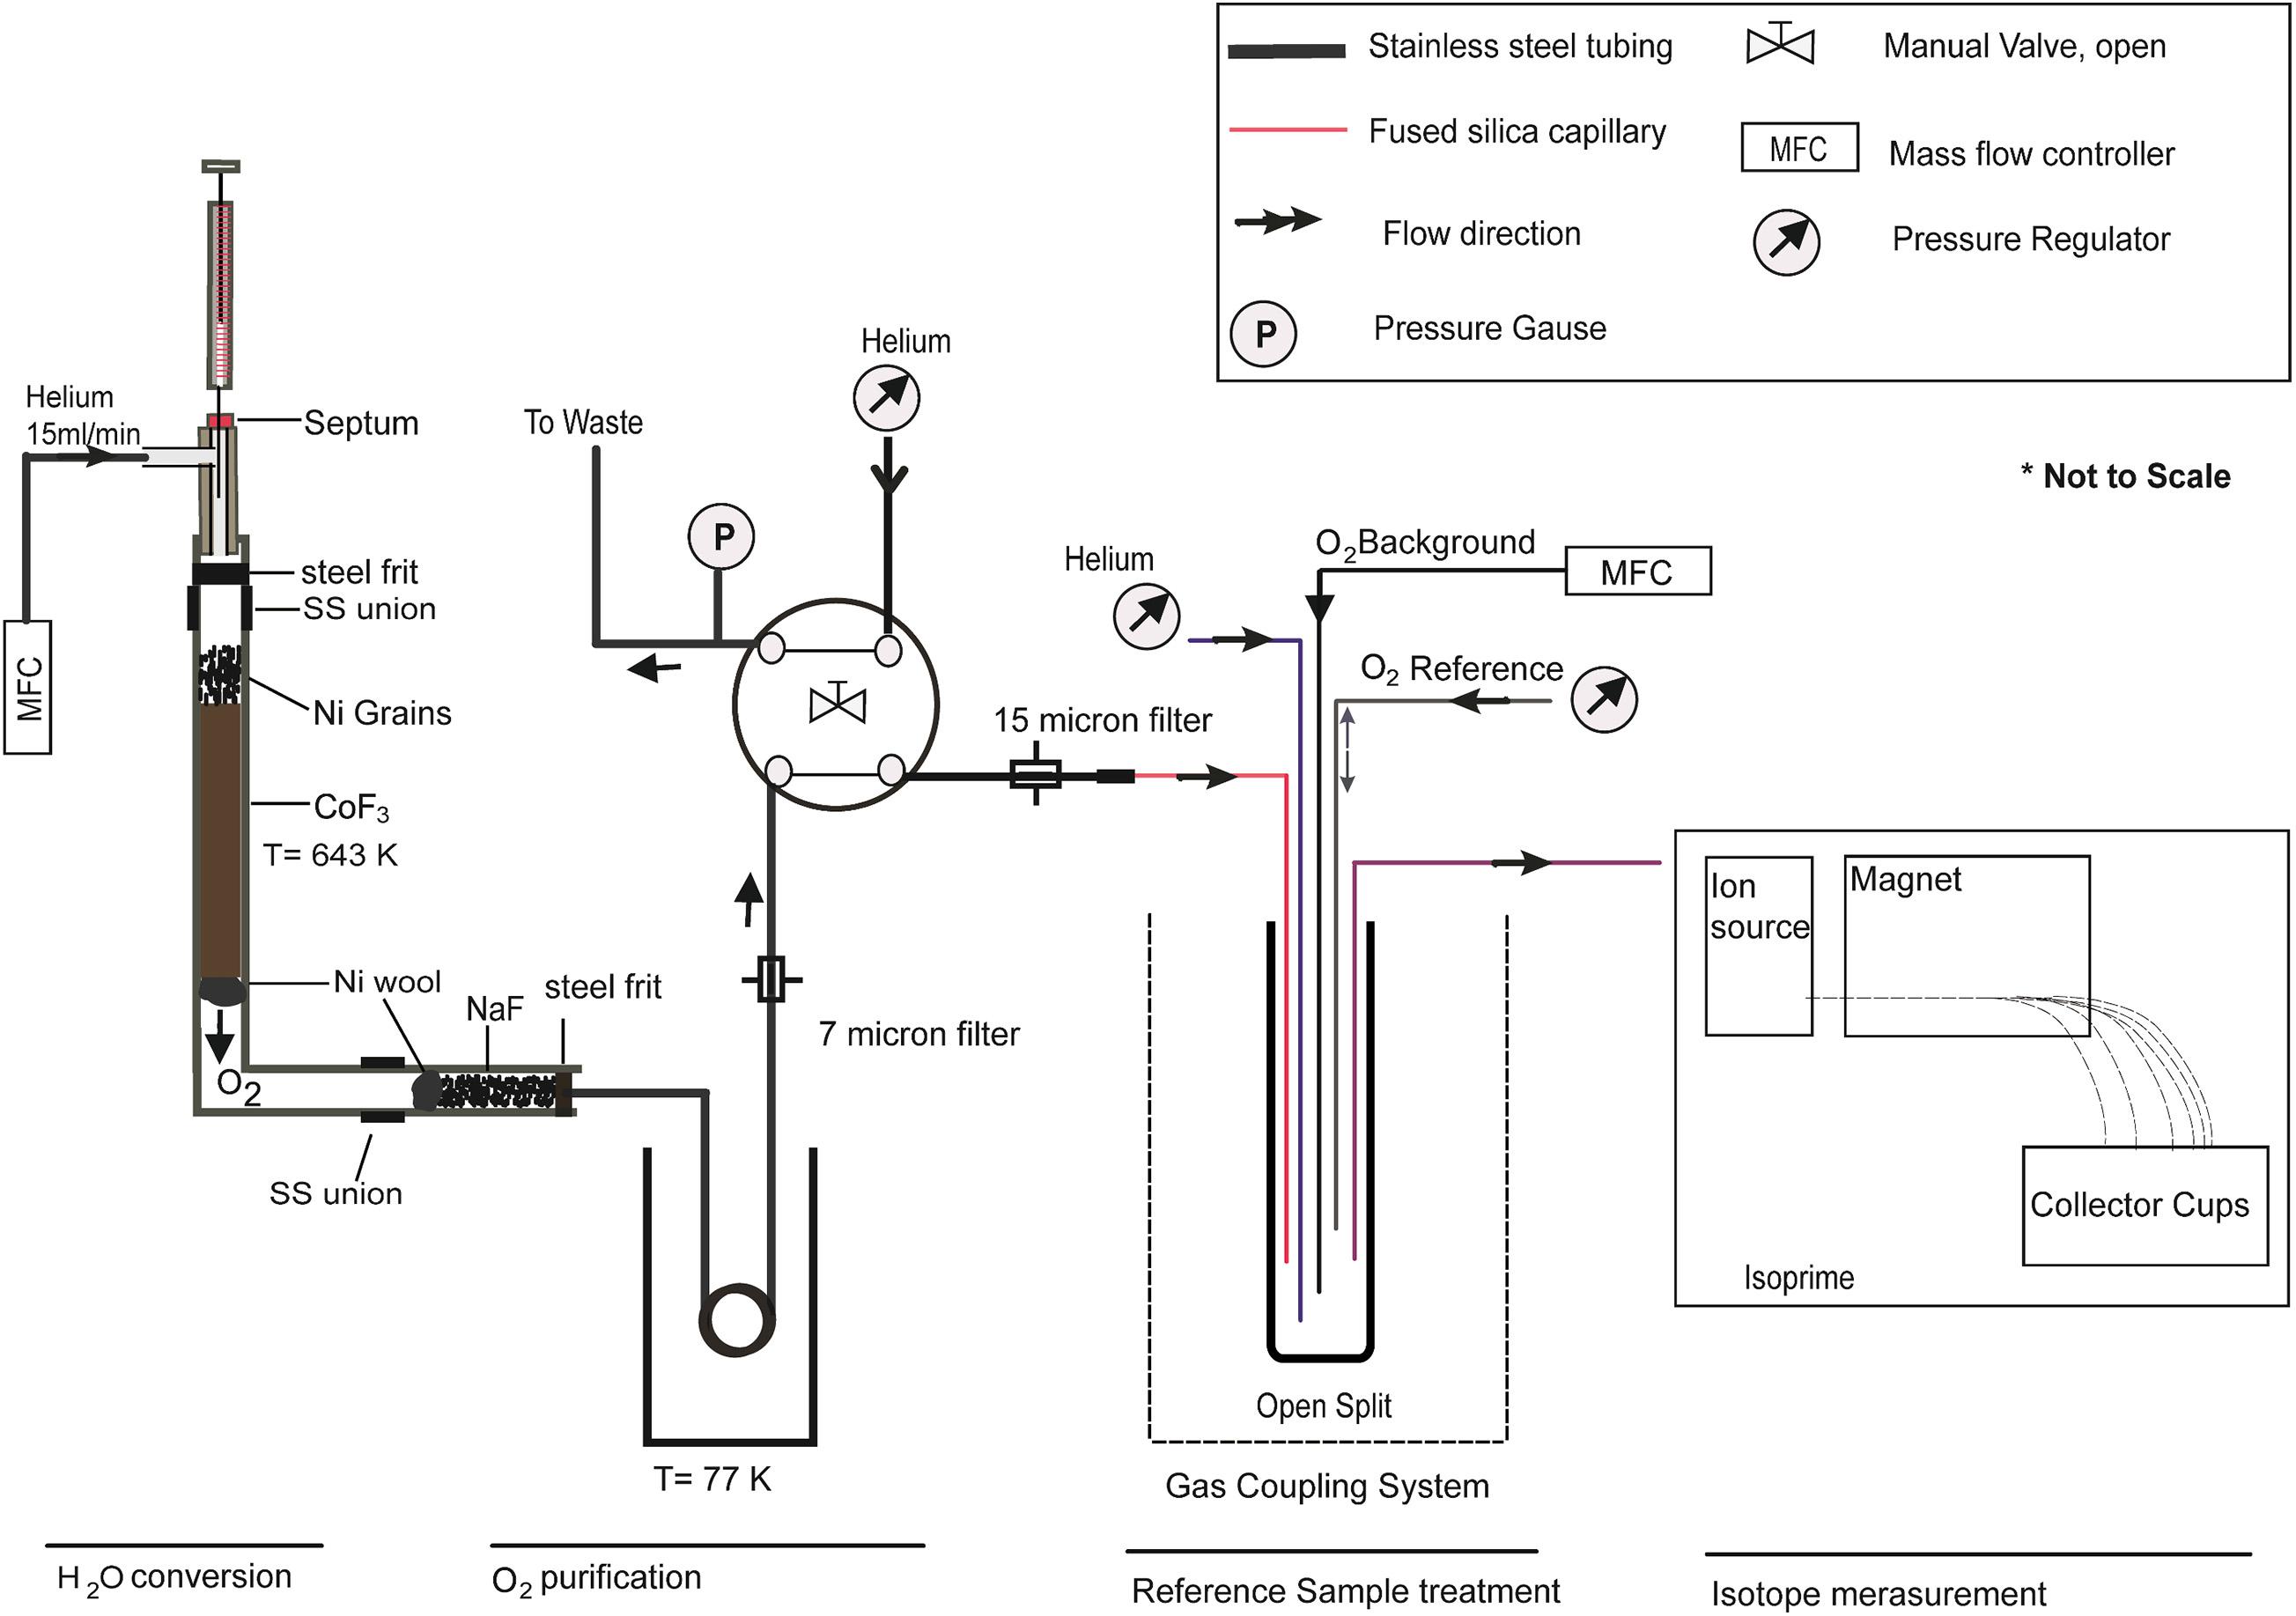
Figure 1. Sketch of the continuous flow setup which has four steps (i) H2O conversion line, where H2O sample reacts with CoF3 and is converted into O2 gas. (ii) O2 purification part where contaminated O2 with its byproduct gets purified by using a cryogenic cool trap and micron size filters. (iii) Reference sample treatments part where sample and reference gases are injected on a smoothed O2 background level. (iv) Isotope measurement part where O2 isotopes are measured in the mass spectrometer (Isoprime).
The NaF trap consists of a 6 cm, 0.250″ o.d. 0.056″ i.d. nickel tube with a 10 μm steel frit at the front end and nickel wool at the rear end. It is completely filled with NaF (approximately 170 mg). A subsequent liquid nitrogen trap (coiled steel tube with ∼ 70 cm length 0.250″ o.d.) acts as a backup trap to remove any condensable left in the gas stream for safe venting. To minimize the chances of any condensable escaping from the liquid N2 trap, a 7 μm filter (Swagelok, part no SS-F-7) is additionally attached with a 0.125″ o.d. steel tube to prevent fused silica capillaries. A manually operated 4-port valve (Swagelok, part no SS43Y6FS2) allows switching between waste and measuring mode. It has a sample inlet and outlet as well as waste and helium flushing port, the latter have a pressure gauge (Kistler) and a Pfeiffer vacuum pump attached (0.125″ o.d. steel tube) to read the pressure of the produced O2 signal after the chemical reaction and to evacuate the sample line, respectively. A homemade gas coupling system (open split) is attached to the 4-port sample outlet by a 0.0265″ o.d. steel tube. The helium capillary leading to the open split is set to a flow rate of 6.25 ml/min while the background capillary is controlled through a mass flow controller at a flow rate of 0.2 ml/min. The reference capillary is set to 7.5 ml/min while the sample capillary is controlled through another mass flow controller at a flow rate of 15 ml/min for an improved Gaussian type sample peak. Only the reference capillary is attached to a movable piston to admit pulses of the working standard.
Measurement Procedure of the Continuous Flow System
Filling and Preconditioning of Reactor Furnace
An argon ventilated chamber is used for filling solid CoF3 into the nickel tube. Prior to loading, CoF3 was heated to 70°C for ∼5 h in an argon atmosphere for water removal. As per recommendation by Baker et al. (2002) we conditioned the CoF3 by gradually increasing the temperature to 400°C within 2 days while maintaining the helium flow through the loaded nickel tube at 0.2 ml/min in order to insure the removal of adsorbed water and remaining contaminants. Thereafter, the temperature is reduced to its operating value of 370°C.
IRMS Setting and Testing
Center and magnetic scans were performed to optimize our isotopic ratio mass spectrometer. Afterward, a leak test was performed with the working standard (pure O2) in an on-off mode. In case of a leak, higher currents for mass/charge ratios 28 (N2) and 40 (Ar) are detectable by mass spectrometer, documenting the intrusion of laboratory air into the system. The performance of the IRMS cup collector can easily be seen (Supplementary Figure 1) by monitoring the correlation between the ion mass of 33 and 34. Prior to analysis, the flow of the carrier gas is maintained at 15 ml/min through the reactor and the open split by the mass flow controller.
Calibration of Conversion Yield
For estimating the eluted O2 from the H2O conversion, Barkan and Luz (2005) measured the 32/40 m/z ratio by adding a known amount of Ar to O2 collected in the sample tube. We injected ∼5.95 ml of compressed ambient air, i.e., equivalent to the O2 amount in 2 μl of H2O, and calculated the peak areas of 32 m/z of air and eluted O2 from the H2O conversion, respectively. Conversion yields obtained from this procedure were quantitative (100% ± 5%), indicating complete conversion of the H2O sample. Since the transfer yield of eluted O2 to the IRMS depends on the dimensions as well as the positions of the different capillaries in use they need to be optimized. The helium capillary is placed near the bottom end of the open split mainly to seal against laboratory air. The background capillary, placed above the helium capillary, transferring pure O2 for a constant background signal, results in a significant improvement of the isotope ratios in particular during the start and the end phases of the O2 signal produced from the H2O sample. To monitor pure machine drift and shifts in the background level, we used the reference (working standard on-off pulse of pure O2 with a known isotopic value) at the beginning and end of the sample analysis. Two references at the beginning and two at the end were performed for five sample injections in each acquisition run (Figure 2). The reason for using more than one sample and reference peak in a single acquisition is to improve the results through statistics and to save time. Reference peaks from the on-off mode switching of the reference capillary in the open split are obtained in a rectangular shape, in contrast to the Gaussian-like shape of the sample peak.
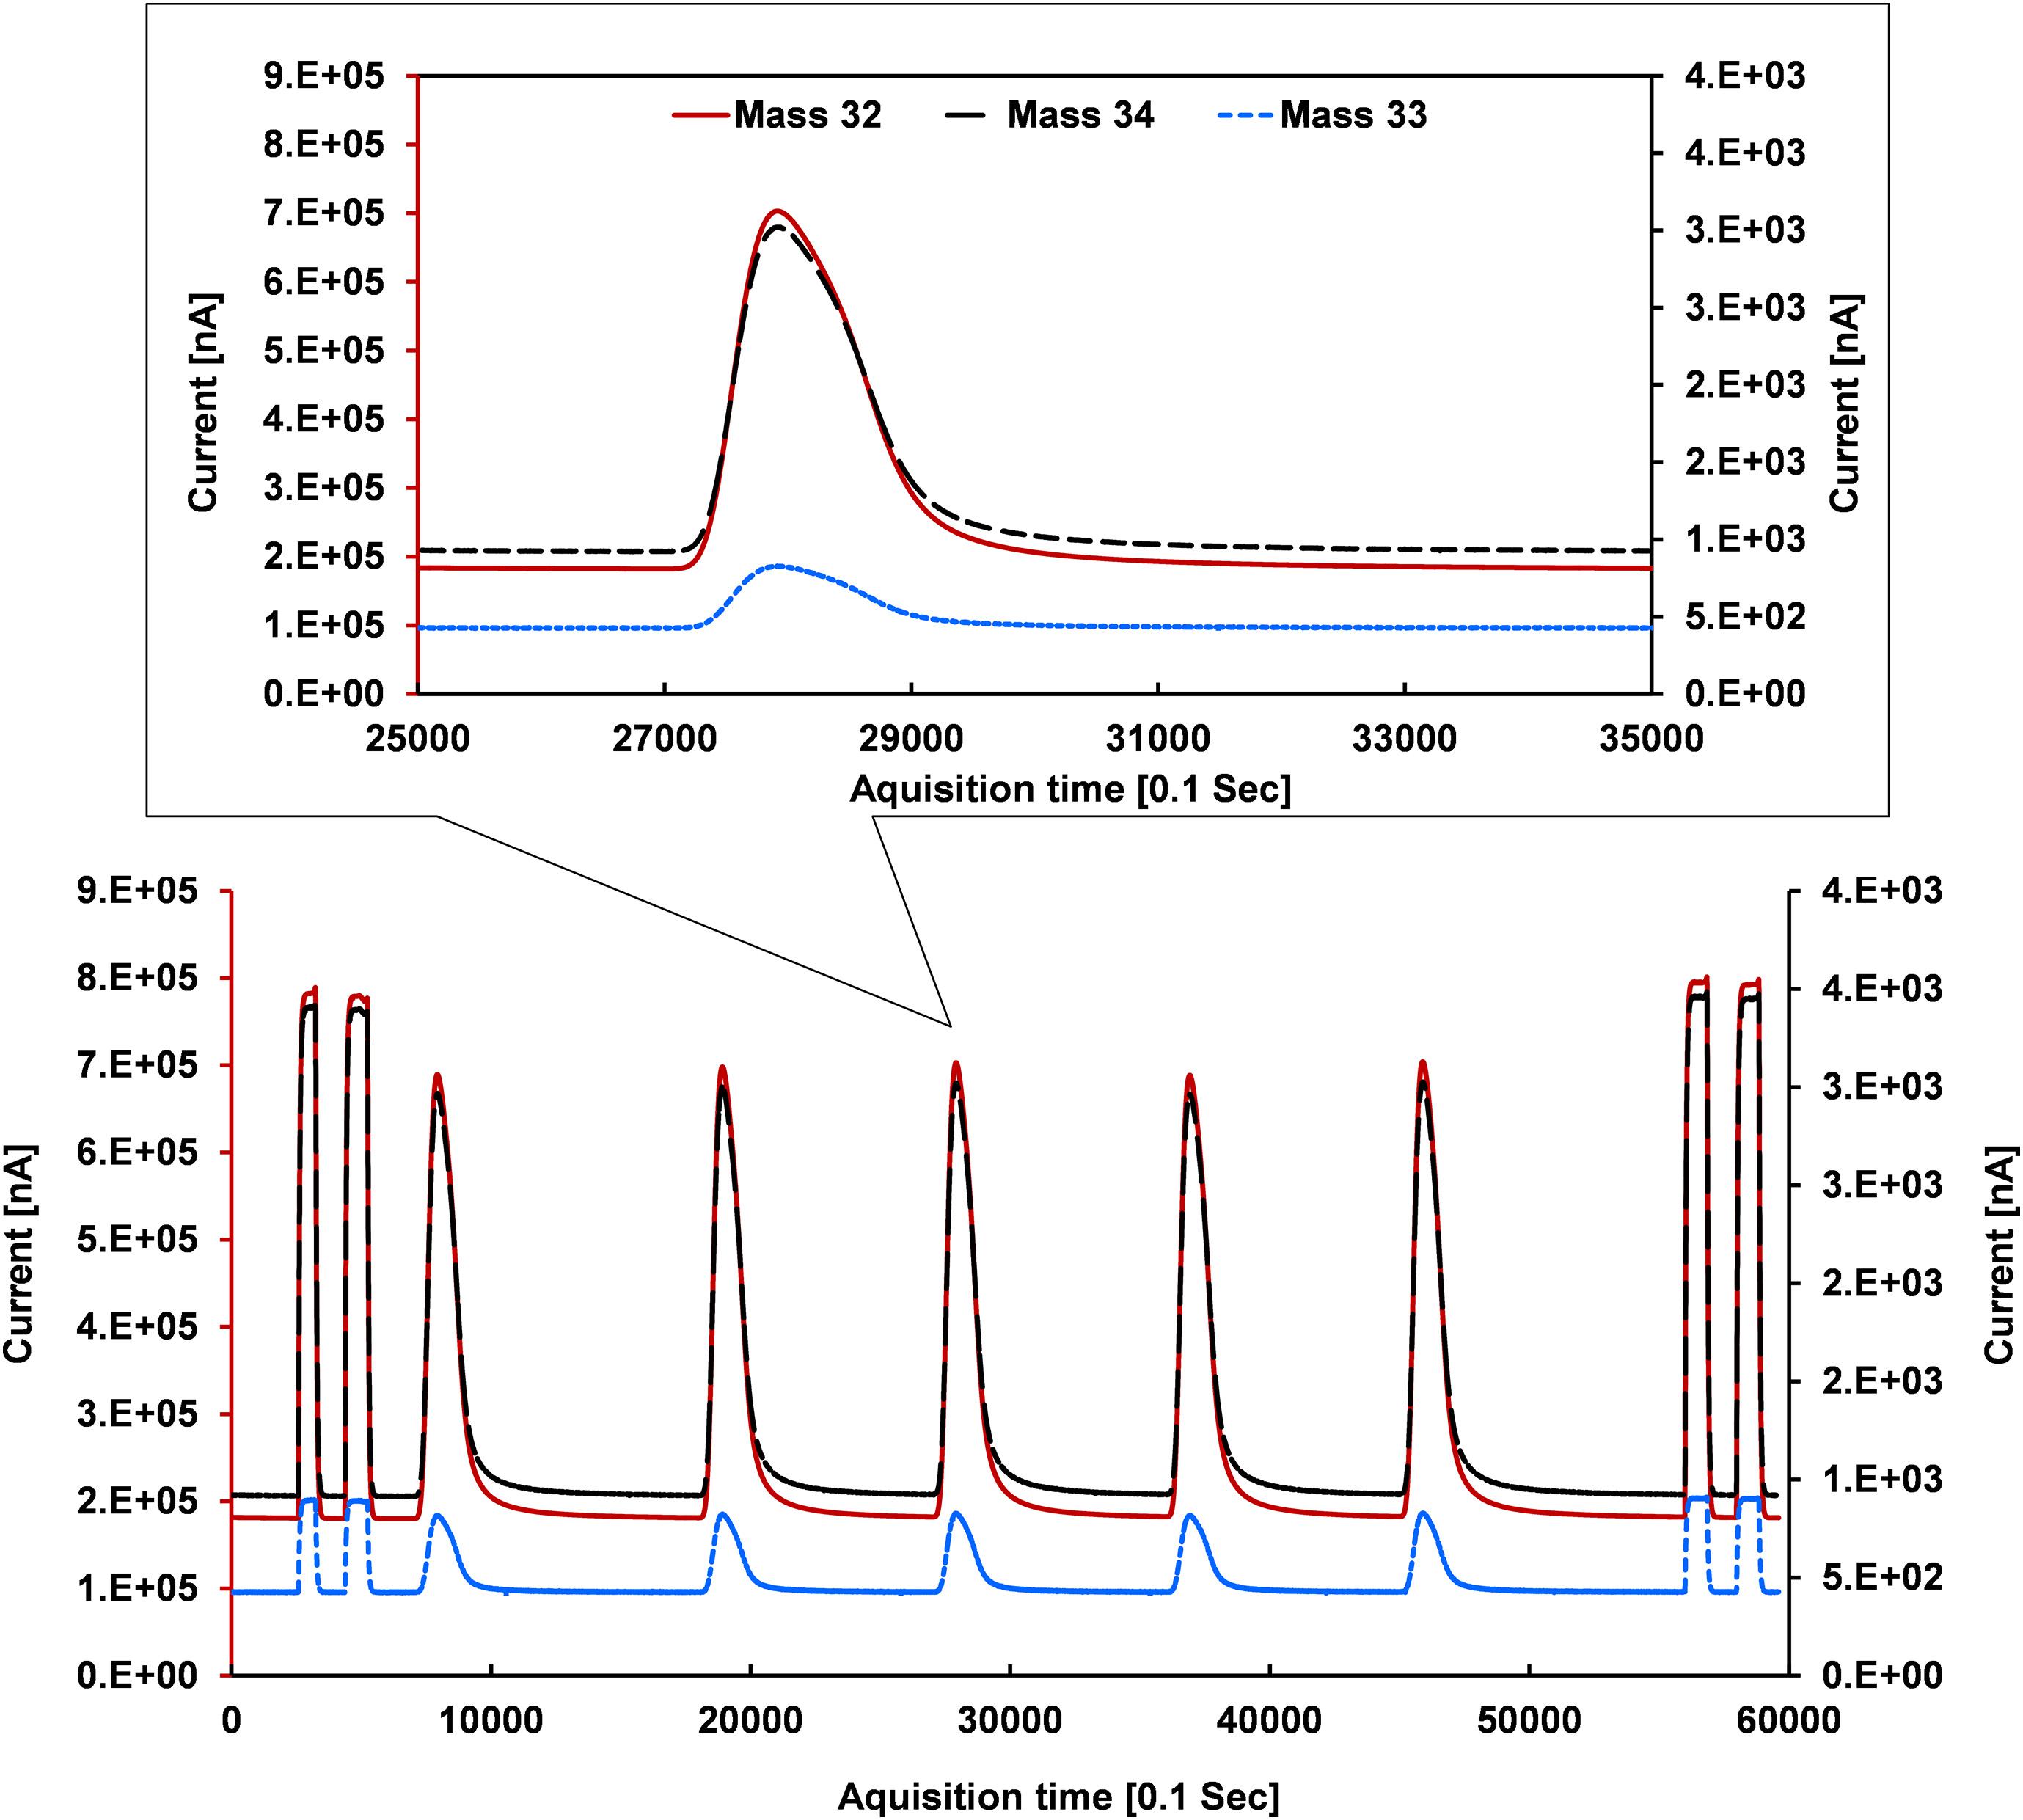
Figure 2. Ion beams of mass/charge 32 (primary y-axis), 33 and 34 (secondary axis) where references appear in rectangular shapes and sample signals as Gaussian (not perfect Gaussian due to H2O sticking nature, upper panel sub-plot) peaks which were obtained after optimizing the reactor composition and behavior.
Data Processing of the Continuous Flow System
The IonVantage software of the Isoprime mass spectrometer allows us to store the signals for beams 32, 33, and 34 m/z with a time step of 0.1 s. This raw data are passed to a template compiled by us that largely follows the steps described by Bock et al. (2010). Individual background correction and drift correction are considered in our template to improve the dataset.
The peak shape observed in the continuous flow system is not truly rectangular or Gaussian due to the rapidly moving capillary and the sticking nature of the H2O molecule inside the tube (Franz and Röckmann, 2004), respectively. For the background correction of 32, 33, and 34 m/z, values are always taken before the beginning of each rectangular as well as the Gaussian peak. We observed that the signal depends on the determination of the peak start. Bock et al. (2010) believe that this observation relates to the fact that real peaks are not truly Gaussian and therefore the peak margins, in particular, are isotopically inhomogeneous even after a time shift correction (Elsig, 2009). To sort out these problems, each peak is individually evaluated in the template. To select the start and endpoint for the calculation, raw mass/charge (m/z) data are processed to get their time derivatives [d(m/z)/dt]. Two different procedures were performed for the reference calculation. The first one (Supplementary Figure 2A) is a calculation of the reference peak from its start to end. The second is based on the calculation of the reference peak when the time derivative gets stable which is the case on the plateau of the rectangular reference peak (Supplementary Figure 2B). The whole peak and plateau results of our internal St-91 standards are shown in Table 1. A better precision was obtained for plateau evaluation which may indicate that fractionations at the peak start lead to the poorer precision. However, the second calculation type can’t be used for the sample peaks due to its Gaussian shape peak character. Start and endpoint for the peak calculations were chosen according to the time derivatives of the mass/charge ratio (Figure 3) and are valid for each individual run [d(m/z)x/dt, where x corresponds to 32, 33, and 34].
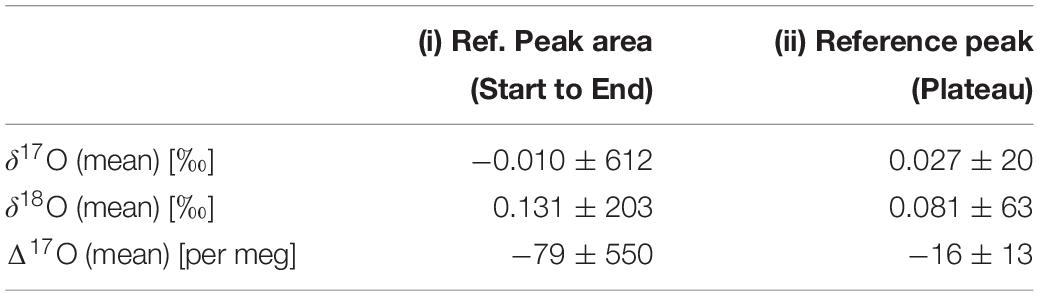
Table 1. δ17O, δ18O, and Δ17O of O2 (reference) for the continuous flow method by changing reference peak area calculations by using the whole reference area and only plateau of the reference area.
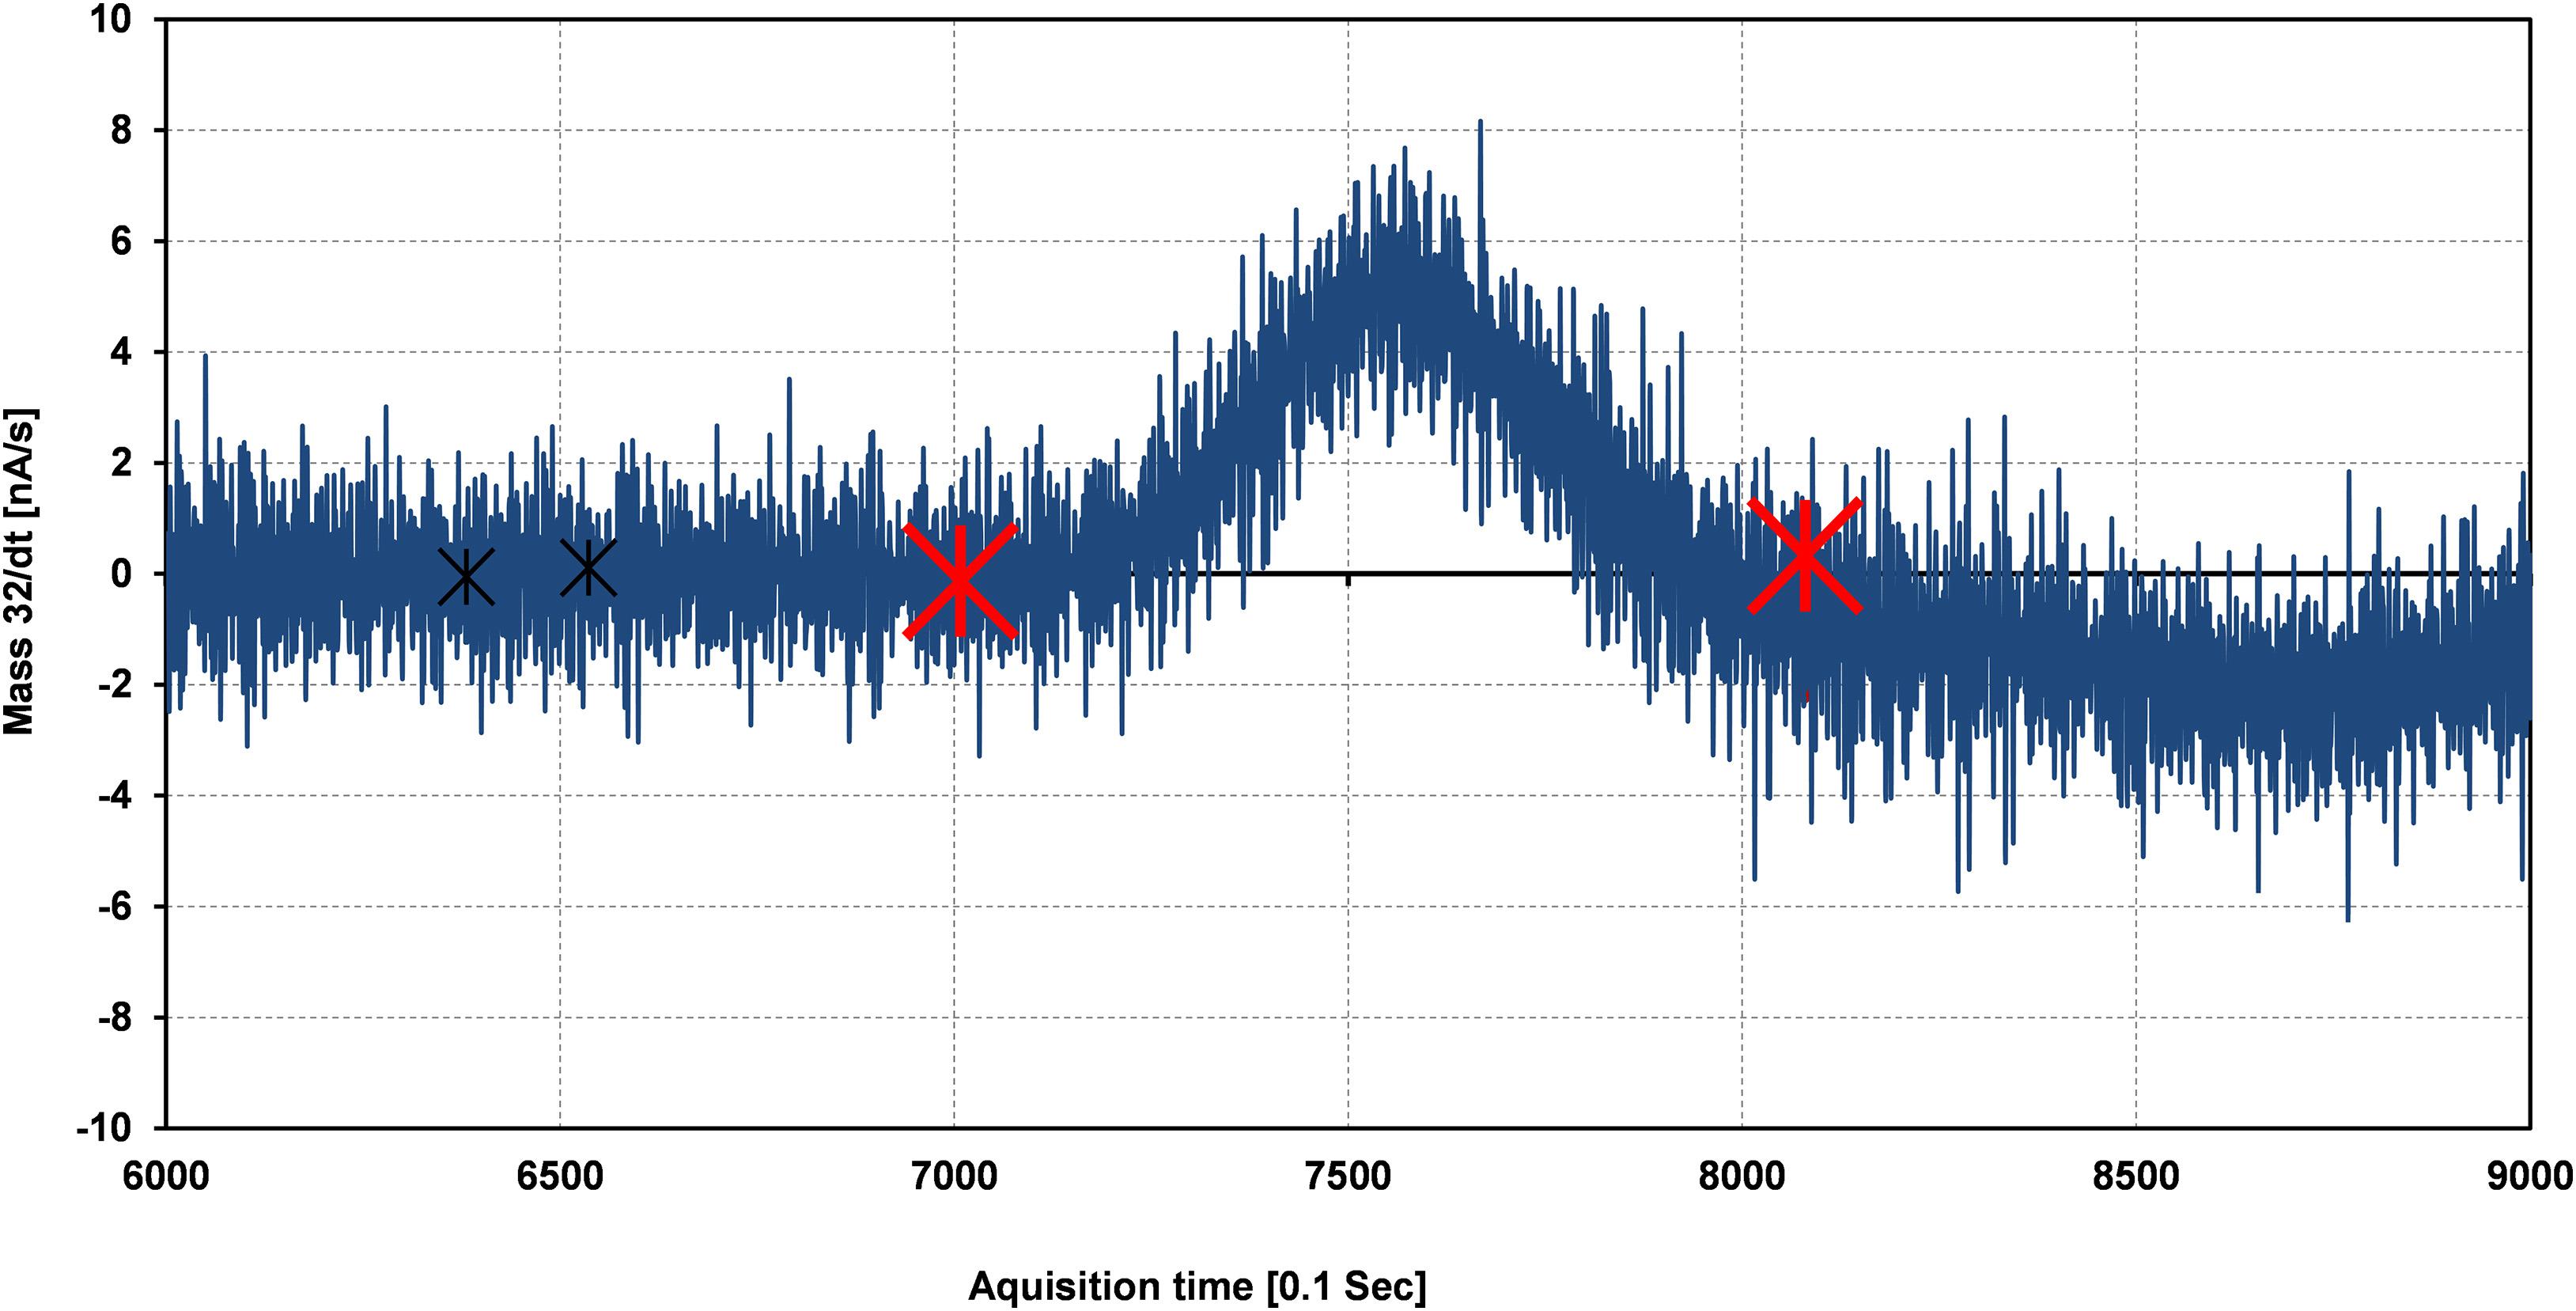
Figure 3. Calculation of the delta (δ17O, δ18O) value for the sample signal is taken in between the range of the two red crosses while for the background calculation (black crosses) for better precision based on the time derivative of the mass/charge ratio [d(m/z)/dt].
CO2-H2O Equilibration Method
We also have used an improved CO2-H2O equilibration method that measures the triple oxygen isotopes of water sample. The detailed technical setup and experimental design of this method are available in Elsig and Leuenberger (2008) and are briefly summarized in the following:
A CO2-H2O equilibrium is necessary for precise isotope ratio measurements in particular for oxygen-17 and Δ17O. This can be achieved through the admission of an isotopically known CO2 gas and proper shaking of the sample for time-efficient equilibration. A scaling factor r is used to determine the delta value correction which summarizes effects such as cross contamination or mass spectrometry sensitivity. Care must be taken during the optimization of the scaling factor since stretching or compressing of the r factor can increase or decrease its value from unity. For precise Δ17O measurements through the equilibrium method, 5 ml of the water sample was taken, equilibrated with about 7–8 mL STP of CO2 (185 ± 10 mbar of CO2), and admitted to a glass flask of 45 cm3 at 20°C temperature. The sample pH was optimized (<4.3 pH units) because it is also one of the most critical factors for the Δ17O value for this method. Applying the equilibrium method for samples with a Δ17O non-zero signal, the δ18O value has to be corrected. Assuming a false δ13C value of the admitted CO2 leads to wrong Δ17O and δ18O values which also requires correction. Therefore, to obtain better precision through this method, all measurements were performed under a strict pH regulation, optimum sample amount, and a well-determined scaling factor to limit cross contamination.
Laser-Based Method (Picarro L2140-i)
Samples were measured at our division Climate and Environmental Physics (CEP), the University of Bern. Measurements were performed using state-of-art Picarro L2140-i wavelength-scanned cavity ring-down spectroscopy (WS-CRDS) instrument (Picarro Inc., United States). Before an isotopic analysis, samples were transferred into 2 mL glass vials and sealed with rubber/aluminum caps to mount on a PAL COMBI-xt autosampler (CTC Analytics AG, Zwingen, Switzerland) that is connected to the Picarro L2140-i for δ17O, δ18O and δD analysis (Affolter et al., 2015). Six times injections were performed, and the first three injections were discarded to reduce the memory effect and obtained the reproducibility of typically 0.1‰ for δ18O and δ17O. The obtained precision for Δ17O is under 7 per meg.
Results
Continuous Flow System and CoF3 Method
To characterize potential influences of the carrier gas on the eluted O2 sample signal, we performed an experiment where a 2 μl H2O sample was allowed to react with CoF3 and pass through the cryogenic cool trap without any carrier gas (Supplementary Figure 3). A pressure gauge was attached to the sample line to record the amount of O2 as a function of time; an increase of 53.3%, 17%, 14.8%, 7.7%, and 7.3% in the eluted O2 signal (pressure percentage) was observed at the time interval of 0–10, 10–20, 20–40, 40–60, and 60–90 min, respectively. Two-third of the sample signal were obtained within 30 min from the sample injection, while a small percentage of the sample was still obtained at the end of measurements (after 90 min) which indicates the sticky nature of water that can lead to fractionation effects within our system line and hence reduce precision. These results document the importance of using a carrier gas in an online system to obtain a Gaussian shape sample signal that significantly helps to minimize fractionation effects and reducing measurement time. The different behavior of the reactor composition on the 32 m/z ratio is shown in Figure 4. Multiple tests indicated that the carrier gas flow was dependent on the reactor composition. To maintain constant flow conditions, these experiments strongly suggest to use a mass flow controller in the carrier gas line (see Figure 1), since the reactor filled with CoF3 and metallic frit at the bottom of the nickel tube generates high pressure inside the reactor that is most probably due to compaction of the reactor. The byproduct gas HF (HF is acidic and produced as a byproduct, see eq. 5) was able to back diffuse onto the injector and to react with the septum resulting in its damage. Hence, the lab air contamination probability increased which could easily be checked via N2 detection in the IRMS. To solve this problem, we used nickel grains after CoF3 chemical filling. Ni grains are non-reactive with CoF3 and water. Blocking of the pores of the steel frit by CoF3 particles resulted in a significant lowering of the carrier gas flow as observed in many of our experiments. To sort out this problem, Ni grains which have a bigger grain size compared to CoF3 were placed at the bottom before CoF3 fillings for each experiment.
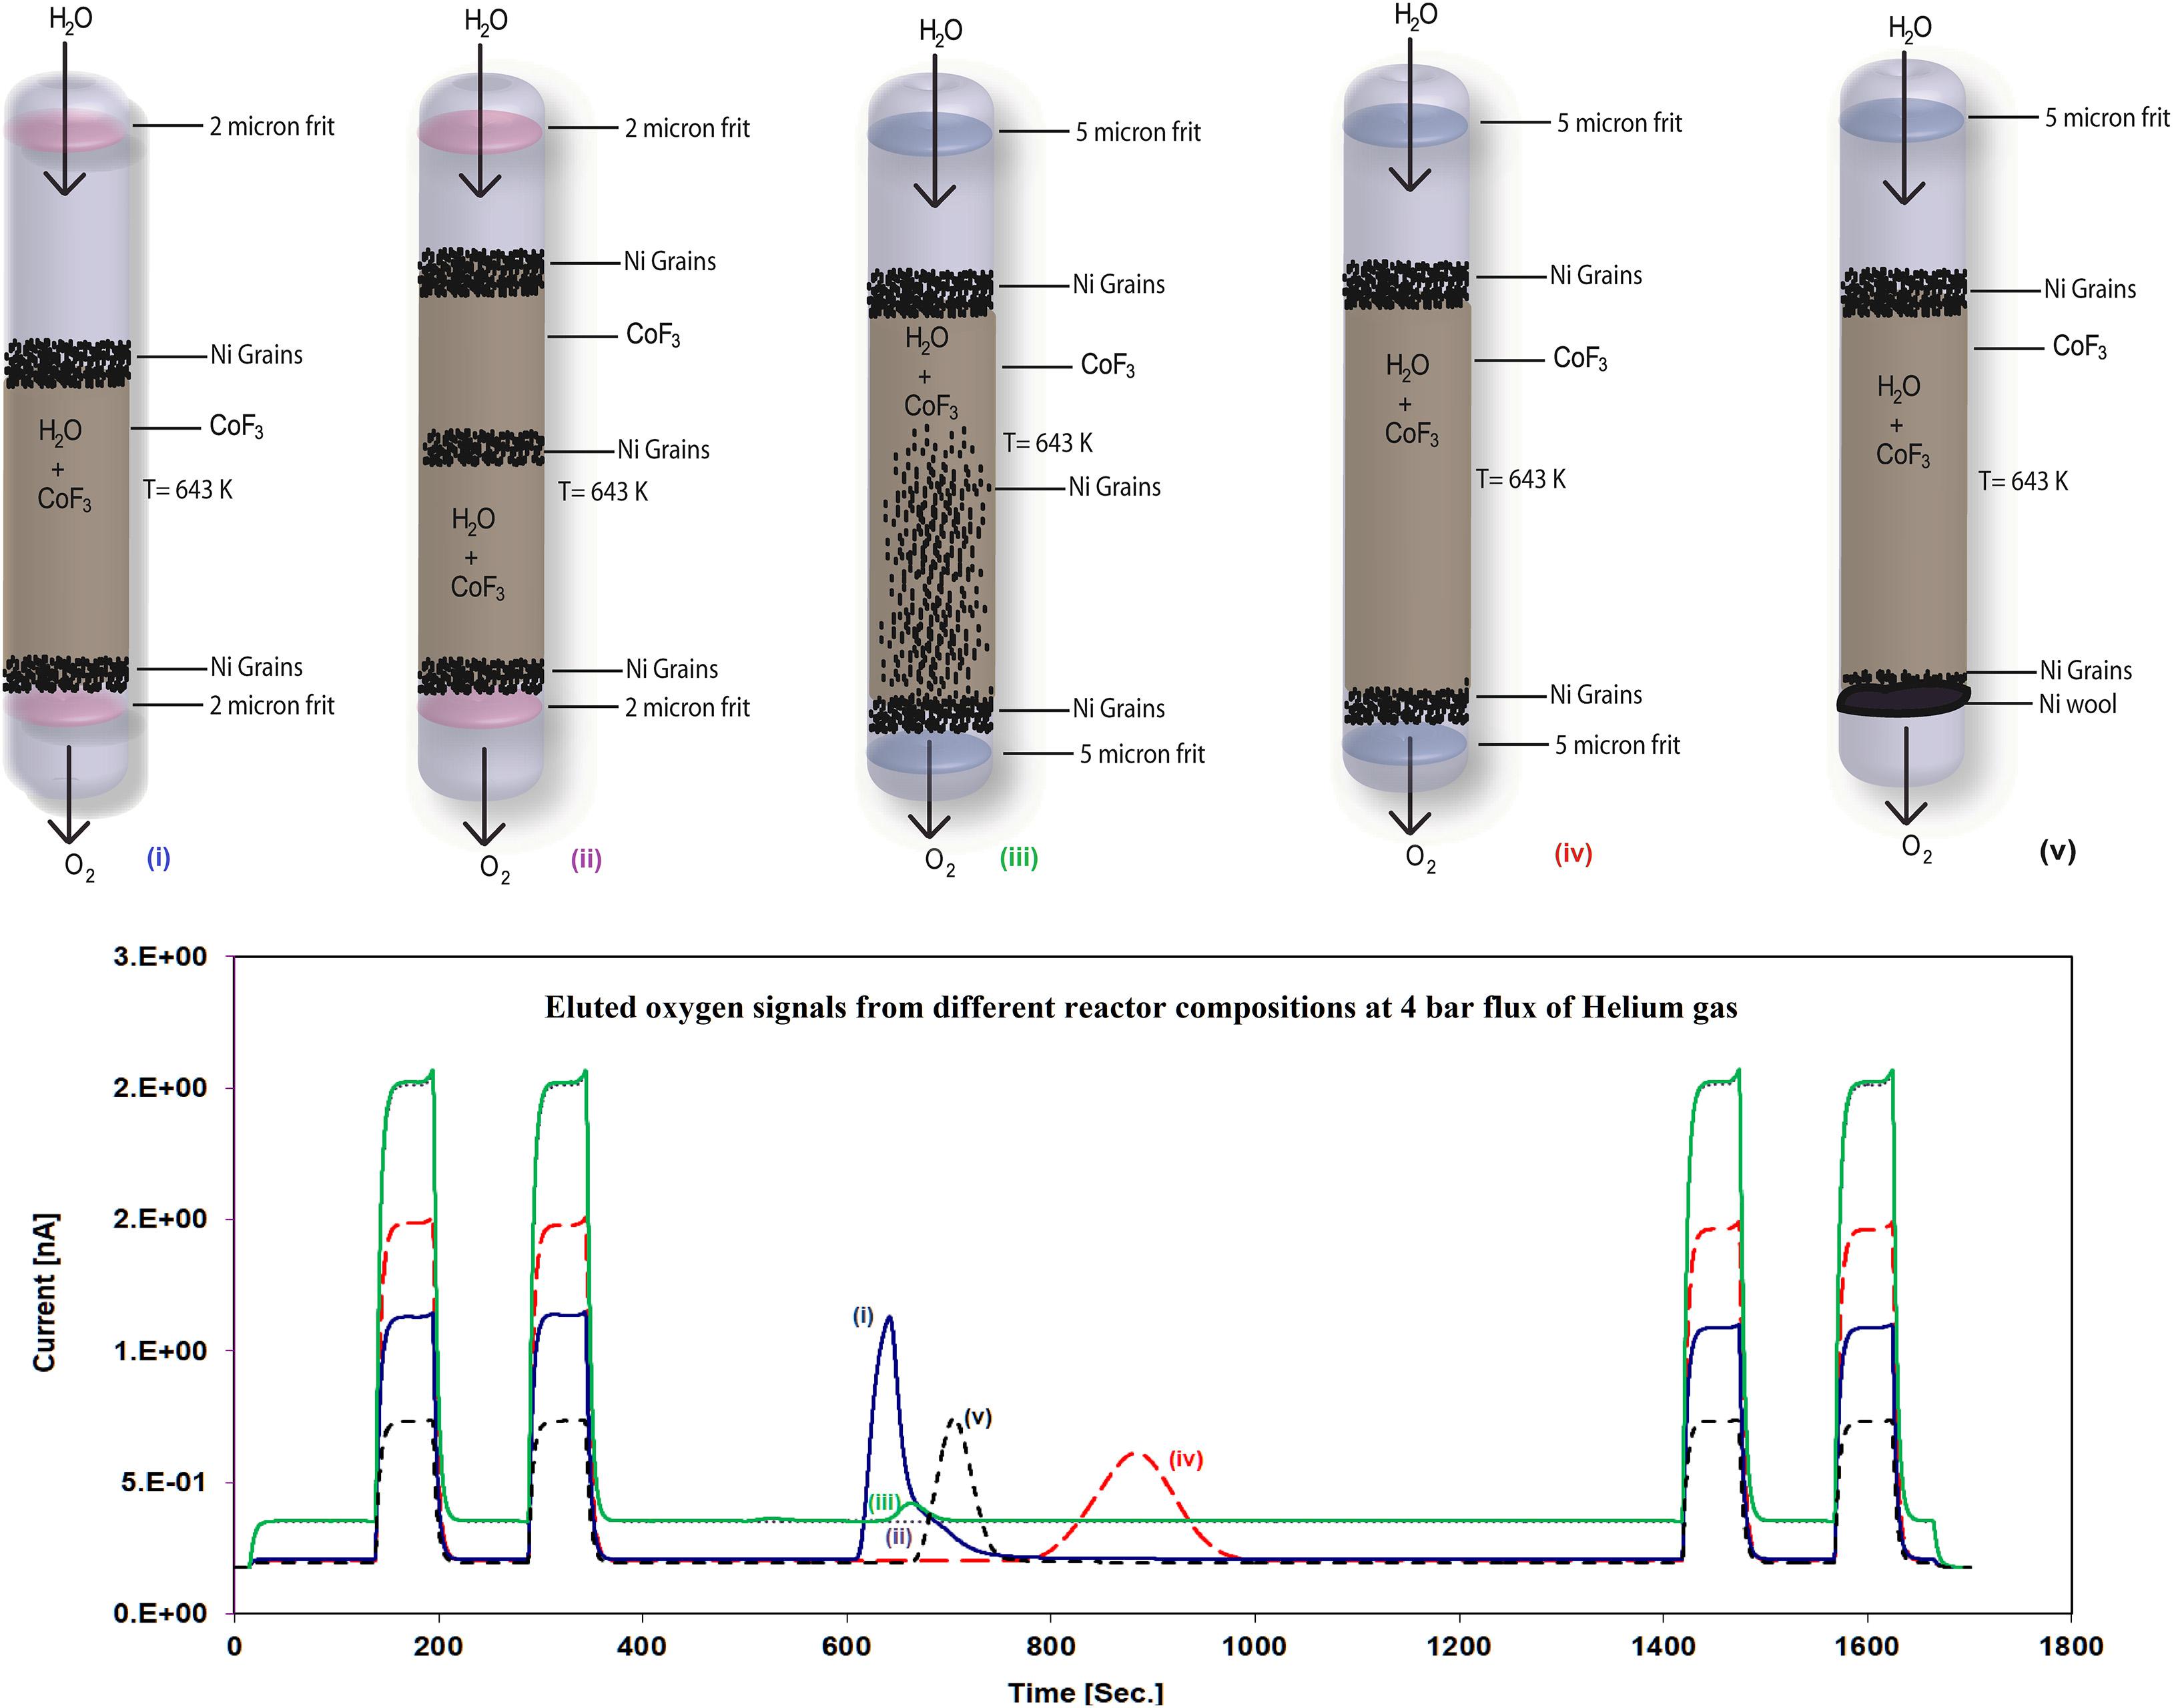
Figure 4. The different reactor compositions (upper panel) and the corresponding evolution of the O2 signal (mass 32, lower panel) dependent on the reactor compositions (The number (i–v) in the upper and lower panel corresponds to the different reactor setup and its associated eluted O2 peak after chemical reaction from the corresponding reactor). The higher the compactness of the reactor (peak color and peak number color corresponds to the reactor number), the lower the eluted O2 signal, and at the same time, higher compactness leads to the higher reference signals because of an increased dilution effect.
In the case of Figure 4i, 2 micron steel frits and Ni grains were used at the top and the bottom, respectively, while a <2 g of CoF3 amount was filled in between. However, a sample peak with a long tail was observed. This might be due to the sticking nature of water on the larger surface area of the nickel tube exposed to the H2O molecule because of the lower CoF3 filling (<3 g of CoF3) resulting in a tailing of the eluted sample signal (Franz and Röckmann, 2004); 38 ml/min of the flow rate was measured at the end of the sample line. The signal obtained with this setup is higher in amplitude compared to other fillings but the long tailing of the eluted O2 signal is the limiting factor for obtaining better precision.
In Figure 4ii, 2 micron steel frits were used at the top and the bottom and >3 g CoF3 were filled together with Ni grains at the top, the middle, and the bottom of CoF3. The reason for filling in more chemicals was to reduce the tailing effect of the eluted sample signal by reducing the surface area exposed to the H2O molecule in the nickel tube. Nickel grains were also filled into the middle of the chemical to reduce compactness. However, no O2 was eluted because of the high restriction (<1 ml/min of the flow rate) of the reactor most probably due to the increased chemical amount. Because of the restricted flow of helium through the reactor, reference signals (rectangular shape) with higher amplitude were observed due to a lower dilution effect by the very low carrier helium flow.
In Figure 4iii, nickel grains were mixed with CoF3 and 2 micron steel frits were replaced with 5 micron steel frits to increase the flow rate of the carrier gas and hence to increase the amplitude of the eluted sample signal. The idea behind mixing CoF3 with Ni grains was to allow the carrier gas along with the eluted O2 signal to easily pass through the reactor. A flow rate >5 ml/min was measured in parallel to a lower amount of the eluted sample signal and higher amplitudes of reference signals which shows us that the compactness of the reactor remained high even though the size of the steel frits was increased. Obviously, the mixture restricts the flow contrary to expectation.
In Figure 4iv, 5 micron filters as well as nickel grains at the top and the bottom of the reactor were used, with smaller amounts of Ni grains at the bottom than at the top. Eluted Gaussian shape sample signals were recorded with 30 ml/min of the carrier gas flow rate. A wider sample signal is observed due to the insufficient flow of the carrier gas which is unable to push the sample through the reactor to obtain an optimal eluted signal. Although the eluted O2 signal obtained from this setup is not bad, a further improvement of the peak form yielded better isotope results.
Therefore, in Figure 4v, 5 micron steel frits at the top and nickel wool instead of steel frit at the bottom were used in the nickel tube reactor to increase the flow of the carrier gas with an eluted signal and to avoid compactness of the reactor. A flow rate of 60 ml/min was obtained with an improved Gaussian shape eluted sample signal. We also tested with 10 micron filters (figure not shown) at the top and nickel wool at the bottom with the same amount of chemical filling; however, the eluted O2 signal area and shape were similar to Figure 4v, setup. Therefore, we continued with the reactor setup of version (v). Based on all these experimental designs, 5 and 10 micron steel frits and nickel wool are a better option to obtain optimal eluted Gaussian shape sample signals and along with it an improved precision.
After optimizing the reactor setup for the eluted O2 peak, the mass flow controller was connected to the sample injection line to carry a constant flow and multiple sample injections were performed afterward which is shown in Figure 2.
Comparison of H2O-CO2 Equilibrium and Laser-Based Method
Measurements with the equilibration method have been performed on precipitated water sampled at the High Altitude Research Station Jungfraujoch. They are compared to the measurements on the same water samples with the laser-based system (Picarro L-2140i) as shown in Figure 5.
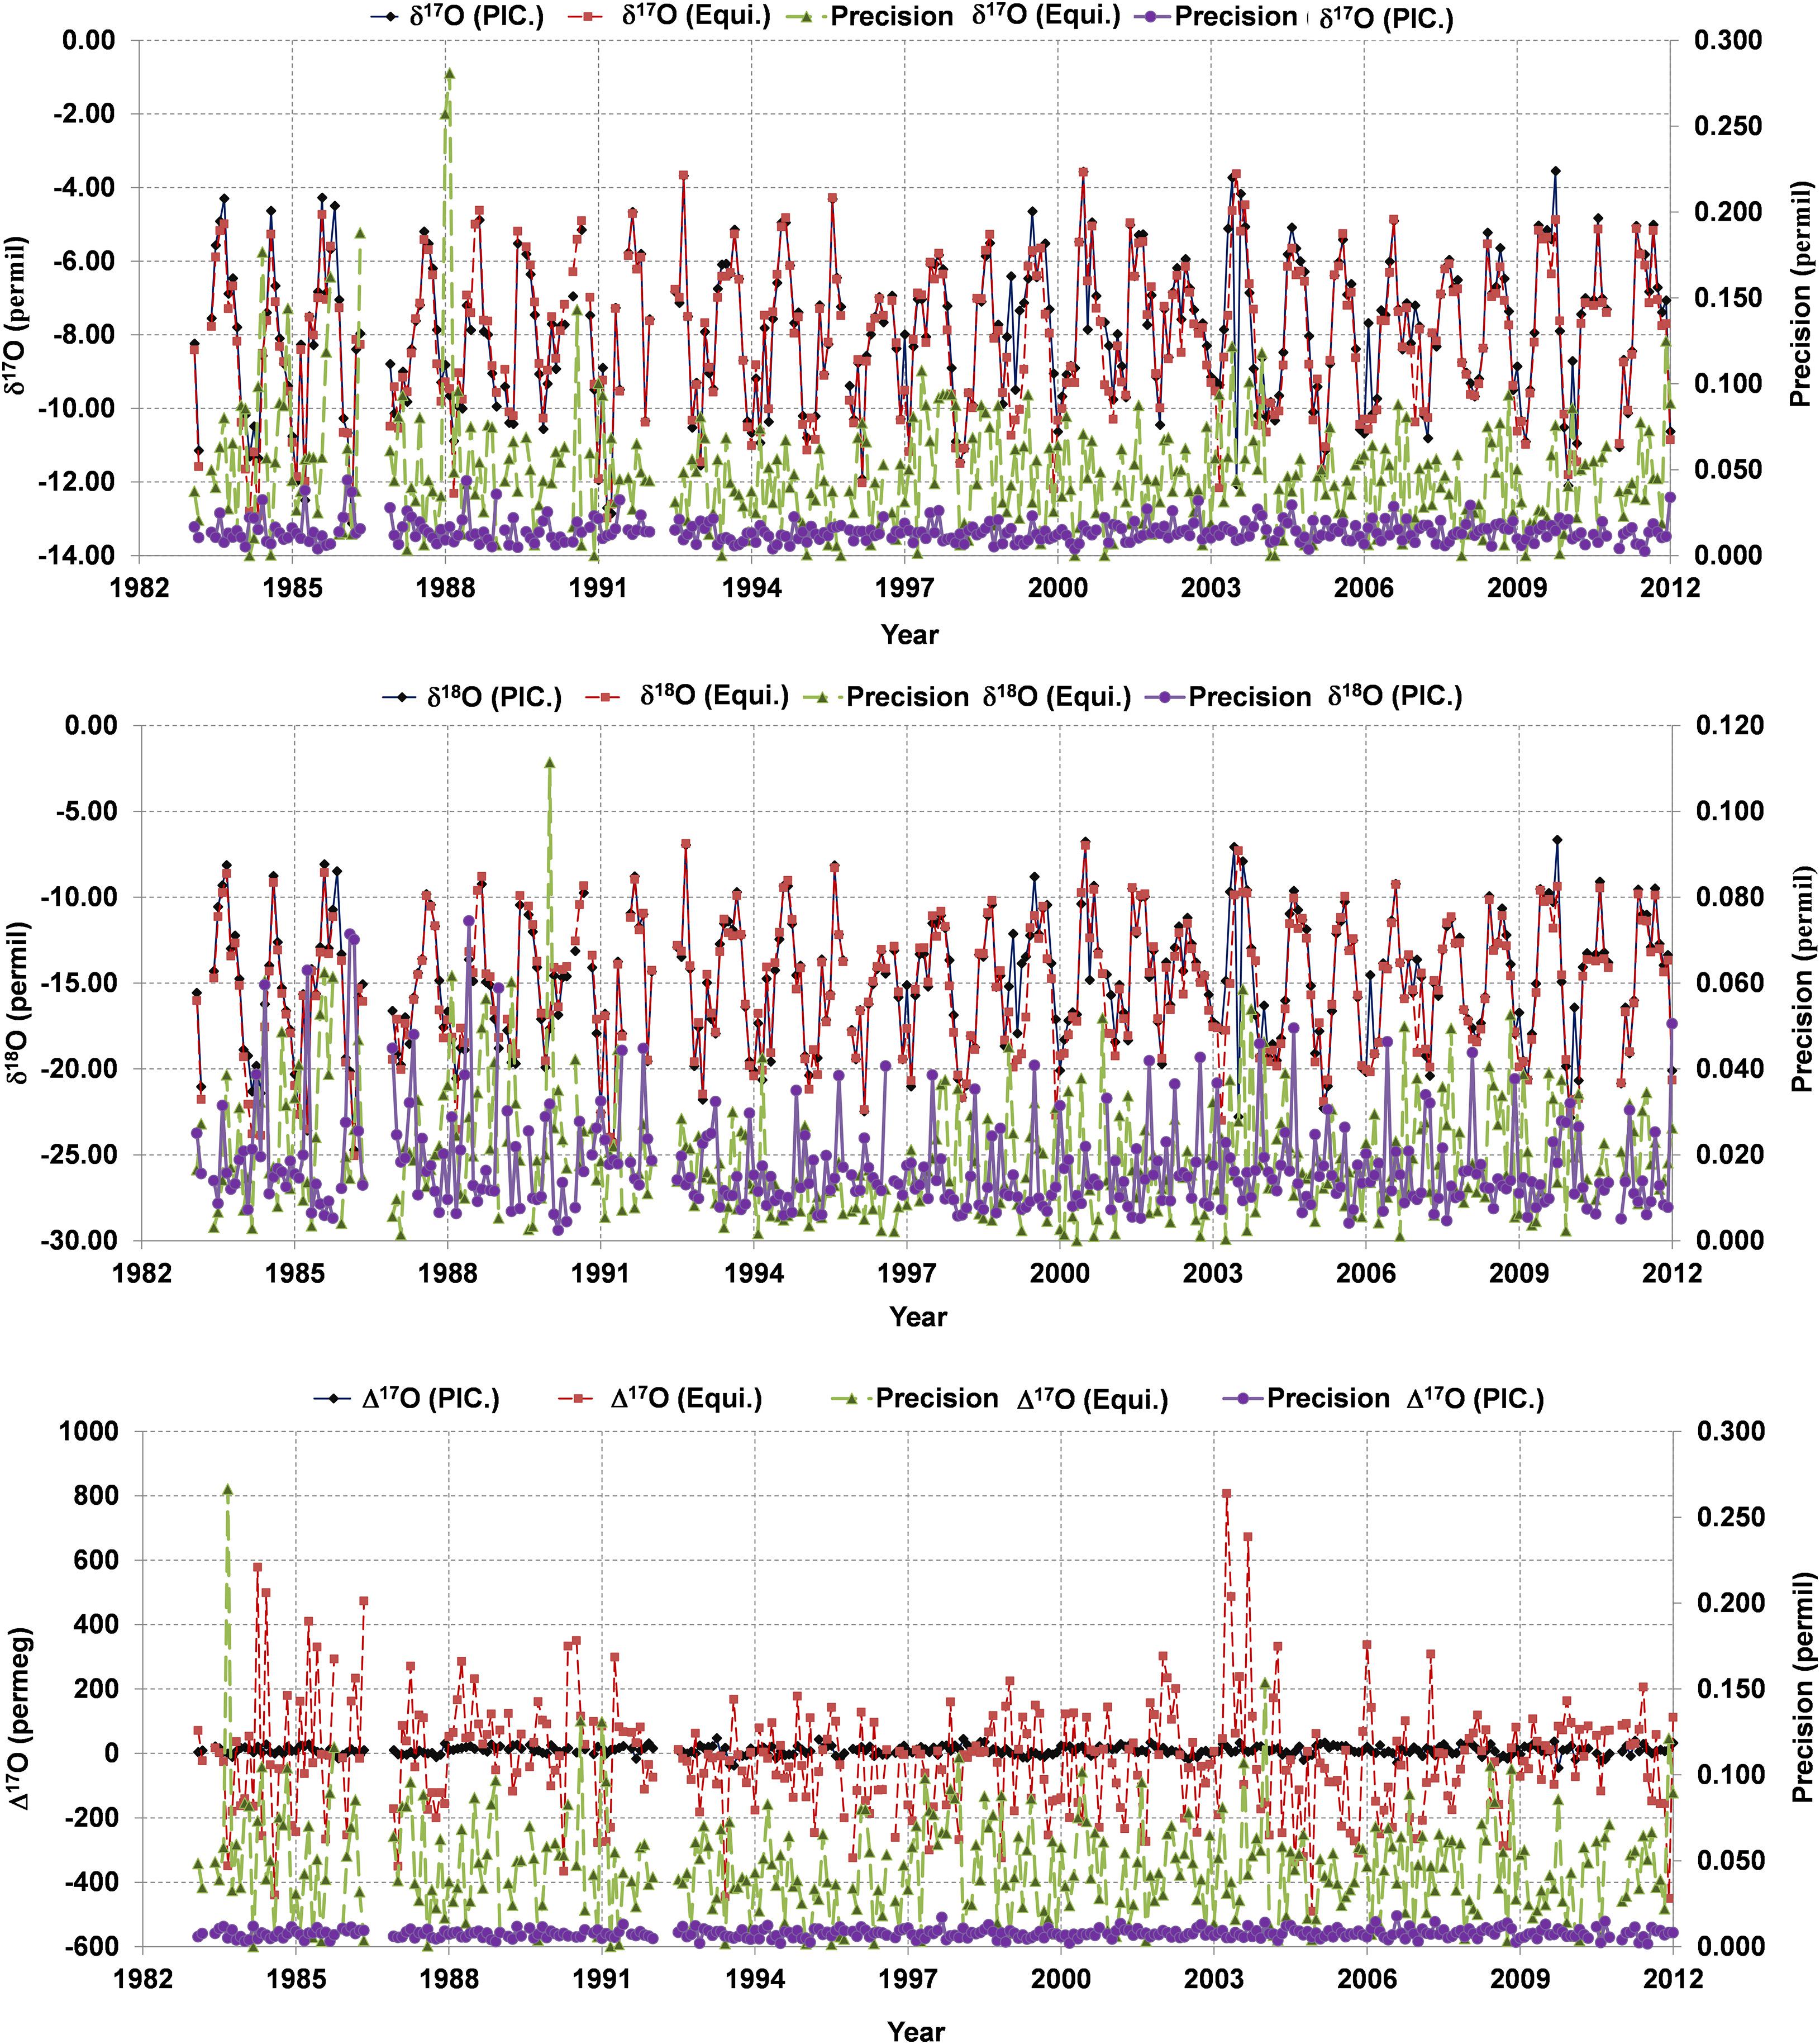
Figure 5. A comparison of the CO2-H2O equilibration (EQUI) method and laser-based system (LBS), obtained from Picarro L2140i (PIC.) for triple oxygen isotopes. Δ17O and δ17O precision for the EQUI method is significantly lower compared to the LBS. The precision of δ18O in the EQUI method is close to the LBS.
Discussion
Comparison of Equilibration (EQUI) With Laser-Based System (LBS)
To see the consistency between CO2-H2O equilibration (EQUI) and LBS system, a comparison of the last three decades (1983–2011) was performed for precipitation samples originating from Jungfraujoch station (JFJ: altitude 3580 m.a.s.l.). Here, we are restricting us to discuss only a comparison between EQUI and LBS using JFJ precipitation records (Figure 5). The detailed descriptions about the JFJ precipitation records can be found in a companion manuscript (Leuenberger and Ranjan, 2021, under review in this issue). For the EQUI method, δ17O, δ18O and Δ17O exhibit precisions of 0.0470, 0.0194, and 0.0458‰, respectively, while LBS shows a precision of 0.0140, 0.0174, and 0.007‰ for δ17O, δ18O, and Δ17O, respectively. These indicate that the EQUI method documents limited precisions for δ17O and Δ17O compared to δ18O which are significantly deviating from precisions to be expected under ideal conditions as discussed in Elsig and Leuenberger, 2008. However, recent work by Affek and Barkan (2018) claimed to achieve the precision of EQUI method close to the offline fluorination method (Barkan and Luz, 2005) using hot platinum for an isotopic exchange between O2 and CO2. The excellent correlation between δ17O and δ18O (r2 > 0.9919) is not sufficient for getting good Δ17O values as obtained with the laser-based system for which the same correlation is significantly stronger (r2 > 0.999957). Furthermore, correlation among isotopic records from both systems indicates that δ17O (r2 > 0.937, p < 0.05) and δ18O (r2 > 0.945, p < 0.05) show a strong correlation while no correlation was found for Δ17O. The poor correlation exhibited by Δ17O indicates the inconsistency and poor precision from EQUI methods (see Figure 5) in particular for δ17O. It is interesting to note that the uncertainty of Δ17O correlates neither with δ17O nor with δ18O and its uncertainty but shows a positive correlation with the uncertainty in δ17O. Based on the sensitivities investigated by Elsig and Leuenberger, 2008, it might point to an influence of the temperature control as this is the only positive dependence they state; yet, in this case one also would expect a correlation with the uncertainty in δ18O. Additionally, the calculated offset of 36 per meg between LBS and EQUI methods cannot be taken as robust due to the high uncertainty of the EQUI method. Even increasing the number of injections for the EQUI method to match the precision of the EQUI method to LBS (Picarro L2140i) through statistics is not guaranteed due to the fact that we do not understand where the limitation is coming from.
Comparison of Continuous Flow (ConFlow) With Laser-Based System (LBS)
The reported δ values for ConFlow and LBS are shown in Table 2 and this corresponds to a single peak of single acquisitions with respect to water standard (ORSMOW) (Winkler, 2012). In the case of ConFlow, the overall precisions from each acquisition for δ17O, δ18O, and Δ17O are 0.077‰, 0.075‰, and 93 per meg, respectively. The reported precision for δ17O and δ18O are under 0.1‰ for five peaks and it further improves to 0.050‰ and 0.074‰, respectively, by skipping the first peak to minimize the memory effect (Figure 6). Thus in four peaks, overall precision for Δ17O improved to 49 per meg, which is two times better than the previous one. By skipping the second and third peak, surprisingly the Δ17O precision improves by a factor of four and seven (Table 2) while δ17O improves to two and four times, respectively. A drastic improvement in precision by skipping initial peaks indicates that the H2O sticking nature inside the reactor is a limiting factor. In the case of LBS, the precision obtained by five subsequent injections in a single run (n = 5) for δ17O, δ18O, and Δ17O are 0.020‰, 0.035‰, and 2 per meg only. The obtained precision for δ17O, δ18O, and Δ17O are, respectively, >three times, >two times and >forty times, better than ConFlow system. The Δ17O precision for LBS is much better than the ConFlow system and the latter can only improve by skipping the first three injections to minimize the memory effect and its associated fractionation. Correlation among δ17O and δ18O shows a tight correlation (r2 > 0.979, p < 0.05) for continuous flow and laser-based system (r2 > 0.961, p < 0.05), respectively (Figure 7). Furthermore, an offset of only 0.136, 0.002, and 0.136‰ were observed between δ17O, δ18O, and, Δ17O of both systems, respectively. By removing the first two peaks from ConFlow, the offset between ConFlow and LBS becomes insignificant that further confirms the influence of memory effect and its associated fractionation role in δ17O, δ18O, and Δ17O precision.
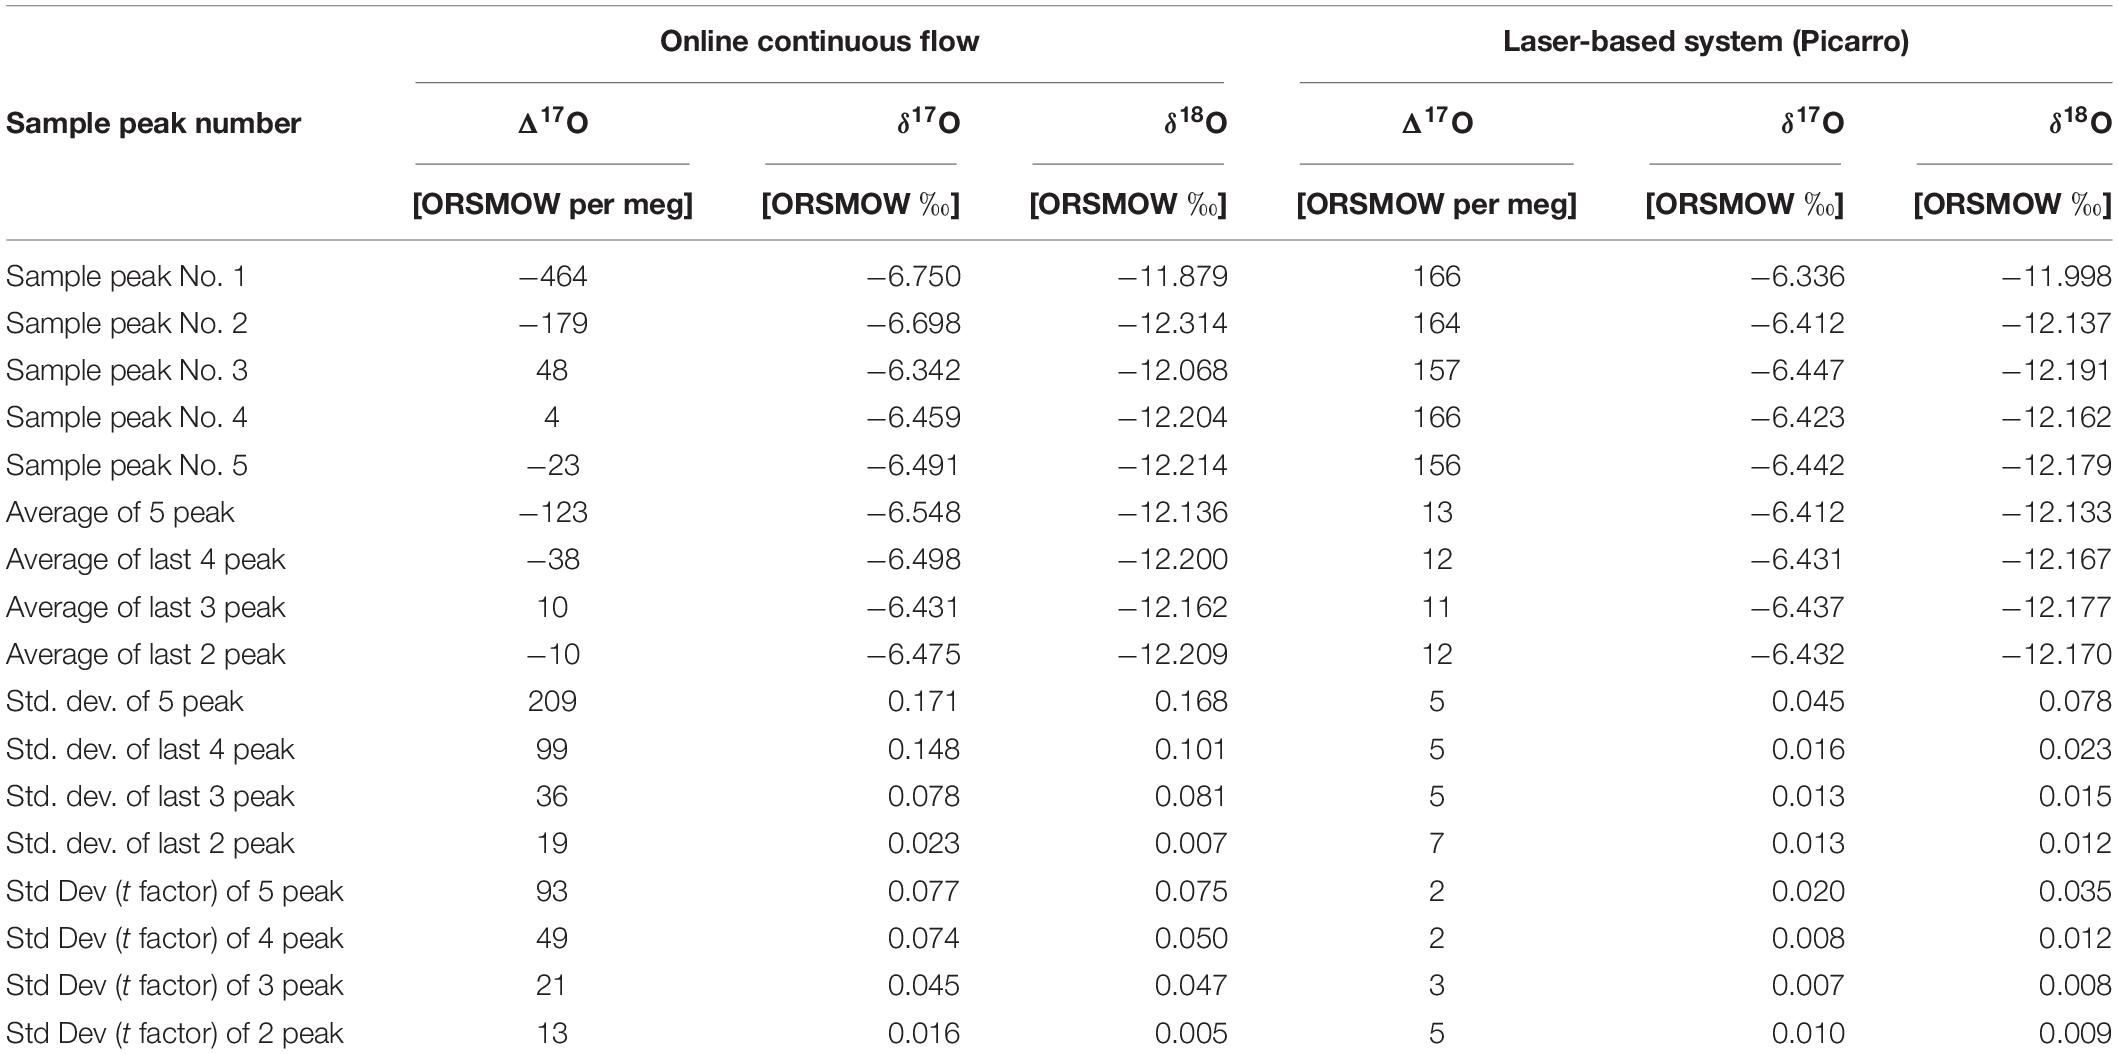
Table 2. δ17O, δ18O, and Δ17O of ST-91 values against ORSMOW (Winkler, 2012) in ‰ with average, standard deviation, and standard deviation by using students factor by 5% confidence limit.
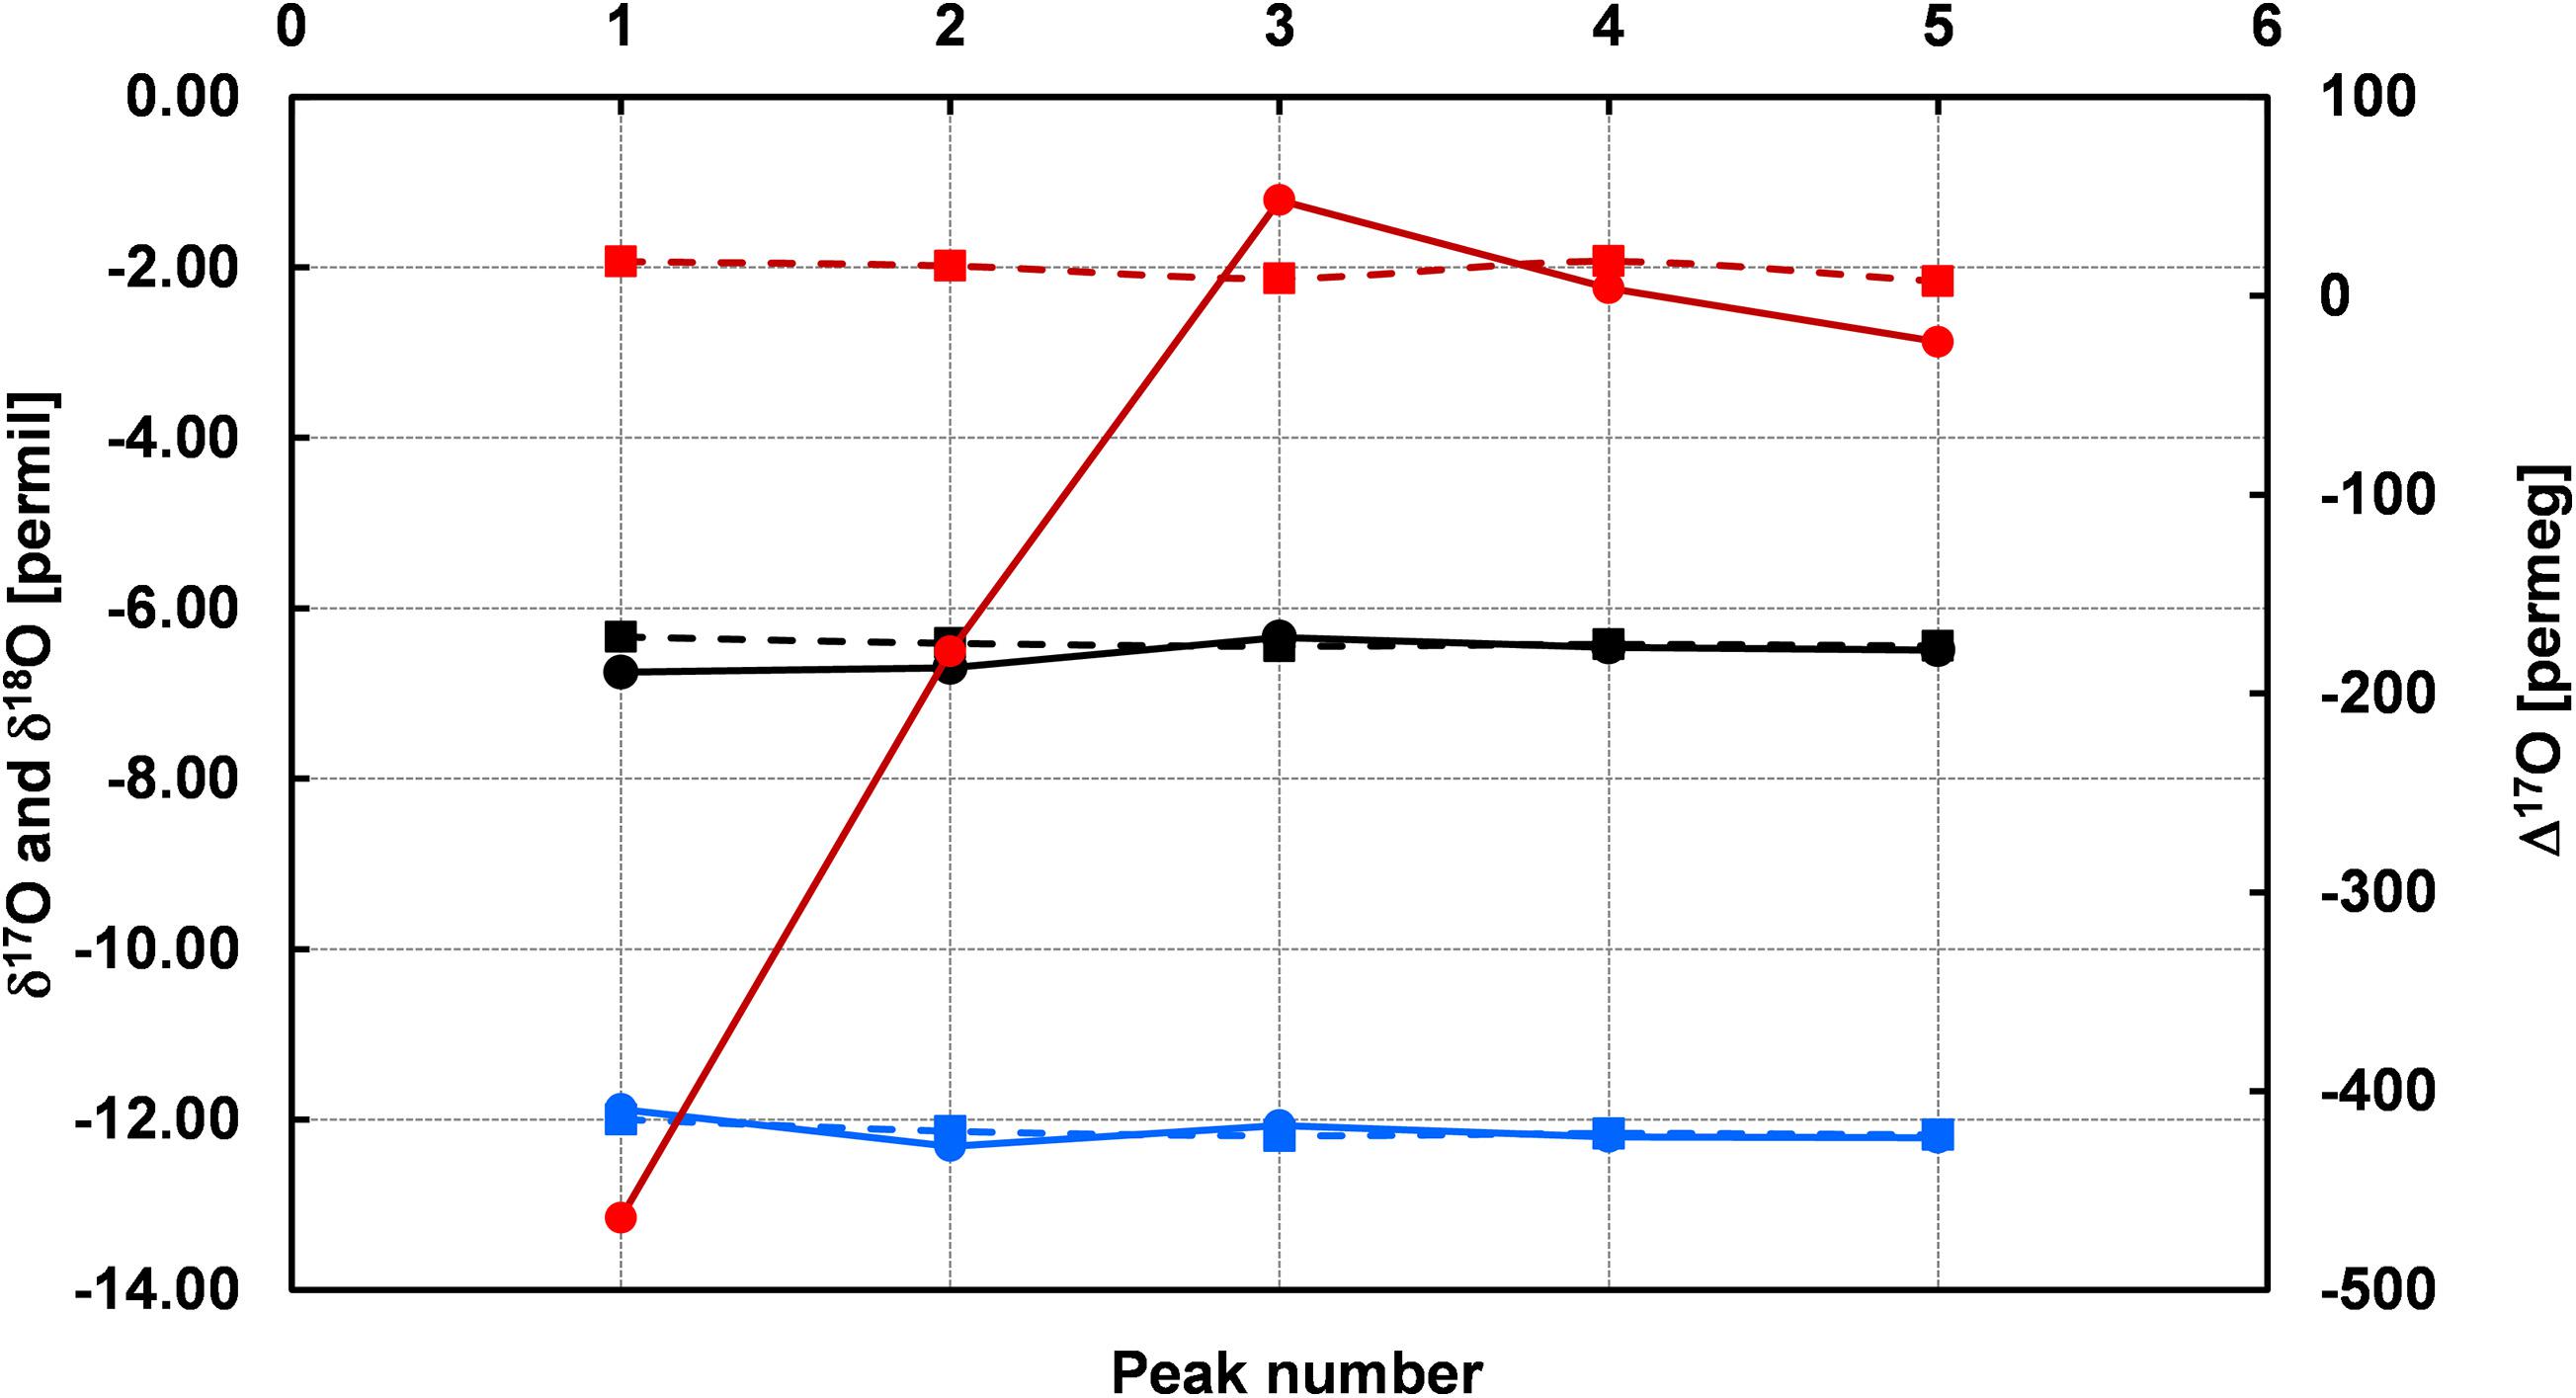
Figure 6. Memory effect of the continuous flow (ConFlow) system during the sample acquisition. Memory effect can easily be seen on the first peak for δ17O (ConFlow, black circle), δ18O (ConFlow, blue circle), and Δ17O (ConFlow, red circle) in comparison to laser-based system (LBS, square box), PICARRO. The last two peaks of each acquisition were not much influenced by the memory effect.
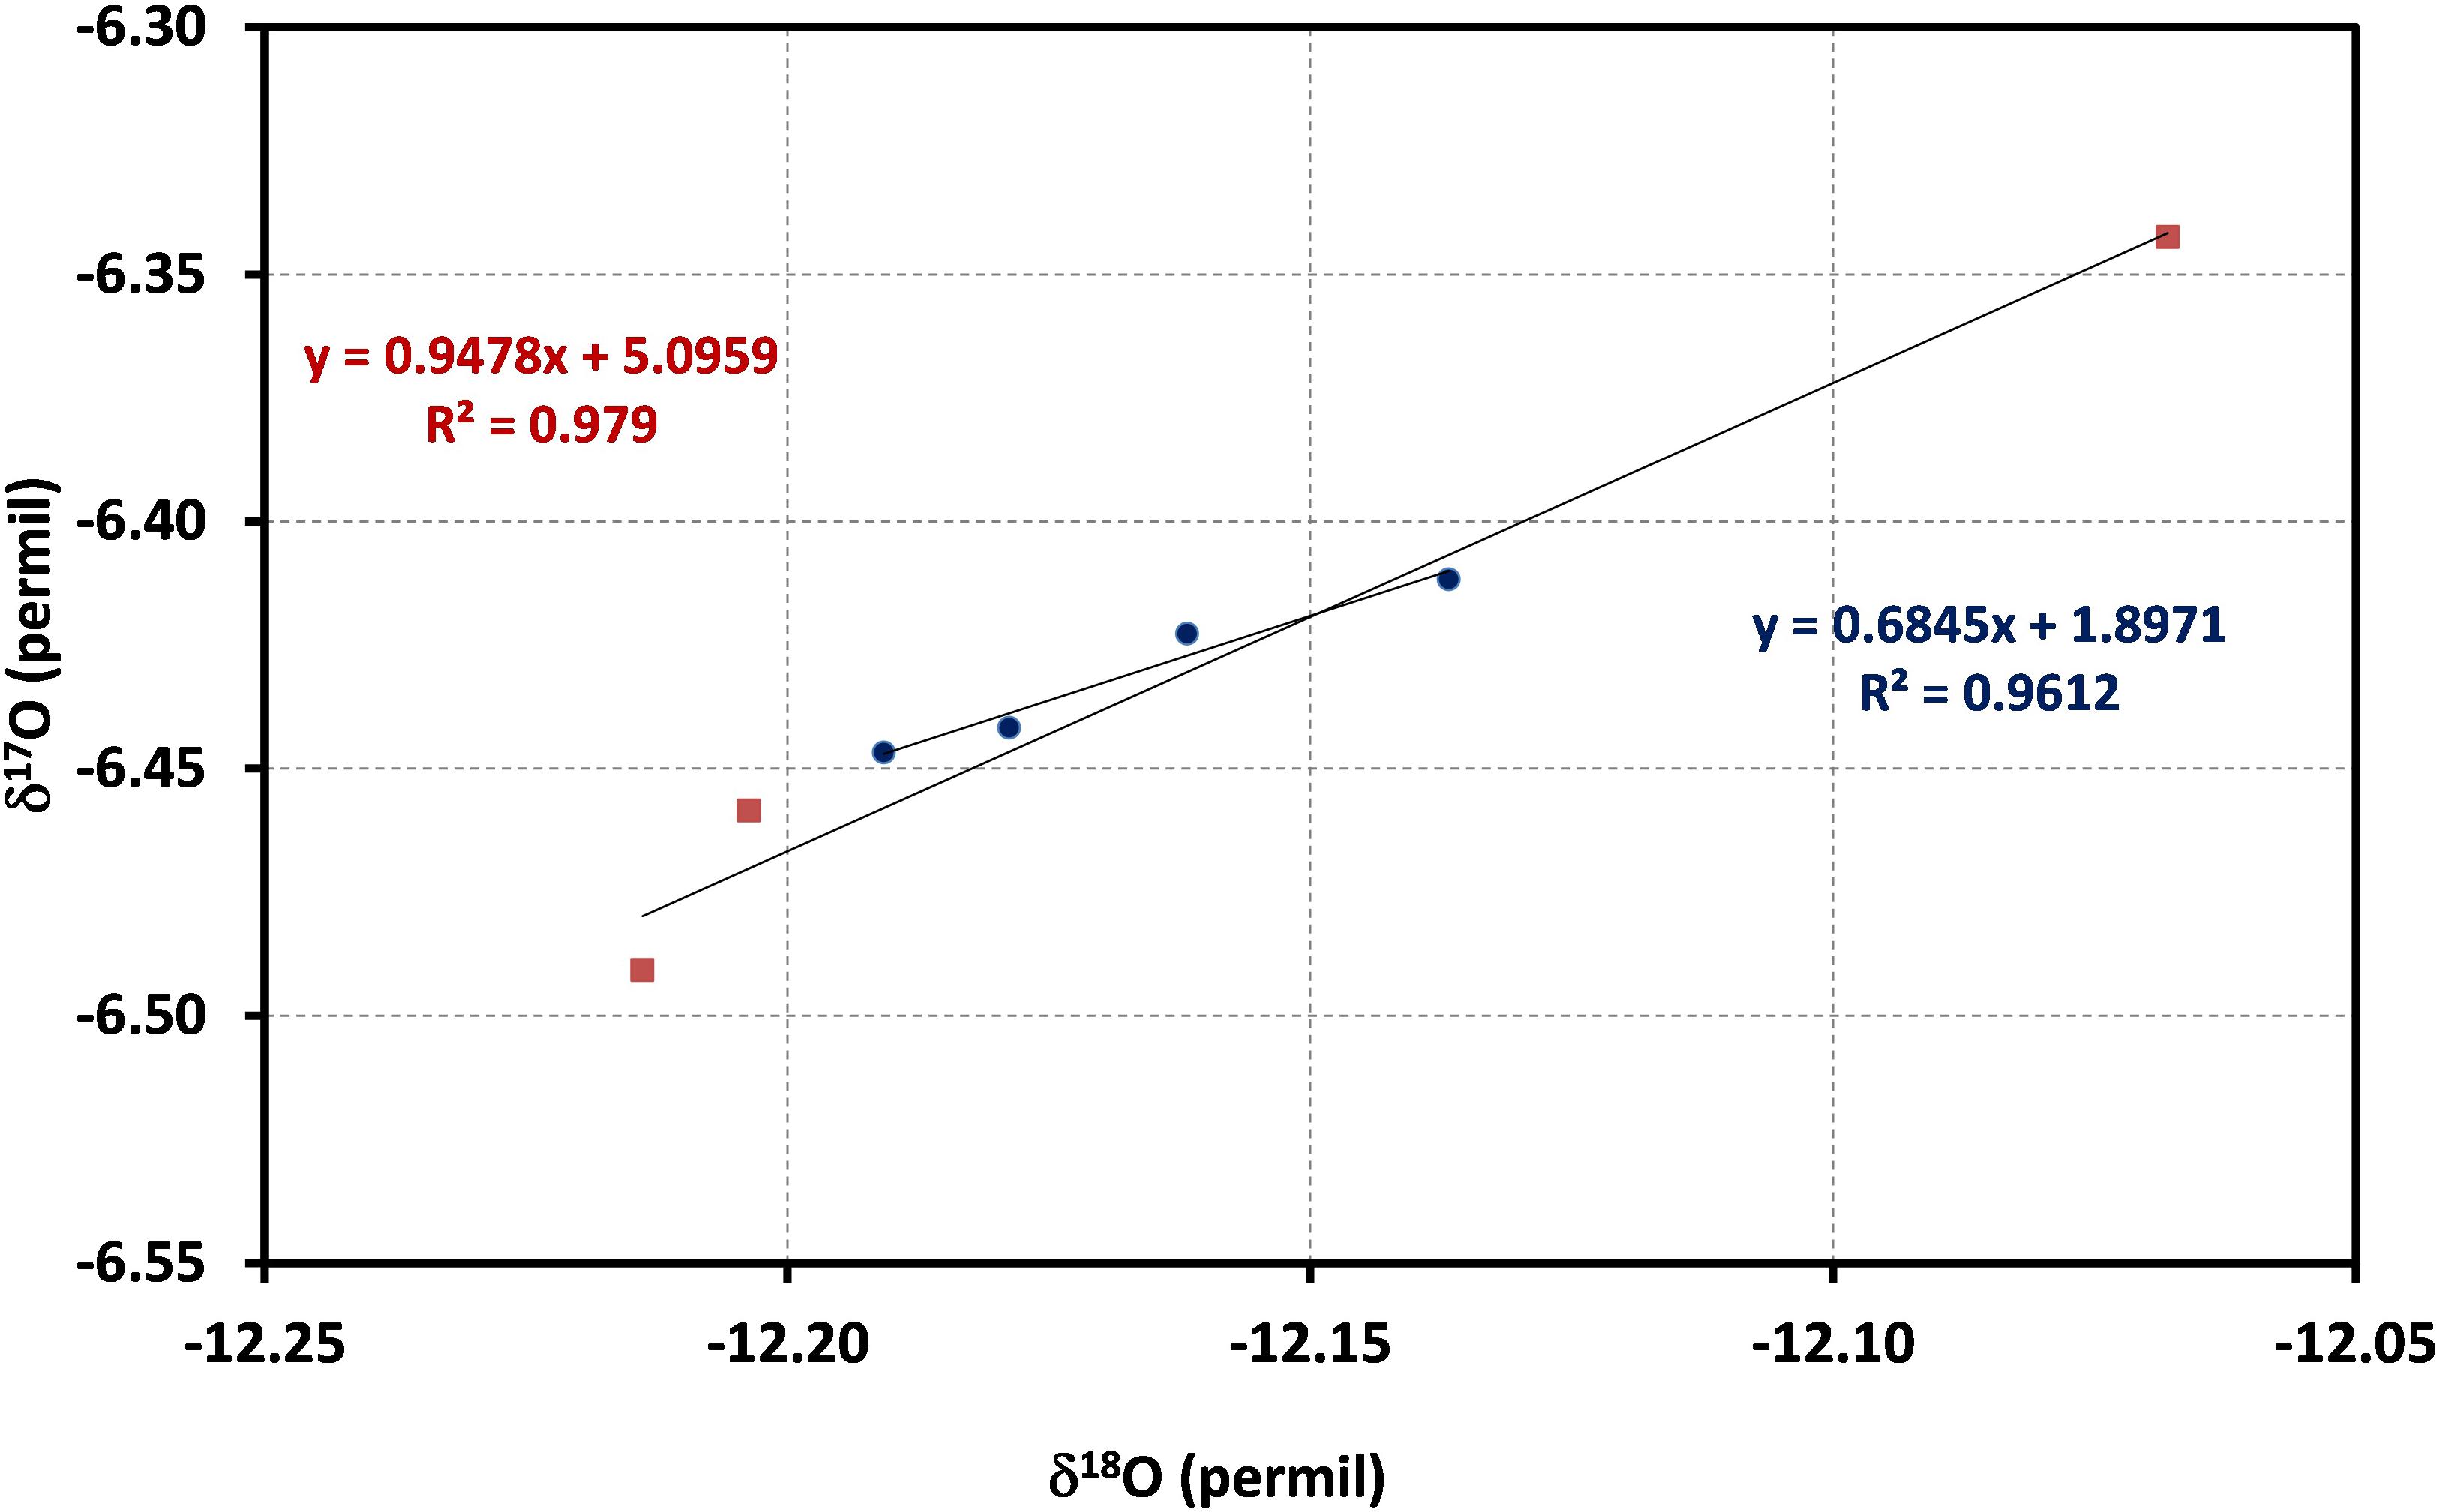
Figure 7. δ17O and δ18O correlation for continuous flow (red square, last three replicates of Figure 6) and laser-based system (blue circle, last four replicates), PICARRO for replicates of the same standard water. Both systems show a strong correlation for δ17O and δ18O.
Coherency between continuous flow and laser-based systems were tested using correlation analysis among δ17O, δ18O, and Δ17O of both systems. δ17O, δ18O, and Δ17O exhibit a significant correlation of 0.680, 0.494, and 0.333, respectively. The observed δ17O and δ18O correlation further improve to 0.690 and 0.822 by skipping the first peak while correlation among Δ17O of both systems further degraded. These results indicate that δ18O of both (continuous flow and laser-based systems) systems are comparable but δ17O and Δ17O need further improvement to match the precision level of laser-based system. Further improvement of the continuous flow system is certainly possible through the optimization of the reactor, tubing replacement from a nickel to steel, optimizing the tubing length between the reactor and the detector (IRMS). Therefore, more than 15 injections with the exclusion of the first three peaks should be applied to match the precision of a laser-based system.
Conclusion
We successfully developed an online technique for triple water isotope determination for small water aliquots (2 μL). However, precision is not yet acceptable compared to conventional dual inlet methods based on the same conversion of oxygen water stable isotopes to O2 and requires further improvements. Four factors are mainly responsible for limiting precision in the continuous flow method. (i) The reactor: The behavior of a reactor due to the changing flow rate of the carrier gas, the treatment of the chemical before filling, the amount of chemical inside the reactor, the reactor composition, the dimension of the nickel tube and the pore size of the steel frit influence the eluted sample signal and hence precision; (ii) The dimension of the metallic tube and fused silica capillary: Increasing length and diameter of the cryogenic cool trap tube causes mixing of the carrier gas and the eluted O2 signal from water results in a wider and tailing peak while increasing length and decreasing diameter of the sample capillary lead to flow restrictions and hence to the reduced amplitude of eluted O2. (iii) Positioning of the capillary in the open split: The sample capillary placed adjacent to the helium capillary and far from the mass spectrometer capillary, the reference capillary near to the sample capillary lead to a dilution effect and limit precision. (iv) Raw data analysis: Background and drift correction must be taken care of and each peak evaluation should be optimized individually. Multiple injections (n = 15 or even more) with the exclusion of at least the first three peaks should be applied to obtain precision better than 10 per meg or comparable to the laser-based system for Δ17O. Furthermore, a comparison of an improved equilibration method between CO2 and H2O to determine the isotope composition of water samples with a laser-based system documents shortcomings of the equilibration process, of yet unknown origin, in particular for precise δ17O measurements, exemplified by strong variations of Δ17O values on the very same precipitation samples from Jungfraujoch.
Data Availability Statement
The raw data supporting the conclusions of this article will be made available by the authors, without undue reservation.
Author Contributions
SR and ML developed the concept of technical setup as well as the design of the study. SR performed a technical experiment and wrote the manuscript with help from ML. Both authors contributed to the article and approved the submitted version.
Funding
This work was supported by the EU-funded project Initial Training network on Mass Independent Fractionation (Intramif) as well as the Swiss National Science Foundation (SNF-125116 and SNF-135152).
Conflict of Interest
The authors declare that the research was conducted in the absence of any commercial or financial relationships that could be construed as a potential conflict of interest.
Acknowledgments
The authors would like to acknowledge Peter Nyfeler for this laboratory assistance and advice on technical issues. We would like to express thanks for the mechanical and electronic workshop staff at the Division of Climate and Environmental Physics Division.
Supplementary Material
The Supplementary Material for this article can be found online at: https://www.frontiersin.org/articles/10.3389/feart.2021.598616/full#supplementary-material
References
Affek, H. P., and Barkan, E. (2018). A new method for high-precision measurements of 17O/16O ratios in H2O. Rapid Commun. Mass Spetrom. 32, 2096–2097.
Affolter, S., Fleitmann, D., and Leuenberger, M. (2014). New online method for water isotope analysis of speleothem fluid inclusions using laser absorption spectroscopy (WS-CRDS). Clim. Past 10, 1291–1304. doi: 10.5194/cp-10-1291-2014
Affolter, S., Häuselmann, A. D., Fleitmann, D., Häuselmann, P., and Leuenberger, M. (2015). Triple isotope (dD, d17O, d18O) study on precipitation, drip water and speleothem fluid inclusions for a Western Central European cave (NW Switzerland). Quat. Sci. Rev. 127, 73–89. doi: 10.1016/j.quascirev.2015.08.030
Assonov, S. S., and Brenninkmeijer, C. A. M. (2003). A redetermination of absolute values for 17RVPDB-CO2 and 17RVSMOW. Rapid Commun. Mass Spectrom. 17, 1017–1029. doi: 10.1002/rcm.1011
Baker, L., Franchi, I. A., Maynard, J., Wright, I. P., and Pillinger, C. T. (2002). A technique for the determination of O-18/O-16 and O-17/O-16 isotopic ratios in water from small liquid and solid samples. Anal. Chem. 74, 1665–1673. doi: 10.1021/ac010509s
Barkan, E., and Luz, B. (2005). High precision measurements of 17O/16O and 18O/16O ratios in H2O. Rapid Commun. Mass Spectrom. 19, 3737–3742. doi: 10.1002/rcm.2250
Bock, M., Schmitt, J., Moller, L., Spahni, R., Blunier, T., and Fischer, H. (2010). Hydrogen isotopes preclude marine hydrate CH4 emissions at the onset of dansgaard-oeschger events. Science 328, 1686–1689. doi: 10.1126/science.1187651
Brenninkmeijer, C. A. M., and Röckmann, T. (1998). A rapid method for the preparation of O2 from CO2 for mass spectrometric measurement of O/16 O ratios. Rapid Commun. Mass Spectrom. 12, 479–483.
Craig, H. (1961). Isotopic Variations in meteoric waters. Science 133, 1702–1703. doi: 10.1126/science.133.3465.1702
Dansgaard, W. (1954). The O18-abundance in fresh water. Geochim. Cosmochim. Acta 6, 241–260. doi: 10.1016/0016-7037(54)90003-4
Dansgaard, W. (1964). Stable isotopes in precipitation. Tellus 16, 436–468. doi: 10.3402/tellusa.v16i4.8993
Elsig, J. (2009). New Insights Into the Global Carbon Cycle From Measurements of CO2 Stable Isotopes: Methodological Improvements and Interpretation of a New EPICA Dome C ice Core d13C Reocrd. Ph.D. thesis, University of Bern, Bern, Switzerland.
Elsig, J., and Leuenberger, M. (2008). Measurements of the 17O excess in water with the equilibration method. Anal. Chem. 80, 3244–3253. doi: 10.1021/ac702436t
Elsig, J., and Leuenberger, M. C. (2010). 13C and 18O fractionation effects on open splits and on the ion source in continuous flow isotope ratio mass spectrometry. Rapid Commun. Mass Spectrom. 24, 1419–1430. doi: 10.1002/rcm.4531
Epstein, S., and Mayeda, T. (1953). Variation of O18 content of waters from natural sources. Geochim. Cosmochim. Acta 4, 213–224. doi: 10.1016/0016-7037(53)90051-9
Franz, P., and Röckmann, T. (2004). A new continuous flow isotope ratio mass spectrometry system for the analysis of δ2H, δ17O and δ 18O of small (120 μg) water samples in atmospheric applications. Rapid Commun. Mass Spectrom. 18, 1429–1435. doi: 10.1002/rcm.1499
Galewsky, J., Steen-Larsen, H. C., Field, R. D., Worden, J., Risi, C., and Schneider, M. (2016). Stable isotopes in atmospheric water vapor and applications to the hydrologic cycle. Rev. Geophys. 54, 809–865. doi: 10.1002/2015RG000512
Lantz, L. L. (1967). A Mass Spectrometric Analysis of the Oxygen Isotopes of Water via the Cobalt (3) Fluoride-Water Reaction. MS thesis, Iowa State University, Ames, IA.
Leuenberger, M., and Ranjan, S. (2021). Disentangle kinetic from equilibrium fractionation using primary (δ17O, δ18O, δD) and secondary (Δ17O, Dex) stable isotope parameters on samples from the swiss precipitation network. Front. Earth Sci. 9:598061. doi: 10.3389/feart.2021.598061
Luz, B., Barkan, E., Bender, M. L., Thiemens, M. H., and Boering, K. A. (1999). Triple-isotope composition of atmospheric oxygen as a tracer of biosphere productivity. Nature 400, 547–550. doi: 10.1029/2004GL021011
Matthews, D. E., and Hayes, J. M. (1978). Isotope-ratio-monitoring gas chromatography-mass spectrometry. Anal. Chem. 50, 1465–1473. doi: 10.1021/ac50033a022
Meijer, H. A. J., and Li, W. J. (1998). The use of electrolysis for accurate δ17O and δ18O isotope measurements in water. Isotopes Environ. Health Stud. 34, 349–369. doi: 10.1080/10256019808234072
Oki, T. (2006). Global hydrological cycles and world water resources. Science 313, 1068–1072. doi: 10.1126/science.1128845
O’Neil, J. R., and Epstein, S. (1966). A method for oxygen isotope analysis of milligram quantities of water and some of its applications. J. Geophys. Res. 71, 1955–4961. doi: 10.1029/jz071i020p04955
Sano, M., Yotsui, Y., Abe, H., and Sasaki, S. (1976). A new technique for the detection of metabolites labelled by the isotope 13C using mass fragmentography. Biol. Mass Spectrom. 3, 1–3. doi: 10.1002/bms.1200030102
Schoenemann, S. W., Schauer, A. J., and Steig, E. J. (2013). Measurement of SLAP2 and GISP δ17O and proposed VSMOW-SLAP normalization for δ17O and 17Oexcess. Rapid Commun. Mass Spectrom. 27, 582–590. doi: 10.1002/rcm.6486
Steig, E. J., Gkinis, V., Schauer, A. J., Schoenemann, S. W., Samek, K., Hoffnagle, J., et al. (2013). Calibrated high-precision 17Oexcess measurements using laser-current tuned cavity ring-down spectroscopy. Atmos. Meas. Tech. Discuss. 6, 10191–10229. doi: 10.5194/amtd-6-10191-2013
Steig, E. J., Gkinis, V., Schauer, A. J., Schoenemann, S. W., Samek, K., Hoffnagle, J., et al. (2014). Calibrated high-precision 17O-excess measurements using cavity ring-down spectroscopy with laser-current-tuned cavity resonance. Atmos. Meas. Tech. 7, 2421–2435. doi: 10.5194/amt-7-2421-2014
Keywords: Continuous flow, CoF3 method, triple oxygen isotope, 17O-excess, laser-based system
Citation: Ranjan S and Leuenberger MC (2021) Comparison of Three Measurement Principles on Water Triple Oxygen Isotopologues. Front. Earth Sci. 9:598616. doi: 10.3389/feart.2021.598616
Received: 25 August 2020; Accepted: 22 February 2021;
Published: 17 March 2021.
Edited by:
Daniel Herwartz, University of Cologne, GermanyReviewed by:
Tommaso Di Rocco, University of Göttingen, GermanyDavid Bajnai, University of Cologne, Germany
Copyright © 2021 Ranjan and Leuenberger. This is an open-access article distributed under the terms of the Creative Commons Attribution License (CC BY). The use, distribution or reproduction in other forums is permitted, provided the original author(s) and the copyright owner(s) are credited and that the original publication in this journal is cited, in accordance with accepted academic practice. No use, distribution or reproduction is permitted which does not comply with these terms.
*Correspondence: Markus C. Leuenberger, bWFya3VzLmxldWVuYmVyZ2VyQGNsaW1hdGUudW5pYmUuY2g=