- 1Section 5: Rock Physics and Borehole Geophysics, Leibniz Institute for Applied Geophysics (LIAG), Hanover, Germany
- 2Université de Paris, Institut de Physique du Globe de Paris (IPGP), CNRS, Paris, France
- 3Chair of Geomorphology, University of Bayreuth, Bayreuth, Germany
- 4Bayreuth Center of Ecology and Environmental Research (BayCEER), University of Bayreuth, Bayreuth, Germany
- 5Institute of Speleology, Romanian Academy, Cluj-Napoca, Romania
- 6Chair of Physical Geography, Faculty of Sciences, University of Novi Sad, Novi Sad, Serbia
- 7Serbian Academy of Sciences and Arts, Belgrade, Serbia
In mid-latitude Eurasia, loess-paleosol sequences (LPS) provide the most widespread sedimentary records of Quaternary paleoenvironmental evolution. In the Middle Danube Basin (MDB), these archives cover at least the last million years of climate history, and occasionally contain archeological findings. The studied Zemun LPS is located on the right bank of the Danube in Northern Serbia. The site was declared as a protected site, based on Paleolithic artifacts found on the riverbank and stemming from unknown stratigraphic levels of the loess cliffs exposed along the Danube. The present study aims to provide a stratigraphic, paleoenvironmental, and temporal context for the Zemun LPS by means of environmental magnetic and colorimetric methods. Our investigations result in a chronostratigraphic scheme allowing direct comparison with other well-established reference records in the MDB and elsewhere. Two potential tephra layers tentatively assigned to the so-called L2 and Bag tephras, which are both widespread in the MDB and beyond were investigated for their bulk magnetic properties. The resulting integrated age model suggests that the Zemun LPS records a detailed history of a quasi-continuous accumulation of mineral dust from Marine Oxygen Isotope Stage (MIS) 11–5a (c. 430–60 ka). The outcome of our integrative approach indicates a continuous aridification over the last four interglacial/glacial cycles and we discuss potential changes in seasonality over time.
Introduction
Over the past decades, many loess-paleosol sequences (LPSs) have been investigated predominantly in the extensive northern hemisphere loess belt (Marković et al., 2015; Schaetzl et al., 2018; Lehmkuhl et al., 2021). Unlike lake and other terrestrial records, which are rather sparsely distributed, the spatial continuity of LPSs makes them valuable archives of past environmental change in the prevailing climatic past regimes that sustained loess formation and preservation (e.g., Basarin et al., 2014; Marković et al., 2015). Glacial and interglacial cycles, usually associated with shifts in humidity and temperature resulting from long-term variations in orbital parameters of eccentricity, obliquity, and precession driving ice volume (Imbrie and Imbrie, 1980; Heslop et al., 2000; Lisiecki and Raymo, 2005; Sun et al., 2006; Abe-Ouchi et al., 2013), are recorded through the alternation of loess and paleosol horizons, respectively. The paleoclimatic relevance of the quasi-cyclic alternation of loess and paleosols in LPSs of the Chinese Loess Plateau (CLP) was demonstrated in the 1980s through the correlation of magnetostratigraphically dated susceptibility records to the marine oxygen isotope records (Heller and Liu, 1982, 1986), and similarly in the 1990s based on long-term variability in grain size distribution (e.g., Ding et al., 1994). Most of the early work relied on analyses of rock-magnetic parameters, often limited to magnetic susceptibility (Ding et al., 1993) and its frequency dependence. However, quantitative analyses of loess color spectra are also valuable indicators of shifts in mineralogical assemblages, as well as in organic matter content (Ding et al., 2002b; Lukić et al., 2014). Studies of LPSs from the CLP (Ji et al., 2002) and the Danube Basin (Lukić et al., 2014; Obreht et al., 2016) demonstrated the strength of combining magnetic and colorimetric parameters. While many multi-proxy studies have been performed on archives covering the last glacial cycle, investigations of European LPSs spanning multiple glacial–interglacial cycles are fewer (e.g., Jordanova et al., 2007; Necula et al., 2013; Basarin et al., 2014; Marković et al., 2015; Zeeden et al., 2016; Sümegi et al., 2018; Antoine et al., 2019; Obreht et al., 2019). In this study, we extend colorimetric data to about 430 kyr with the Zemun LPS record from the Middle Danube Basin (MDB), spanning from Marine Isotope Stage (MIS) 11 to MIS 5a.
Besides a dominating amount of quartz, feldspar, phyllosilicate and carbonate grains, comprising the average composition of the upper continental crust, Eurasian loess consists of heavy minerals and measurable relevant ferromagnetic (s.l.) particles such as a broad variety of iron oxides (Maher, 2016). Rock magnetic investigations allow differentiating magnetic particles formed in-situ via pedogenic processes from the initial detrital content of magnetic particles in wind-blown loess. Relevant iron oxides for deciphering between loess and paleosol-units, which are readily detectable and relative concentrations quantifiable by room-temperature magnetic investigations, consists of magnetite, maghemite and hematite (Heller and Evans, 1995). Pedogenesis takes place under relatively warm and humid conditions (Maher, 2016), involving various abiotic and bio-mediated chemical reactions not yet completely understood (e.g., Torrent et al., 2007; sections 2.5.2 and 2.6 in Lagroix et al., 2016) and resulting in the neo-formation of ultra-fine magnetic minerals (Maher and Taylor, 1988; Dearing et al., 1996; Maher, 1998; Torrent et al., 2007; Hu et al., 2013). Pedogenetically neo-formed magnetite/maghemite have magnetic grains sizes ranging from unstable single domain [superparamagnetic (SP)] to stable single domain (SD) sizes, where the SP/SD particle size threshold at room temperature is about 30 nm (e.g., Peters and Dekkers, 2003). SP particles display a frequency dependence of susceptibility, which can be used to quantify their relative concentration and help discriminate between paleosols (high SP concentration) and loess (low to SP concentration). Weathering of loess can also occur under glacial conditions (Maher, 2011), but it is generally less intense due to increased aeolian sediment accumulation rates and generally drier conditions (Kohfeld and Harrison, 2003). Such weak glacial pedogenic alterations can also be detected by rock magnetic investigations (e.g., Taylor et al., 2014).
In most Eurasian LPSs, magnetic susceptibility values of paleosols are enhanced with respect to loess units (e.g., Maher, 1998, 2016; Marković et al., 2009, 2015) from which a first order (chrono)stratigraphy can be established. For example, Marković et al. (2015) proposed a composite loess stratigraphy nomenclature scheme for the Danube loess belt region to facilitate pan-Eurasian LPS comparisons based on trends in magnetic susceptibility and other chronostratigraphic constrains. The stratigraphic system is based on the “S” (for soil) and “L” (for loess) labeling without any specific regional prefixes as is well established for the Chinese loess stratotype sections (Kukla and An, 1989). In the present study, the proposed composite stratigraphy is used to compare magnetic susceptibility variations of the Zemun LPS, evolving under non-monsoonal controlled (paleo-) climate with that of a monsoonal-dominated loess-paleosol sequence from the CLP (Luochuan, e.g., Hao et al., 2012).
The Zemun site hosts a variety of Middle and Late Paleolithic, and Neolithic artifacts found on the river bank nearby the LPS outcrop and upstream to the northwest (Šarić, 2008). The stratigraphic position within the Zemun LPS of these artifacts is, to date, unknown. However, providing a chronological framework for the protected loess site and establishing a range of environmental conditions these settlements may have been subjected to is important and will be beneficial to future archeological work.
Establishing a reliable chronology for LPSs remains challenging when absolute dating techniques such as luminescence reach their dating limits. Correlative age models are a mean to partly overcome this challenge. For LPS, correlative age models rely on the key process of pedogenic alteration, which induces variations in physical parameters and consequently records the environmental impact of interglacial/glacial cycles. In this study, magnetic susceptibility measurements coupled to diffuse reflectance spectrometry (DRS) analyses provide insights into past changes in environmental conditions. Rock-magnetic parameters provide insight into the source of variations in magnetic susceptibility, and together trace changes in the strength of pedogenesis along the Zemun LPS. Lastly, the developed correlative age model provides a mean to compare DRS and magnetism-based indicators of pedogenesis with global climate stacks (here the LR04 stack; Lisiecki and Raymo, 2005).
Volcanic ashes are often identified in European loess units, but in most cases, these tephras are mixed within aeolian loess or occur as crypto-tephras invisible to the naked eye. As most widespread tephras stem from highly explosive silicic magmas they are rather dominated by volcanic glass instead of by minerals or rock fragments (e.g., Lowe et al., 2017). Therefore, tephra layers are expected to have magnetic grain sizes similar to rapidly cooled magmatic rocks, characterized by dominantly SD and pseudo-single domain (PSD) particles, representing “frozen” magma at the time of eruption (e.g., Till et al., 2011). Both the magnetic grain size and composition of magnetic minerals contained in the tephra are also expected to contrast with that of the loess in which they are embedded. In the Zemun LPS, two tephra layers were identified through distinguishing magnetic properties similar to previous reports (Marković et al., 2015, 2018). Despite the lack of geochemical and mineralogical constraints, they are tentatively assigned to the so-called L2 and Bag tephra, both widespread regional marker-horizons.
Profile Setting and Stratigraphy
The Zemun LPS (N 44.9246°, E 20.3197°) is located in the southern part of the Middle Danube Basin and is exposed by the escarpment of a landslide scar developed in the high cliffs on the right bank of the Danube at the northwestern border of the Belgrade conurbation (Šarić, 2008). The profile belongs to the Srem loess plateau, which is delimited to the East and Northeast by the Danube and to the South by the Sava (Figure 1A). The Zemun LPS reveals several loess-paleosol couplets, reflecting warm/humid (interglacial) and cool/dry (glacial) past environmental conditions. The Zemun LPS shows similar litho- and pedo-stratigraphic features as neighboring profiles at Batajnica (Marković et al., 2009) and within the Titel loess plateau (Marković et al., 2015).
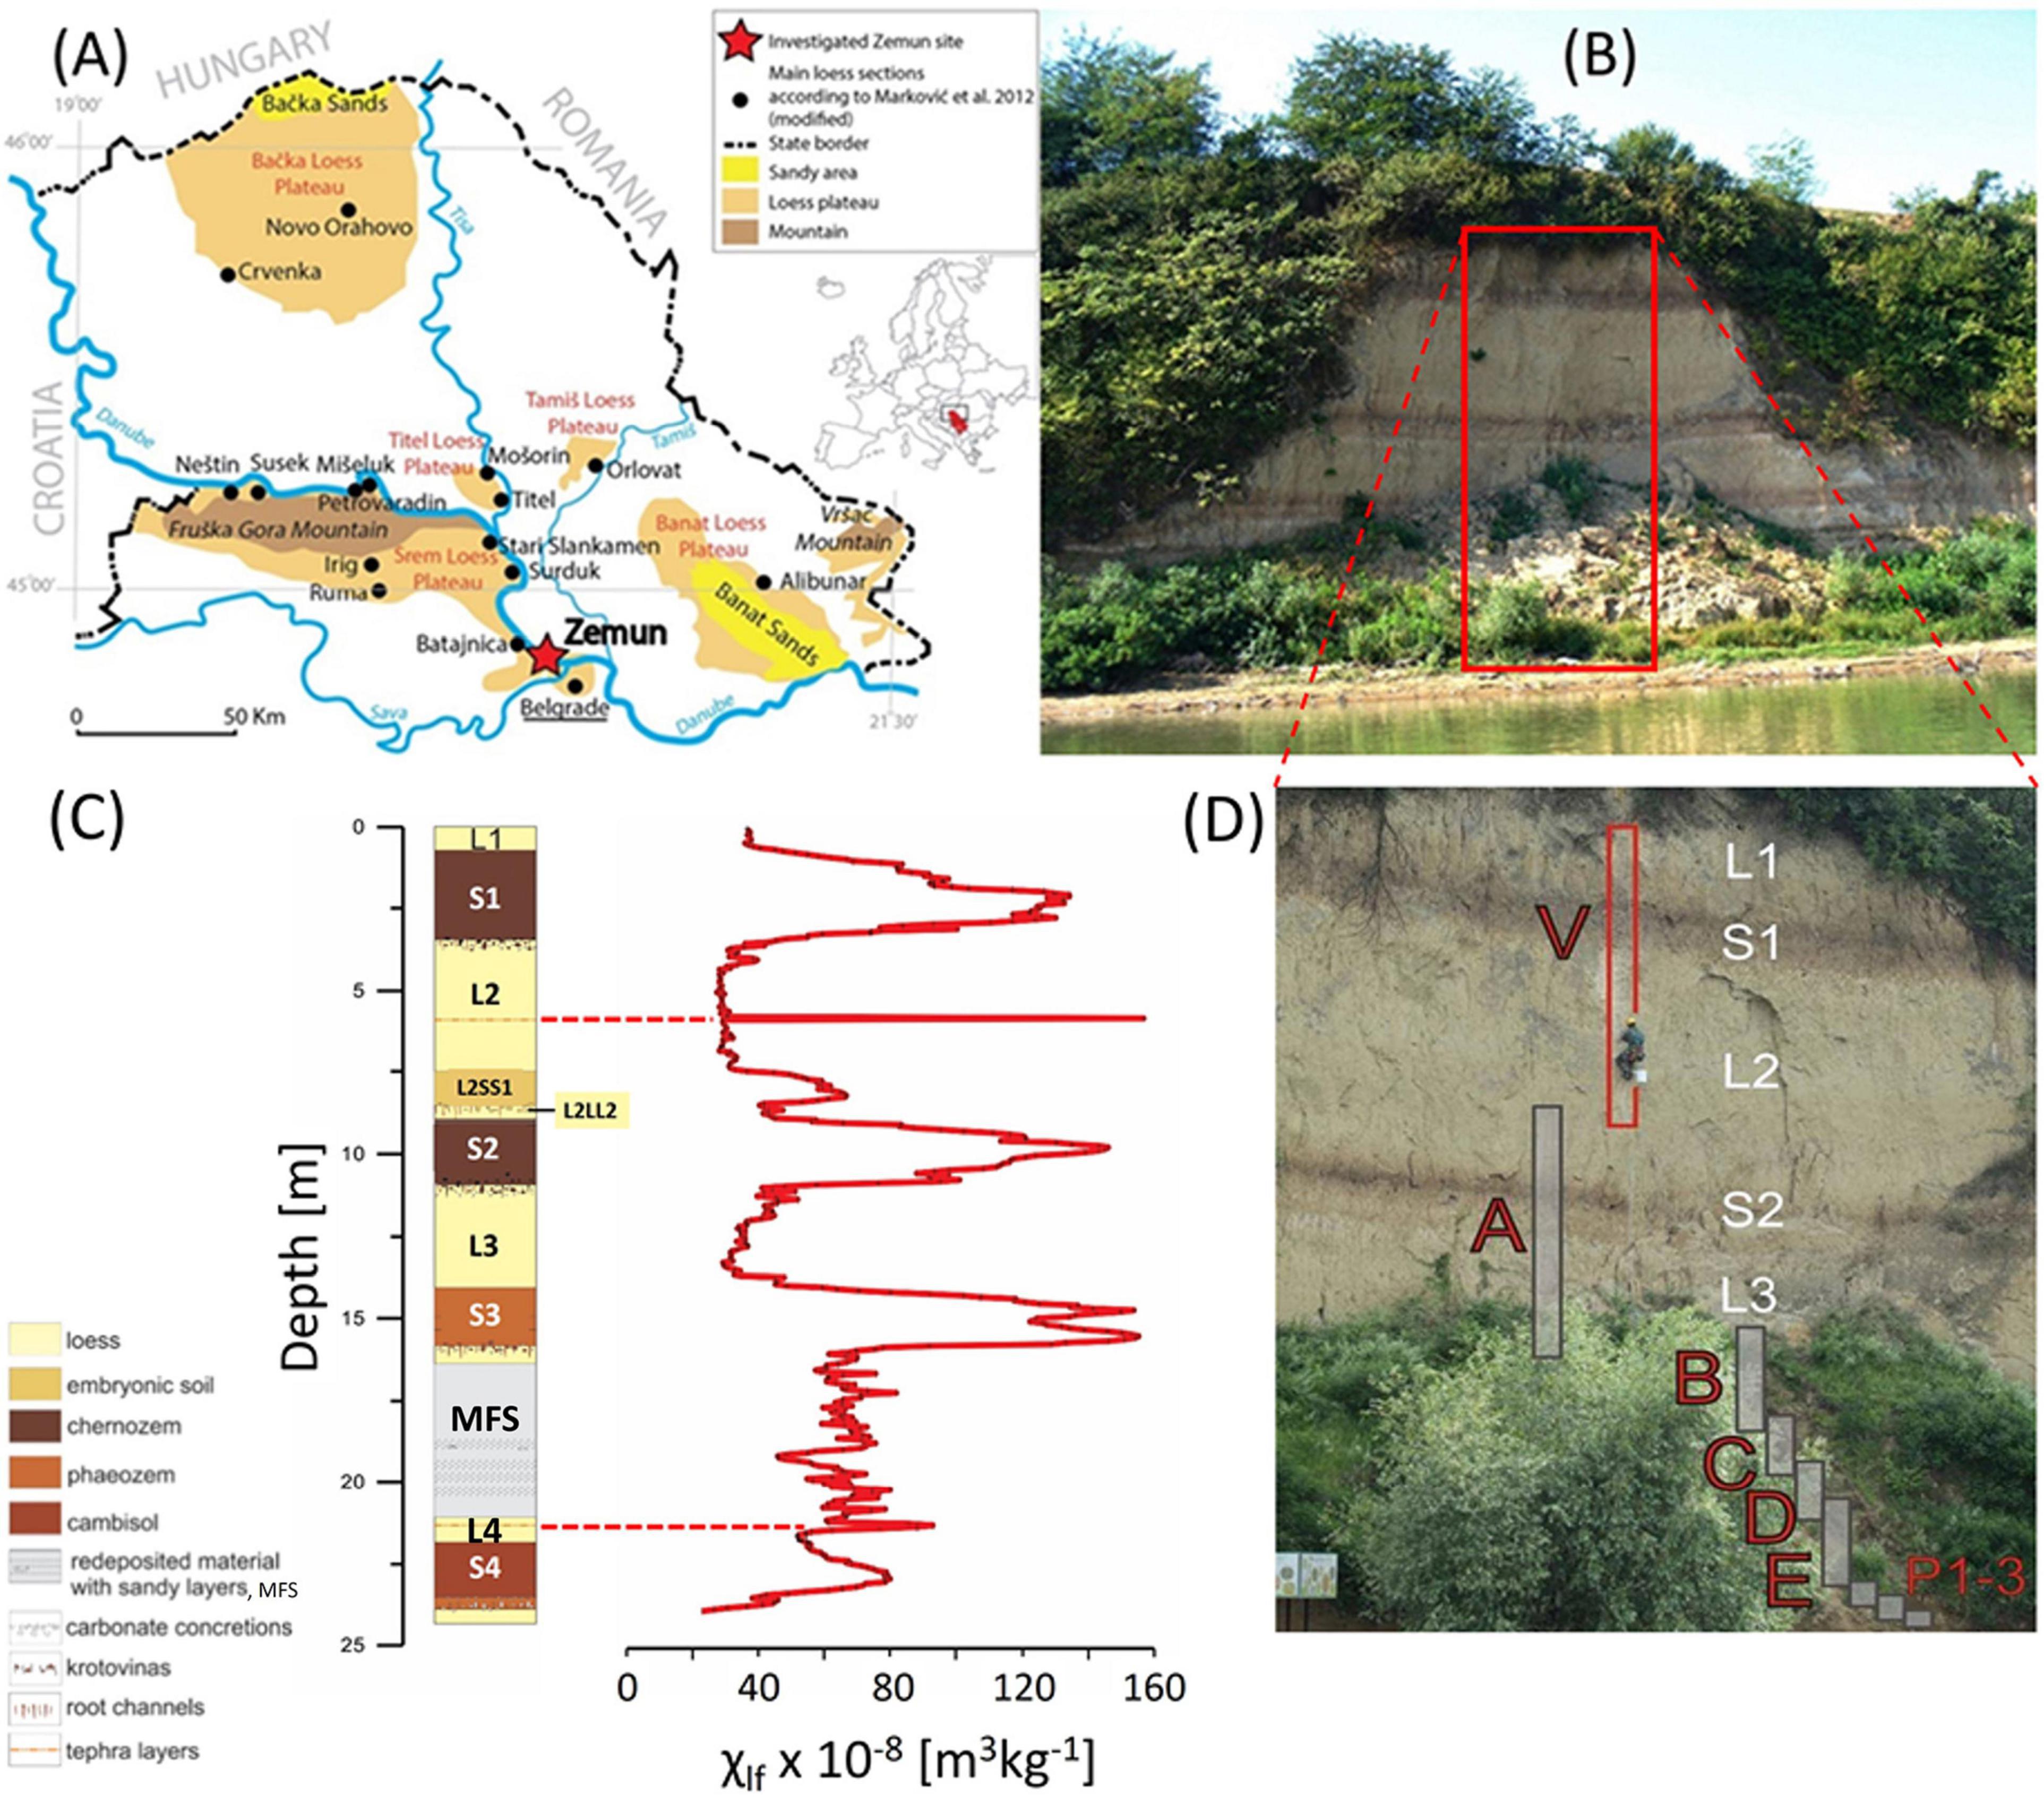
Figure 1. (A) Regional map with the loess distribution of northern Serbia (southern Middle Danube Basin) and neighboring key-profiles, adapted from Gavrilović et al. (2020). The Zemun LPS is indicated with a red star. (B) Photo of the studied Zemun LPS. Brownish layers are buried soils (paleosols). The studied section has a thickness of approximately 25 m. (C) Schematic drawing of the Zemun profile and the corresponding low-frequency magnetic susceptibility (χlf) record highlighting (dashed lines) the anomalously high values associated to two tephra layers. (D) Sampling strategy with indicated sub-sections mentioned in the text.
Parallel to sampling, the lithology of the sequence was described in the field focusing on loess structure, pedogenic features, and sediment color. Additionally, sediment samples were investigated under the binocular microscope in order to estimate mineralogical compositions and degree of roundness of grains. In loess deposits, aeolian origin is assumed when single grains predominantly show little rounding due to direct source to sink transport, whereas well-rounded grains reflect complex sediment recycling, long term transport and/or fluvial processes. Soil units were described following the World reference base for soil resources (IUSS Working Group WRB, 20151), even though we are fully aware that this system is not designed to classify buried soils also referred to as paleosols. Additionally, we follow the concept of accretionary soil formation characteristic of aeolian landscapes of western Eurasian dry steppe regions (Hambach et al., 2019; Jordanova and Jordanova, 2020; Lehmkuhl et al., 2021). These observations combined with results of laboratory analyses (colorimetric and magnetic parameters) form the base for a genetic interpretation of sediment formation.
Field observation of the vertically exposed outcrop wall recognizes four major lithofacies units (Figure 1): loess (L4, L3, L2LL1, L2, L1), interstadial-type (embryonic) paleosol (L2SS1), interglacial-type paleosols (S4, S3, S2, S1), and a brownish to blackish, sandy-silty well-bedded unit (marshy floodplain sediment, MFS) outcropping between the lower two interglacial paleosols.
Sampling for sedimentological analysis started at the transition from a basal brownish-yellowish loess unit to the lowermost exposed interglacial pedocomplex (S4) characterized by humus infiltrations in ancient root channels, carbonate concretions (up to 5 cm in diameter) and hydromorphic features, such iron coatings and iron/manganese oxide patches (Figure 1C). The basal red-brownish fossil pedocomplex (24.35–22.30 m relative profile depth) is c. 2.05 m thick and can be classified as a Cambisol typical of forest-steppe environments. A gradual transition is observed to the overlying loess unit (L4, 22.25–21.90 m). From 21.85 to 21.70 m, a 0.20 m thick bed of loosely cemented loess can be recognized. At 21.65 m depth, a drastic change in sediment toward sandier material is observed and referred hereafter as marshy floodplain sediment (MFS) (see section “Integrated Stratigraphy”). The MFS persists from 21.65 to 16.50 m with alternation of sandy iron-stained and sandy-silty beds with dark humus rich partly clayey beds dominating.
The subsequent polygenetic light reddish-brown paleosol (S3, 16.45–18.80 m) can be classified as a Phaeozem typical of steppe environments with mild and relatively humid winters. It is built from the bottom to the top by a lower pedogenetically overprinted unit. This is followed by a thin, lightly colored horizon with carbonate nodules and numerous krotovinas likely representing a pedogenetically overprinted loess unit overlain by a pedogenetic horizon with again many krotovinas. A gradual transition to the overlying c. 2.65 m thick yellowish-grayish loess (L3, 13.75–11.10 m) is observed.
The contact between L3 and the pedocomplex above is massively bioturbated and interspersed with carbonate concretions of sub-centimeter to decimeter size. This interglacial-type pedocomplex is c. 3.50 m thick and comprises in its lower part a brownish-blackish to dark grayish c. 2.00 m thick paleosol unit (S2, 11.05–8.70 m), which is classified as a polygenetic steppe soil of Kastenozem to Chernozem type typical of cool mid-latitude steppe environments. The lower strongly developed darker horizon has many carbonate pseudomycelia. Krotovinas are scattered throughout the middle lighter colored horizon and the upper weakly developed interstadial-type paleosol horizon (L2SS1, 8.40–7.35 m). S2 and L2SS1 are separated a thin (∼25 cm) pale yellowish loess unit (L2LL1, 8.65–8.45 m), which is bioturbated in its uppermost part transitioning into L2SS1 interstadial paleosol. The overlying pale-yellowish to partly yellowish-grayish loess unit (L2, 7.30–3.60 m) is c. 4.00 m thick and shows numerous fine lamina consisting of sandy loess beds in its middle part. At c. 5.8 m, a 2–3 cm reddish to brownish loose loess layer was observed.
The contact between L2 and the uppermost interglacial pedocomplex (S1, 3.55–0.60 m) is also characterized by massive carbonate concretions and krotovinas. The S1 pedocomplex is c. 2.95 m thick, composed of a lower dark brownish-grayish paleosol overlain by lighter paleosols marking variable degrees of pedogenesis during continued dust deposition. The entire complex can be characterized as a typical Chernozem soil with decreasing intensity of pedogenesis with time. The uppermost horizon of the S1 pedocomplex is rather weakly developed and contains numerous krotovinas.
The uppermost layer of the studied Zemun LPS is composed of pale porous sandy loess (L1, 0.60–0.00 m), which is loosely cemented with a few thin laminated beds of sandy-silt.
With the exception of the MFS sand dominated unit between 21.65 and 16.50 m, the entire sequence consists of coarse primary eolian silt with alternating contributions of fine sand in the pure loess and medium to fine silt in the paleosol units. Similar stratigraphic features can be observed in LPSs close to the Zemun LPS, e.g., from Batajnica (Marković et al., 2009), and the Titel-Stari Slankamen composite profile (Marković et al., 2011, 2015).
Materials and Methods
Sampling
Sampling was performed from abseiling the wall (subsections V, A) and in dug trenches (subsections B, C, D, E, P 1–3). Subsections V and A cover the uppermost c. 15 m and are c. 2 m apart, whereas subsections B, C, D, E, and P 1–3 are located between c. 6 and 10 m upstream to the northwest (Figure 1D). All subsections overlap and provide the basis for the construction of the composite profile. After thorough cleaning of the profile, bulk samples were taken with 5 cm spacing for a total of 479 sampling depths. For laboratory analyses described in following section “Room Temperature Susceptibility Measurements”, bulk samples were dried at 30°C for 48 h, homogenized and compressed into non-magnetic 6.4 cm3 plastic boxes (n = 479) and ∼1.1 cm3 gelatin capsules (n = 262). Masses of bulk samples within boxes and capsules were measured and recorded.
Room Temperature Susceptibility Measurements
Magnetic susceptibility measurements were carried out in 2017 at the Environmental and Palaeomagnetic laboratory at the University of Bayreuth. Measurements of low-field mass normalized magnetic susceptibility (χ), performed on all 479 box-samples, were obtained with a Magnon kappa bridge (Magnon, Dassel, Germany—VFSM) operating with a 320 A/m applied field at low frequency (300 Hz, χlf) and high frequency (3,000 Hz, χhf). The absolute frequency dependence of magnetic susceptibility Δχ is determined from:
and the percent increase (χfd) with respect to χlf from:
(Mullins and Tite, 1973; Dearing et al., 1996; Eyre, 1997).
Hysteresis Measurements
Hysteresis measurements were performed with a Princeton Measurements Corporation Model 3900 Vibrating Sample Magnetometer (VSM) at the Institut de Physique du Globe de Paris (Paleomagnetism Research Group). A total of 262 samples were investigated across sub-sections of the Zemun profile covering the interval from 12.05 m depth (L3) to the top of the profile continuously (n = 240), an interval from 22.25 to 21.50 m continuously (n = 16) and 6 other discontinuous intervals within the sandy MFS (Figure 1).
For 6 of 10 samples stemming from the MFS sample preparation required modification to prevent grain movement favored by the higher sand content during hysteresis, FORC and IRM acquisition measurements on the VSM. The preparation consisted in piercing a hole at the base of the capsule to allow air to be released during the filling process. A thin layer of diamagnetic cotton was inserted to prevent single grains to fall through the air-release hole. Between 120 and 170 mg of the coarse grain sediment was added to the capsule and the net-weight measured. Grains were immobilized by adding neoprene gel glue, verified to be diamagnetic (c. −3 × 10⁻⁸ m3kg–1). Complete saturation with glue was confirmed by leaking glue through the air-release hole. The lid was also filled with neoprene glue before sealing the capsules with the temperature resistant tape (see Supplementary Figure 1). Samples were dried overnight.
Prior to hysteresis measurements, the χ of each sediment-filled capsule was determined with an AGICO KLY-3 kappabridge operating in a 300 A/m applied field at a frequency of 875 Hz. These low-field susceptibility measurements were used to (1) test whether the gelatine capsule subsamples are representative of the larger box samples, and (2) calculate the ferrimagnetic component of susceptibility (χferri) by calculating the difference of the KLY3 bulk low-field susceptibility and the calculated high-field susceptibility (χhifi) from the slope of the high-field linear segment of the hysteresis loop:
Three experiments were conducted with the VSM. (1) Hysteresis loops were measured in maximum applied fields of ± 1.5 T over 100 ms measurement times at each applied field step. The applied field increment was set to 5 mT. Experiments began at positive maximum field following a 1 s pause. The following parameters were derived from each hysteresis loop: coercivity (Hc), saturation magnetization (Ms), saturation remanent magnetization (Mrs) and high-field magnetic susceptibility (χhifi), calculated from the linear high-field slope of the magnetization above 1.05 T. The ratio between χferri and Ms can be used to track variations in relative concentration of superparamagnetic (SP) particles assuming a constant magnetic mineral assemblage. (2) The coercivity of remanence (Hcr) was determined from backfield direct current demagnetization of the forward maximum field (1.5 T) isothermal remanent magnetization (IRM). 70 backfield steps were logarithmically spaced over the 0–500 mT range. (3) Backfield direct current demagnetization of the forward maximum field (1.5 T) IRM was also measured using linear 100 mT backfield steps from 0 to 1.5 T. From these data, relative contributions to the total IRM1.5T, such as the S-ratio are determined, as well as absolute contributions to the total IRM1.5T within various coercivity windows, such as HIRM, are quantified. The S-ratio was calculated after King and Channell (1991) as follows:
resulting in values possibly ranging from −1 to +1, where values decrease from 1 as the relative contribution of hard magnetic minerals (defined here as having a coercivity of remanence greater than 300 mT) to the total IRM1.5T increases. The hard isothermal remanent magnetization (HIRM) was calculated from the difference in magnetization between the 0.3 T and 1.5 T backfield steps following a forward field magnetization in 1.5 T (e.g., Taylor and Lagroix, 2015; Liu et al., 2016):
The ratios of Hcr/Hc and Mrs/Ms (indicative of a samples mean magnetic grain size) were plotted on a modified Day-Dunlop plot (Day et al., 1977; Dunlop, 2002a,b), tracing differences in loess/paleosol samples and potentially tephra-bearing samples, the latter expected to contain higher PSD and SD content than loess.
First Order Reversal Curve (FORC) Investigations
FORC investigations were carried out for six samples using the VSM. Specifically, FORCs were acquired on two samples suspected to contain tephra material (ZV 117, 5.80 m profile depth, containing the L2 tephra) and ZP1 001 (21.70 m, containing the Bag tephra, and reflecting the highest magnetic susceptibility signal out of 4 samples (ZP1 001- ZP1 004). To identify differences in magnetic grain size and possible differences in magnetic interactions, FORCs were also carried out on samples representative of loess units bracketing the suspected L2 and Bag tephra occurrences ZV 112 (5.55 m), ZV 126 (6.25 m), ZE 047 (21.65 m), and ZP1 016 (22.45 m). ZE 047 marks the base of the MFS and is hydromorphically overprinted but it is the sample immediately above the suspected Bag tephra sample analyzed (ZP1 001). Samples were exposed to a saturating field of 500 mT, Hu (min, max) were selected after initial test-measurements to ± 80 mT, and Hc (min, max) to 0 and 100 mT. Averaging time was set to 300 ms, reducing measurement noise. For each diagram, 150 FORCs were acquired at a field increment of ca. 1.9 mT. For weak samples originating from loess units, 2–9 series of FORC measurements were measured and averaged. The number of FORCs averaged for each sample is reported as n-values in Figure 6.
FORC data analyses were carried out using FORCinel version 3.06 (Harrison and Feinberg, 2008). The main pre-processing consisted in drift and high-field slope corrections, first point removal, and lower-branch subtraction. FORCs of loess samples, for which multiple FORC were measured, were averaged in FORCinel. FORC diagrams were improved by color rescaling selecting a rectangle area around the central ridge and using the “Autoscale” option. Smoothing was conducted according to the VARIFORC approach (Egli, 2013) with the following smoothing factors: vertical ridge Sc0 = 4, central ridge Sb0 = 3, horizontal smoothing Sc1 = 7, vertical smoothing Sb1 = 7, horizontal and vertical lambdas 0.1, output grid = 1 and central ridge offset = 0. Horizontal profiles were extracted using FORCinextras.
High-Resolution IRM Acquisition
Complementary to FORC measurements, high-resolution step-wise isothermal remanent magnetizations (IRM) were acquired on the same samples using the VSM. Samples were demagnetized before IRM acquisition. The initial field was set to 15 μT, the final field to 1.5 T, using 300 logarithmically spaced measurement steps.
Tentative un-mixing of the IRM acquisition curves was carried out with aid of the MAX UnMix RShiny web-application (Maxbauer et al., 2016). Smoothing factors were set between 0.5 and 0.6, depending on measurement noise. Before using MAX UnMix, first derivatives of the raw IRM acquisition data were calculated, distributions of suspected tephra and bracketing loess samples compared to determine roughly the number and characteristics of geologically realistic components. These components were used in the fitting panel of MAX Unmix, and then refined in the optimization panel by minimizing the residual sum of squares (RSS). Final determination of the components characteristics were obtained in the Error Analysis panel, providing mean values and uncertainties based on 100 Monte-Carlo random re-samplings of 95% of the data.
Colorimetric Measurements
Initial colorimetric measurements were carried out at the Environmental and Palaeomagnetic laboratory at the University of Bayreuth. Colorimetric analyses have been done in the past decades by visual identification of Munsell color charts (e.g., Tsatskin et al., 1998; Günster et al., 2001; Machalett et al., 2006), but its importance for paleoclimatic reconstruction remained little explored for a long time. These color charts provide alphanumerical indices for each sample by comparing the sampling material with a single-color rectangle. This procedure has some disadvantages (Post et al., 2015) such as subjective evaluation by a researcher and dependence on specific moisture and lighting. Spectrophotometers eliminate these uncertainties (Sun et al., 2011) and provide objective numerical values of luminance (L∗), redness (a∗) and blueness (b∗). L∗ ranges from 0 (black) to 100 (white), whereas a∗ ranges from negative (green) to positive (red) and b∗ from negative (blue) and positive (yellow). The redness a∗ is commonly interpreted as reflecting weathering intensity (Yang and Ding, 2003). These three parameters span a 3-dimensional color sphere and derived Lab-values can be transformed to RGB colors to make their real colors visible (as conducted in Figure 3). Furthermore, spectrophotometers provide backscattered intensities of wavelengths each 10 nm from the visible light spectrum (here 400 to 700 nm only). These backscattered spectra are capable of tracing distinct minerals out of a heterogeneous bulk-sample mineral assemblage. An additional advantage is the fast (∼2 s per sample) and non-destructive nature of the measurement.
Diffuse Reflective Spectroscopy (DRS) measurements were carried out in 2020 at the Leibniz Institute for Applied Geophysics (LIAG, Grubenhagen) with a Konica Minolta CM 700d spectrophotometer, in 10° observer angle and using the D65 norm-light calibration. An oculus width was obtained with a 0.8 cm open adapter. Backscattered reflectance spectra were converted into 1st derivative values with a newly developed R-script. 1st derivative values were used to calculate the hematite/goethite ratio (HGR), following the same approach described in Wu et al. (2018). HGR was calculated from the ratio of backscattered intensities (I) at 565 nm, associated to hematite, and 435 nm, associated to goethite, so that HGR = I565 nm /I435 nm (Barranco et al., 1989; Deaton and Balsam, 1991; Debret et al., 2011). The backscattered intensity bands were selected based on peaks in the 1st derivative spectrum (Figure 2). For the transformation of Lab values into RGB colors, a modified R-script (R Core Team, 2020) was used (Zeeden et al., 2017).
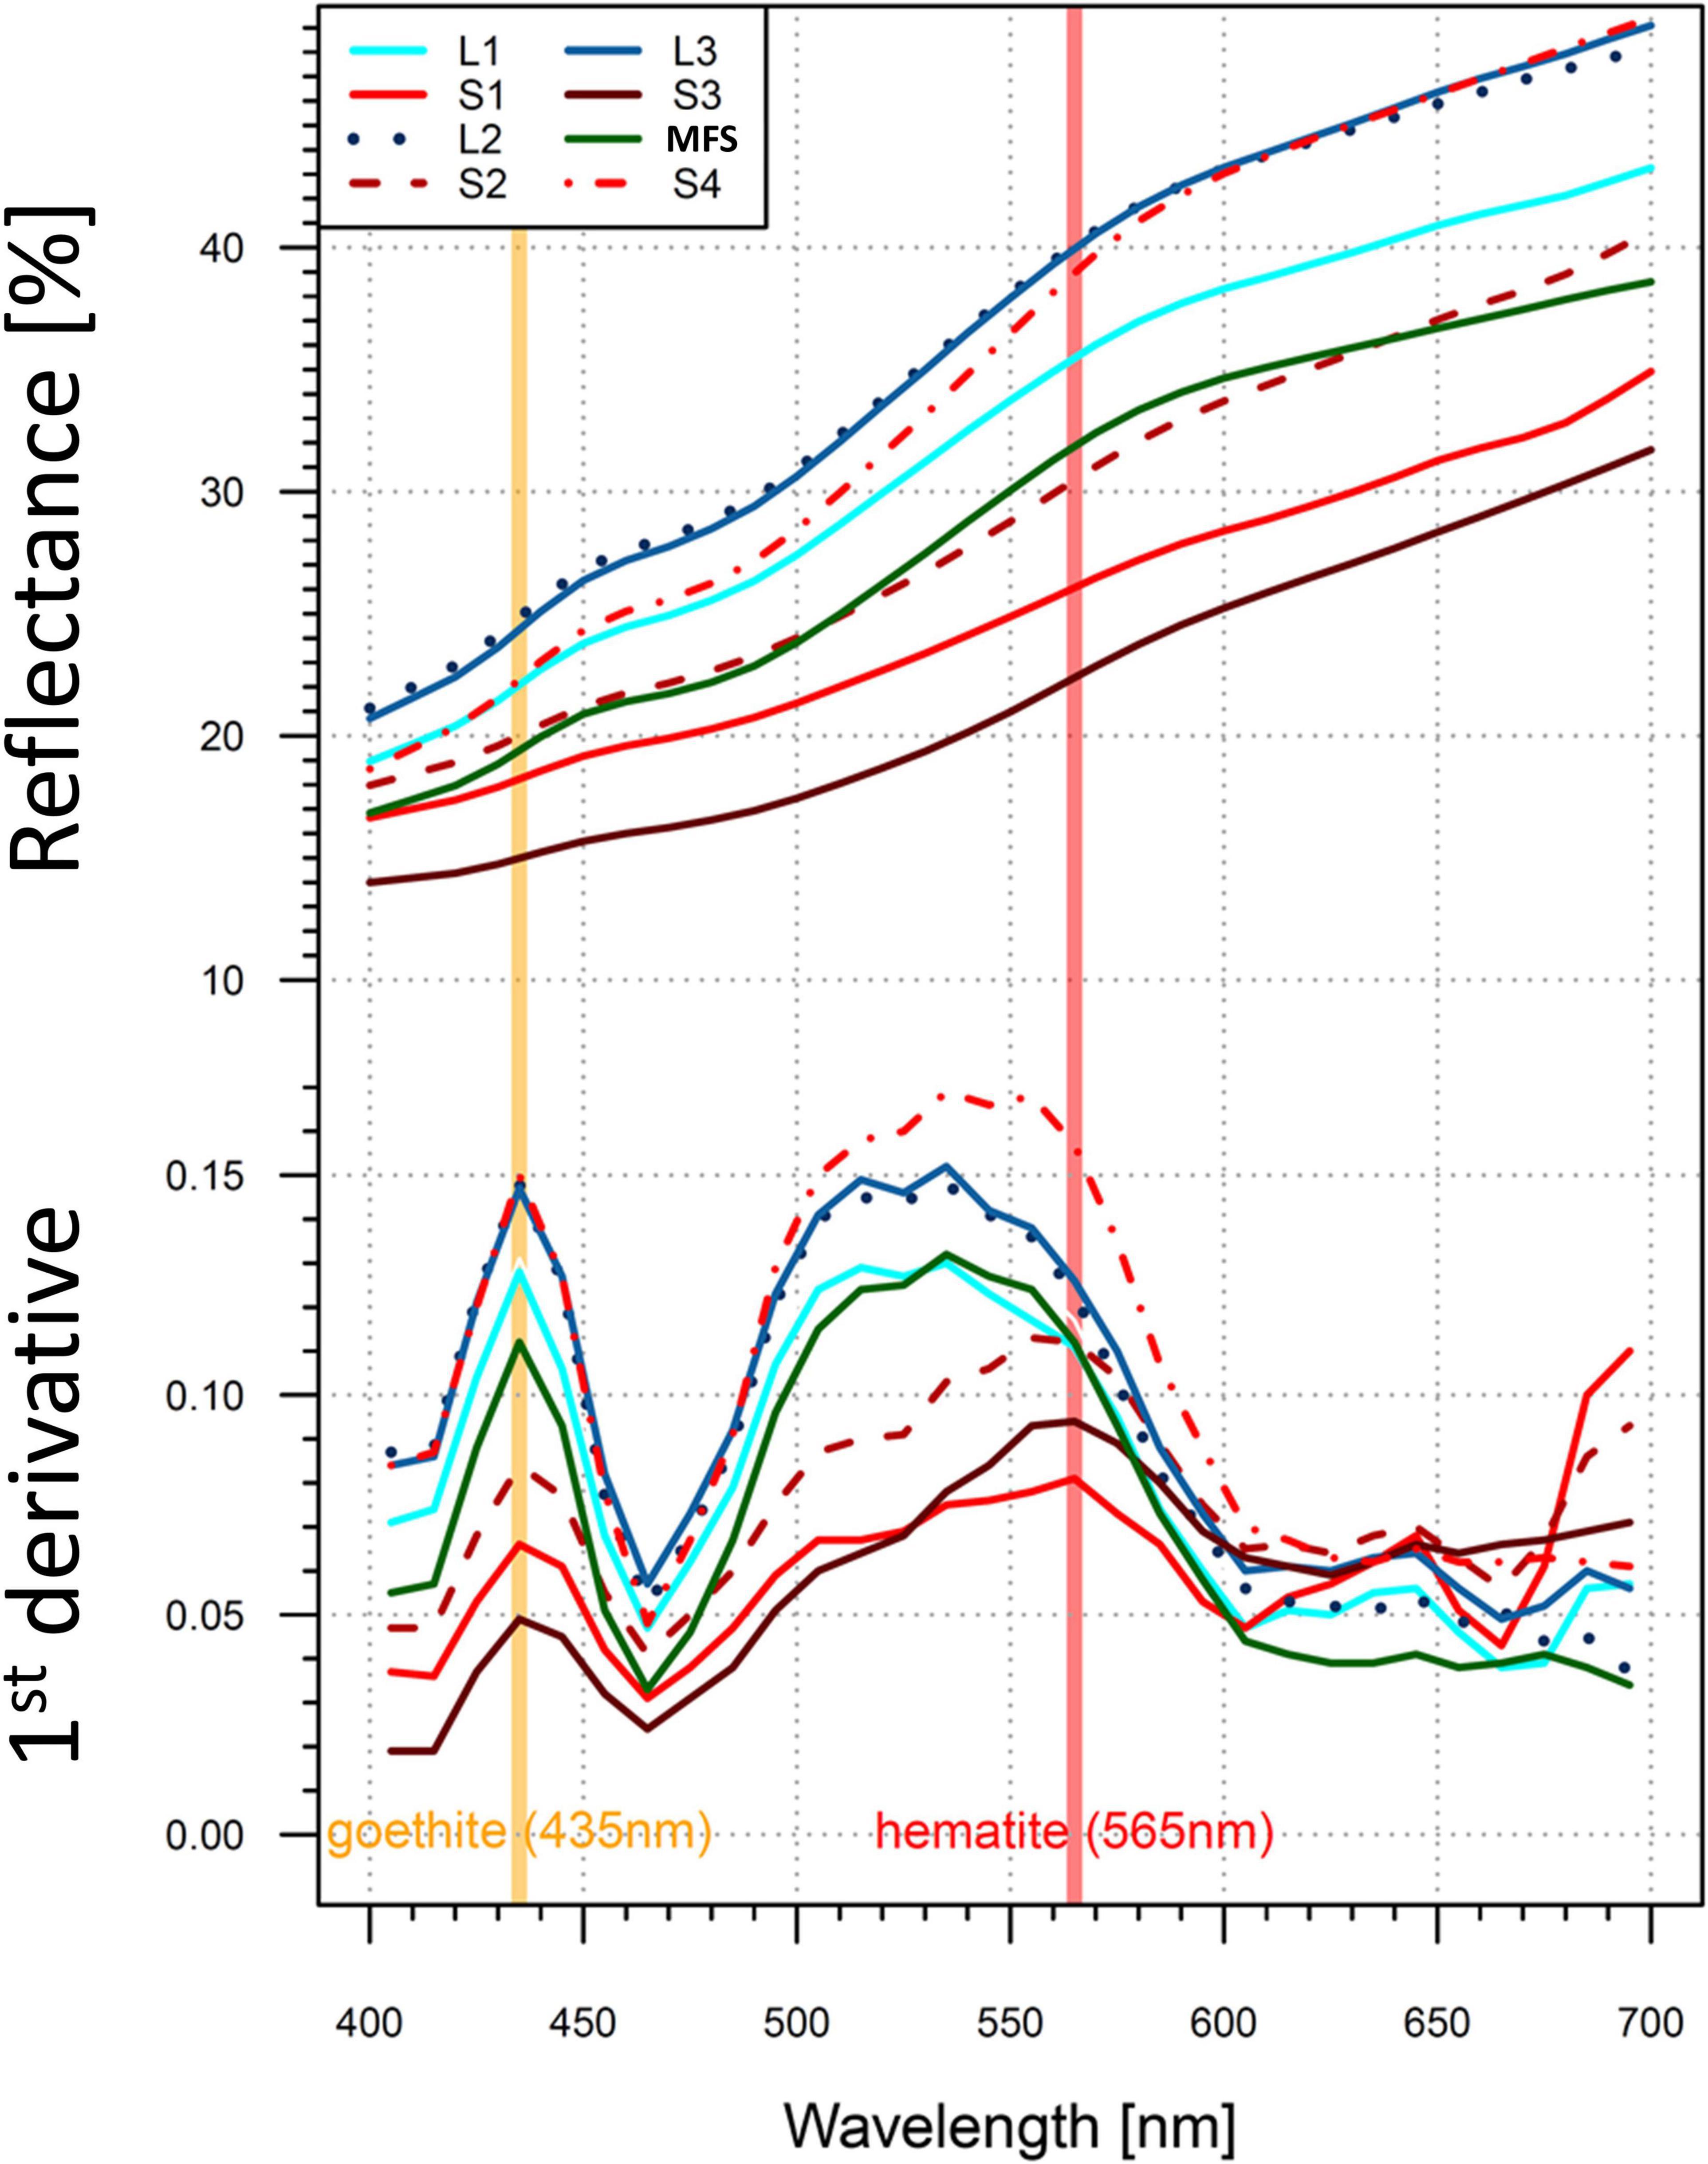
Figure 2. DRS analysis of selected representative samples from different stratigraphical units of the Zemun LPS. Upper plot displays raw backscattered intensities of wavelengths ranging between 400 and 700 nm in 10 nm intervals. Lower plot displays the first derivatives of backscattered wavelengths. Assumed contributions of hematite and goethite at distinct wavelengths are indicated as orange and red vertical bands, respectively. MFS is the abbreviation for marshy floodplain sediments.
Generation of the Age Model
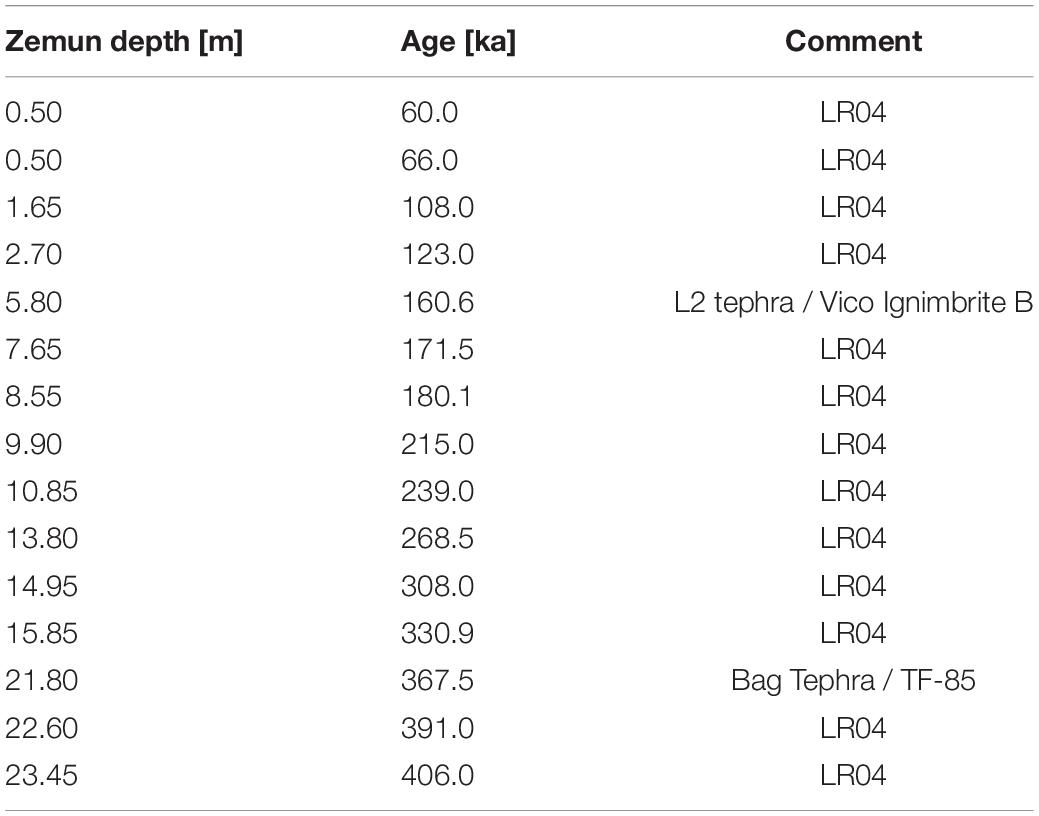
The age model (Figure 9) was constructed by correlating Δχ variations and the LR04 stack (Lisiecki and Raymo, 2005), reflecting mainly global ice volume by benthic δ18O. Tie-points were selected based on (1) variations in magnetic parameters interpreted to fluctuate predominantly as a function of pedogenic intensity, and (2) similarities in fluctuation and amplitude of magnetic parameters when compared to the LR04 stack and Imbrie and Imbrie ice model (Imbrie and Imbrie, 1980). Identified tephra layers provide additional tie-points. This approach resulted in 13 tie-points (Table 1). Two additional tie-points constrain the age model stemming from the two potential tephra layers identified magnetically and compatible with sedimentological observations in the field. For the age model construction, the “astrochron” package version 0.9 (Meyers, 2014) was used for linear interpolation.
Results
Magnetic Susceptibility Parameters and Stratigraphical Assignment
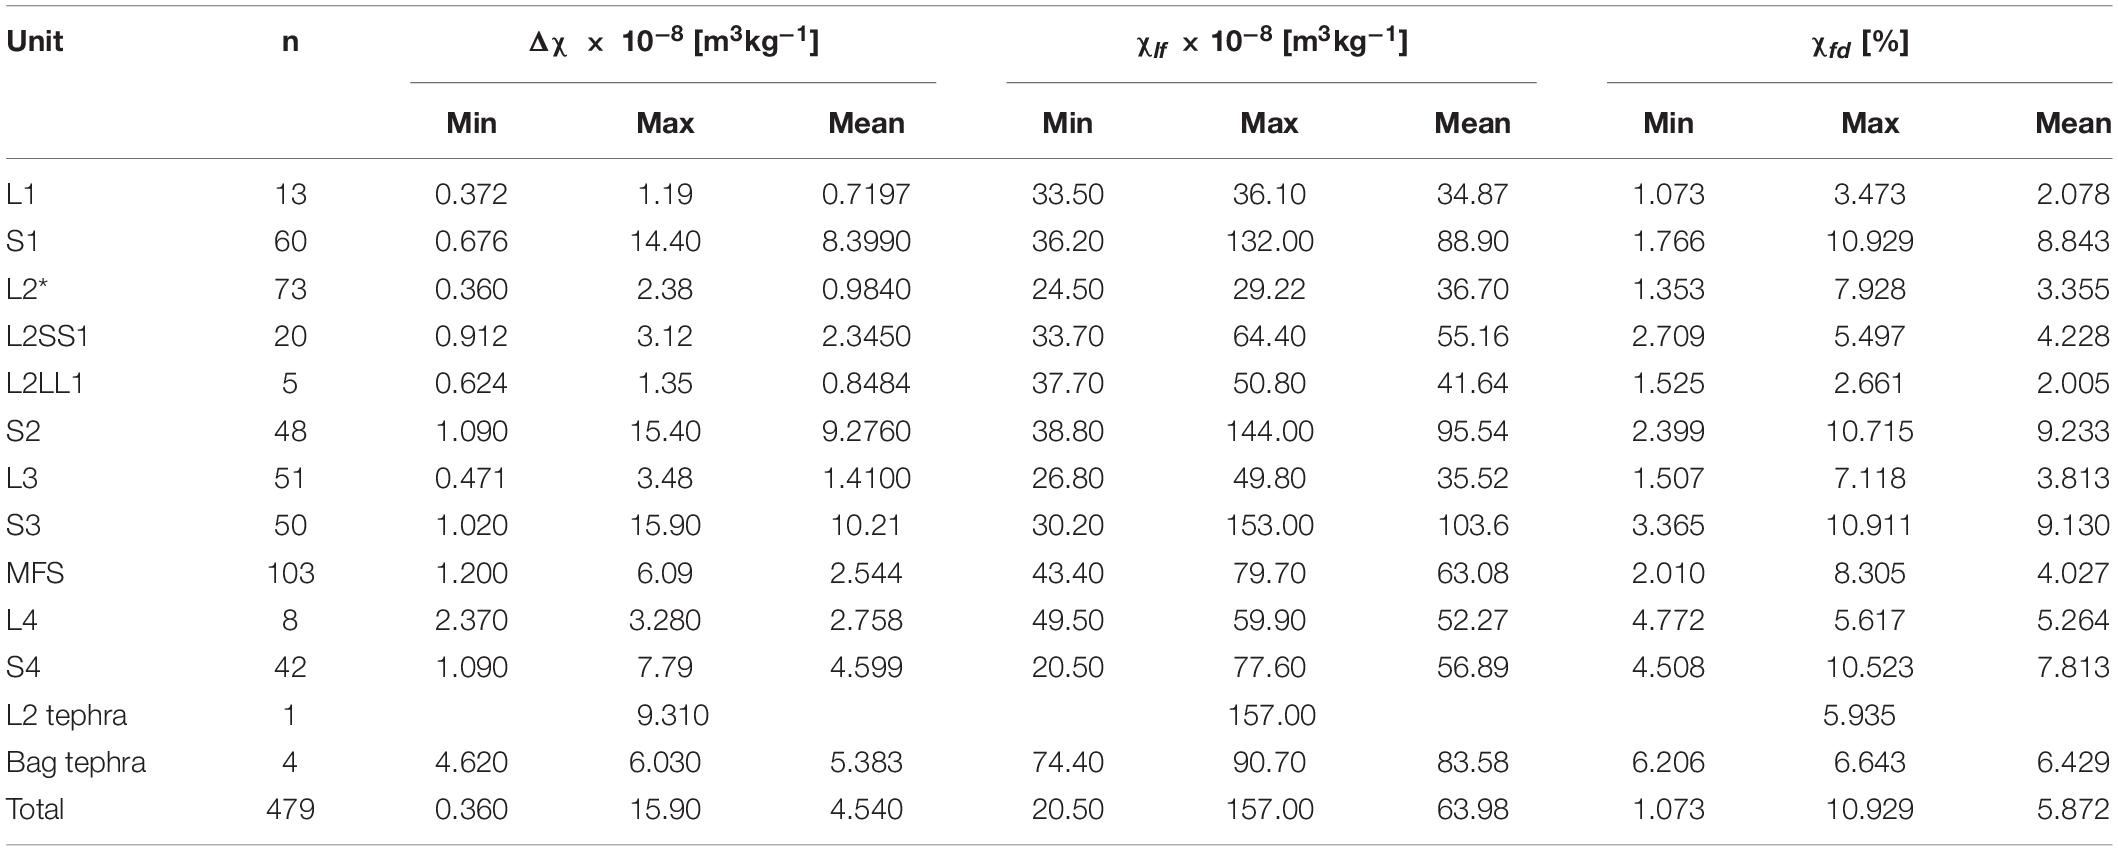
Based on the record of magnetic susceptibility with depth, a general pattern with low-frequency susceptibility (χlf) values being generally low in loess units, and high in paleosols can be observed for the Zemun LPS (Figure 3 and Table 2).
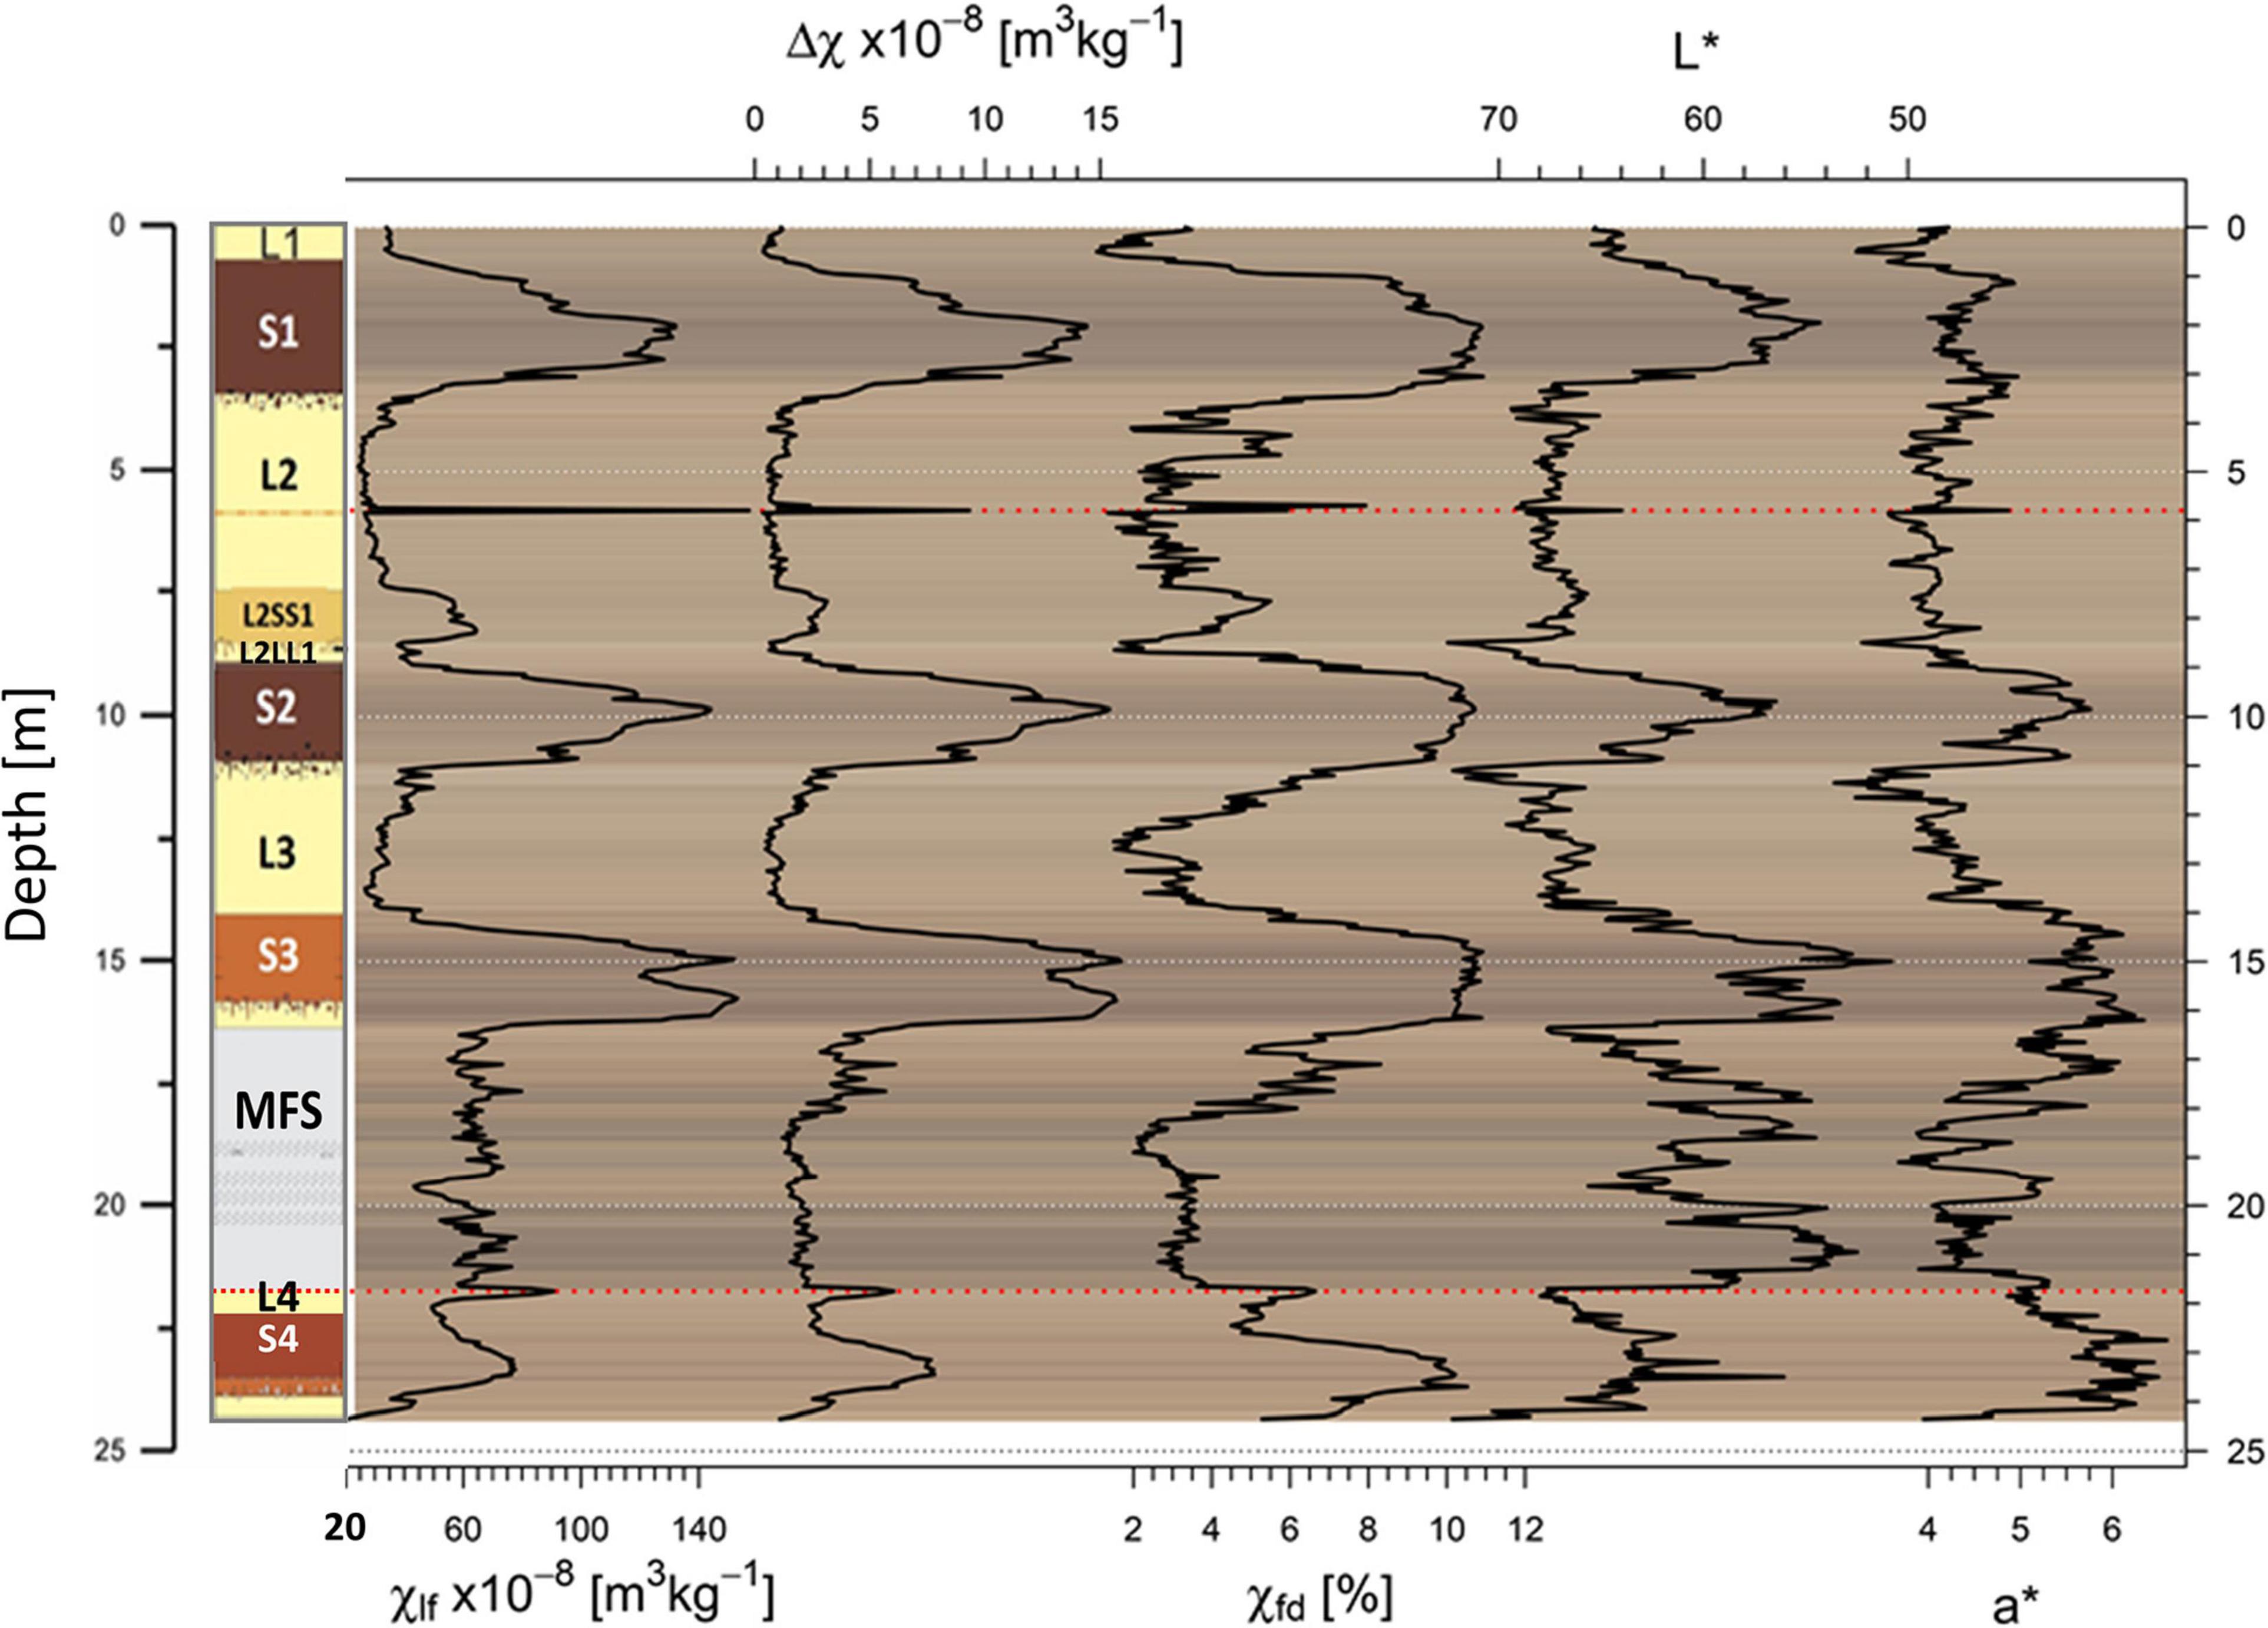
Figure 3. Stratigraphic view of magnetic susceptibility parameters χlf, Δχ, χfd [%], and selected colorimetric parameters L* and a*. The variability of magnetic susceptibility parameters with depth reflects the pacing of interglacial (S4–S1) and glacial (L4–L1) cycles. Potential tephra layers (red dotted lines) are referred to as the L2 tephra and to as the Bag tephra. Note that the scale for L* is inversed. Lab color values are transformed to RGB colors for each sample and plotted in the background.
Such a pattern is well known from Eurasian LPS and predominantly reflects past environmental changes between glacials and interglacials during the Pleistocene. Following the stratigraphic nomenclature introduced by Marković et al. (2015), results reveal that the sampled profile extends from a basal S4 pedo-complex, assigned to MIS 11 to the oldest part of the L1 directly overlaying the last interglacial-early glacial pedo-complex S1. Beside distinct elevated magnetic susceptibilities in interglacial paleosols, the highest χlf value (157 × 10–8 m3kg–1) is observed as a sharp peak at 5.80 m depth within the L2 unit. This peak coincides with the field description of a 2–3 cm reddish to brownish loose loess layer and is stratigraphically and magnetically consistent with the L2 tephra layer described in other LPS regionally (e.g., Laag et al., 2018; Antoine et al., 2019). Mean χlf values of paleosols S3 to S1 decrease slightly from ∼115 to 100 to 90 × 10–8 m3kg–1, respectively (Table 2 and Figure 3). Mean values of Δχ also decrease from S3 to S1. The S4 pedocomplex displays mean values of χlf, Δχ and χfd % that are much lower than S3–S1. Finally the MFS layer has moderately high χlf values, greater than S4 but less than S3-S1, which fluctuate over short depth intervals. Δχ and χfd % values of the MFS are low comparable to loess units.
The magnetic enhancement of the paleosol is readily observable on the Δχ vs. χlf bi-plot shown in Figure 5A. Depth intervals within the MFS and containing tephra material plot above the main trend line. Two populations are distinctively identified along this trend with one predominantly represented by samples showing no magnetic enhancement characterized by nearly all samples within loess units, and a second reflecting pedogenesis (higher Δχ and χlf) are all stemming from paleosol units. The strongest enhancement is expressed in paleosol S3, while S1 and S4 pedocomplexes spread over a wide range of Δχ and χlf. A background low-frequency magnetic susceptibility of 24.6 × 10⁻⁸ m3kg–1 is obtained by fitting a linear regression line through the data excluding the MFS and tephra intervals. This background value is higher than what is observed in Central Asia and China (17 ± 2 × 10⁻⁸ m3kg–1 Forster et al., 1994) or at Semlac in Romania (10 × 10–8 m3kg–1 Zeeden et al., 2016) but similar to LPS north of Prague in the Czech Republic (22 × 10–8 m3kg–1 for Sedlec and 23 × 10–8 m3kg–1 for Zemechy Forster et al., 1996).
Hysteresis Parameters
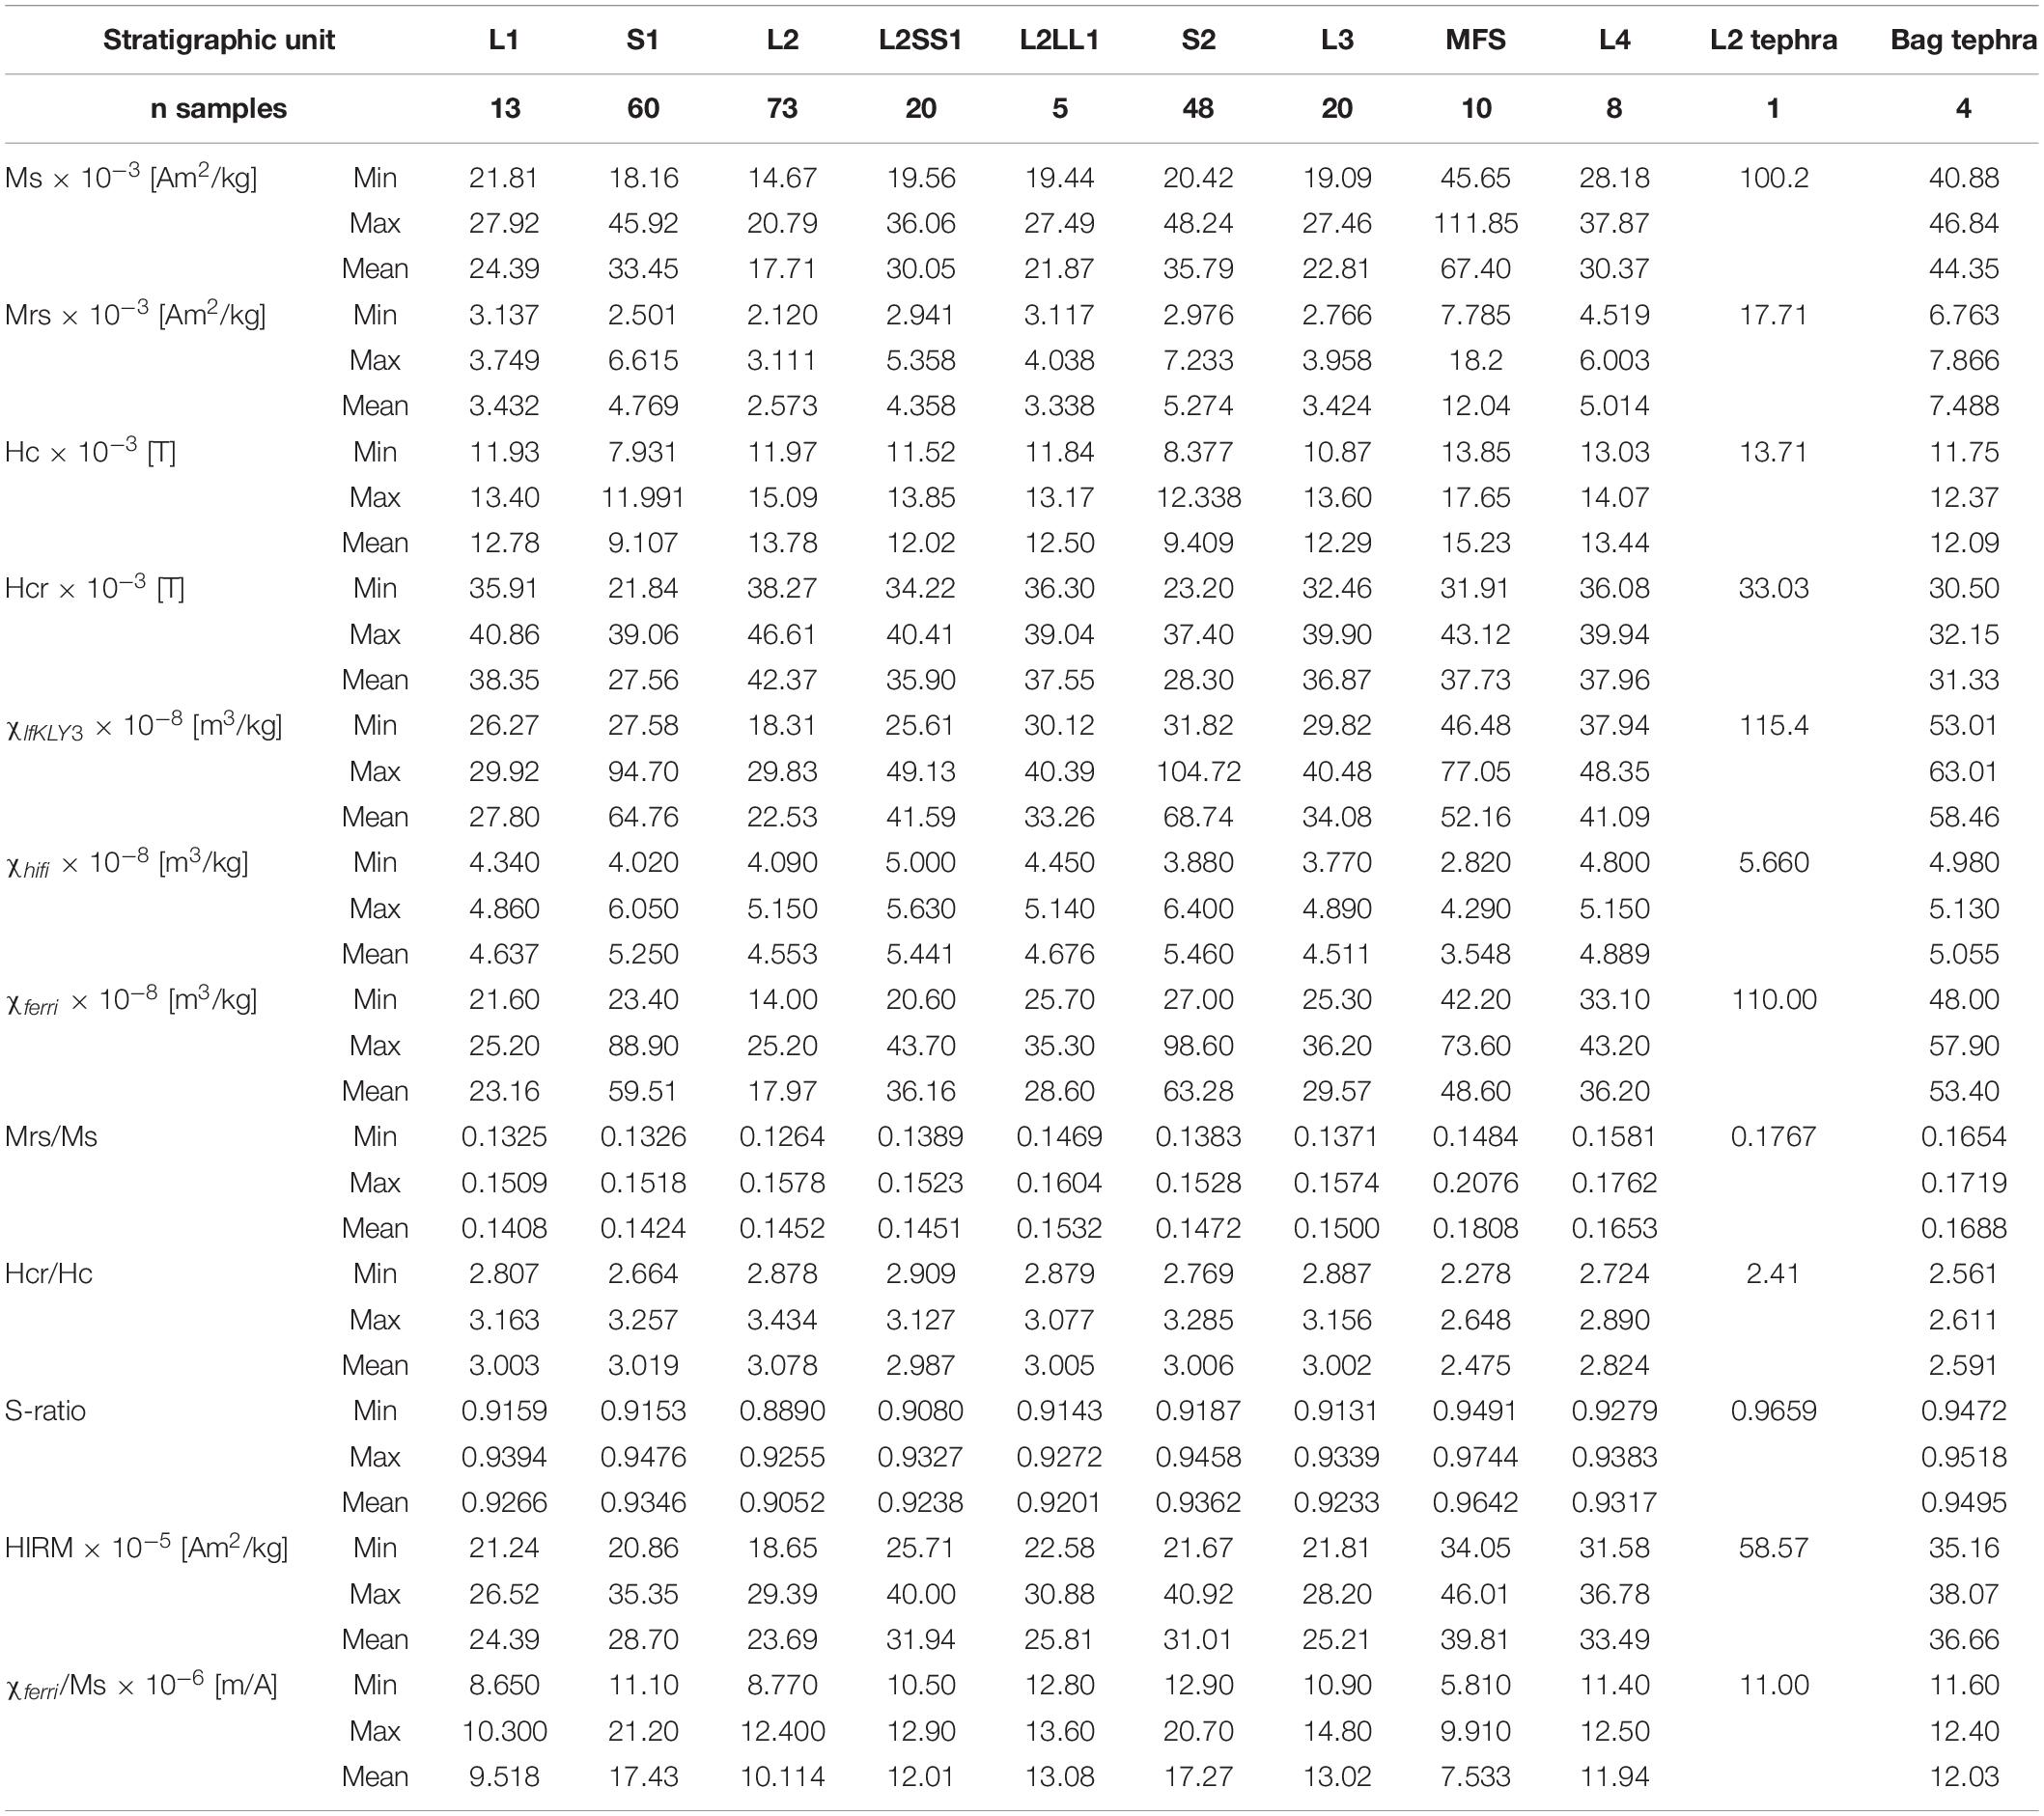
Hysteresis loop derived parameters are summarized in Table 3 and plotted in Figures 4, 5. Combining data sets acquired on the box and gelatin capsules subsamples was validated and is demonstrated in the Supplementary Material (Supplementary Figure 2) by KLY3 χlf vs. VFSM χlf measurements defining a linear fit with an r of 0.99.
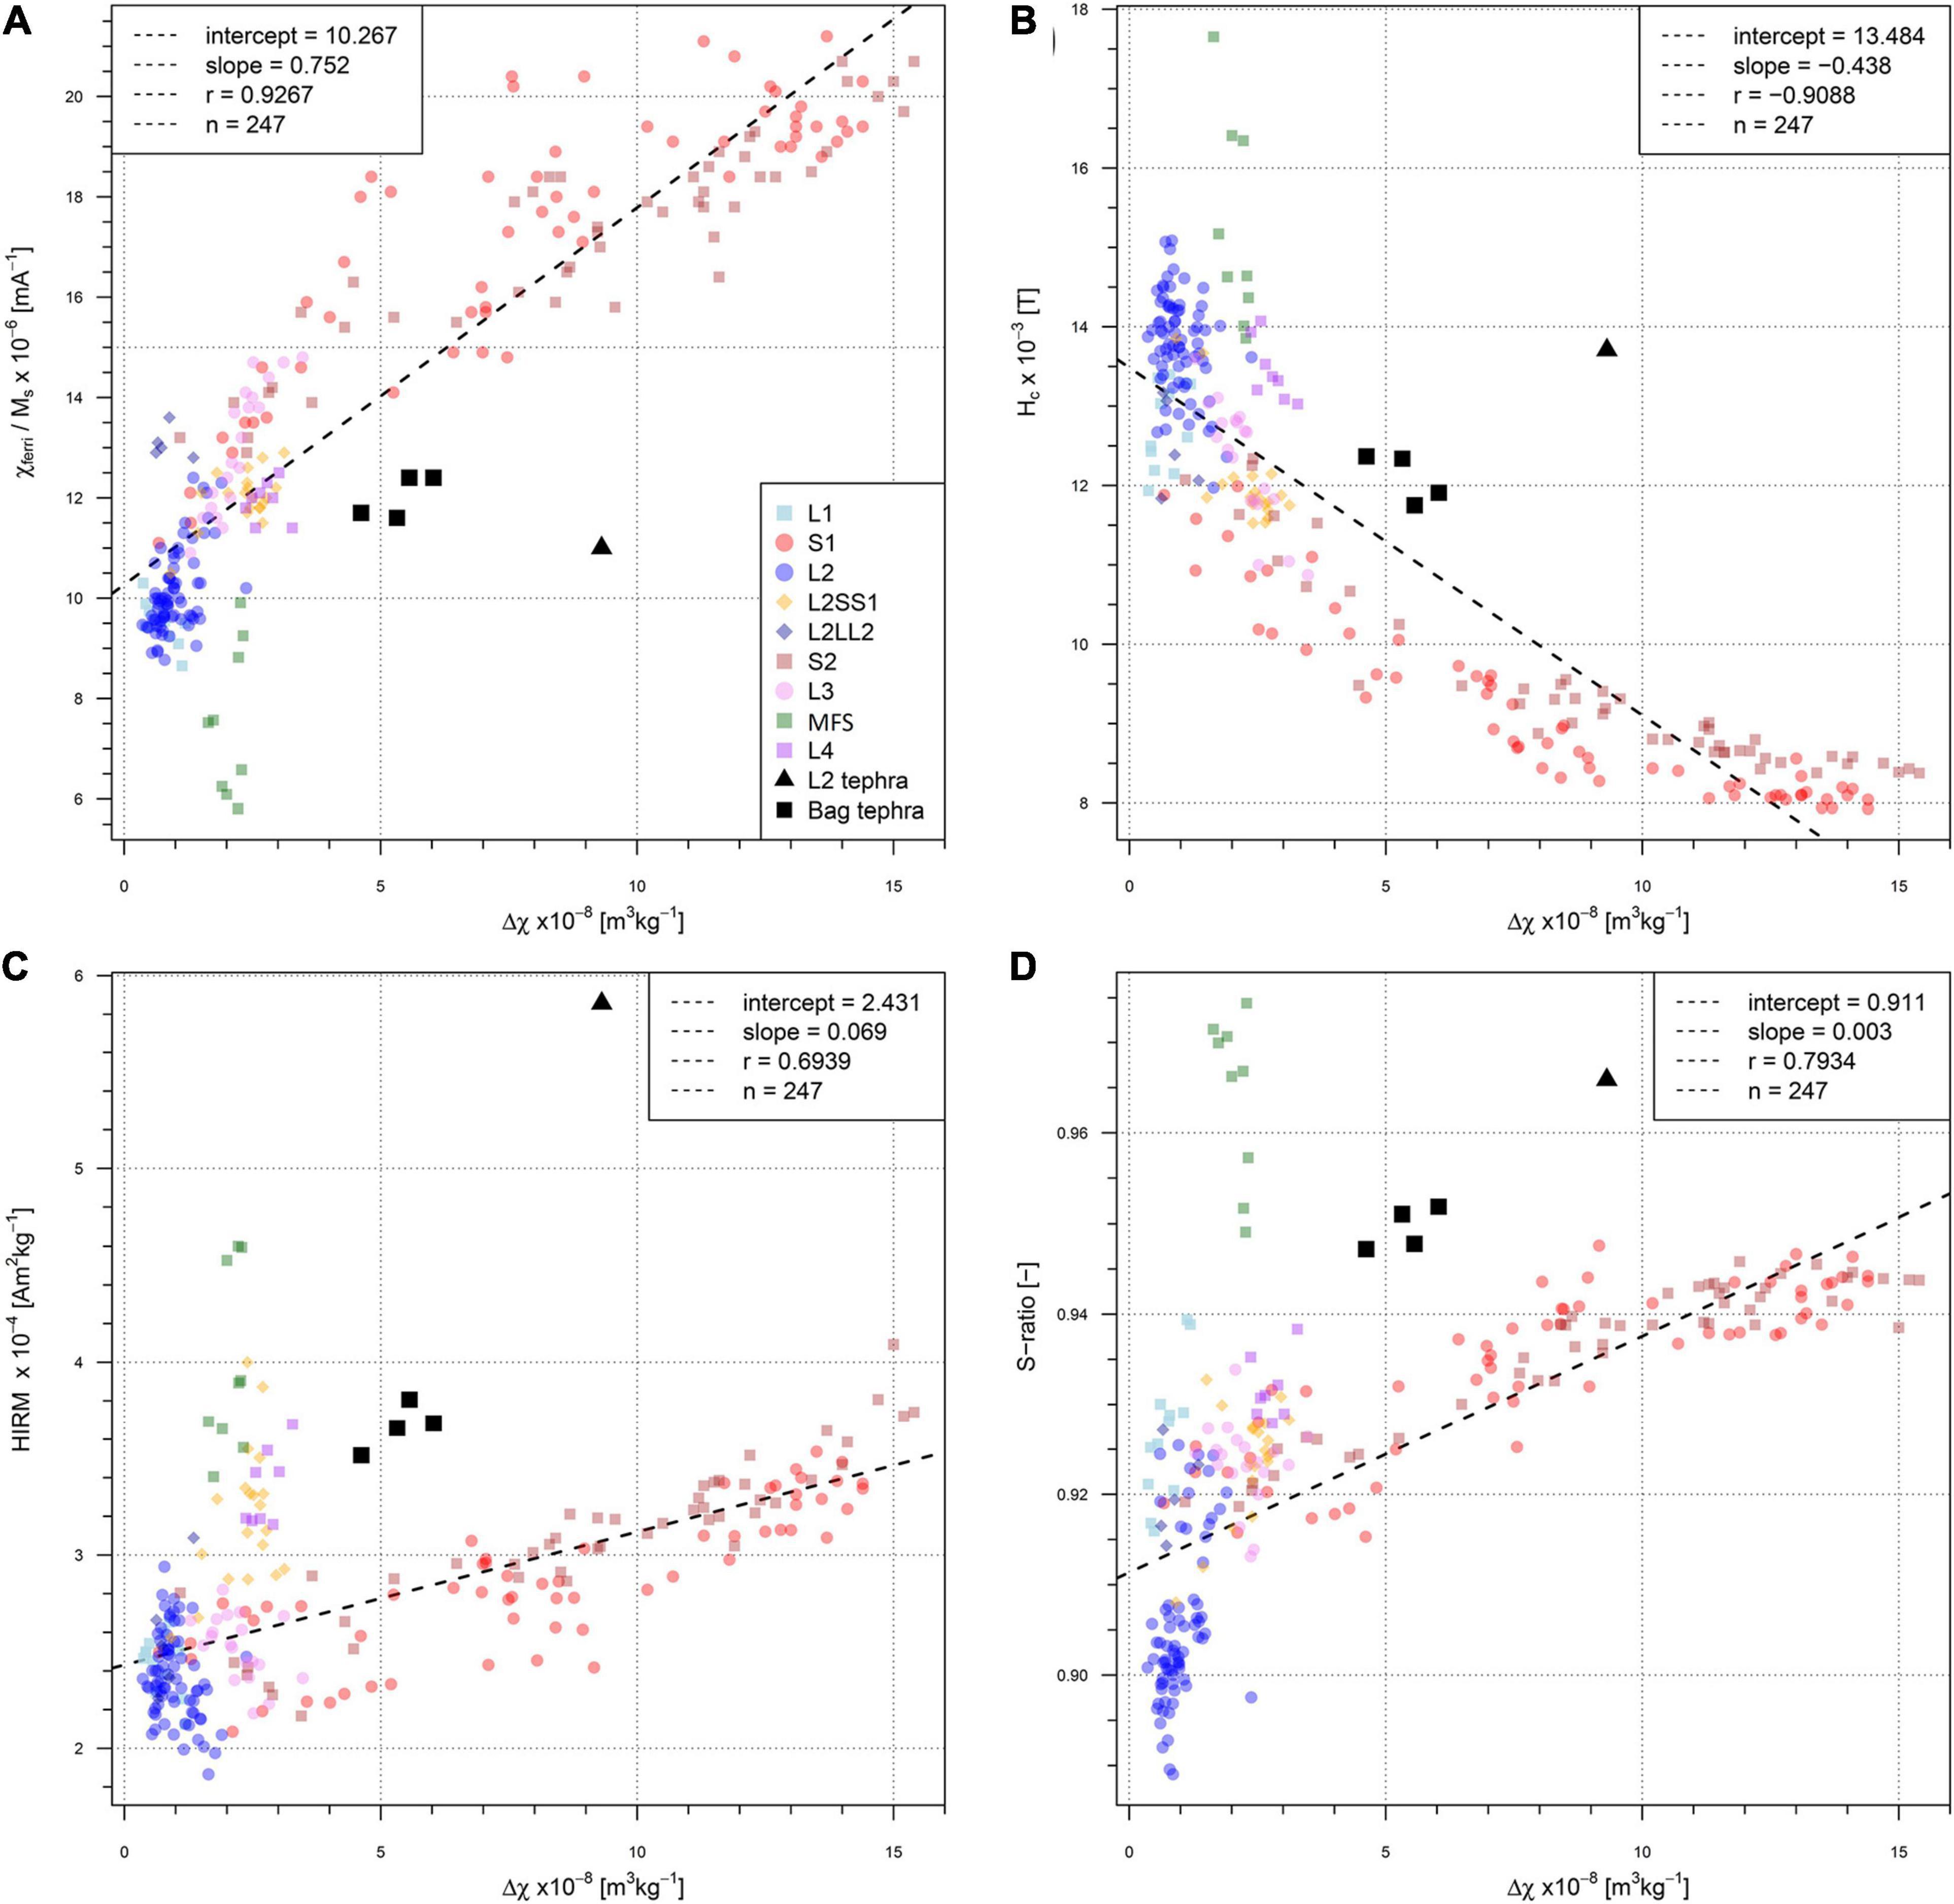
Figure 4. Correlation of different magnetic parameters [χferri/Ms, (A); Hc, (B); HIRM, (C); and S-ratio, (D)] and inter-parametric ratios compared to Δχ for the units and samples summarized in Table 3. For correlation coefficients and regression fits, samples from the MFS, and the tephra layers were excluded.
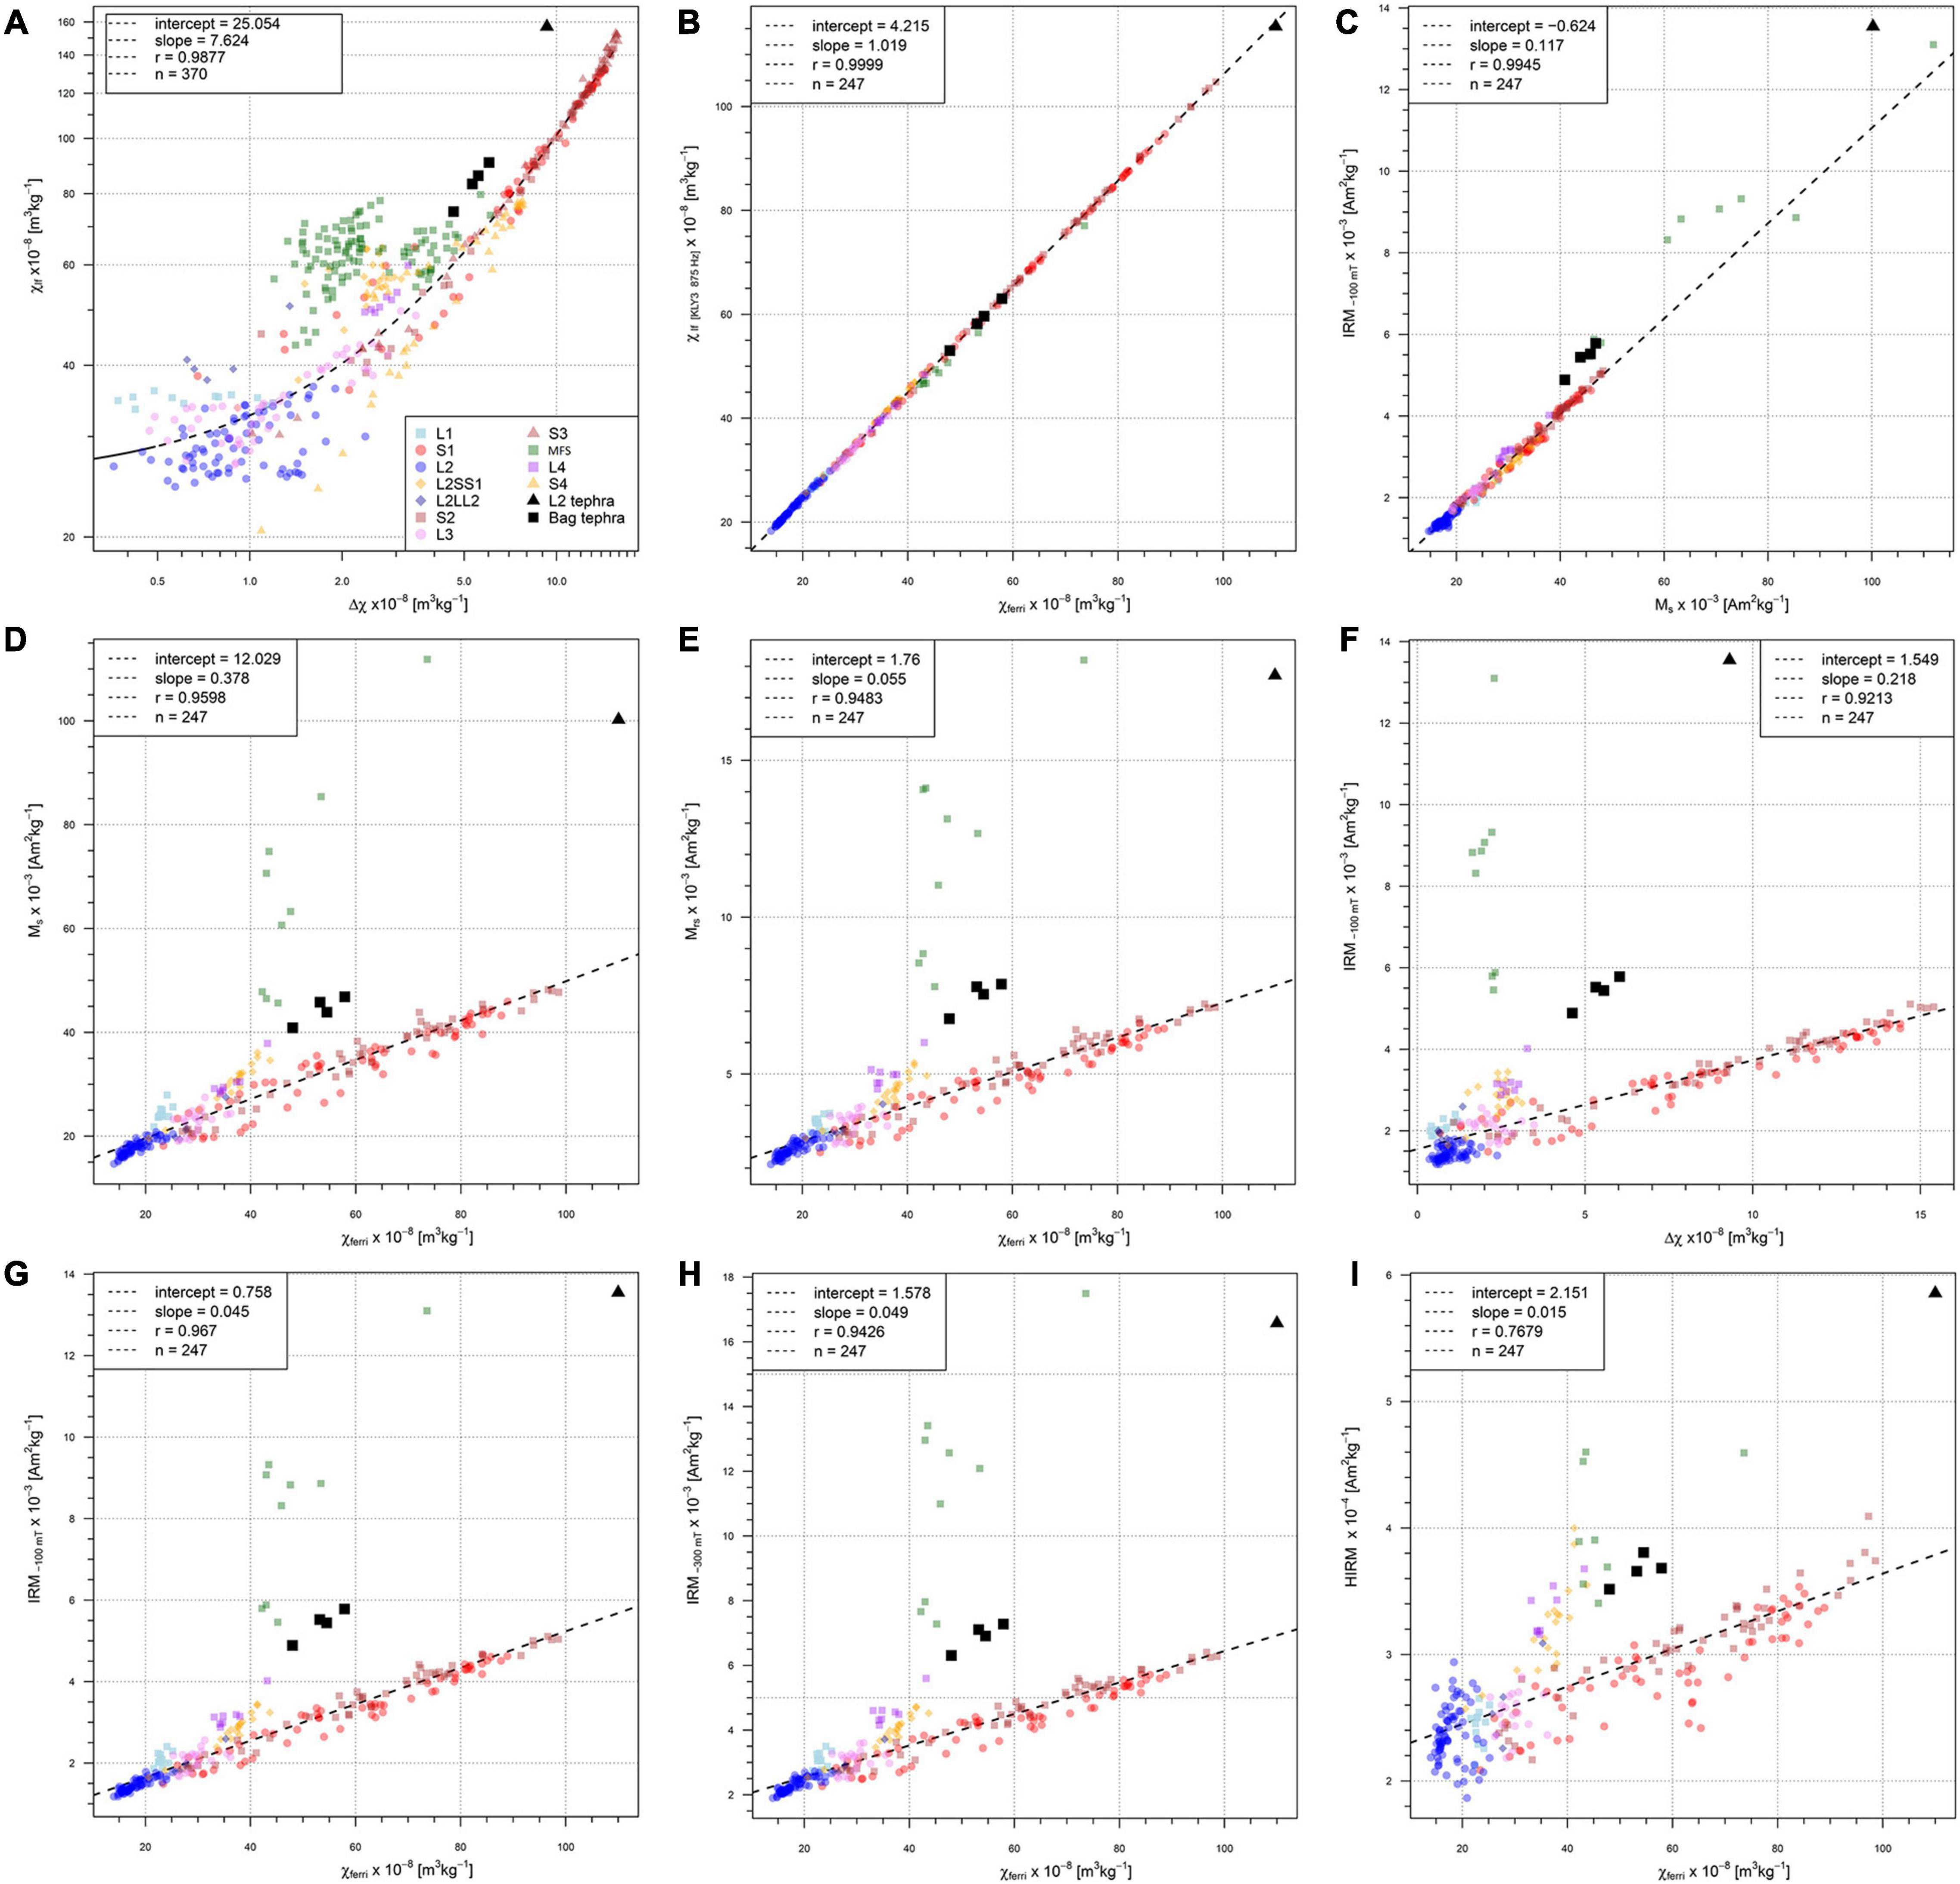
Figure 5. Scatterplots of environmental magnetic data. Low frequency susceptibility (χlf) plotted against Δχ in (A) shows the characteristics of magnetic enhancement for the Zemun LPS. Samples stemming from the MFS (marshy floodplain sediments) and the tephra layers are excluded for calculated regression fit and correlation coefficient, resulting in 370 samples out of a total of 479 for (A) and 247 samples out of a total of 262 for (B–I).
The commonly used magnetic proxy for pedogenic intensity is Δχ, which increases with increasing degree of pedogenesis is compared to χferri/Ms, Hc, HIRM and S-ratio in Figure 4A through D, respectively. The χferri/Ms ratio, like Δχ, track relative changes in SP particle concentration, assuming the mineral assemblage contributing is monomineralic or that proportions between mineral components are constant. The data acquired clearly shows that the magnetic mineral assemblage is not monomineralic but that the soft ferrimagnetic component dominates both Ms (Figure 5C) and χferri (Figure 5G). The magnetic mineral assemblage of the MFS and tephra samples do differ in terms of composition, concentration and magnetic grain size with respect to the loess and paleosol units, thus falling off the main trend line correlating (r = 0.9) χferri/Ms and Δχ. At higher pedogenic intensities, χferri/Ms increases less rapidly than Δχ suggesting an increased contribution to Ms of a mineral, likely hematite, with a lower saturation magnetization than magnetite and maghemite. Figure 5I shows HIRM increasing as Δχ increases in paleosols corroborating the previous observation. In Figure 4B, Δχ and Hc are displayed, showing for all samples (tephra layers excluded) a negative exponential behavior. Loess and MFS samples reflect the highest coercivities with low amounts of pedogenetically formed SP particles. The tephra samples reflect a diametral behavior, indicating the presence of SP particles but at similar SP concentrations the tephra samples have a higher bulk coercivity due to either a higher proportion of SD and PSD grains and/or of high coercivity minerals. Figure 4C confirms the latter and results presented in section “FORC Analysis” supports the former. HIRM and Δχ correlate positively with a weaker coefficient (r = 0.69) than for soft remanence-bearing ferrimagnetic (IRM–100 mT) component (Figure 5F, r = 0.92), indicating that high-coercivity minerals present are also in paleosols and their concentration increases with increasing pedogenic intensity (Figure 4C). Interestingly, samples from the MFS, L2SS1 and samples stemming from the L4 loess unit also define a linear trend but with a much higher slope where increases in HIRM are associated with only small increases of Δχ. Figure 4D correlates Δχ and the S-ratio. S-ratio values equal to 1 indicate the presence of only soft magnetic minerals like maghemite and magnetite, whereas reduced values underline the presence of high-coercivity minerals like hematite and goethite. The relative proportion of hard-magnetic minerals contributing to the IRM1.5T is greater in Zemun loess, especially L2, than in paleosols units. The highest S-ratio values are observed for samples stemming from the MFS and the tephra samples. Excluding MFS and tephra samples, the S-ratio correlates positively with Δχ with r = 0.79 (Figure 4D) indicating that the relative proportion of soft-magnetic minerals contributing to IRM1.5T increases with increasing degree of pedogenesis. At the same time, absolute concentrations of both soft remanence-bearing (Figure 5F) and hard (Figure 4C) magnetic mineral components increase individually with increasing pedogenesis.
Finally, hysteresis data presented on a modified Day-Dunlop plot (Supplementary Figure 3) reveals that all loess and paleosol samples fall within the PSD range as mean domain size, but samples stemming from the MFS as well as the tephra samples indicate a higher amount of SD particles.
FORC Analysis
FORC diagrams and extracted horizontal profiles (Hu = 0) of the six samples are shown in Figure 6. The three samples from the 5.55 to 6.25 m interval (ZV112, ZV117, ZV126) and the 21.65–22.45 m interval (ZE047, ZP1001, ZP1016) are presented separately because there main sediment compositions differ.
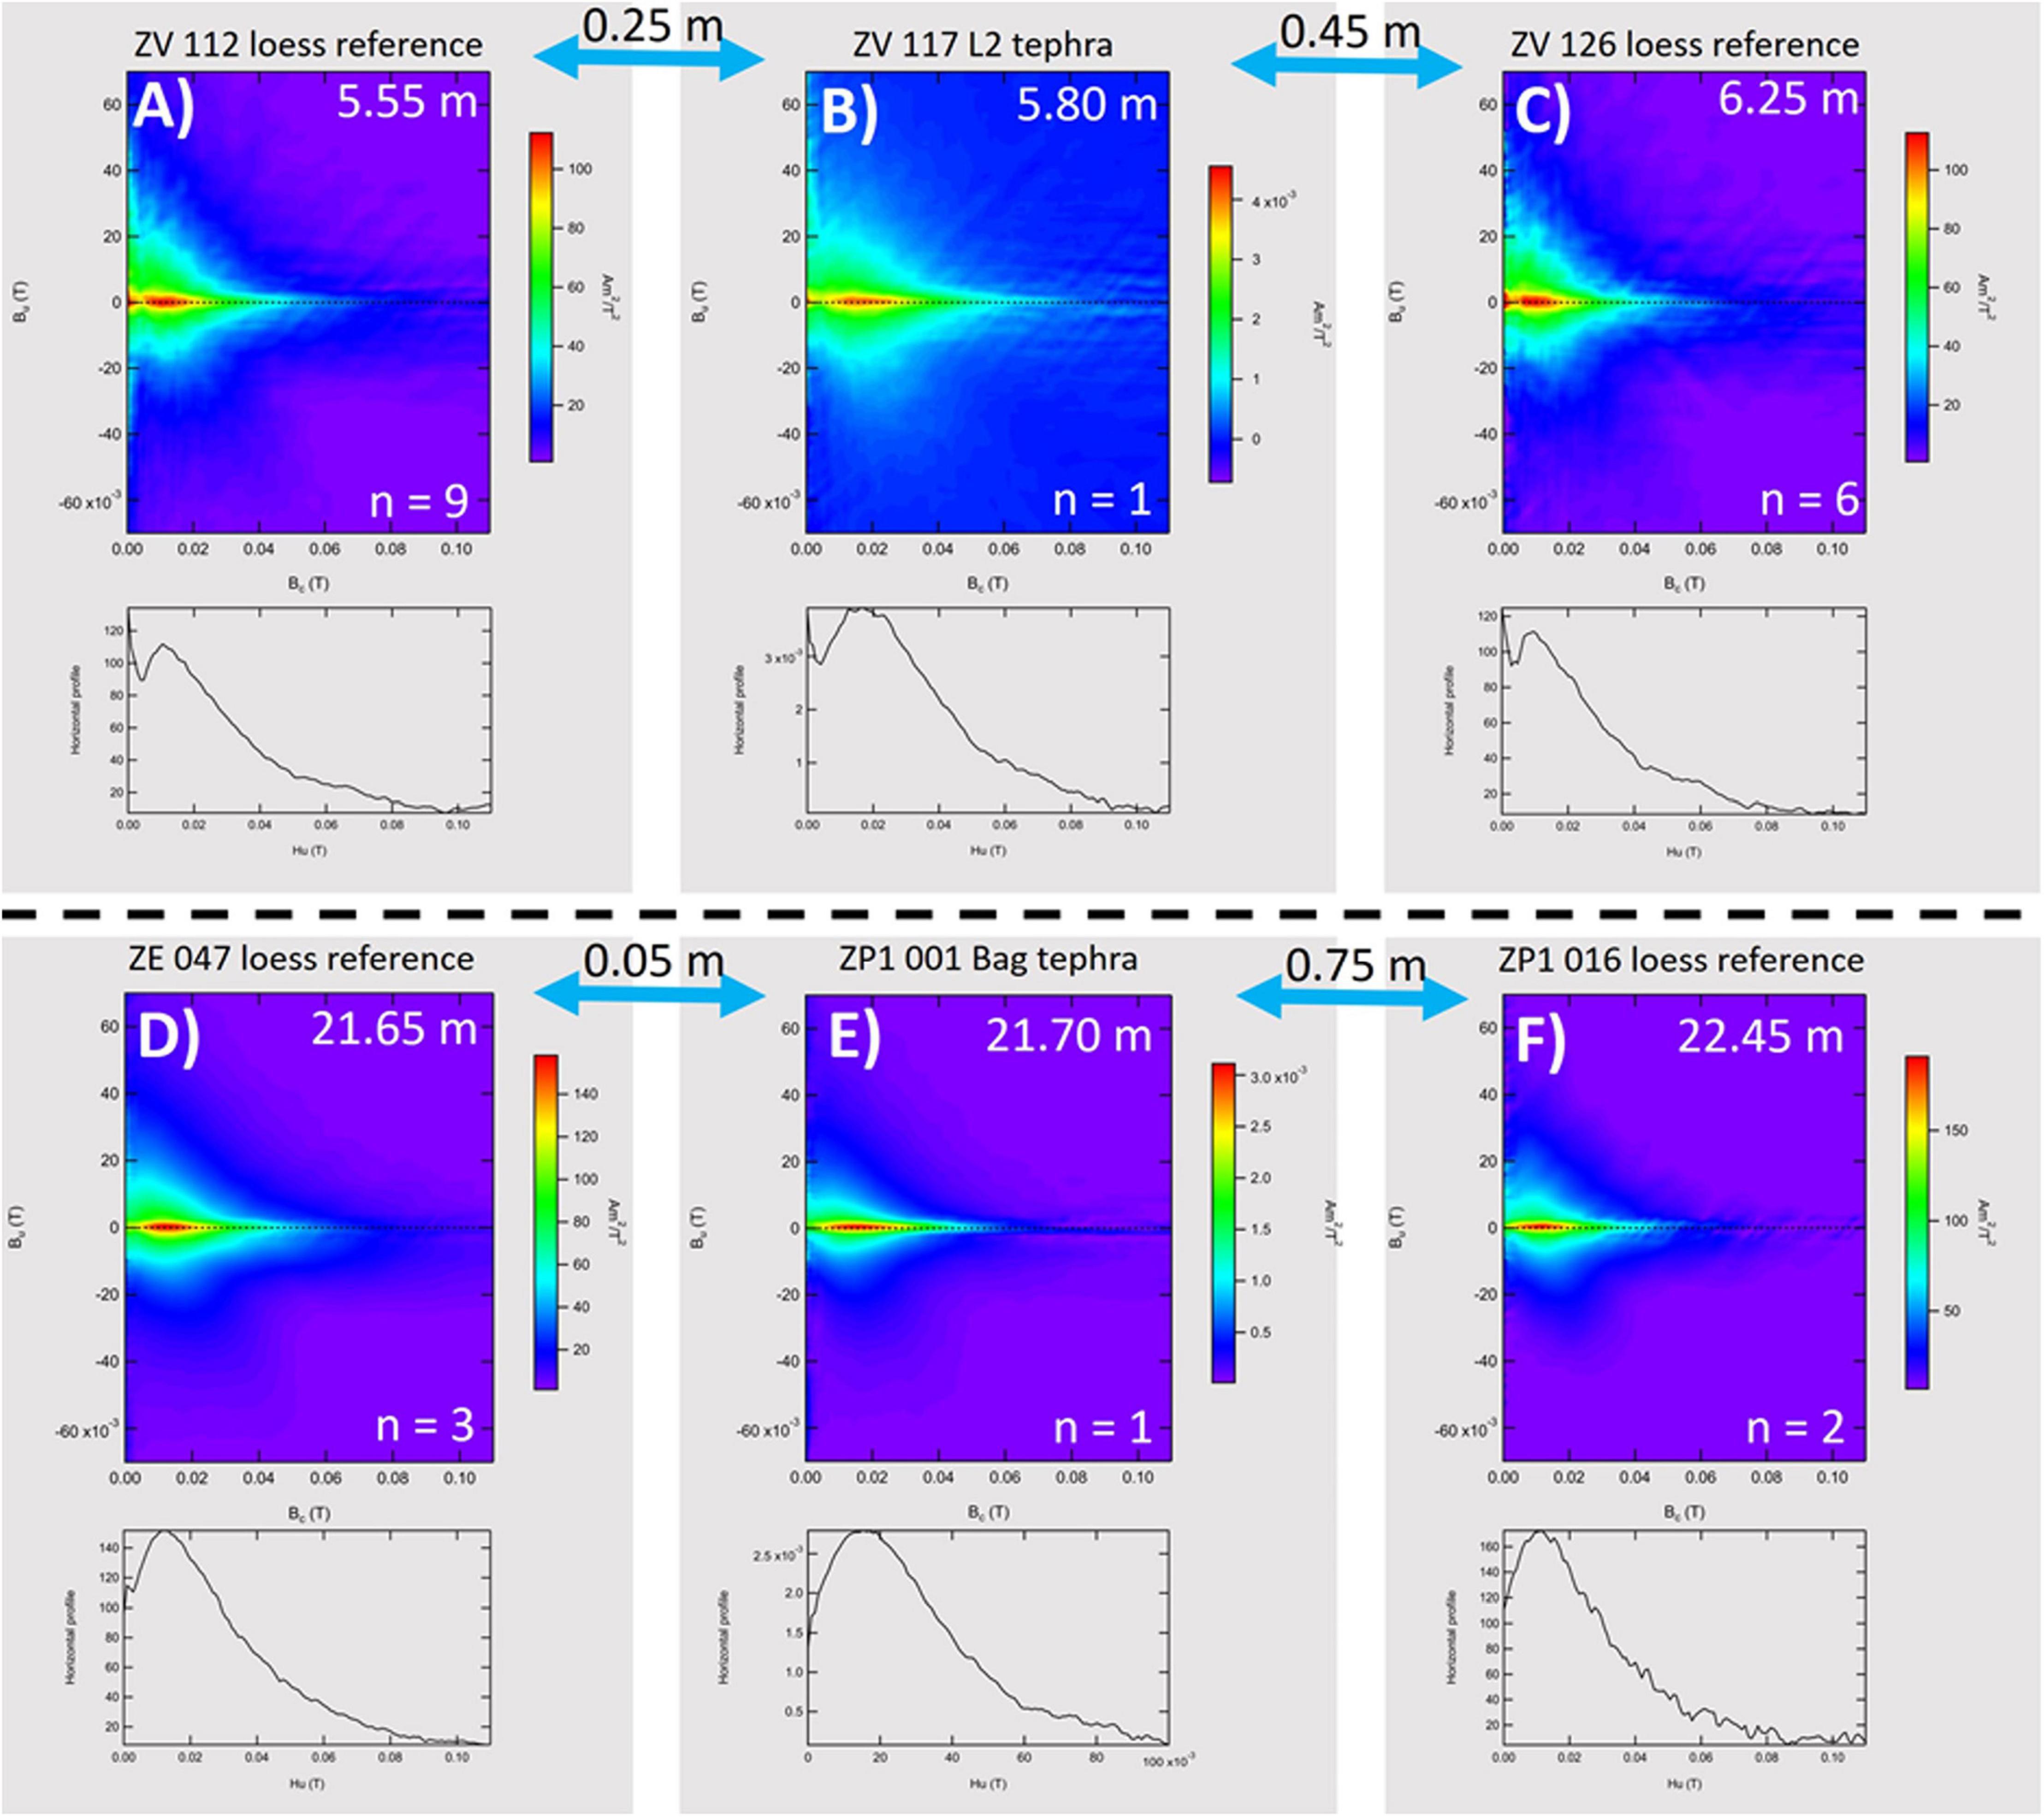
Figure 6. FORC plots and related central ridge profiles of the tephra samples [ZV117, (B) for L2 tephra and ZP1001 for the Bag tephra, (E)] and neighboring reference loess samples [(A,C) for the bracketing loess samples of the L2 tephra and (D,F) for bracketing loess samples of the Bag tephra]. Blue arrows between the plots indicate the stratigraphical distance between the samples.
FORC diagrams and central ridge profiles of the bracketing loess for each subset interval, are very similar (Figures 6A,C,D,F). Samples ZV112 and ZV126 display a FORC diagram globally expected for PSD assemblages, in accordance with hysteresis parameters (Hcr/Hc = 3.18 and 3.29, Mrs/Ms = 0.14 and 0.13). The horizontal profiles are characterized by one main coercivity peak around 10 mT, and a second peak close to Hc = 0, along with a broad distribution up to about 80–100 mT. The PSD character of the FORC diagrams of samples ZE047 and ZP1016 is less pronounced and also reflected by the main hysteresis parameters (Hcr/Hc = 2.62 and 2.72, Mrs/Ms = 0.17 and 0.17). For these samples, the horizontal profiles are also characterized by a peak around 10 mT, but lack the very low-coercivity peak, probably due to a lesser content in grains either close to the superparamagnetic threshold or in the multidomain range. Sample ZV117 (Hcr/Hc = 2.46, Mrs/Ms = 0.17) displays a FORC diagram with a main distribution more elongated along the central ridge axis and shifted to higher Hc values, making the diagram appear more SD-like than those of the bracketing loess samples (Figure 6B). A similar observation can be made from sample ZP1001 (Hcr/Hc = 2.66, Mrs/Ms = 0.16), although it is not as prominent as for sample ZV117 (compare Figures 6E,B). This is also seen in the horizontal profiles, where the main distribution peak are broadened and shifted to slightly higher values by 5–10 mT. This indicates the input of additional and non-loessic material.
High Resolution IRM Acquisition
Detailed IRM acquisitions can provide alternative insights on the coercivity distributions because focusing on remanent magnetizations instead of direct in-field measurements, which is the case for FORCs.
These are therefore differently affected by magnetic particle sizes (for instance, superparamagnetic particles do not carry a remanent magnetization). IRM acquisition curves were obtained for the same six samples that underwent FORC as shown in Figures 7A,F. All six samples fail to saturated by 1.5T, indicating the presence of high-coercivity minerals. Raw coercivity distributions of samples ZV112 and ZV126 (Figure 7G) are nearly identical, as expected from both hysteresis parameters and FORC diagrams. Samples ZE047 and ZP1016 are also very similar (Figure 7G). The coercivity distribution of all four bracketing loess samples is characterized by two main peaks at about 20–30 mT (1.3–1.5 in log scale) and 60–100 mT (1.8–2.0 in log scale) (Figures 7C,E,H,J). The distribution of sample ZV117 (Figure 7D) differs significantly from that of samples ZV112 and ZV126 and is dominated by a peak around 45 mT (1.65 in log scale). For sample ZP1001, the distinction with its bracketing loess samples is less marked (Figure 7I), similar to observations made from FORC measurements. However, a small additional peak around 35 mT (1.55 in log scale) can be observed. These observations were used as first inputs for the MAX Unmix program. To these, we added a small amount of high-coercivity component to account for the unsaturated IRM. Results of the unmixing are depicted in Figures 7C–E,H–J. Taken separately, each sub-set of loess samples (ZV112 and ZV126; ZE047 and ZP1016) are characterized by similar distribution components. The IRM acquisitions of samples ZV117 and ZP1001 are compatible with models involving the same distribution components as those of the surrounding loess samples, with the addition of the fourth component. As in the case of the FORC measurements, this is more evident for sample ZV117.
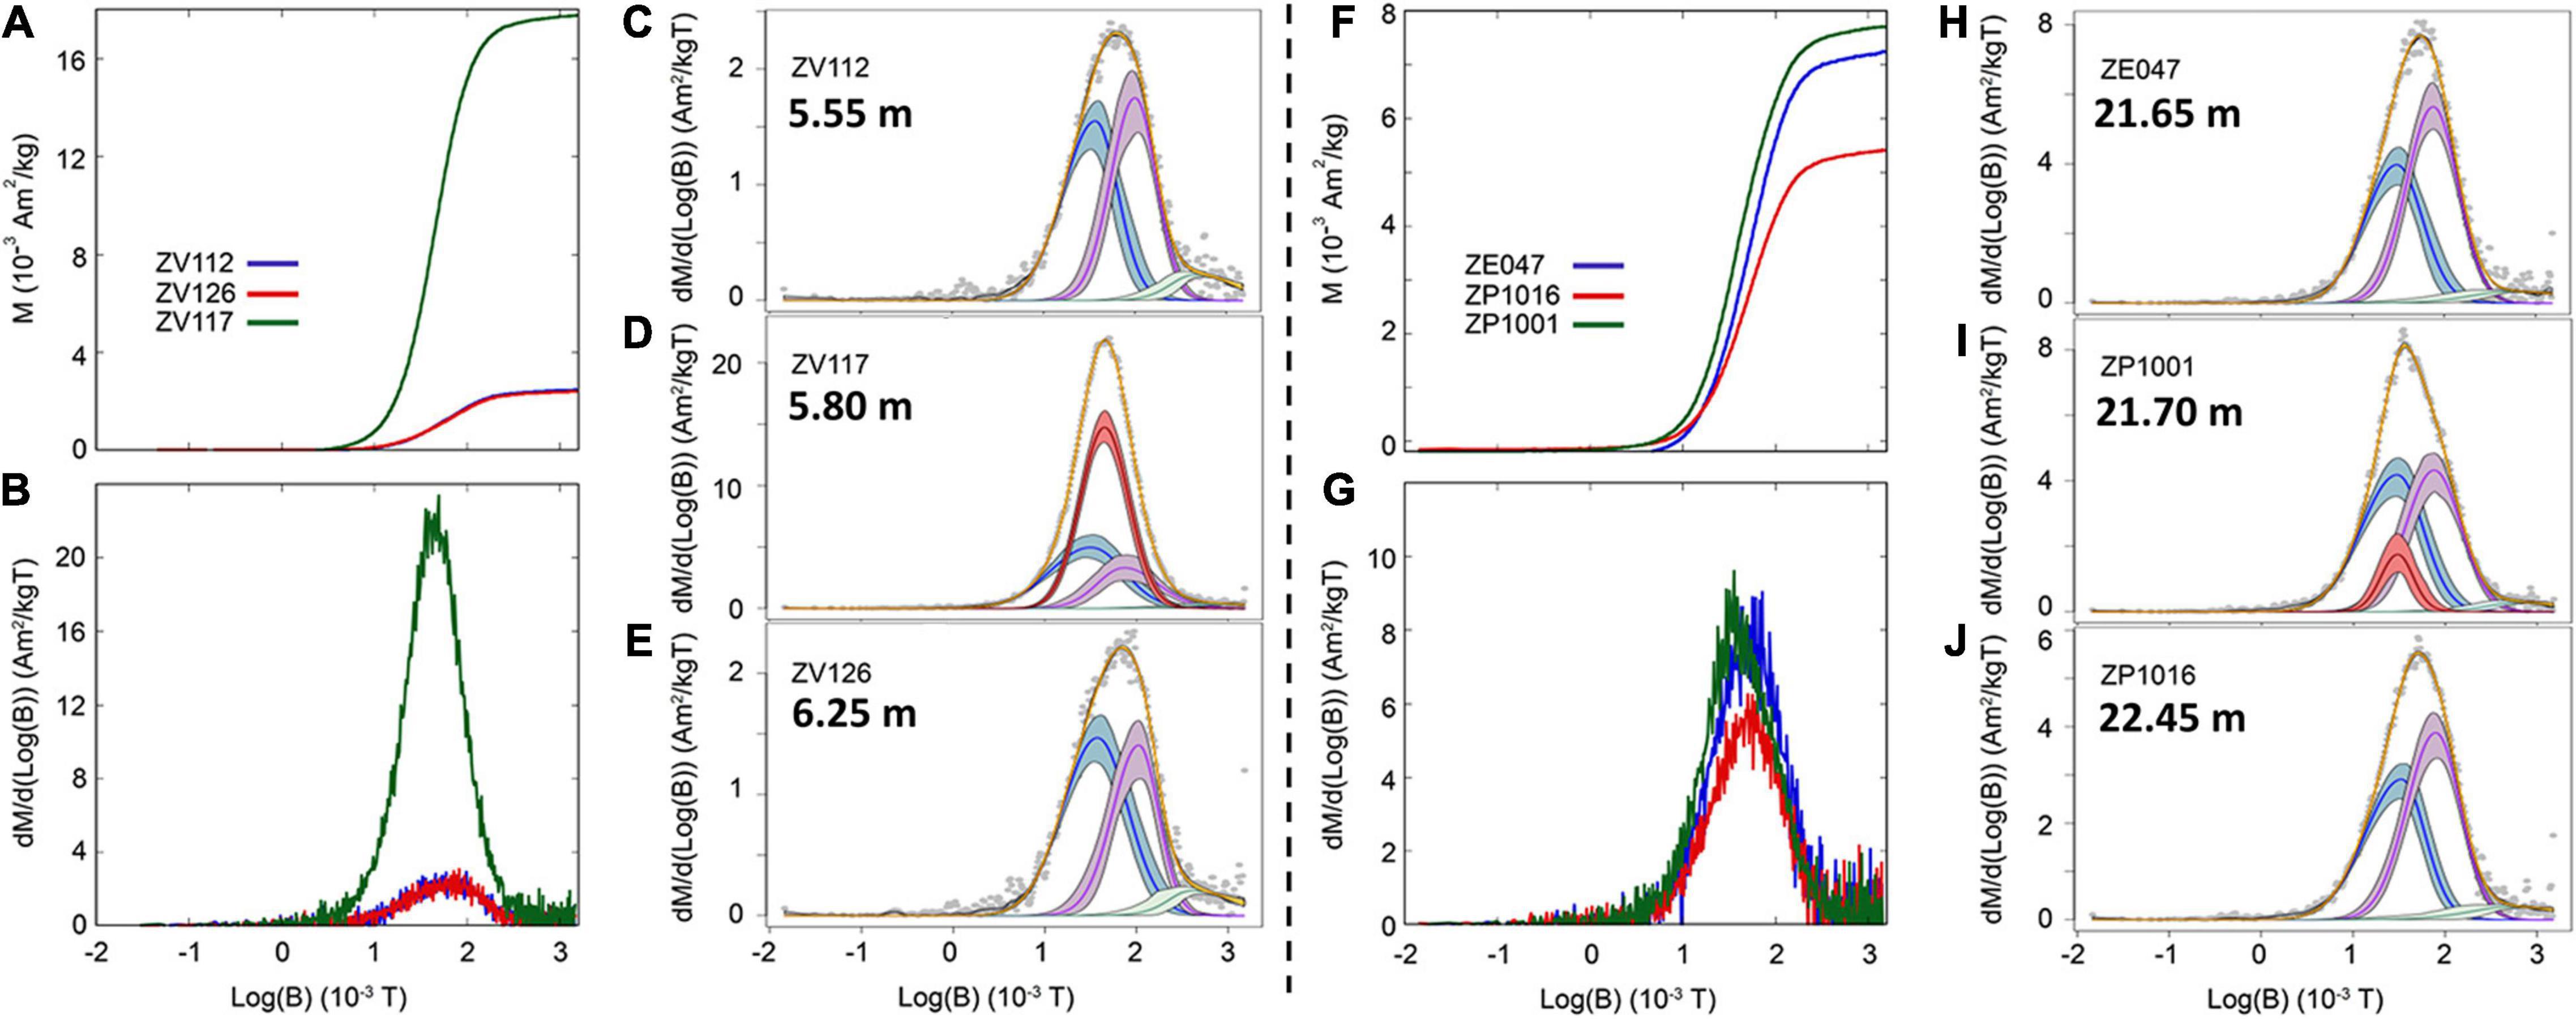
Figure 7. IRM acquisition coercivity distribution and unmixing of coercivity spectra. Values are given in log scale. (A,F) compare IRM acquisition curves for samples measured for FORCs. (B,G) are comparisons of the first derivatives of the IRM acquisitions. (C–E) and (H–J) display the different results of the unmixing.
Colorimetric/DRS Analysis
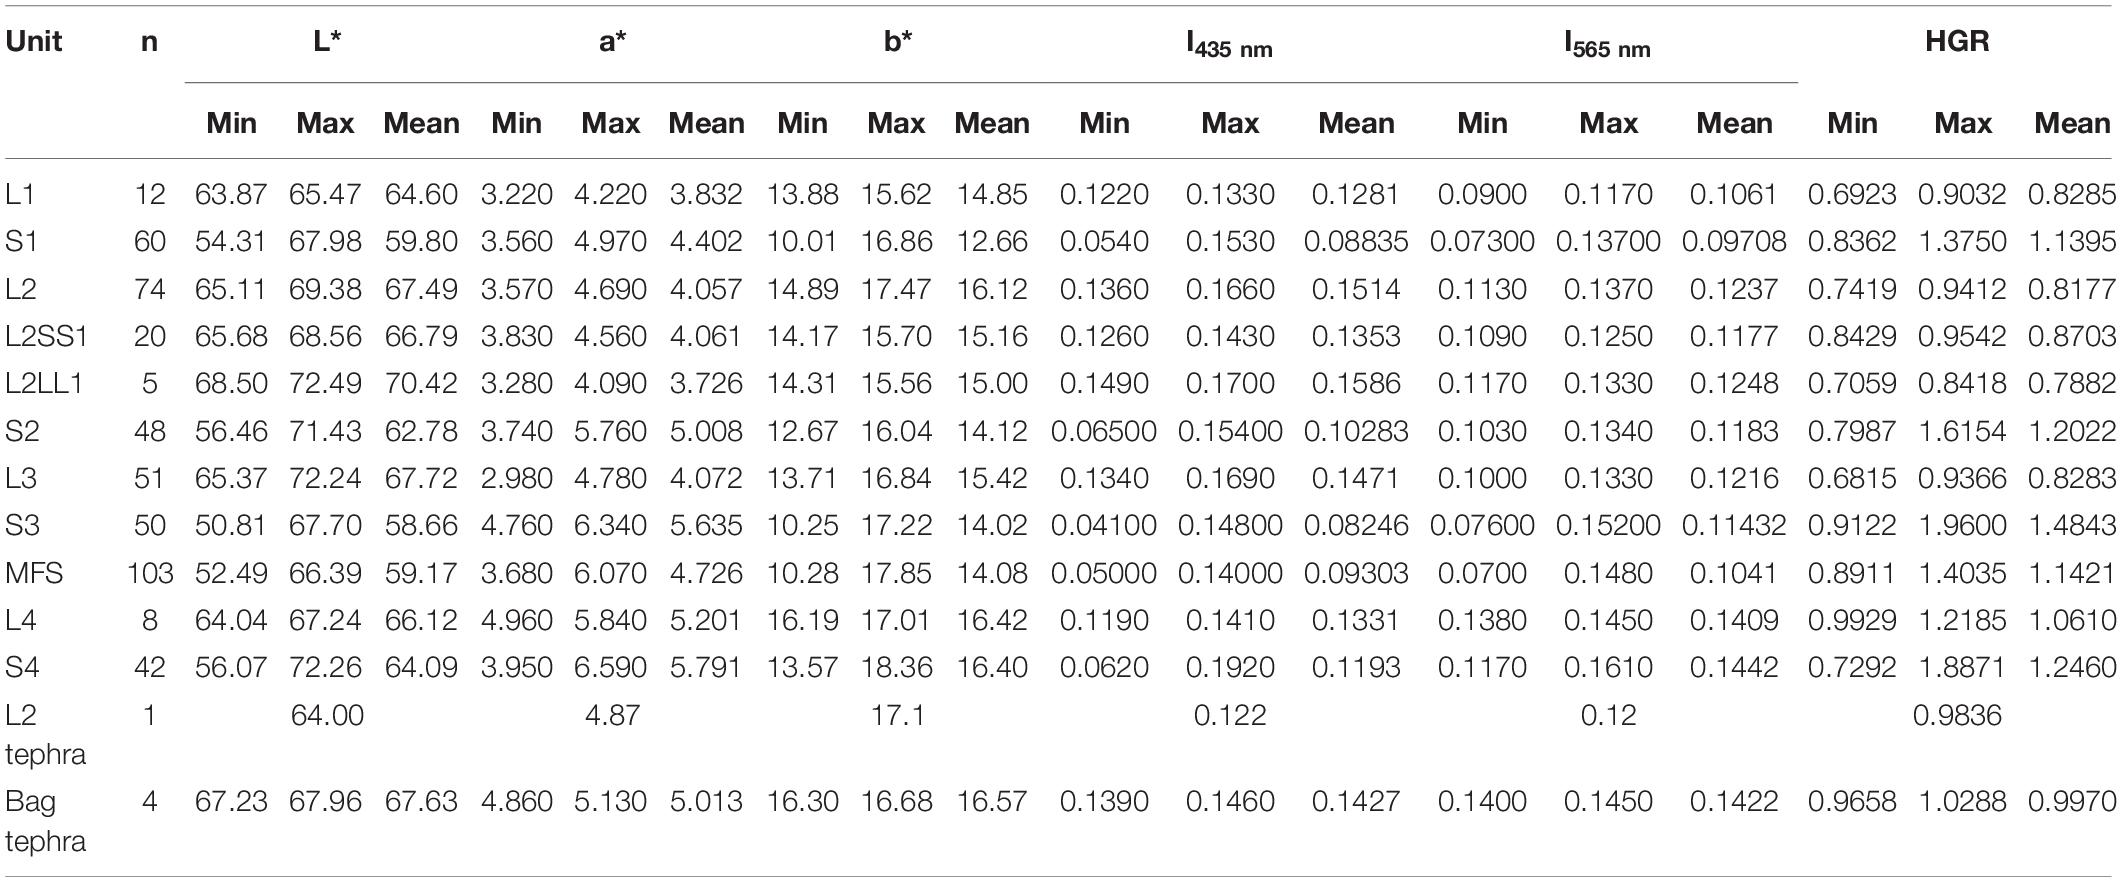
L∗ values are generally higher in light loess units meaning brighter colors due to higher amounts of quartz and carbonates than in paleosols, where clays and organic matter decrease the luminance (Figure 3 and Table 4). The highest L∗ value (72.5) is found in the L2SS1 and the lowest L∗ value (50.8) in the S3 pedocomplex. Luminance values follow stratigraphic units from the S3 pedocomplex to the L1 loess at the top of the profile. Below S3, the correlation of L∗ with the stratigraphy is more complex. The pedocomplex S4 is weakly expressed in the Zemun LPS characterized by a broad range of L∗ values. S4 can be considered as brighter than the other pedocomplexes with brightest values in the lower part at the base of the profile, possibly as a result of carbonate precipitation.
Similar to luminance (L∗) values, redness values (a∗) also reflect alternations between loess and paleosols (Figure 3). However, a clear separation between loess and paleosols is not as obvious for all paleosols from a∗ data. In the L1 loess unit, a∗ values vary between 3.2 and 4.2. Compared to the mean a∗ from the S1 pedocomplex, redness is reduced in L1 (3.8, in S1 4.4). The mean a∗ of L3 is similar to L2 (4.2) and relatively low with respect to S1. Higher a∗ values are reached in the S3 pedocomplex (mean = 5.7), but the highest a∗ values are reached in the S4 pedocomplex with a mean of 5.8 and a maximum of 6.6. Over the entire profile, a decreasing trend from S4 to S1 samples can be observed with even lower a∗ values for the weakly developed interstadial L2SS1 paleosol. Blueness (b∗) values, which are inverse to yellow, are generally low in paleosols and high in loess units. The lowest b∗ values are found in the pedocomplex S1 and the highest b∗ values in the S4 pedocomplex. However, the pedocomplex S2 (compared to the other pedocomplexes) does not show these well-expressed low values of b∗. In summary, a∗, a commonly used pedogenic indicator suggest the highest intensity of pedogenesis is found in S4 which contradicts interpretations based on magnetic proxies and field observations.
DRS derived goethite- and hematite concentrations (1st derivatives of intensities at 435 and 565 nm; I435 and I565) and the ratio of hematite to goethite (HGR) mainly follow glacial/interglacial cyclicity. Both I435 nm and I565 nm values are reduced in paleosol complexes and are high in loess units with the exception of S4, which has values characteristic of the loess units (Table 4). HGR values are maximum in paleosols and like magnetic susceptibility parameters decrease from S3 to S1. Luminance (L∗) and redness (a∗) correlate with r ∼−0.3, while L∗ and blueness (b∗) correlate positively with r∼0.78. HGR correlates with L∗ with r∼–0.82, with a∗ r∼0.76, and b∗ with r∼–0.5.
Additionally, selected colorimetric parameters are tested against magnetic indicators of relative concentration of SP-particles (Δχ and χferri/Ms) and of high-coercive minerals (Hcr and S-ratio) (Figure 8). In Figures 8A–C test the correlation of Δχ vs. I435, I565 and HGR. I435 correlates strongly negative with Δχ (r = −0.92), indicating a higher amount of goethite in loess units than paleosol units. A weaker but still present negative correlation to I565 (r = −0.54) indicates a higher amount of hematite in loess units as well. A strong and positive correlation of Δχ with HGR (r = 0.87) reflects a relatively higher amount of hematite than goethite in paleosol samples. This is supported by correlations based on magnetic indicators for hard magnetic minerals like hematite and goethite (high Hcr and low S-ratio values) for loess samples reflecting positive correlations for hematite and goethite and a negative correlation with HGR. This underlines the presence of hematite and goethite in loess samples and a relatively higher presence of hematite compared to goethite in paleosol samples. Overall, the variation of HGR and I565 is high in paleosols and low in loess units. I435 varies distinctively less in loess and paleosol samples. The luminance L∗ reflects toward younger samples a continuous evolution of brighter paleosols, where the S3 is the darkest (Figure 3). a∗ decreases as well, even more than L∗, for all paleosols from S4 to S1 (Figure 3). With respect to the hematite/goethite ratio (HGR), the decreasing trend is most obvious. While there is a general increase of the colorimetric properties with increasing Δχ, these are clearly non-linear.
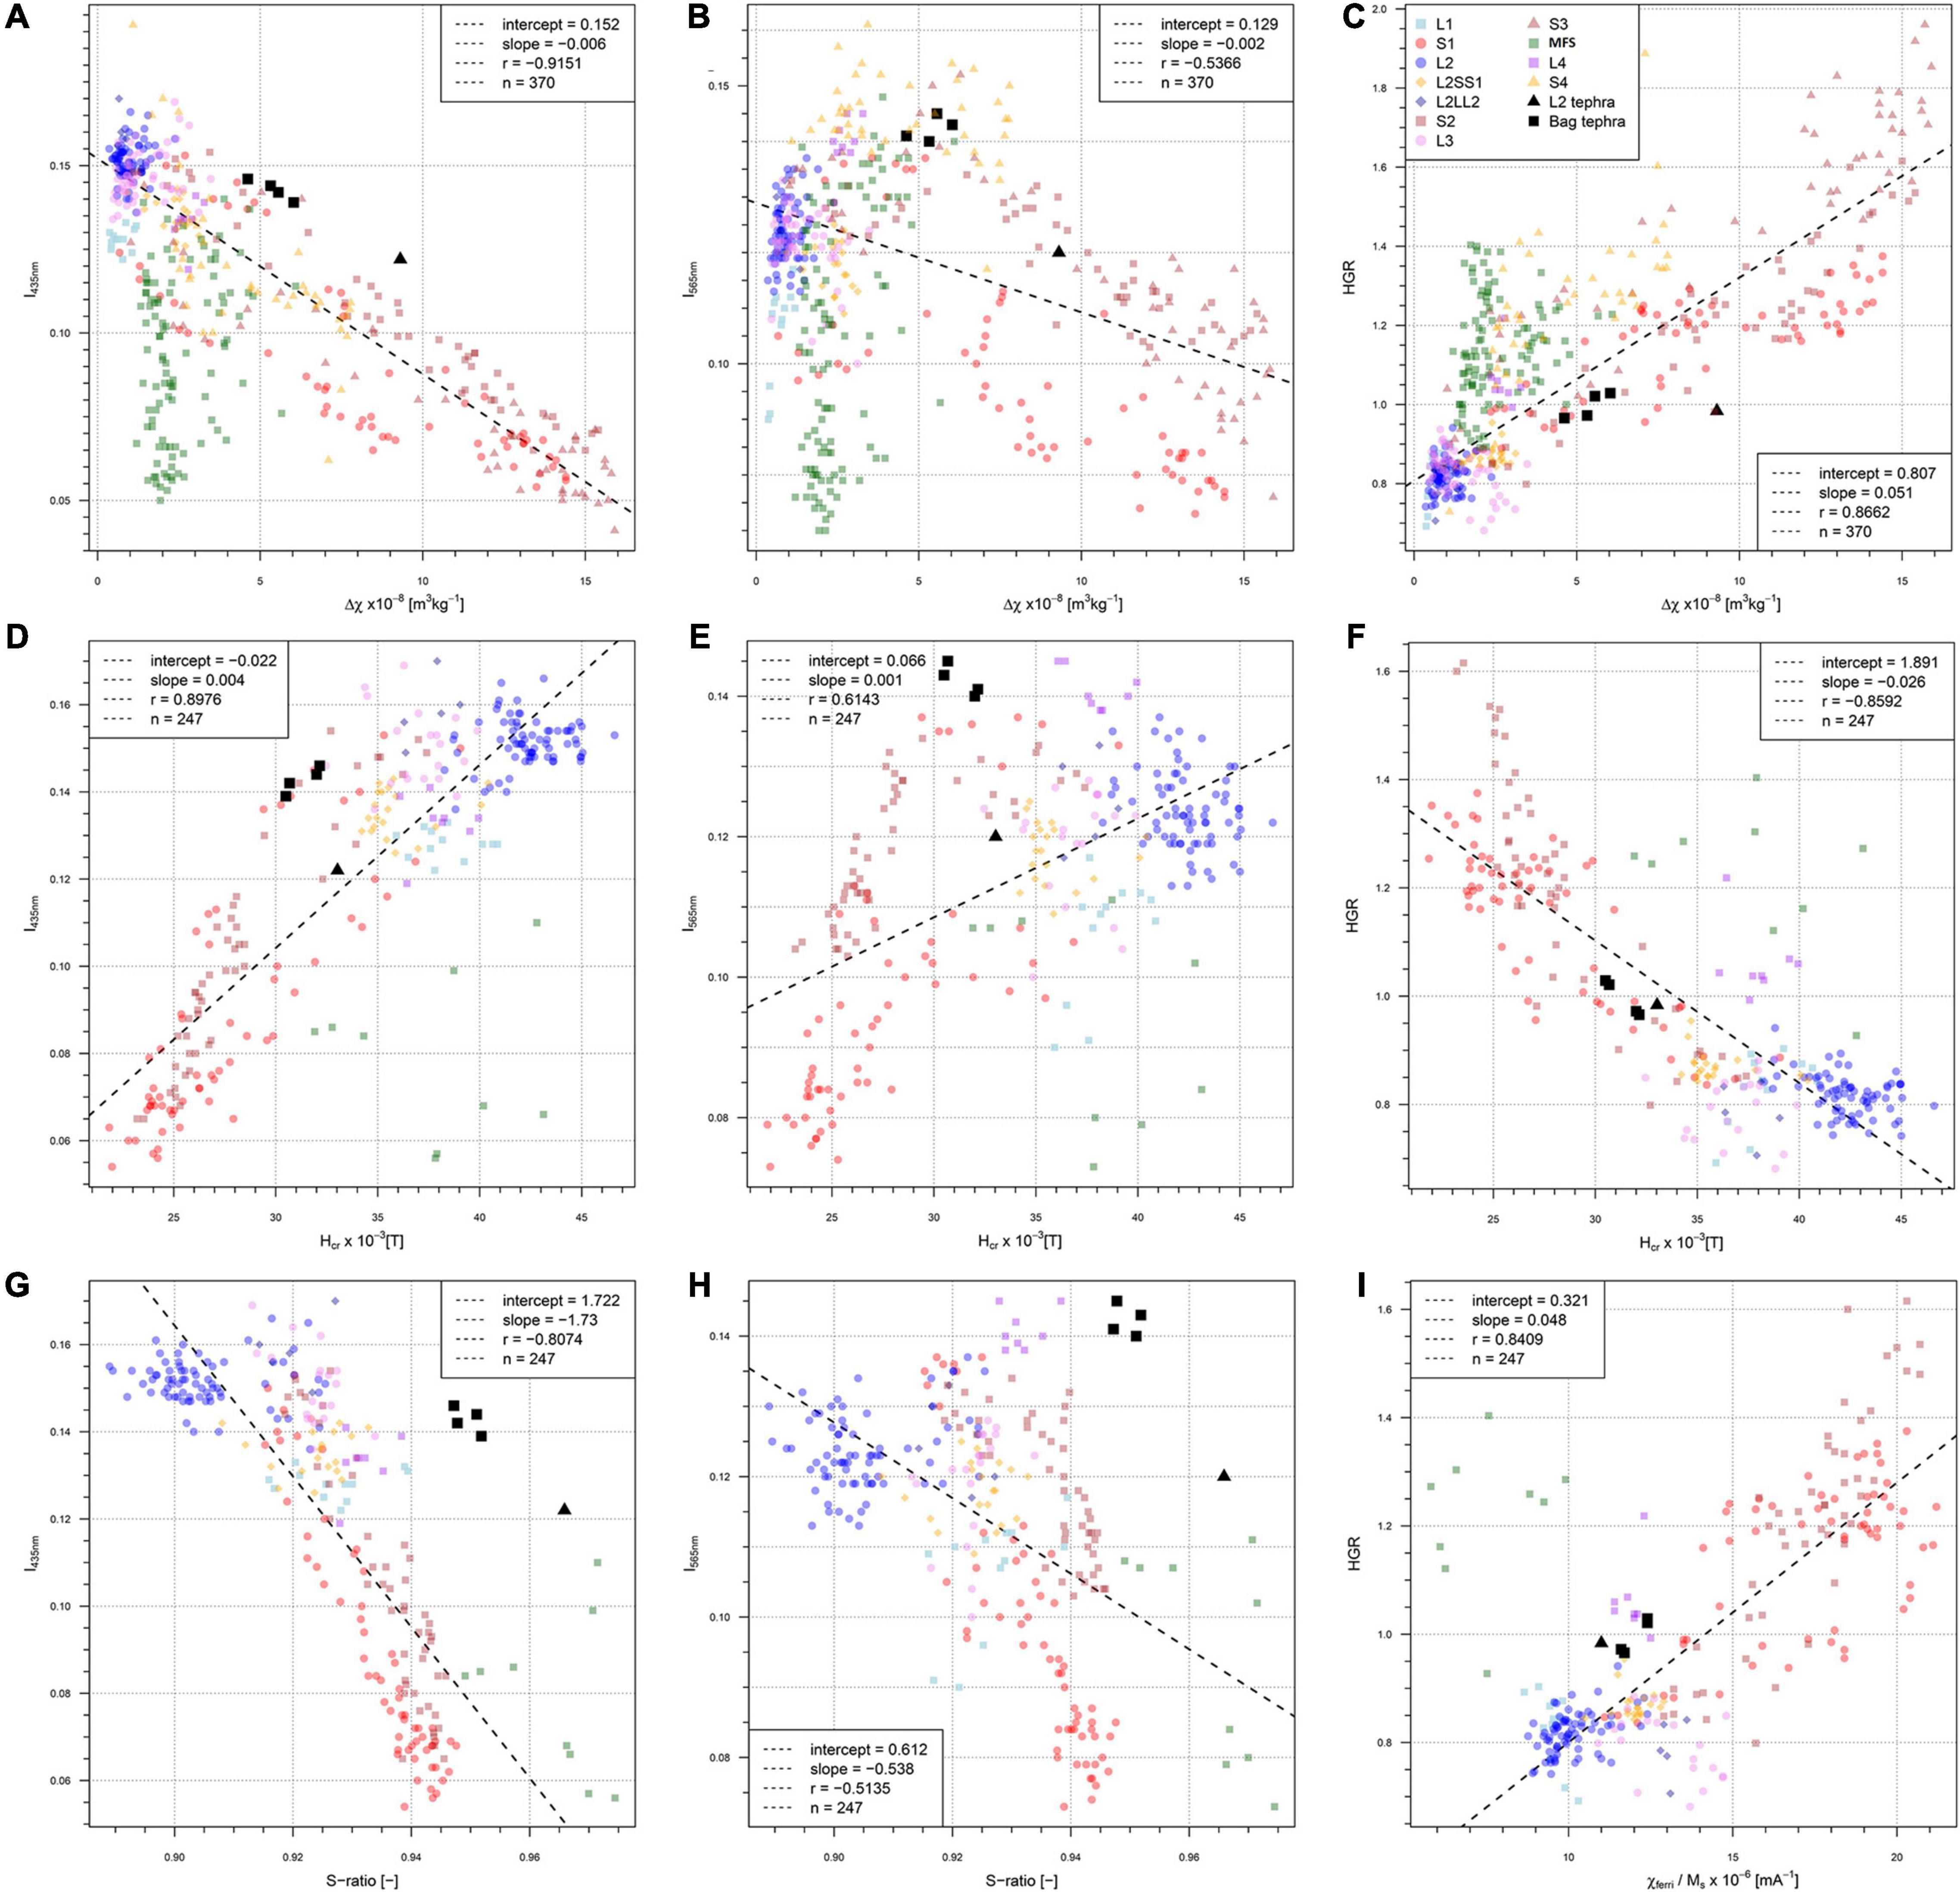
Figure 8. Scatterplots of integrated magnetic and colorimetric data from the Zemun LPS. Note, that samples stemming from the MFS (marshy floodplain sediments) and the tephra layers are excluded for calculated regression fit and correlation coefficient, resulting in 370 samples out of a total of 479 for (A–C) and 247 samples out of a total of 262 for (D–I).
Age Model
The age model (Figure 9) was constructed based on 15 tie-points listed in Table 1 and shown as dotted lines in Figure 10. Thirteen tie-points are based on synchronizing variations in Δχ and benthic δ18O values from the LR04 stack (Lisiecki and Raymo, 2005). In total, fifteen tie-points were used including the two identified tephra layers (L2 and Bag tephras). Two additional tie-points correspond to tephra layers demonstrated to be present based on magnetic properties presented in sections “Magnetic Susceptibility Parameters and Stratigraphical Assignment” through “High Resolution IRM Acquisition”, especially evidenced by FORC analysis and IRM unmixing, and compatible with field-based sedimentological observations described in section “Profile Setting and Stratigraphy”.
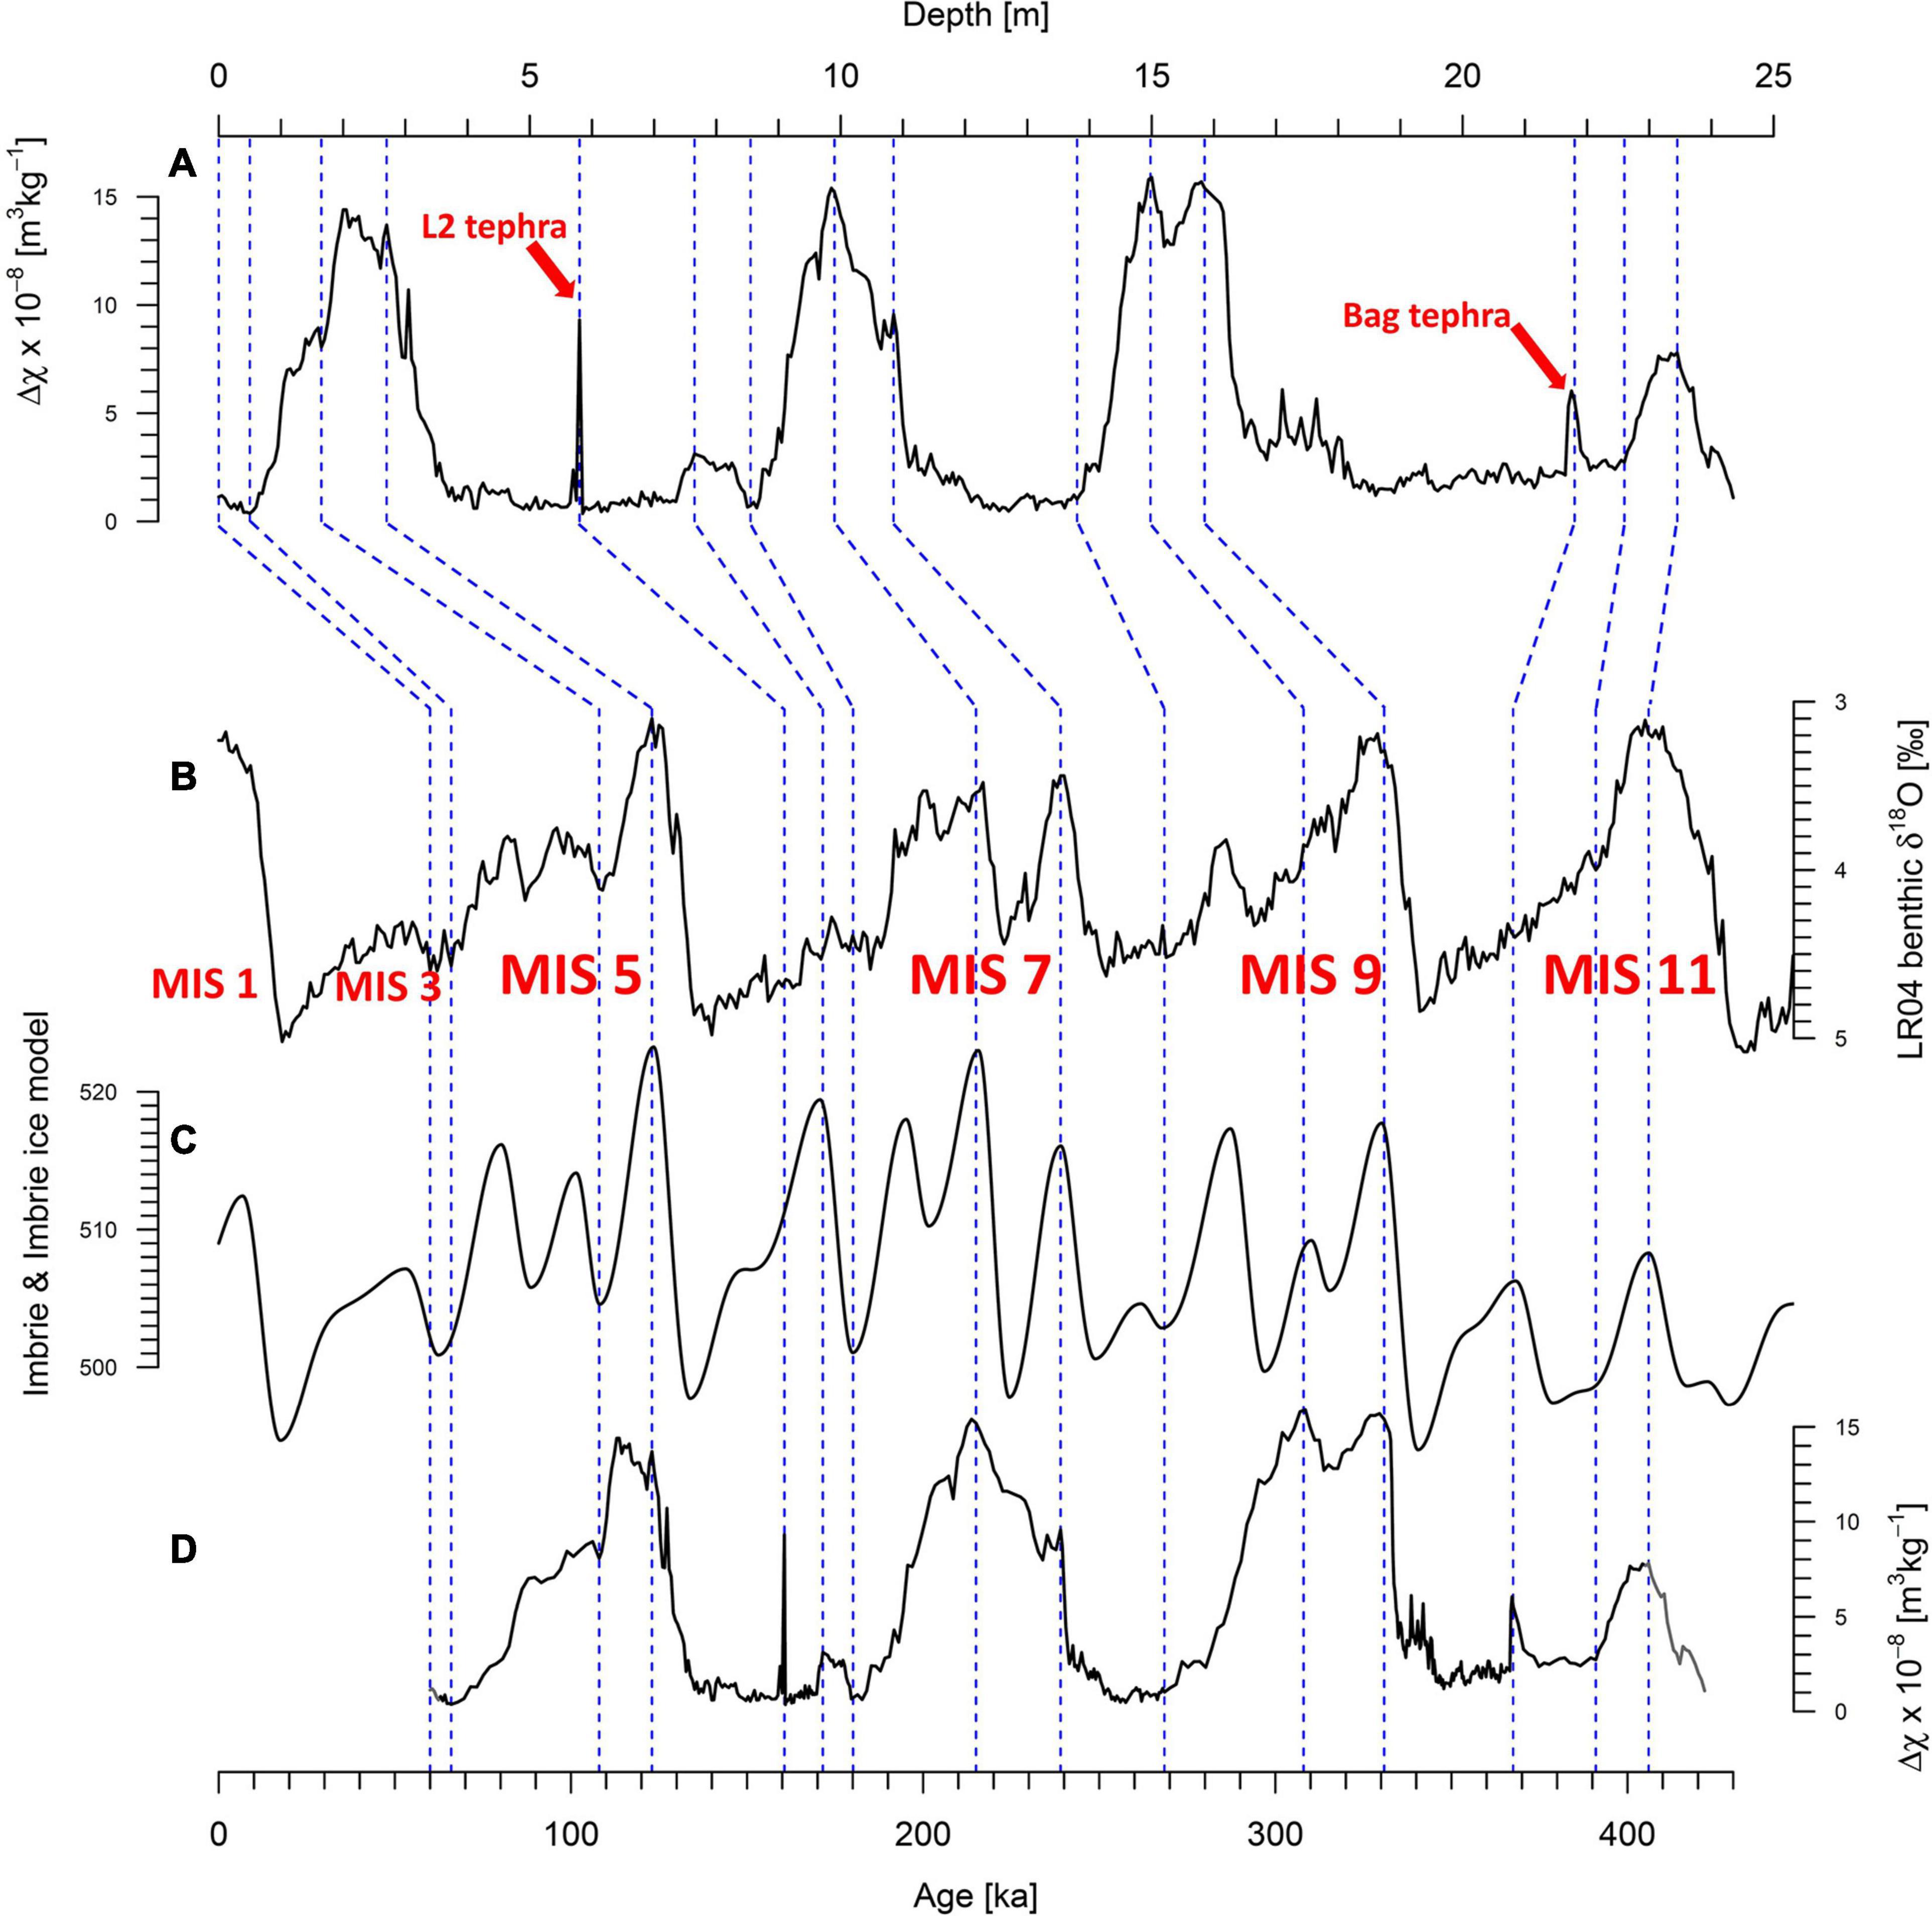
Figure 9. Age model based on the correlation of absolute frequency dependent magnetic susceptibility values (Δχ) with LR04 (Lisiecki and Raymo, 2005) and Imbrie and Imbrie Ice model (Imbrie and Imbrie, 1980). (A) Δχ as function of stratigraphy. (B) Extract of the LR04 stack (last 430 ka). (C) Imbrie and Imbrie ice model (last 430 ka). (D) The age-tuned Δχ record based on the 15 tie-points, indicated by dashed lines (see Table 1).
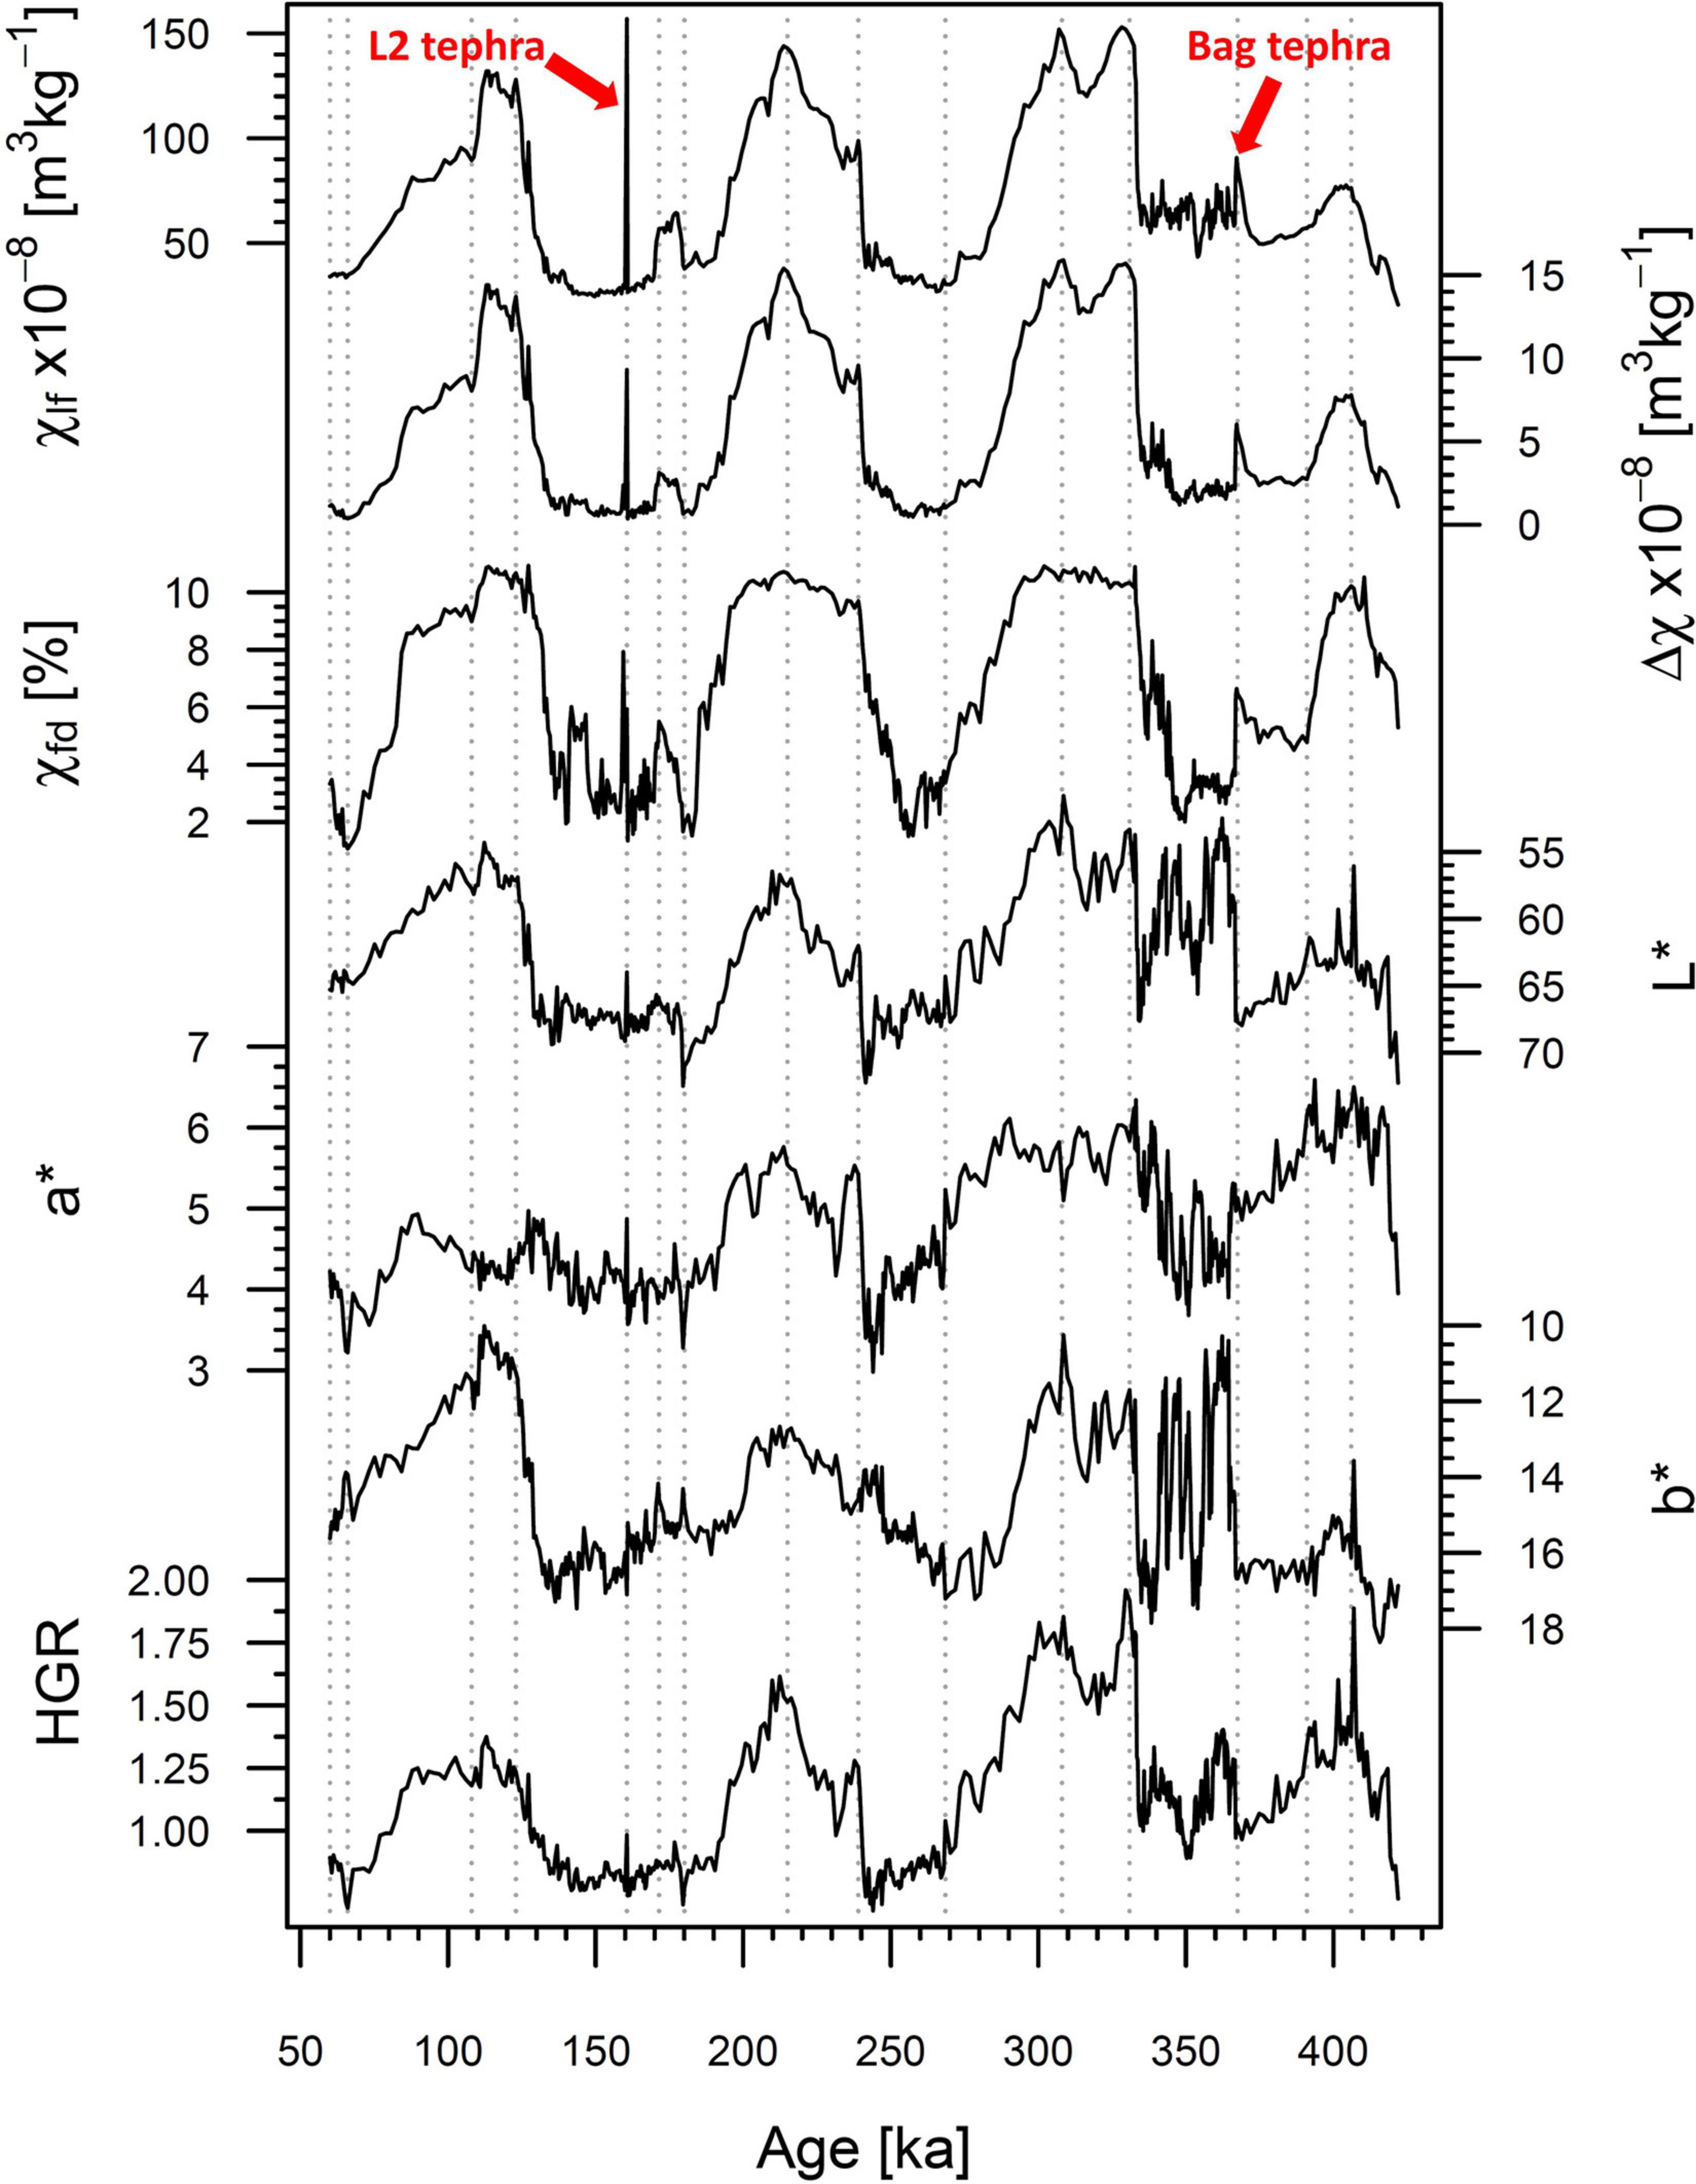
Figure 10. Magnetic susceptibility parameters χlf, Δχ, χfd [%], and the hematite/goethite ratio (HGR) as function of age. Note that the axes for L* and b* are inverted. The gray dotted lines indicate the tie-point-ages from Table 1.
The L2 tephra is a widespread tephra occurrence within southeastern European loess records (Laag et al., 2018; Avram et al., 2020). Based on its stratigraphic position in several other well-dated profiles, like the neighboring Batajnica LPS (Avram et al., 2020), and the Harletz LPS in Bulgaria (Antoine et al., 2019), the L2 tephra can potentially be correlated to the Vico-Ignimbrite B eruption, dated to 160.6 ± 2.0 ka (Mannella et al., 2019). However, uncertainty remains with the age assignment, because (1) no geochemical evidence is to our knowledge available to trace back the L2 tephra to a specific eruption and (2) the archives of Lake Ohrid (Wagner et al., 2019) and Fucino Basin (Leicher et al., 2016; Giaccio et al., 2017, 2019) exhibit several prominent tephra layers during MIS 6, which may be assigned to the L2 tephra with ages spanning 150–168 ka. For the present study, we anchored the L2 tephra at 160.6 ka (Table 1) following the hypothesis of a correlation with the Vico Ignimbrite B eruption and the age provided by Mannella et al. (2019).
The Bag tephra, demonstrated to be contained in the Zemun LPS in 4 samples between 21.85 and 21.70 m depth, has been associated elsewhere to an eruption originating from the Alban Hill Volcanic region and dated to 350–360 ka (Pouclet et al., 1999; Marković et al., 2015). A corresponding tephra layer can be found in the Fucino Basin record (TF-85), which is dated to 367 ± 1.6 ka (Marra et al., 2009, 2019; Giaccio et al., 2012) and thought to originate from the Colli Albani Villa Senni eruption (Marković et al., 2015). We tentatively use this age estimate for the tie-point represented by the Bag tephra at Zemun (Table 1 and Figure 9).
Attempts to extrapolated ages for samples depths above and below the youngest and oldest tie-points lead to an age of 50 ka corresponding to MIS 3 interglacial, which is not contained in the Zemun LPS and therefore too young for the top of the profile. Based on magnetic susceptibility variations, the loess at the top of the profile was likely deposited during the early MIS 4 (∼60 ka). The uncertainty in age extrapolation at the base of the profile is highlighted by the gray shading in Figure 9.
Discussion
Integrated Stratigraphy
The Zemun LPS comprises four interglacial paleosol complexes, S4 (Cambisol), S3 (forest-steppe soil), and S2 and S1, both considered as steppe soils (Marković et al., 2011; Obreht et al., 2016). Our correlative age model (Figure 9) suggests that the Zemun loess profile covers the time interval from MIS 11 to MIS 5/4, which is additionally constrained by the identification of two widespread tephra layers of known stratigraphic position within other Danube loess sequences (Marković et al., 2015, 2018). However, the selected correlative tie-points (Table 1) include the tephra layers, but do not account for the colorimetric data. The general stratigraphy of loess and intercalated paleosols at the Zemun LPS is in good agreement with independently dated records in the southern MDB, based on luminescence dating and paleomagnetism (Marković et al., 2009, 2011, 2015; Basarin et al., 2014; Song et al., 2018; Avram et al., 2020). It is noteworthy, that uncertainties of the direct correlation of Δχ to the LR04 stack exist (Zeeden et al., 2018), mainly because of uncertainty in the exact position of tie points and correlation targets. The stacked LR04 record provides ages for the last 1 Ma with 4 kyr uncertainty (Lisiecki and Raymo, 2005).
The fluvial sediment facies (MFS unit) below S3 is widespread in the southern MDB and is interpreted as an intercalation of marshy floodplain sediments (MFS) consisting of an alternation of sandy iron-stained and sandy-silty beds with dark humus rich partly clayey beds (e.g., Marković-Marjanović, 1970; Gaudenyi et al., 2015). The MFS unit represents overbank deposits of a river system flowing through a steppe/forest steppe landscape laterally interfingering with aeolian loess. They probably represent relatively short-term intervals of aquatic deposits formed after prominent flooding events. The loess unit L4 in which the MFS are intercalated measures ∼ 1.1 m at the neighboring section Batajnica (Marković et al., 2009) and is generally relatively thin in the entire MDB (Marković et al., 2015) and across Eurasia (Song et al., 2018).
Magnetic susceptibility parameters of the Zemun LPS convincingly track the environmental impact of interglacials and glacials during the Middle to Late Pleistocene (Figure 9). All four paleosols (S4–S1) are characterized by elevated values of χlf, Δχ, and χfd indicative of higher concentration of magnetic minerals and specifically superparamagnetic particles formed in-situ during pedogenesis (Maher and Taylor, 1988). Based on χlf, Δχ and χfd parameters, the intensity of pedogenesis increases from S4 (MIS 11) to S1 (MIS 5), to S2 (MIS 7) to S3 (MIS 9).
Colorimetric parameters are used to quantify hematite and goethite (e.g., Scheinost, 1998). The assumption that the HGR reflects changes in goethite remains questionable. Studies from Liu et al. (2008) and Jiang et al. (2018) show that goethite does not play a crucial role for LPS and additionally the process of the neo-formation of goethite is different from processes related to pedogenesis. In contrary, Bilardello et al. (2020) demonstrate in their experimental simulations that a simultaneous neoformation of goethite, hematite and magnetite is possible, and they add further evidence that biogeochemical conditions are a key-controller of the proportions of the neo-formed minerals. Our good correlation of magnetic parameters (Figure 8) like the S-ratio and remanence of coercivity (indicating the presence of hard magnetic minerals) with 1st derivative intensity band values for goethite (I435 nm) indicate the presence of goethite. However, the good correlation of HGR with the pedogenesis indicators (χferri/Ms and Δχ) indicates an overall higher presence of hematite over goethite in the paleosols of the Zemun LPS. This said, the magnetic experiments conducted in the present study do not readily permit the identification of goethite, which is facilitated in low-temperature magnetic experiments (e.g., Lagroix and Guyodo, 2017). Following that, we consider for the Zemun LPS, that the HGR can reflect changes in goethite and/or hematite. Our quantitative colorimetric data show variations that are related to the different soil types. S3, the forest-steppe soil and the most mature paleosol based on magnetic susceptibility parameters and χferri/Ms has the lowest luminance, which would result from high amounts of mineralized organic matter. With decreasing precipitation, the predominant soils are chernozems, which are represented by S1 and S2. Cambisols are brighter, which is reflected by S4 and its increased luminance (L∗).
Paleoclimatic Implications for the Zemun LPS
The stratigraphic interpretations of both rock magnetic and colorimetric data in combination with the correlative age model provide insights into the environmental evolution of the southern Middle Danube Basin for the last 430 kyr.
All susceptibility parameters (χlf, Δχ, and χfd [%]) reflect large and quasi-cyclic fluctuations, generally recording changes between warm and humid (interglacial), and cool and dry (glacial) conditions (Figure 10). Remarkably, for MIS 9 (paleosol S3) to MIS 5 (paleosol S1) the susceptibility parameters show a similar range of amplitude, whereas in MIS 11 (paleosol S4) Δχ and χlf are only weakly expressed. For S4, however, the amplitudes of χfd [%] are comparable with S1–S3.
This would suggest that for S4 the intensity of pedogenesis was weaker compared to S3–S1, which is not supported by the general pedogenetic trend in the MDB and Western Eurasia (e.g., Marković et al., 2015, and references therein). Colorimetric data of redness (a∗), an indicator for weathering intensity (Yang and Ding, 2003), leads to the opposite conclusion. The a∗ parameter is highest in S4 paleosol (Table 4) suggesting it has the highest intensity of pedogenesis, which is in line with the general paleoenvironmental evolution in the Eurasian loess belt (e.g., Buggle et al., 2013, 2014) and our pedologic interpretation. Both I435 nm and I565 nm 1st derivative intensities are highest in S4 (Figure 8) shows that both high coercivity goethite and hematite are important mineral components in S4. Both are magnetically weak, with mass specific magnetic susceptibilities 3–4 orders of magnitude less than magnetite and maghemite (Hunt et al., 1995). While the absolute concentration of SP particles in S4 is half that of S1 and one third of S3, χfd varies significantly less being 8.2% for S4, 8.9% for S1 and 9.8% for S3 (Table 2). The lower χlf and Δχ for S4 may simply result from the mineralogy of the neo-formed pedogenic iron mineral, paleoclimate and local biogeochemical conditions favored the formation of hematite and goethite or at least their preservation.
Progressively reduced precipitation and temperature characterize the general climatic trend over the last 430 kyr at Zemun when considering the colorimetric data, gradually leading to more arid climate conditions. A fundamental factor for reduced weathering intensity, indicated by decreasing a∗ values, may be the general aridification as proposed by Marković et al. (2009) and Buggle et al. (2013) for the Middle and Lower Danube Basins. Buggle et al. (2013) proposed the progressive uplift of the Carpathians, Dinarides, and Eastern Alps during the Pleistocene as main cause of this of the aridification trend.
Since, at Zemun, magnetic susceptibility is dominated by ferrimagnetic minerals, maghemite and magnetite (Figure 5B), and colorimetric analyses by hematite, an integrative view of the results from both methods is needed and beneficial. Regarding the formation of magnetite in LPS, the preferred climatic conditions are seasonally alternating wet (reducing) and dry (oxidizing) conditions controlling pedogenetic processes subsequently leading to higher susceptibilities (Maher, 1998). Differences in relative amounts of maghemite and hematite are probably caused by distinct characteristics and seasonality of climatic periods (Maher, 2011). A climate characterized by warm and dry summers in combination with mild and humid winters leads to relatively higher amounts of hematite (Balsam et al., 2004; Liu et al., 2008; Jiang et al., 2018). The interpretation of our results are in good agreement with interpretations from other studies focusing on the Lower and Middle Danube Basin (Buggle et al., 2013, 2014). With regard to the paleosols, a decreasing HGR is associated with a lower seasonality of precipitation and/or a reduction of temperature (Balsam et al., 2004). Based on our results, we assign HGR as an index for increased heat and dryness during estival periods. With respect to the susceptibility parameters, in interglacial periods the mean precipitation over the year cannot be that different. A similar trend from MIS 9 to MIS 5 is reported by Obreht et al. (2016) from the Stalać LPS, who interpret this as changing influence of different climate systems over western Eurasia.
Comparison of the Zemun LPS With Titel-Stari Slankamen and Luochuan
Thick loess-paleosols sequences are spread over the northern hemisphere, located in different geomorphological settings which are influenced by diverse prevailing climate regimes (see Schaetzl et al., 2018; Lehmkuhl et al., 2021). To detect similarities and differences in magnetic and colorimetric properties conserved in loess-paleosol sequences, we compare the Zemun LPS with two well-known reference profiles. The Titel-Stari Slankamen LPS (Serbia) covers the last million years and the interval from MIS 11 to present is archived in c. 38 m.
The Luochuan record from the CLP (Hao et al., 2012) covers approximately the last 1.1 million years and the interval MIS 11 to present in c. 30 m of loess/paleosol couplets. For comparison, the low-frequency magnetic susceptibility data (the only data set available for all three LPSs) are shown on an age scale (Figure 11). Generally, the Zemun LPS’s long-term χlf variability reflecting interglacial/glacial alternations are in excellent agreement with Titel-Stari Slankamen and Luochuan, even though the latter is located in a monsoon prevailing climate. Indeed, it is well known that different prevailing climate regimes and primary sediment sources affect the χlf values (Maher, 2016; Schaetzl et al., 2018), which are nearly 60% higher in Luochuan than in the both Serbian LPSs. More than doubled Δχ values in Luochuan compared to Titel-Stari Slankamen (Song et al., 2018) and Zemun indicate that the neo-formation of magnetite/maghemite SP particles during pedogenesis was enhanced at Luochuan, potentially due to more moisture during interglacials. The S4 paleosol at Titel-Stari Slankamen and Zemun shows-compared to the S3 paleosol – less prominent values for χlf and Δχ (Figure 11). In all records, the S3 paleosol appears in the χlf data as a double peak. The timing of onset and demise of the corresponding interglacial MIS 9 (S3) is in better agreement between Zemun and Luochuan than between Zemun and Titel-Stari Slankamen. Variations in χlf for paleosol S2 (MIS 7) are similar for both Zemun and Titel-Stari Slankamen, but the χlf values are 2–3 times higher at Zemun. The S2 pedocomplex at Luochuan displays a clear three folded paleosol based on χlf. Song et al. (2018) correlated the two older paleosols of MIS 7 with the S2 and L2SS1 horizons at Titel-Stari Slankamen. However, comparing Zemun and Titel-Stari Slankamen, a correlation of the S2 pedocomplex with the older two paleosols of Luochuan and a further correlation of the Zemun L2SS1 with the youngest MIS 7 paleosol seems more plausible. Similar to Titel-Stari Slankamen, the S1 of Zemun shows two pedogenetic horizons, a lower strongly expressed paleosol, and a younger, weakly expressed paleosol. This feature is also observable in Titel-Stari Slankamen but differently expressed in Luochuan, where the pedogenic intensity remains fairly constant throughout the S1 pedocomplex. Age differences for the onsets and demises of the paleosols might result from the applied dating techniques. For Zemun, the correlative age model is based on fluctuation in Δχ and two tephra marker horizons. For Titel-Stari Slankamen, composite record ages were provided by tuning with aid of an astronomical target, correlating peaks in χlf with June perihelia (Basarin et al., 2014). Ages for the Luochuan LPS were determined by direct correlations of the fluctuations in χlf and isotopic data from deep-sea sediments (Ding et al., 2002a; Sun et al., 2006).
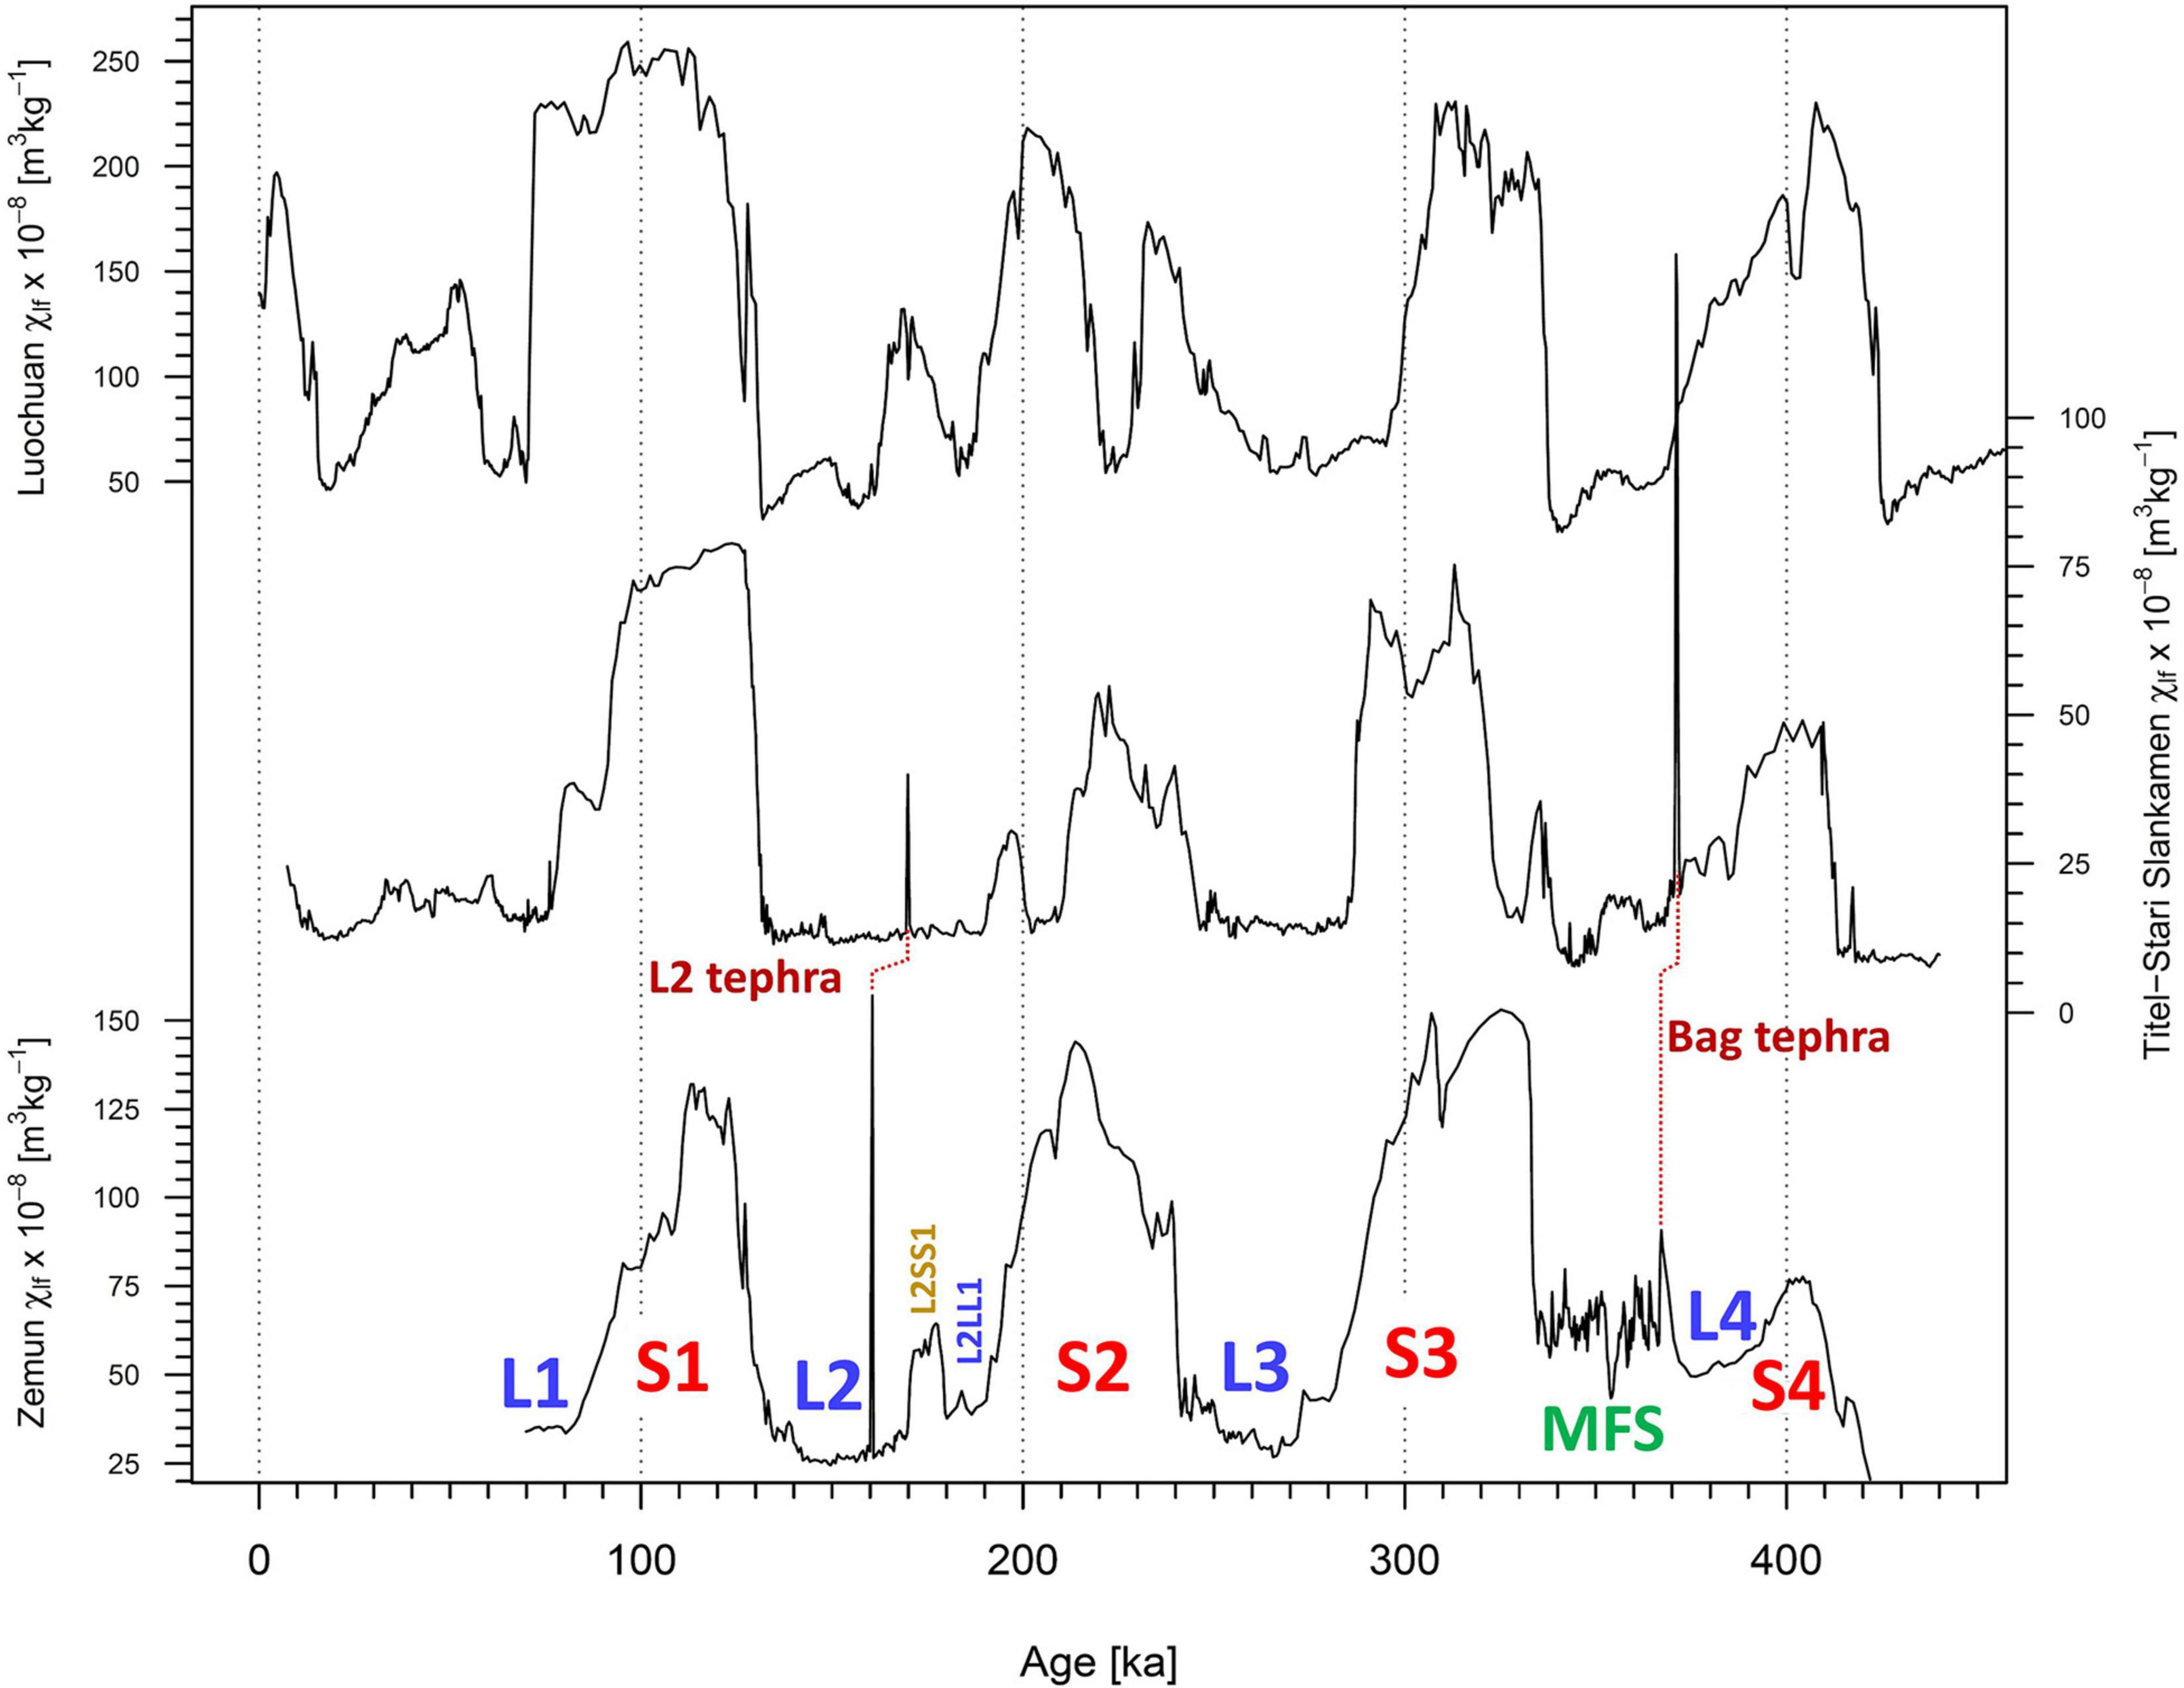
Figure 11. Comparison of the χlf record from the LPS at Zemun, Titel-Stari Slankamen, and Luochuan on their individual age scales. Note the very similar chronostratigraphic depiction of the potential tephra layers at Zemun and Titel-Stari Slankamen. Differences in onsets and demises of different paleosol units may result from different age models and applied indirect (correlative) dating. Details are discussed in the text.
Tephra Layers as Widespread Marker Horizons Using Magnetic Proxies to Highlight the Presence of Tephra Layers in Loess
In tephrochronology (Lowe, 2011) ash layers of known age and origin can be used as reliable dating tools and correlation targets. This approach plays an increasingly important role in Quaternary stratigraphy (see Abbott et al., 2020 and references therein) as for example, the accuracy of luminescence numerical dating, the choice of method of dating the emplacement time of loess deposits is still impacted by many limiting factors such as large offsets between the different methods currently applied on the same sample (Avram et al., 2020), or even between different grain-size aliquots (e.g., Timar-Gabor et al., 2011; Veres et al., 2018). The most prominent tephra layer preserved in Eastern European loess and archeological deposits is the Campanian Ignimbrite/Y5 tephra (Veres et al., 2013; Giaccio et al., 2017). Dated to c. 40 ka BP, it provides an exceptional tie-point for linking records within MIS 3 and in testing the accuracy of luminescence and radiocarbon dating for loess records (Constantin et al., 2012; Fitzsimmons et al., 2013; Anechitei-Deacu et al., 2014; Obreht et al., 2016, 2017; Scheidt et al., 2021). However, several more tephra layers have been identified in south-eastern European loess profiles (see Marković et al., 2015, 2018) which, if well assessed, not only chronologically but also by their bulk sediment geochemical (see Pötter et al., 2021) and magnetic properties (this work) may serve as important anchor points for more secure lateral stratigraphic correlations (Zeeden et al., 2018). At present, glass shard geochemical data are not available for the two tephra layers identified at Zemun (and elsewhere in the wider region) because all attempts of geochemical fingerprinting have failed due to the strong weathering and alteration of the volcanic products.
Indeed, our integrated approach combining high-resolution FORC analysis and IRM unmixing provide magnetic evidence for the presence of volcanogenic material not only for the L2 tephra, but also for the Bag tephra (Figures 6, 7). Both ZV 117 (L2 tephra) and ZP1 001 (Bag tephra) samples are characterized by a higher relative content of SD and PSD grains than the bracketing loess as well as a distinctive coercivity distribution not present in the bracketing loess. As most volcanic ashes identified in European loess units are mixed with loess or occur as cryptotephra, our approach may provide an excellent screening potential for assessing the tephrostratigraphic potential of loess records beyond the classical glass-shard geochemical analyses.
Conclusion and Summary
In this study, we present a new high-resolution loess-paleosol paleoclimate record from the Middle Danube Basin based on the application of environmental magnetic and colorimetric techniques for the last four-interglacial-to-glacial cycles spanning from MIS 11 to MIS 4. Data stemming from the S2 pedocomplex reveals different stages of environmental change during an interglacial, reflected by different coercivities, magnetic grain sizes, and different magnetic mineralogies. The combination of rock-magnetic and colorimetric data for the Zemun loess profile confirms the proposed aridification trend by Marković et al. (2009), Buggle et al. (2013), and Obreht et al. (2016). Furthermore, our HGR dataset indicates a general decreasing summer heat or dryness over the last 430 kyr in the Middle Danube Basin. Our study shows tracking only the soft ferrimagnetic (magnetite/maghemite) content may not provide a clear interpretation of changes in pedogenic intensity between interglacials, and that colorimetric data, providing insight into hematite and goethite content (high coercivity minerals) in addition are important for reconstructing summer conditions in addition to mean annual soil moisture. For loess samples stemming from the younger L3, L2, and L1 units, both hysteresis data and colorimetric data provide evidence for higher relative concentrations of high-coercivity magnetic minerals (like hematite and goethite) than in paleosols. The hematite/goethite ratio reflects a relatively higher amount of hematite compared to goethite in paleosol layers. Additionally, the investigation and comparison of FORC and highly resolved IRM acquisitions of potentially tephra bearing and pure loess samples provides further evidence of the deposition of volcanic ashes. Even when volcanic glass shards are too weathered for geochemical investigations, the remaining magnetic signal (increased PSD and SD particles in combination with reduced magnetic interactions) can be clearly identified and used as individual anchor points for future comparison and stratigraphy in the MDB and beyond.
Data Availability Statement
The original contributions presented in the study are included in the article/Supplementary Material, further inquiries can be directed to the corresponding author/s.
Author contributions
CL, UH, and SM designed the study. CL measured all magnetic and parts of the colorimetric parameters, did the data analysis and interpretation with close advice from CZ, FL, YG, DV, and UH, and programmed all analytical R-scripts for this study. MJ conducted the sampling. CL, UH, CZ, FL, DV, and YG wrote the manuscript with close advice from all co-authors. All authors contributed significantly to the article.
Conflict of Interest
The authors declare that the research was conducted in the absence of any commercial or financial relationships that could be construed as a potential conflict of interest.
Acknowledgments
We want to thank the Zemun sampling team. We want to thank Kathrin Worm (LIAG Grubenhagen) for the additional colorimetric measurements and Eva Meier (University of Bayreuth) for language improvements of this manuscript. DV was supported through a fellowship provided by Alexander von Humboldt Foundation. All data will be made available on the Pangaea Data Repository. This is IPGP contribution 4210.
Supplementary Material
The Supplementary Material for this article can be found online at: https://www.frontiersin.org/articles/10.3389/feart.2021.600086/full#supplementary-material
Footnotes
References
Abbott, P. M., Jensen, B. J. L., Lowe, D. J., Suzuki, T., and Veres, D. (2020). Crossing new frontiers: extending tephrochronology as a global geoscientific research tool. J. Quat. Sci. 35, 1–8. doi: 10.1002/jqs.3184
Abe-Ouchi, A., Saito, F., Kawamura, K., Raymo, M. E., Okuno, J., Takahashi, K., et al. (2013). Insolation-driven 100,000-year glacial cycles and hysteresis of ice-sheet volume. Nature 500, 190–193. doi: 10.1038/nature12374
Anechitei-Deacu, V., Timar-Gabor, A., Fitzsimmons, K., Veres, D., and Hambach, U. (2014). Multi-method luminescence investigations on quartz grains of different sizes extracted from a loess section in Southeast Romania interbedding the Campanian Ignimbrite ash layer. Geochronometria 41, 1–14. doi: 10.2478/s13386-013-0143-4
Antoine, P., Lagroix, F., Jordanova, D., Jordanova, N., Lomax, J., Fuchs, M., et al. (2019). A remarkable Late Saalian (MIS 6) loess (dust) accumulation in the Lower Danube at Harletz (Bulgaria). Quat. Sci. Rev. 207, 80–100. doi: 10.1016/j.quascirev.2019.01.005
Avram, A., Constantin, D., Veres, D., Kelemen, S., Obreht, I., Hambach, U., et al. (2020). Testing polymineral post−IR IRSL and quartz SAR-OSL protocols on Middle to Late Pleistocene loess at Batajnica, Serbia. Boreas 49, 615–633. doi: 10.1111/bor.12442
Balsam, W., Ji, J., and Chen, J. (2004). Climatic interpretation of the Luochuan and Lingtai loess sections, China, based on changing iron oxide mineralogy and magnetic susceptibility. Earth Planet. Sci. Lett. 223, 335–348. doi: 10.1016/j.epsl.2004.04.023
Barranco, F. T., Balsam, W. L., and Deaton, B. C. (1989). Quantitative reassessment of brick red lutites: evidence from reflectance spectrophotometry. Mar. Geol. 89, 299–314. doi: 10.1016/0025-3227(89)90082-0
Basarin, B., Buggle, B., Hambach, U., Marković, S. B., Dhand, K. O., Kovačević, A., et al. (2014). Time-scale and astronomical forcing of Serbian loess–paleosol sequences. Glob. Planet. Change 122, 89–106. doi: 10.1016/j.gloplacha.2014.08.007
Bilardello, D., Banerjee, S. K., Volk, M. W. R., Soltis, J. A., and Penn, R. L. (2020). Simulation of natural iron oxide alteration in soil: conversion of synthetic ferrihydrite to hematite without artificial dopants, observed with magnetic methods. Geochem. Geophys. Geosyst. 21:e2020GC009037. doi: 10.1029/2020GC009037
Buggle, B., Hambach, U., Kehl, M., Markovic, S. B., Zoller, L., and Glaser, B. (2013). The progressive evolution of a continental climate in southeast-central European lowlands during the Middle Pleistocene recorded in loess paleosol sequences. Geology 41, 771–774. doi: 10.1130/G34198.1
Buggle, B., Hambach, U., Müller, K., Zöller, L., Marković, S. B., and Glaser, B. (2014). Iron mineralogical proxies and Quaternary climate change in SE-European loess–paleosol sequences. CATENA 117, 4–22. doi: 10.1016/j.catena.2013.06.012
Constantin, D., Timar-Gabor, A., Veres, D., Begy, R., and Cosma, C. (2012). SAR-OSL dating of different grain-sized quartz from a sedimentary section in southern Romania interbedding the Campanian Ignimbrite/Y5 ash layer. Quat. Geochronol. 10, 81–86. doi: 10.1016/j.quageo.2012.01.012
Day, R., Fuller, M., and Schmidt, V. A. (1977). Hysteresis properties of titanomagnetites: grain size and composition dependence. Phys. Earth Planet. Interiors 13, 260–267.
Dearing, J. A., Dann, R. J. L., Hay, K., Lees, J. A., Loveland, P. J., Maher, B. A., et al. (1996). Frequency-dependent susceptibility measurements of environmental materials. Geophys. J. Int. 124, 228–240. doi: 10.1111/j.1365-246X.1996.tb06366.x
Deaton, B. C., and Balsam, W. L. (1991). Visible spectroscopy; a rapid method for determining hematite and goethite concentration in geological materials. J. Sediment. Res. 61, 628–632. doi: 10.1306/D4267794-2B26-11D7-8648000102C1865D
Debret, M., Sebag, D., Desmet, M., Balsam, W., Copard, Y., Mourier, B., et al. (2011). Spectrocolorimetric interpretation of sedimentary dynamics: the new “Q7/4 diagram.” Earth Sci. Rev. 109, 1–19. doi: 10.1016/j.earscirev.2011.07.002
Ding, Z., Rutter, N., and Liu, T. (1993). Pedostratigraphy of Chinese loess deposits and climatic cycles in the last 2.5 Myr. CATENA 20, 73–91. doi: 10.1016/0341-8162(93)90030-S
Ding, Z., Yu, Z., Rutter, N. W., and Liu, T. (1994). Towards an orbital time scale for chinese loess deposits. Quat. Sci. Rev. 13, 39–70. doi: 10.1016/0277-3791(94)90124-4
Ding, Z. L., Derbyshire, E., Yang, S. L., Yu, Z. W., Xiong, S. F., and Liu, T. S. (2002a). Stacked 2.6-Ma grain size record from the Chinese loess based on five sections and correlation with the deep-sea δ 18 O record: STACKED QUATERNARY CLIMATE RECORD FROM CHINESE LOESS. Paleoceanography 17, 5–1. doi: 10.1029/2001PA000725
Ding, Z. L., Ranov, V., Yang, S. L., Finaev, A., Han, J. M., and Wang, G. A. (2002b). The loess record in southern Tajikistan and correlation with Chinese loess. Earth Planet. Sci. Lett. 200, 387–400. doi: 10.1016/S0012-821X(02)00637-4
Dunlop, D. J. (2002a). Theory and application of the Day plot (Mrs/Ms versus Hcr/Hc 1. Theoretical curves and tests using titanomagnetite data. J. Geophys. Res. 107:2056. doi: 10.1029/2001JB000486
Dunlop, D. J. (2002b). Theory and application of the Day plot (Mrs/Ms versus Hcr/Hc 2. Application to data for rocks, sediments, and soils. J. Geophys. Res. 107:2057. doi: 10.1029/2001JB000487
Egli, R. (2013). VARIFORC: an optimized protocol for calculating non-regular first-order reversal curve (FORC) diagrams. Glob. Planet. Change 110, 302–320. doi: 10.1016/j.gloplacha.2013.08.003
Eyre, J. K. (1997). Frequency dependence of magnetic susceptibility for populations of single-domain grains. Geophys. J. Int. 129, 209–211. doi: 10.1111/j.1365-246X.1997.tb00951.x
Fitzsimmons, K. E., Hambach, U., Veres, D., and Iovita, R. (2013). The campanian ignimbrite eruption: new data on volcanic ash dispersal and its potential impact on human evolution. PLoS One 8:e65839. doi: 10.1371/journal.pone.0065839
Forster, T., Evans, M. E., and Heller, F. (1994). The frequency dependence of low field susceptibility in loess sediments. Geophys. J. Int. 118, 636–642. doi: 10.1111/j.1365-246X.1994.tb03990.x
Forster, T., Heller, F., Evans, M. E., and Havlièek, P. (1996). Loess in the Czech Republic: magnetic properties and paleoclimate. Stud. Geophys. Geod. 40, 243–261. doi: 10.1007/BF02300741
Gaudenyi, T., Nenadić, D., Stejić, P., Jovanović, M., and Bogićević, K. (2015). The stratigraphy of the Serbian Pleistocene Corbicula beds. Quat. Int. 357, 4–21. doi: 10.1016/j.quaint.2014.07.050
Gavrilović, B., Sümegi, P., Ćirić, M., Radaković, M. G., Gavrilov, M. B., Mlaąan,., et al. (2020). The middle and late pleniglacial (Weichselian) malacofauna of the Zemun loess-paleosol sequence, Serbia. PalZ 94, 519–531.
Giaccio, B., Galli, P., Messina, P., Peronace, E., Scardia, G., Sottili, G., et al. (2012). Fault and basin depocentre migration over the last 2 Ma in the L’Aquila 2009 earthquake region, central Italian Apennines. Quat. Sci. Rev. 56, 69–88. doi: 10.1016/j.quascirev.2012.08.016
Giaccio, B., Leicher, N., Mannella, G., Monaco, L., Regattieri, E., Wagner, B., et al. (2019). Extending the tephra and palaeoenvironmental record of the Central Mediterranean back to 430 ka: a new core from Fucino Basin, central Italy. Quat. Sci. Rev. 225:106003. doi: 10.1016/j.quascirev.2019.106003
Giaccio, B., Niespolo, E. M., Pereira, A., Nomade, S., Renne, P. R., Albert, P. G., et al. (2017). First integrated tephrochronological record for the last ∼190 kyr from the Fucino Quaternary lacustrine succession, central Italy. Quat. Sci. Rev. 158, 211–234. doi: 10.1016/j.quascirev.2017.01.004
Günster, N., Eck, P., Skowronek, A., and Zöller, L. (2001). Late Pleistocene loess and their paleosols in the Granada Basin, Southern Spain. Quat. Int. 7, 241–245. doi: 10.1016/S1040-6182(00)00106-3
Hambach, U., Veres, D., Constantin, D., Zeeden, C., Pötter, S., Baykal, Y., et al. (2019). “Interglacial, Holocene and recent dust accretion in the Danube Basin and beyond: evidence for uninterrupted dust accumulation in Eurasian dry steppe regions,” in International Workshop on Loess and Archeology: GEOARCHEOLOGICAL and Paleoenvironmental Research in European Loess-scapes: Abstract Book / Herausgeber: Prof. Dr. Frank Lehmkuhl, ed. J. Bösken (Aachen: Lehrstuhl für Physische Geographie und Geoökologie), 25–27. doi: 10.18154/RWTH-2019-10413
Hao, Q., Wang, L., Oldfield, F., Peng, S., Qin, L., Song, Y., et al. (2012). Delayed build-up of Arctic ice sheets during 400,000-year minima in insolation variability. Nature 490, 393–396. doi: 10.1038/nature11493
Harrison, R. J., and Feinberg, J. M. (2008). FORCinel: an improved algorithm for calculating first-order reversal curve distributions using locally weighted regression smoothing: FORCINEL ALGORITHM. Geochem. Geophys. Geosyst. 9:Q05016. doi: 10.1029/2008GC001987
Heller, F., and Liu, T. (1982). Magnetostratigraphical dating of loess deposits in China. Nature 300, 431–433. doi: 10.1038/300431a0
Heller, F., and Liu, T. (1986). Palaeoclimatic and sedimentary history from magnetic susceptibility of loess in China. Geophys. Res. Lett. 13, 1169–1172. doi: 10.1029/GL013i011p01169
Heslop, D., Langereis, C. G., and Dekkers, M. J. (2000). A new astronomical timescale for the loess deposits of Northern China. Earth Planet. Sci. Lett. 184, 125–139. doi: 10.1016/S0012-821X(00)00324-1
Hu, P., Liu, Q., Torrent, J., Barrón, V., and Jin, C. (2013). Characterizing and quantifying iron oxides in Chinese loess/paleosols: implications for pedogenesis. Earth Planet. Sci. Lett. 369–370, 271–283. doi: 10.1016/j.epsl.2013.03.033
Hunt, C. P., Moskowitz, B. M., and Banerjee, S. K. (1995). “Magnetic properties of rocks and minerals,” in AGU Reference Shelf, ed. T. J. Ahrens (Washington, DC: American Geophysical Union), 189–204. doi: 10.1029/RF003p0189
Imbrie, J., and Imbrie, J. Z. (1980). Modeling the climatic response to orbital variations. Science 207, 943–953. doi: 10.1126/science.207.4434.943
Ji, J., Balsam, W., Chen, J. U., and Liu, L. (2002). Rapid and quantitative measurement of hematite and goethite in the chinese loess-paleosol sequence by diffuse reflectance spectroscopy. Clays Clay Minerals 50, 208–216. doi: 10.1346/000986002760832801
Jiang, Z., Liu, Q., Roberts, A. P., Barrón, V., Torrent, J., and Zhang, Q. (2018). A new model for transformation of ferrihydrite to hematite in soils and sediments. Geology 46, 987–990. doi: 10.1130/G45386.1
Jordanova, D., Hus, J., and Geeraerts, R. (2007). Palaeoclimatic implications of the magnetic record from loess/palaeosol sequence Viatovo (NE Bulgaria): palaeoclimatic implications of the magnetic record. Geophys. J. Int. 171, 1036–1047. doi: 10.1111/j.1365-246X.2007.03576.x
Jordanova, D., and Jordanova, N. (2020). Diversity and peculiarities of soil formation in eolian landscapes – insights from the mineral magnetic records. Earth Planet. Sci. Lett. 531:115956. doi: 10.1016/j.epsl.2019.115956
King, J. W., and Channell, J. E. T. (1991). SEDIMENTARY MAGNETISM, ENVIRONMENTAL MAGNETISM, AND MAGNETOSTRATIGRAPHY. Rev. Geophys. 29, 358–370. doi: 10.1002/rog.1991.29.s1.358
Kohfeld, K., and Harrison, S. P. (2003). Glacial-interglacial changes in dust deposition on the Chinese Loess Plateau. Quat. Sci. Rev. 22, 1859–1878. doi: 10.1016/S0277-3791(03)00166-5
Kukla, G., and An, Z. (1989). Loess stratigraphy in Central China. Palaeogeogr. Palaeoclimatol. Palaeoecol. 72, 203–225. doi: 10.1016/0031-0182(89)90143-0
Laag, C., Hambach, U. F., Botezatu, A., Baykal, Y., Veres, D., Schönwetter, T., et al. (2018). “The geographical extent of the “L2-Tephra”: a widespread marker horizon for the penultimate glacial (MIS 6) on the Balkan Peninsula,” in Abstract book, INQUA-INTAV International Field Conference and Workshop - Crossing New Frontiers - Tephra Hunt in Transylvania, eds U. Hambach and D. Veres (Romania: INQUA-INTAV), 111–112. doi: 10.13140/RG.2.2.29686.96325
Lagroix, F., Banerjee, S. K., and Jackson, M. J. (2016). “Geological occurrences and relevance of iron oxides,” in Iron Oxides: From Nature to Applications, ed. D. Faivre (Weinheim: Wiley-VCH), 9–29.
Lagroix, F., and Guyodo, Y. (2017). A new tool for separating the magnetic mineralogy of complex mineral assemblages from low temperature magnetic behavior. Front. Earth Sci. 5:61. doi: 10.3389/feart.2017.00061
Lehmkuhl, F., Nett, J. J., Pötter, S., Schulte, P., Sprafke, T., Jary, Z., et al. (2021). Loess landscapes of Europe – mapping, geomorphology, and zonal differentiation. Earth Sci. Rev. 215:103496. doi: 10.1016/j.earscirev.2020.103496
Leicher, N., Zanchetta, G., Sulpizio, R., Giaccio, B., Wagner, B., Nomade, S., et al. (2016). First tephrostratigraphic results of the DEEP site record from Lake Ohrid (Macedonia and Albania). Biogeosciences 13, 2151–2178. doi: 10.5194/bg-13-2151-2016
Lisiecki, L. E., and Raymo, M. E. (2005). A Pliocene-Pleistocene stack of 57 globally distributed benthic δ18O records. Paleoceanography 20:A1003. doi: 10.1029/2004PA001071
Liu, Q., Barrón, V., Torrent, J., Eeckhout, S. G., and Deng, C. (2008). Magnetism of intermediate hydromaghemite in the transformation of 2-line ferrihydrite into hematite and its paleoenvironmental implications. J. Geophys. Res. 113:B01103. doi: 10.1029/2007JB005207
Liu, Q., Zhang, C., Torrent, J., Barrón, V., Hu, P., Jiang, Z., et al. (2016). Factors controlling magnetism of reddish brown soil profiles from calcarenites in Southern Spain: dust input or in-situ pedogenesis? Front. Earth Sci. 4:51. doi: 10.3389/feart.2016.00051
Lowe, D. J., Pearce, N. J. G., Jorgensen, M. A., Kuehn, S. C., Tryon, C. A., and Hayward, C. L. (2017). Correlating tephras and cryptotephras using glass compositional analyses and numerical and statistical methods: review and evaluation. Quat. Sci. Rev. 175, 1–44. doi: 10.1016/j.quascirev.2017.08.003
Lukić, T., Basarin, B., Buggle, B., Marković, S. B., Tomović, V. M., Raljič, J. P., et al. (2014). A joined rock magnetic and colorimetric perspective on the Late Pleistocene climate of Orlovat loess site (Northern Serbia). Quat. Int. 334–335, 179–188. doi: 10.1016/j.quaint.2014.03.042
Machalett, B., Frechen, M., Hambach, U., Oches, E. A., Zöller, L., and Marković, S. B. (2006). The loess sequence from Remisowka (northern boundary of the Tien Shan Mountains, Kazakhstan)—Part I: luminescence dating. Quat. Int. 15, 192–201. doi: 10.1016/j.quaint.2005.12.014
Maher, B. A. (1998). Magnetic properties of modern soils and Quaternary loessic paleosols: paleoclimatic implications. Palaeogeogr. Palaeoclimatol. Palaeoecol. 137, 25–54.
Maher, B. A. (2011). The magnetic properties of Quaternary aeolian dusts and sediments, and their palaeoclimatic significance. Aeolian Res. 3, 87–144. doi: 10.1016/j.aeolia.2011.01.005
Maher, B. A. (2016). Palaeoclimatic records of the loess/palaeosol sequences of the Chinese Loess Plateau. Quat. Sci. Rev. 154, 23–84. doi: 10.1016/j.quascirev.2016.08.004
Maher, B. A., and Taylor, R. M. (1988). Formation of ultrafine-grained magnetite in soils. Nature 336, 368–370.
Mannella, G., Giaccio, B., Zanchetta, G., Regattieri, E., Niespolo, E. M., Pereira, A., et al. (2019). Palaeoenvironmental and palaeohydrological variability of mountain areas in the central Mediterranean region: a 190 ka-long chronicle from the independently dated Fucino palaeolake record (central Italy). Quat. Sci. Rev. 210, 190–210. doi: 10.1016/j.quascirev.2019.02.032
Marković, S. B., Hambach, U., Catto, N., Jovanović, M., Buggle, B., Machalett, B., et al. (2009). Middle and Late Pleistocene loess sequences at Batajnica, Vojvodina, Serbia. Quat. Int. 198, 255–266. doi: 10.1016/j.quaint.2008.12.004
Marković, S. B., Hambach, U., Stevens, T., Kukla, G. J., Heller, F., McCoy, W. D., et al. (2011). The last million years recorded at the Stari Slankamen (Northern Serbia) loess-palaeosol sequence: revised chronostratigraphy and long-term environmental trends. Quat. Sci. Rev. 30, 1142–1154. doi: 10.1016/j.quascirev.2011.02.004
Marković, S. B., Stevens, T., Kukla, G. J., Hambach, U., Fitzsimmons, K. E., Gibbard, P., et al. (2015). Danube loess stratigraphy — towards a pan-European loess stratigraphic model. Earth Sci. Rev. 148, 228–258. doi: 10.1016/j.earscirev.2015.06.005
Marković, S. B., Stevens, T., Mason, J., Vandenberghe, J., Yang, S., Veres, D., et al. (2018). Loess correlations – between myth and reality. Palaeogeogr. Palaeoclimatol. Palaeoecol. 509, 4–23. doi: 10.1016/j.palaeo.2018.04.018
Marković-Marjanović, J. (1970). Data concerning the stratigraphy and the fauna of the lower and middle pleistocene of Yugoslavia. Palaeogeogr. Palaeoclimatol. Palaeoecol. 8, 153–163. doi: 10.1016/0031-0182(70)90008-8
Marra, F., Bahain, J.-J., Jicha, B. R., Nomade, S., Palladino, D. M., Pereira, A., et al. (2019). Reconstruction of the MIS 5.5, 5.3 and 5.1 coastal terraces in Latium (central Italy): a re-evaluation of the sea-level history in the Mediterranean Sea during the last interglacial. Quat. Int. 525, 54–77. doi: 10.1016/j.quaint.2019.09.001
Marra, F., Karner, D. B., Freda, C., Gaeta, M., and Renne, P. (2009). Large mafic eruptions at Alban Hills Volcanic District (Central Italy): chronostratigraphy, petrography and eruptive behavior. J. Volcanol. Geothermal Res. 179, 217–232. doi: 10.1016/j.jvolgeores.2008.11.009
Maxbauer, D. P., Feinberg, J. M., and Fox, D. L. (2016). MAX UnMix: a web application for unmixing magnetic coercivity distributions. Comp. Geosci. 95, 140–145. doi: 10.1016/j.cageo.2016.07.009
Meyers, S. R. (2014). astrochron: An R Package for Astrochronology. Version 0.8. Available online at: http://www.geology.wisc.edu/~smeyers (accessed June 17, 2020).
Mullins, C. E., and Tite, M. S. (1973). Magnetic viscosity, quadrature susceptibility, and frequency dependence of susceptibility in single-domain assemblies of magnetite and maghemite. J. Geophys. Res. 78, 804–809. doi: 10.1029/JB078i005p00804
Necula, C., Panaiotu, C., Heslop, D., and Dimofte, D. (2013). Climatic control of magnetic granulometry in the Mircea Vodã loess/paleosol sequence (Dobrogea, Romania). Quat. Int. 293, 5–14. doi: 10.1016/j.quaint.2012.03.043
Obreht, I., Hambach, U., Veres, D., Zeeden, C., Bösken, J., Stevens, T., et al. (2017). Shift of large-scale atmospheric systems over Europe during late MIS 3 and implications for Modern Human dispersal. Sci. Rep. 7:5848. doi: 10.1038/s41598-017-06285-x
Obreht, I., Zeeden, C., Hambach, U., Veres, D., Marković, S. B., Bösken, J., et al. (2016). Tracing the influence of Mediterranean climate on Southeastern Europe during the past 350,000 years. Sci. Rep. 6:36334. doi: 10.1038/srep36334
Obreht, I., Zeeden, C., Hambach, U., Veres, D., Marković, S. B., and Lehmkuhl, F. (2019). A critical reevaluation of palaeoclimate proxy records from loess in the Carpathian Basin. Earth Sci. Rev. 190, 498–520. doi: 10.1016/j.earscirev.2019.01.020
Peters, C., and Dekkers, M. J. (2003). Selected room temperature magnetic parameters as a function of mineralogy, concentration and grain size. Phys. Chem. Earth Parts A/B/C 28, 659–667. doi: 10.1016/S1474-7065(03)00120-7
Post, D. F., Bryant, R. B., Batchily, A. K., Huete, A. R., Levine, S. J., Mays, M. D., et al. (2015). “Correlations between field and laboratory measurements of soil color,” in SSSA Special Publications, eds J. M. Bigham and E. J. Ciolkosz (Madison, WI: Soil Science Society of America), 35–49. doi: 10.2136/sssaspecpub31.c3
Pötter, S., Veres, D., Baykal, Y., Nett, J. J., Schulte, P., Hambach, U., et al. (2021). Disentangling sedimentary pathways for the Pleniglacial Lower Danube loess based on geochemical signatures. Front. Earth Sci. 9:600010.
Pouclet, A., Horvath, E., Gabris, G., and Juvigné, E. (1999). The Bag Tephra, a widespread tephrochronological marker in Middle Europe: chemical and mineralogical investigations. Bull. Volcanol. 61, 265–272. doi: 10.1007/s004450050275
R Core Team (2020). R: A Language and Environment for Statistical Computing. Vienna: R Foundation for Statistical Computing.
Šarić, J. (2008). Paleolithic and mesolithic finds from profile of the Zemun loess. Starinar 9–27. doi: 10.2298/STA0858009S
Schaetzl, R. J., Bettis, E. A., Crouvi, O., Fitzsimmons, K. E., Grimley, D. A., Hambach, U., et al. (2018). Approaches and challenges to the study of loess—introduction to the LoessFest Special Issue. Quat. Res. 89, 563–618. doi: 10.1017/qua.2018.15
Scheidt, S., Berg, S., Hambach, U., Klasen, N., Pötter, S., Stolz, A., et al. (2021). Chronological assessment of the balta alba kurgan loess-paleosol section (Romania) – a comparative study on different dating methods for a robust and precise age model. Front. Earth Sci. 8:598448. doi: 10.3389/feart.2020.598448
Scheinost, A. C. (1998). Use and limitations of second-derivative diffuse reflectance spectroscopy in the visible to near-infrared range to identify and quantify Fe oxide minerals in soils. Clays Clay Minerals 46, 528–536. doi: 10.1346/CCMN.1998.0460506
Song, Y., Guo, Z., Marković, S., Hambach, U., Deng, C., Chang, L., et al. (2018). Magnetic stratigraphy of the Danube loess: a composite Titel-Stari Slankamen loess section over the last one million years in Vojvodina, Serbia. J. Asian Earth Sci. 155, 68–80. doi: 10.1016/j.jseaes.2017.11.012
Sümegi, P., Gulyás, S., Molnár, D., Sümegi, B. P., Almond, P. C., Vandenberghe, J., et al. (2018). New chronology of the best developed loess/paleosol sequence ofHungary capturing the past 1.1 ma: implications for correlation andproposed pan-Eurasian stratigraphic schemes. Quat. Sci. Rev. 191, 144–166.
Sun, Y., Clemens, S. C., An, Z., and Yu, Z. (2006). Astronomical timescale and palaeoclimatic implication of stacked 3.6-Myr monsoon records from the Chinese Loess Plateau. Quat. Sci. Rev. 25, 33–48. doi: 10.1016/j.quascirev.2005.07.005
Sun, Y., He, L., Liang, L., and An, Z. (2011). Changing color of Chinese loess: geochemical constraint and paleoclimatic significance. J. Asian Earth Sci. 40, 1131–1138. doi: 10.1016/j.jseaes.2010.08.006
Taylor, S. N., and Lagroix, F. (2015). Magnetic anisotropy reveals the depositional and postdepositional history of a loess-paleosol sequence at Nussloch (Germany): AMS OF NUSSLOCH LOESS-PALEOSOL SEQUENCE. J. Geophys. Res. Solid Earth 120, 2859–2876. doi: 10.1002/2014JB011803
Taylor, S. N., Lagroix, F., Rousseau, D.-D., and Antoine, P. (2014). Mineral magnetic characterization of the Upper Pleniglacial Nussloch loess sequence (Germany): an insight into local environmental processes. Geophys. J. Int. 199, 1463–1480. doi: 10.1093/gji/ggu331
Till, J. L., Jackson, M. J., Rosenbaum, J. G., and Solheid, P. (2011). Magnetic properties in an ash flow tuff with continuous grain size variation: a natural reference for magnetic particle granulometry: SUPERPARAMAGNETIC GRAINS IN TUFF. Geochem. Geophys. Geosyst. 12:Q07Z26. doi: 10.1029/2011GC003648
Timar-Gabor, A., Ivascu, C., Vasiliniuc, S., Daraban, L., Ardelean, I., Cosma, C., et al. (2011). Thermoluminescence and optically stimulated luminescence properties of the 0.5P2O5–xBaO–(0.5-x)Li2O glass systems. Appl. Radiation Isotopes 69, 780–784. doi: 10.1016/j.apradiso.2011.01.015
Torrent, J., Liu, Q., Bloemendal, J., and Barrón, V. (2007). Magnetic Enhancement and Iron Oxides in the Upper Luochuan Loess-Paleosol Sequence, Chinese Loess Plateau. Soil Sci. Soc. Am. J. 71, 1570–1578. doi: 10.2136/sssaj2006.0328
Tsatskin, A., Heller, F., Hailwood, E. A., Gendler, T. S., Hus, J., Montgomery, P., et al. (1998). Pedosedimentary division, rock magnetism and chronology of the loess/palaeosol sequence at Roxolany (Ukraine). Palaeogeogr. Palaeoclimatol. Palaeoecol. 143, 111–133. doi: 10.1016/S0031-0182(98)00073-X
Veres, D., Lane, C. S., Timar-Gabor, A., Hambach, U., Constantin, D., Szakács, A., et al. (2013). The Campanian Ignimbrite/Y5 tephra layer – a regional stratigraphic marker for Isotope Stage 3 deposits in the Lower Danube region, Romania. Quat. Int. 293, 22–33. doi: 10.1016/j.quaint.2012.02.042
Veres, D., Tecsa, V., Gerasimenko, N., Zeeden, C., Hambach, U., and Timar-Gabor, A. (2018). Short-term soil formation events in last glacial east European loess, evidence from multi-method luminescence dating. Quat. Sci. Rev. 200, 34–51. doi: 10.1016/j.quascirev.2018.09.037
Wagner, B., Vogel, H., Francke, A., Friedrich, T., Donders, T., Lacey, J. H., et al. (2019). Mediterranean winter rainfall in phase with African monsoons during the past 1.36 million years. Nature 573, 256–260. doi: 10.1038/s41586-019-1529-0
WRB 2014/2015. IUSS Working Group World Reference Base for Soil Resources 2014, Update 2015. International Soil Classification System for Naming Soils and Creating Legends for Soil Maps. World Soil Resources, Reports No. 106. Rome: FAO.
Wu, Y., Qiu, S., Fu, S., Rao, Z., and Zhu, Z. (2018). Pleistocene climate change inferred from multi-proxy analyses of a loess-paleosol sequence in China. J. Asian Earth Sci. 154, 428–434. doi: 10.1016/j.jseaes.2017.10.007
Yang, S. L., and Ding, Z. L. (2003). Color reflectance of Chinese loess and its implications for climate gradient changes during the last two glacial−interglacial cycles. Geophys. Res. Lett. 30:GL018346. doi: 10.1029/2003GL018346
Zeeden, C., Hambach, U., Obreht, I., Hao, Q., Abels, H. A., Veres, D., et al. (2018). Patterns and timing of loess-paleosol transitions in Eurasia: constraints for paleoclimate studies. Glob. Planet. Change 162, 1–7. doi: 10.1016/j.gloplacha.2017.12.021
Zeeden, C., Kels, H., Hambach, U., Schulte, P., Protze, J., Eckmeier, E., et al. (2016). Three climatic cycles recorded in a loess-palaeosol sequence at Semlac (Romania) – implications for dust accumulation in south-eastern Europe. Quat. Sci. Rev. 154, 130–142. doi: 10.1016/j.quascirev.2016.11.002
Keywords: loess-paleosol sequences, environmental magnetism, diffuse reflectance spectrometry, stratigraphy, paleoclimate dynamics
Citation: Laag C, Hambach U, Zeeden C, Lagroix F, Guyodo Y, Veres V, Jovanović M and Marković SB (2021) A Detailed Paleoclimate Proxy Record for the Middle Danube Basin Over the Last 430 kyr: A Rock Magnetic and Colorimetric Study of the Zemun Loess-Paleosol Sequence. Front. Earth Sci. 9:600086. doi: 10.3389/feart.2021.600086
Received: 28 August 2020; Accepted: 20 April 2021;
Published: 25 May 2021.
Edited by:
Julie Fosdick, University of Connecticut, United StatesReviewed by:
Giancarlo Scardia, São Paulo State University, BrazilJinbo Zan, Institute of Tibetan Plateau Research (CAS), China
Chenglong Deng, Institute of Geology and Geophysics, Chinese Academy of Sciences (CAS), China
Copyright © 2021 Laag, Hambach, Zeeden, Lagroix, Guyodo, Veres, Jovanović and Marković. This is an open-access article distributed under the terms of the Creative Commons Attribution License (CC BY). The use, distribution or reproduction in other forums is permitted, provided the original author(s) and the copyright owner(s) are credited and that the original publication in this journal is cited, in accordance with accepted academic practice. No use, distribution or reproduction is permitted which does not comply with these terms.
*Correspondence: Christian Laag, bGFhZ0BpcGdwLmZy
 Christian Laag
 Ulrich Hambach
 Christian Zeeden
 France Lagroix
 Yohan Guyodo
 Daniel Veres5
 Mladjen Jovanović