 Anna G. Kral
 Alexander Ziegler
 Thomas Tütken
 Thorsten Geisler
- 1Institut für Geowissenschaften, Rheinische Friedrich-Wilhelms-Universität, Bonn, Germany
- 2Institut für Evolutionsbiologie und Ökologie, Rheinische Friedrich-Wilhelms-Universität, Bonn, Germany
- 3Institut für Geowissenschaften, Johannes-Gutenberg-Universität, Mainz, Germany
Bones are one of the most common vertebrate fossil remains and are widely used as proxy archives in palaeontology and archaeology. Previous histological analyses have shown that bone microarchitecture is mostly well-preserved in fossil remains, but partially or even entirely lost in most archaeological specimens. As a consequence, processes occurring during early diagenesis are pivotal for the preservation of bones and a better understanding of these processes would be required to assess the significance of information stored in fossilized bones. Although much of the changes occur at the nanometer scale, determining the resistance of bone microarchitecture to diagenetic alteration on a microscopic scale constitutes a prerequisite for more detailed studies. Here, results from the first comparative in vitro taphonomy study of cortical bone simulating conditions potentially encountered in early diagenetic settings are presented. In order to accelerate anticipated early diagenetic changes and to facilitate their study in a practical framework, cortical bone samples were exposed to aqueous solutions with temperature, time, and composition of the experimental solutions as controlled parameters. Before and after the experiments, all samples were characterized quantitatively using micro-computed tomography to document structural changes. The results show that the overall change in cortical porosity predominantly occurred in canals with diameters ≤9 µm (∆Ct.Po = ±30%). Furthermore, the data also show that the solution composition had a stronger impact on changes observed than either temperature or time. It was also found that samples from the two experimental series with a freshwater-like solution composition showed a characteristic reaction rim. However, it remains unclear at present if the observed changes have an impact on reactions occurring at the nanometer scale. Nonetheless, the results clearly demonstrate that on a micrometer scale down to 3 μm, bone microarchitecture is largely resistant to aqueous alteration, even under very different physicochemical conditions. In addition, the data illustrate the complexity of the interaction of different diagenetic factors. The results presented here provide a solid framework for future investigations on reaction and transport mechanisms occurring during the early diagenesis of fossil bones.
Introduction
The preservation of mineralized vertebrate remains over millions of years and the associated structural, mineralogical, and chemical changes occurring during fossilization still raise a number of open questions. A comprehensive understanding of how bones are preserved and modified over geological time scales is of importance, because bones act as valuable archives in palaeontology as well as in archaeology. Bones permit the reconstruction of past environmental and climatic conditions, habitats, as well as the diet and evolution of extinct vertebrate organisms (DeNiro, 1987; Marino and DeNiro, 1987; Koch et al., 1992; Koch et al., 1994; Collins et al., 2002; Hedges, 2002; Kohn and Cerling, 2002; Tütken et al., 2004; Kohn and Law, 2006; Tütken et al., 2008; Clementz et al., 2009; Heuser et al., 2011; Reynard and Balter, 2014). In general, bone is composed of cortical bone (CB) and trabecular bone (TB), with TB forming the inner and CB the outer part of a given skeletal bone (Steele and Bramblett, 1988). Due to its higher porosity, TB has a lower density than CB, and therefore also a significantly higher surface-area-to-volume ratio (Parfitt, 2002). This increased reaction surface of TB renders it more prone to modifications post mortem, whereas CB is potentially more resistant against alteration over longer periods of time (Trueman and Martill, 2002; Erickson, 2005).
During bone growth, a complex, hierarchically structured microarchitecture is formed that consists of a composite material comprised of a fibrous organic matrix with 20–25 wt.% organic material (predominantly type-I-collagen, but also non-collagenous proteins), 60–65 wt.% bioapatite and ca. 10 wt.% water (Zioupos et al., 2000; Kendall et al., 2018). The inorganic phase can be described as nano-crystalline, hydrated, hydroxylated, and carbonated calcium phosphate, i.e., hydroxylapatite (HAp)-like, Ca10–x [(PO4)6–x (CO3)x] (OH)2–x·nH2O (Pasteris et al., 2014). Within the composite structure of bone, collagen acts as a framework, whereas bioapatite crystals serve as reinforcement between the collagen helices (Zhu et al., 2008; Reznikov et al., 2018; Binkley et al., 2020; Lee et al., 2020). Apart from its structural role, bioapatite plays a crucial role in calcium homeostasis serving as important reservoir of Ca and PO4 ions (Heaney, 2006; Rigo et al., 2012 and references cited therein). In addition, bone is pervaded by a system of canals filled with nerves and blood vessels. The latter grant supply with nutrients during lifetime, thus leading to a constant exchange of elements between blood and bone (Marenzana and Arnett, 2013). The composition of the blood, in turn, reflects the isotopic and chemical composition of the animal’s diet (DeNiro and Epstein, 1978; Tieszen et al., 1983; Lee-Thorp et al., 1989; Tieszen and Fagre, 1993), ingested water (Longinelli, 1984; Luz et al., 1984; Bryant and Froelich, 1995; Kohn, 1996), as well as the air it was breathing (Kohn, 1996; Pack et al., 2013). This information is recorded in the isotopic composition of the bone tissue. However, when interpreting isotopic or chemical data, the following two stages must be distinguished: 1) bone growth and 2) bone remodeling. During bone growth, both the mineral and protein phase of CB record the contemporary dietary of the organism and the predominant environmental conditions under which it lived until reaching maturity. In parallel as well as consecutively, bone remodeling can be observed, in which CB is replaced by so-called bone remodeling units throughout the lifetime of an organism (Tomes and De Morgan, 1853; Frost, 1969; Parfitt, 1979; Glimcher, 2006; Boskey, 2007; Boskey and Coleman, 2010; Stout and Crowder, 2011; Burch et al., 2014). In this way, the isotopic and chemical composition initially stored in the bone are continuously overprinted until the animal dies, although the extent to which this happens varies from one bone to another (Recker et al., 2011). However, during the fossilization of bone, both the organic and inorganic phases of CB are modified immediately post mortem (Trueman et al., 2004). The most important changes that occur at this point are the degradation of parts of the organic phase and its subsequent mineralization by inorganic phases, predominantly by fluorapatite or a thermodynamically more stable and less carbonate-bearing form of hydroxylapatite (Berna et al., 2004; Wopenka and Pasteris, 2005; Pasteris and Ding, 2009; Keenan, 2016).
In the past, conventional histological studies have provided significant insight into the growth and physiology of fossil vertebrates (Stout and Crowder, 2011; Padian and Lamm, 2013; and references cited therein, respectively). These analyses have shown that the microarchitecture of CB is usually well preserved in fossils, whereas it can be partially or even entirely lost in archaeological specimens (Hedges and Millard, 1995; Hedges, 2002; Trueman and Martill, 2002). Consequently, processes affecting CB during the early stages of diagenesis must be pivotal for the degradation or preservation of bone (Tuross et al., 1989a; Tuross et al., 1989b; Greenlee, 1996; Kohn et al., 1999; Sponheimer and Lee-Thorp, 1999; Pfretzschner, 2000; Trueman and Martill, 2002; Trueman and Tuross, 2002; Pfretzschner, 2004; Trueman et al., 2004; Zazzo et al., 2004; Trueman et al., 2006; Kohn, 2008; Trueman et al., 2008; Hinz and Kohn, 2010; Tütken and Vennemann, 2011; Kohn and Moses, 2013; Trueman, 2013; Kendall et al., 2018). It would thus be important to better understand the influence of early diagenetic alteration processes that lead to the modification or even entire loss of chemical information stored in fossil remains. In particular, it would be of interest to show exactly how the isotopic and chemical composition of the bone’s organic and inorganic phases are affected by diagenetic alteration post mortem.
Bones are porous materials, characterized by the presence of large contact surfaces for interaction with water, which was shown to play an important role during early diagenesis (Hedges and Millard, 1995; Hedges, 2002; Aufort et al., 2019). Although bone itself is highly insoluble in neutral water (Horvath, 2006), aqueous fluids can lead to degradation or preservation of mineralized tissues under certain conditions, especially during the early stages of diagenetic alteration. In life, bones are located in an almost stable environment, being surrounded by body fluids with constant pH and saturated in bioapatite components. But, this stable environment changes as soon as bones are exposed to open systems where aqueous solutions are present that are not saturated in Ca2+, CO32−, or PO42− and that consequently have a different pH, thus rendering bone more prone to dissolution (Berna et al., 2004). However, water may also have protective properties. For example, when aqueous fluids infiltrate bone through the aforementioned canal system, they become quickly saturated with PO42− and Ca2+, a process that will drastically reduce dissolution of the mineral phase and hence support bone preservation.
On a structural level, bone porosity constitutes one of the most important parameters that can provide information about the diagenetic history of a given bone, in particular because differences in porosity are closely related to changes of organic and/or inorganic components of bone. Bone porosity has thus been the subject of investigation for a long time, especially in osteoporosis research (e.g., Bjørnerem, 2016 and references cited therein; Harrison et al., 2020), but also in archaeology (Hedges et al., 1995; Nielsen-Marsh and Hedges, 2000a; Nielsen-Marsh and Hedges, 2000b; Turner-Walker et al., 2002). Commonly used destructive techniques for determining bone porosity on the nano- and micrometer scale are water sorption analyses and mercury intrusion porosimetry, with the latter technique also being used to determine pore size distribution (Hedges et al., 1995; Nielsen-Marsh and Hedges, 1999). More recently, X-ray-based computed tomography (CT) systems have emerged as complementary tools enabling investigation and visualization of the pore system of bones, albeit so far predominantly only on a micrometer scale. However, an advantage of CT techniques is their non-destructive approach, which allows studying rare or otherwise valuable samples. In addition, CT permits systematic and comparative studies on bone taphonomy before and after experiments, which so far for methodological reasons were based on limited structural and chemical investigations of experimentally altered samples (Blake et al., 1997; Blake et al., 1998; Zazzo et al., 2004; Schwermann et al., 2012; Kohn and Moses, 2013; Keenan and Engel, 2017; Aufort et al., 2019; Caruso et al., 2020; Gäb et al., 2020).
Considering these observations, the determination of the precise conditions under which in particular the microarchitecture of CB is modified is of prime importance, before more detailed investigations of the chemical or mineralogical changes as well as associated transport and reaction processes on the ultrastructural level can be carried out. Therefore, a comprehensive experimental study was here conducted aimed at investigating the influence of aqueous alteration on CB microarchitecture. To this end, novel taphonomy experiments under controlled physicochemical conditions, including selected isotopic and chemical tracers specifically chosen to simulate typical near-Earth surface early diagenetic conditions were performed using samples from an ostrich long bone. In total, 45 CB samples were analyzed using micro-computed tomography (µCT) before and after immersion in different aqueous solutions for various periods of time and at different temperature regimes. Subsequently, the three-dimensional (3D) structural changes induced in the CB samples were quantified. This approach allowed direct comparison of the microarchitecture of a specimen before and after each experiment, which was deemed to be of importance, in particular because bones are heterogenous materials even at the micrometer scale. To this end, the highly complex processes of early bone diagenesis were narrowed down to few, but fundamental and scalable parameters in order to create a controllable experimental setting. The acquired data are intended to form a solid base for future high-resolution imaging and spectroscopic investigations of isotopic, chemical, and mineralogical changes occurring during the early diagenesis of bone.
Materials and Methods
Cortical Bone Samples
Forty-five samples of CB from a long bone of a single adult specimen of common ostrich (Struthio camelus Linnaeus, 1758) were analyzed. The bone was obtained from a five-year-old male individual raised on an ostrich farm. The diaphyseal part of the right tibia (Figure 1A) was defleshed, cleaned, and stored in a fridge at 8°C. Using a hollow diamond drill, cylindrical samples were obtained from the bone’s cortex (Figure 1B). In order to cut the samples into standardized length, they were first embedded in the fast-drying resin Technovit 5071 (Kulzer Technik, Wehrheim, Germany), then sawn and ground to the correct size before the resin was dissolved using ≥99% acetone. Finally, all CB samples were rinsed with Milli-Q water and treated in an ultrasonic bath for about 3 min. The samples had an average height of 3.49 ± 0.01 mm and an average diameter of 3.44 ± 0.01 mm. Thus, the surface-area-to-solution-volume ratio was very similar in all experiments. The weight of each sample was on average 65.8 ± 0.1 mg. Detailed information on each sample prior to the experiments is provided in Supplementary Material S1.
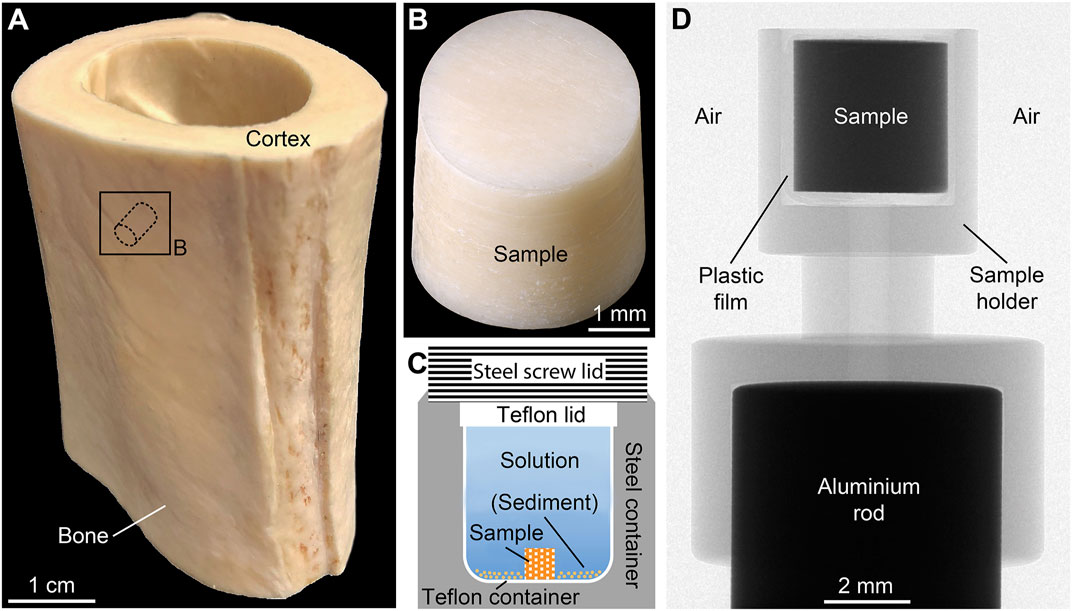
FIGURE 1. Preparation and micro-computed tomography (µCT) scanning of cortical bone samples. (A) Diaphyseal part of the ostrich tibia with representative sampling location. (B) Cortical bone sample drilled perpendicular to the growth direction. (C) Reaction steel container with inner Teflon container and sample position. (D) X-ray image of the custom-made sample holder used for µCT scanning showing the orientation of the sample.
Experimental Solutions and Sediment Composition
Three different experimental solutions were used for the alteration experiments. The basic composition of these aqueous solutions was chosen to reflect those of the two most abundant, but distinctly differing types of water on earth, i.e., freshwater and seawater. Furthermore, a range of ions relevant in early diagenetic settings was added to these stock solutions (Table 1). For preparation of the solutions all solid constituents were milled by hand, dissolved in Milli-Q water, stored for 1 d at 21°C, and then filtered to remove any precipitate or non-dissolved fines using Whatman cellulose filters with medium to fine particle retention between 4 and 7 μm at grade 595 (Merck KGaA, Darmstadt, Germany). Then, the solutions were stored for another 2 d at 21°C to verify whether they remained in equilibrium.
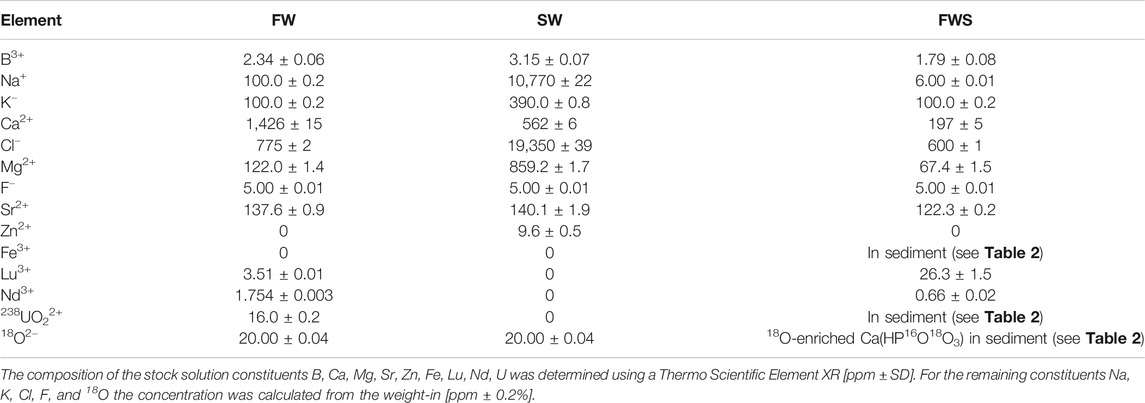
TABLE 1. Element concentrations of the freshwater (FW), seawater (SW), and the freshwater plus sediment (FWS) stock solutions.
The first solution had a freshwater-like composition (hereinafter referred to as FW), i.e., low salinity (ca. 1 g/kg), low Fe content, a relative enrichment in Lu and Nd (as representative heavy and light rare earth elements, respectively), and a pH of 7.40 ± 0.06 at 21°C. Furthermore, 18O-enriched water with 97 atom-% 18O (Rotem GmbH, Leipzig, Germany) and uranyl nitrate, UO2(NO3)2, with a depletion level of 0.22% 238U (International Bio-Analytical Industries Inc., Boca Raton, FL, United States) were added as isotopic and chemical tracers, respectively.
The second solution had a composition resembling seawater (hereinafter referred to as SW) with a salinity of about 30 g/kg, a pH of 8.04 ± 0.06 at 21°C, and added H218O as isotopic tracer, but without rare earth elements and uranyl nitrate. Here, H218O was used to detect potential apatite growth or the formation of secondary oxygen-bearing minerals.
The third solution was very similar to FW, but here artificial sediment was added (hereinafter referred to as FWS), and the solution was prepared without uranyl nitrate and H218O to ensure that the sediment was the only possible source of 18O or U, thus resulting in a slightly lower pH of 7.16 ± 0.06 at 21°C. The artificial sediment consisted of quartz (SiO2), albite (NaAlSi3O8), pyrite (FeS2), 18O-labelled calcium phosphate [Ca3(PO4)2], and uranyl nitrate (Table 2). The sediment was used to trace potential mineral growth involving elements that are continuously provided by the dissolution of the mineral phases in the artifical sediment.
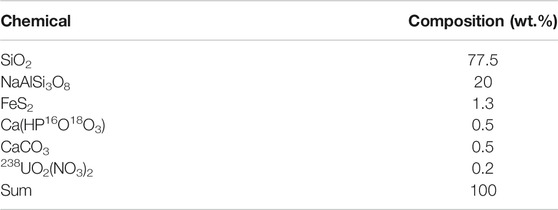
TABLE 2. Composition of the sediment used in all FWS experiments.
Experimental Setup
Each CB sample was placed inside a custom-made Teflon container filled with 2 ± 0.02 ml of the FW or SW solution. The Teflon containers were cold-sealed with a Teflon lid and placed in custom-made steel containers (Figure 1C). For sediment-bearing experiments (FWS), 0.5 g of the artificial sediment was added to the Teflon container, which was then topped up with 3.10 ± 0.02 ml of the solution. The steel containers were kept in a custom-made oven at 30, 60, or 90°C (±2°C) under autogenous pressure of <5 bar. The temperature near the steel containers was constantly monitored using a VC 840 digital multimeter (VOLTCRAFT, Hirschau, Germany). The experiments conducted at 30°C lasted 1, 14, and 30 d, while the experiments at 60 and 90°C lasted 1, 3, 7, 14, 21, and 30 d. The additional run durations of 3, 7 and 21 d were introduced, because more significant changes were expected to occur at elevated temperatures. After terminating each experiment, the CB samples were washed with Milli-Q water and air-dried under a laboratory hood for 2 d at 21°C. All samples were weighted prior to and following the experiments with a precision of ±0.0002 g (Supplementary Materials S1–S3). Furthermore, after termination of each experiment the pH of all experimental solutions was determined at 25°C with a 2-sigma reproducibility of ±0.06 log units. Finally, the solutions were transferred into 10 ml plastic tubes and stored at 8°C for further analysis.
With regard to temperature, 30°C was chosen to reflect typical temperature ranges for pre-burial and near-Earth surface post-depositional aqueous or sedimentary settings during early diagenesis. Previous studies had shown that a temperature of 60°C accelerates the aging process of bone artificially without denaturing unmineralized collagen (Waite et al., 1997; Turner-Walker, 2011). The 90°C scenario should be considered separately as it would correspond to a burial depth of about 3 km - when assuming a typical geothermal gradient - which is an unrealistic scenario within the first month after exposure of bone to the environment. However, the main intention of this experiment was to accelerate aging of the samples and not to simulate a realistic early diagenetic scenario. Experiments under more elevated temperatures have already been used to provide indications of how the alteration process may develop over longer durations (Dobberstein et al., 2009; Abdel-Maksoud, 2010), although at higher temperatures reactions and transport processes may be activated within the experimental time scales that are not activated at low temperatures, e.g., hydrolysis of collagen.
We also note here that our experimental approach did not consider all of the many factors controlling early diagenetic bone alteration. For example, during the initial stage of bone fossilization, microbial attack is known to contribute to the decay of collagen, thus providing pathways for aqueous fluids into the bone. However, the main focus of our study was to investigate the effects of aqueous alteration on the microarchitecture of CB under controlled physicochemical conditions. Hence, the initial stage of fossilization including microbial activity was skipped to achieve a controllable experimental setup. But, we have unavoidably changed the accessibility of CB to fluids by drilling out cylindrically shaped samples from the cortex. Day 0 in our experimental setup thus represents the beginning of interaction between bone and an aqueous solution.
Micro-Computed Tomography
A SkyScan 1272 desktop µCT system (Bruker microCT, Kontich, Belgium) with a detector size of 4,904 px × 3,280 px (down sampled to 2,452 px × 1,640 px) was used to scan all CB samples before and after the experiments. Thus, each sample is its own reference. To ensure comparable scanning conditions in air and to avoid movement artifacts during scanning, samples were placed inside a custom-made sample holder mounted on an aluminum rod (Figure 1D) and fixed using thin Parafilm M plastic film (Merck KGaA). Scanning parameters were: 70 kV source voltage, 142 µA source current, 0.5 mm aluminum filter, 3,154 ms exposure, 0.2° step size over 180°, no frame averaging, 1 h 9 min 6 s acquisition time, and 3 µm isotropic voxel resolution. The reconstruction software NRecon 2.0.3.7 (Bruker microCT) was used to convert the X-ray projections into 16-bit tagged image file format (TIFF) image stacks. Subsequently, the software CTAn 1.18.4.0+ (Bruker microCT) was used for image processing and quantitative 3D analysis. Detailed information about data reconstruction and processing is provided in Supplementary Material S4.
Determination of Cortical Bone Parameters
A total of ten standard CB parameters was determined from the µCT scans for all samples using the software CTAn (Bruker microCT). Parameter labeling and description comply with standardized nomenclature (Parfitt et al., 1987). To complement these ten standard CB parameters, the software Amira 6.1 (Thermo Fisher Scientific, Waltham, MA, United States) was used to quantify two additional, new parameters: the reaction rim volume (Rr.V) was calculated using a global threshold applied to the two-dimensional (2D) X-ray projections of each sample to separate areas with higher grey values, and the reaction rim fraction (Rr.F) was determined by dividing Rr.V with bone volume (Table 3).
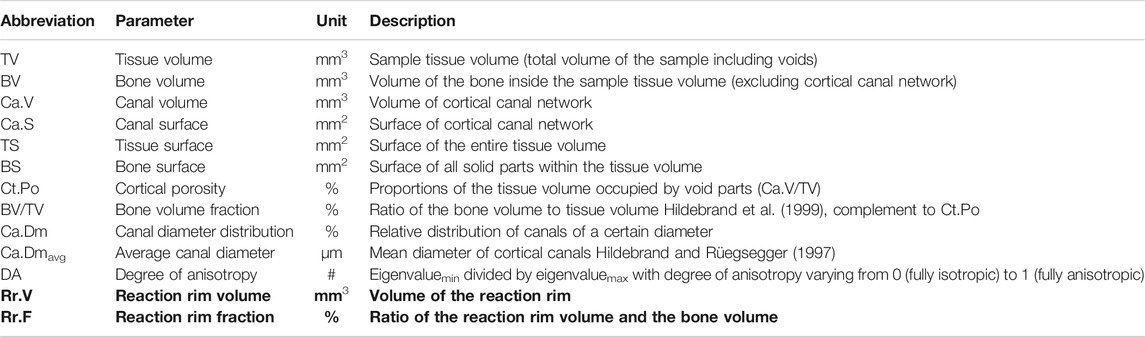
TABLE 3. Description of the ten standard and two new (in bold font) parameters used for quantitative 3D analysis of cortical bone.
Error Estimation for Cortical Bone Parameters
To obtain a measure of the natural variation of the CB parameters, the dataset comprising all unaltered CB samples was statistically analyzed (Table 4). All CB parameters were first tested for their normality distribution using the Shapiro-Wilk test: in all but one case, the hypothesis that the data are normally distributed was rejected at a confidence level of 95%, which in some cases may reflect multimodal distributions, but otherwise indicates strong natural variation in the microarchitecture of the cortex from a single ostrich long bone. This is insofar of importance, as here new CB samples had to be used for each experiment in an experimental series aimed at investigating temperature, time, and solution composition dependency of the reaction and transport processes involved in aqueous alteration of CB. Therefore, each CB sample was scanned before and after the experiments, which, for each individual sample, allowed to quantify the experimentally induced changes, i.e.,
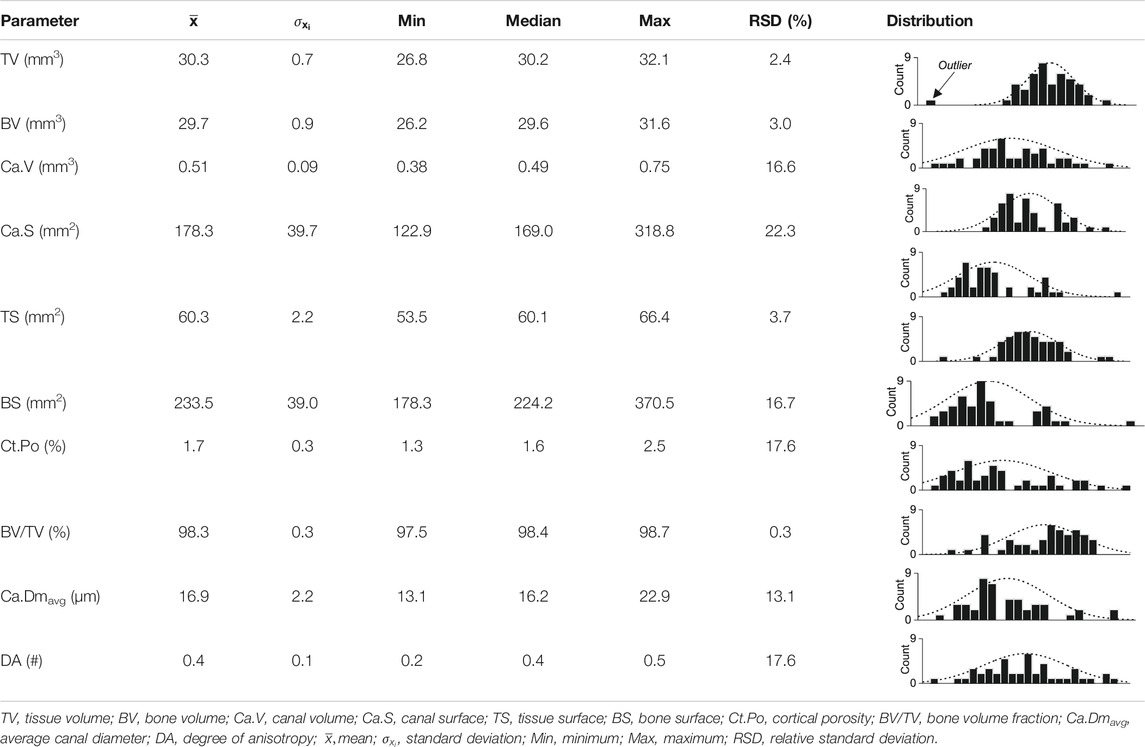
TABLE 4. Statistical evaluation of the natural variation of bone parameters from 45 pristine cortical bone samples.
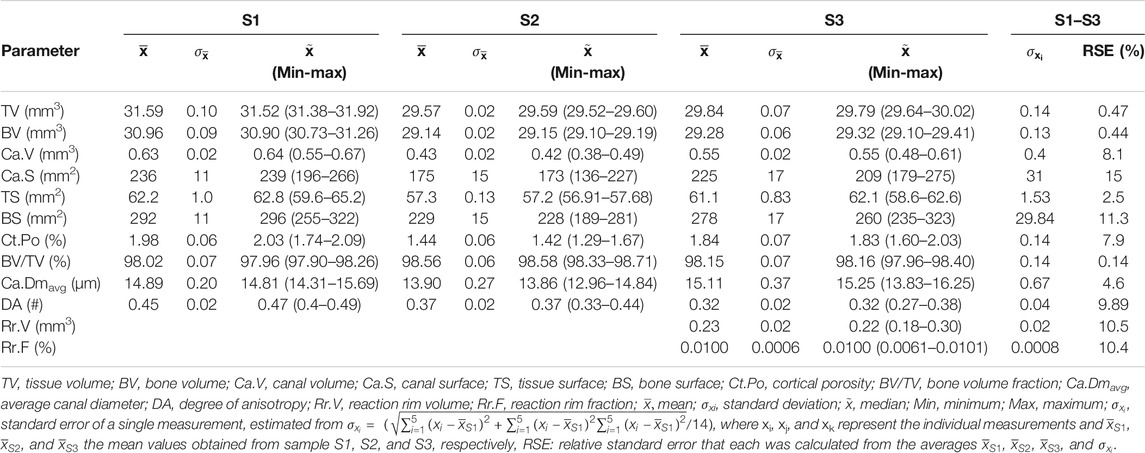
TABLE 5. Cortical bone parameters of three selected altered samples (S1–S3) that were repeatedly scanned and analyzed (n = 5).
Beam Hardening Artefacts
Finally, it was tested whether the reconstructed image stacks were affected by beam hardening artefacts, which would have influenced the grey-scale distribution and consequently the quantitative analysis. The linear attenuation coefficient describes the ability of an X-ray beam to pass through a sample. If this coefficient is plotted as a function of position across a virtual section or an image stack of a single sample, it is possible to test whether potential deviations from a linear distribution occur (Stock, 2020). None of the two randomly picked CB samples, one pristine and one altered, showed beam hardening artefacts (Supplementary Material S5).
Results
Initial Characterization of Cortical Bone Microarchitecture
To illustrate changes in the ten standard and two new CB parameters, the microarchitecture of all samples was initially characterized quantitatively (Supplementary Material S1). The obtained 2D µCT images permit distinguishing qualitatively between the following structures: CB material vs. air surrounding the sample as well as cortical canals with differently sized diameters (Figures 2A,B). Large canals were identified as either Haversian canals running parallel to the bone’s surface or Volkmann canals oriented perpendicular to the bone’s surface and connecting Haversian canals. In turn, small canals were identified as either Haversian or Volkmann canals in an early stage of development, or as lacunae. Canaliculi were very likely not detected at the isotropic voxel resolution obtained here, i.e., 3 µm. A 3D volume rendering of a representative sample (Figure 2C) illustrates the overall compactness of the CB samples as well as the extent of the canal network, with an average bone volume fraction (BV/TVavg) and cortical porosity (Ct.Poavg) of 98.3 ± 3.0 and 1.7 ± 0.3%, respectively.
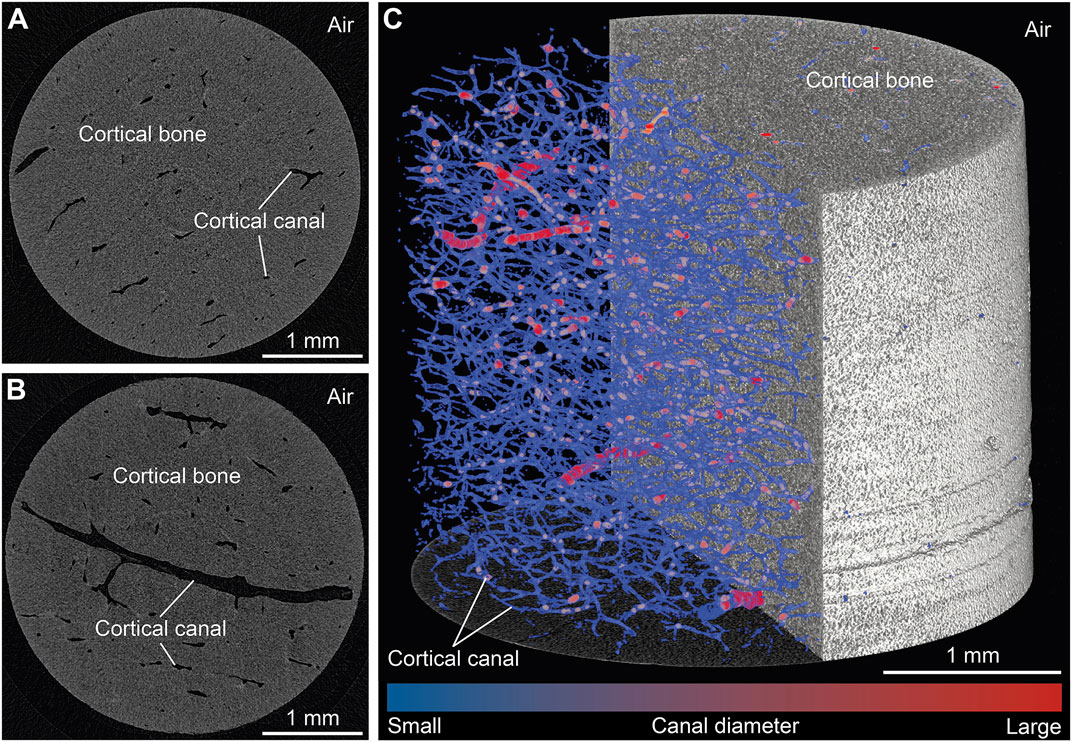
FIGURE 2. Visualization of representative results from micro-computed tomography scans of pristine cortical bone samples obtained with 3 µm isotropic voxel resolution. (A,B) Two selected virtual sections oriented perpendicular to the growth direction. (C) Volume rendering of a selected sample and its cortical canal network.
Because reference data for quantitative µCT analysis of CB from an ostrich, whether pristine or altered in aqueous solutions were lacking, it was here only possible to compare the initially acquired dataset with quantitative µCT data of untreated CB from humans, rats, and mice. Osteoporosis studies have previously shown that the Ct.Po in male vertebrates is distinctly lower than in females and in the latter increases strongly with age (Feik et al., 1997; Cooper et al., 2007; Uppuganti et al., 2016; Pietmontese et al., 2017). Because the CB samples used here were all taken from a five-year old male ostrich individual, Ct. Po should not be significantly affected by age-related changes. Furthermore, the Ct.Poavg value of 1.7 ± 0.3% from all CB samples analyzed here is significantly lower than the Ct.Po determined for the femur in a male human, which was found to range between 2 and 5% (Feik et al., 1997; Cooper et al., 2007). Similarly, the Ct.Po of the tibia in male rats is on average 2.76% (Britz et al., 2010) and in male mice approximately 2% (Hemmatian et al., 2017; Piemontese et al., 2017). However, in the present study, only the Ct.Po of part of the diaphysis of the tibia was considered, whereas in most osteoporosis studies Ct.Po of the entire femur or tibia was determined, thus resulting in an overall higher porosity. Therefore, the real Ct.Poavg of the ostrich CB may in fact be higher.
Gravimetric Changes
The weight of the samples after the experiments differed significantly among each other and partly from their initial weight (Supplementary Materials S2, S3). Temperature had the strongest impact on the extent of weight loss, followed by the type of solution. This is illustrated by the change in weight (wt.%) as a function of the reaction time (d), temperature (°C), and type of experimental solution (Figure 3). In general, the smallest change in weight was observed for experiments performed at 30 and 60°C (∆Weightavg = ± 2.0 ± 0.2%), irrespective of the experimental duration. Only the more elevated temperature of 90°C caused substantial weight loss over time. However, SW samples experienced distinctly less weight loss than FW samples, even at 90°C (∆Weight30d = −3.8 ± 0.2%). Samples from both freshwater experiments (FW, FWS) reached a much higher value already after 7 d at 90°C and both showed a significant weight loss after 30 d (FW = −17.5 ± 0.2%, FWS = −18.1 ± 0.2%).
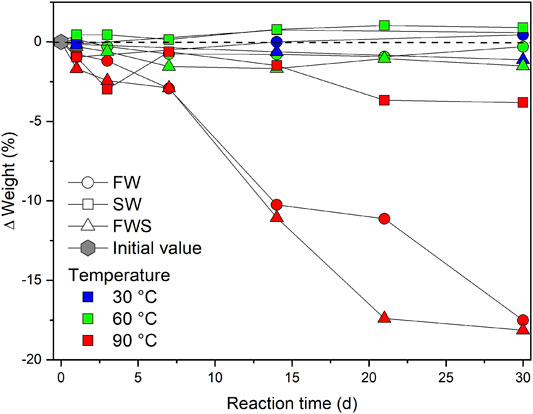
FIGURE 3. Weight loss over time expressed as difference in percent from the initial weight. Zero on the y-axis represents the respective initial weight. Values below or above the dashed reference line reflect a decrease or increase in weight, respectively. Error bars are smaller than the symbols.
Development of the Solution pH
Chemically, the experimental solutions differed from each other primarily by their different proton activity (Figure 4). FW experiments started with an initial pH of 7.40 ± 0.06 and recorded an overall increase (Figure 4A). The pH of solutions from the 30 and 60°C experiments developed in a similar way, increasing within the first 14 d until reaching a maximum pH of 7.76 ± 0.06 and 7.91 ± 0.06, respectively, before both temperature series leveled off at a pH of approximately 7.7. However, at 90°C pH increased after 1 d by about 0.25, but then dropped over time, resulting in a final value similar to the initial pH (∆pH = −0.07 ± 0.06). Here, a strong linear correlation of r = 0.7 (sensu Cohen, 1992) was observed between pH and weight loss over time (Figure 4B).
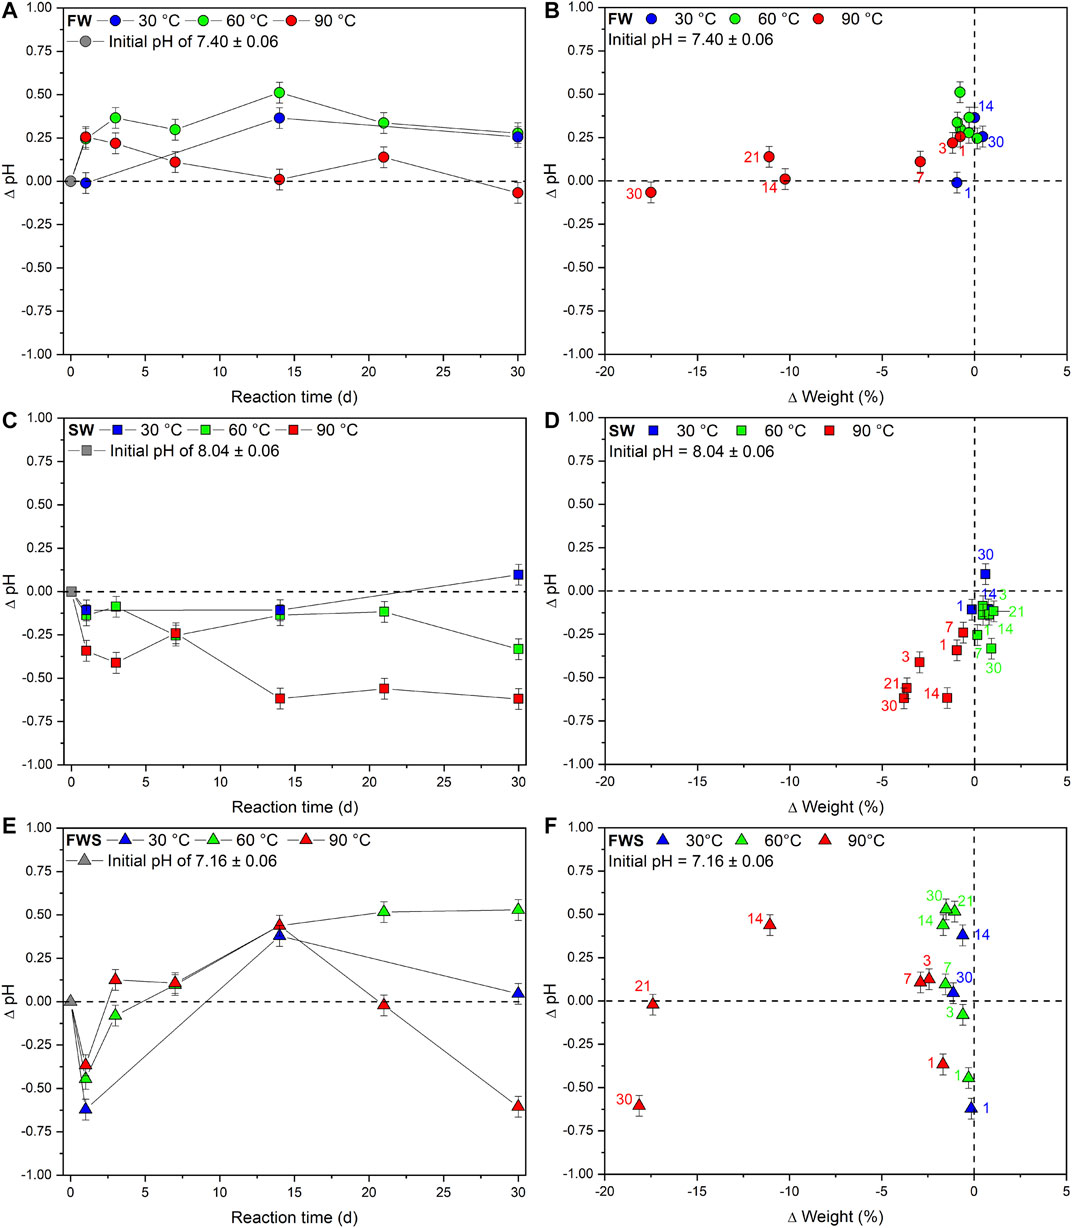
FIGURE 4. Changes in basic experimental parameters observed during the experiments. (A, C, E) Changes in pH over time as absolute difference from the initial pH of the respective experimental solution. (B, D, F) Changes in pH relative to the change in weight. Colored numbers denote the respective reaction times in days. In all cases the x error bars are smaller than the symbols. The dashed reference lines represent the initial value of each data point.
The initial pH of 8.04 ± 0.06 of the SW solution decreased in all but one experiment (Figure 4C). The pH in the 30 and 60°C series did not decrease at any point for about 0.3 log units, whereas pH of the 90°C experiments decreased over time, which was again positively correlated with weight loss, although no clear time dependency was observed (Figure 4D). However, after an experimental duration of 30 d, temperature-related differences became apparent: ∆pH30°C; 60°C; 90°C = +0.10; −0.33; −0.62.
In FWS experiments, pH developed entirely different from the other two solutions (Figure 4E). After 1 d, a significant decrease of the initial pH of 7.16 ± 0.06 occurred at all temperatures (∆pH30°C; 60°C; 90°C = −0.62; −0.44; −0.36). This was followed by an inversion of the trend until a maximum was reached at 14 d. Afterward, pH of the different temperature series diverged and developed differently. At 30°C, it dropped again and after 30 d reached a level slightly higher than the initial pH (∆pH = +0.05). The rise of pH in the 60°C experiments slowed down noticeably and leveled off at ∆pH = +0.5 after 30 d, while in 90°C experiments pH declined to ∆pH = −0.60 after 30 d. The reaction time in combination with the added sediment seemed to have an influence on pH development, although no obvious temperature dependency or connection to weight loss was identified (Figure 4F).
Experimentally Induced Microarchitectural Changes
Changes in the Degree of Anisotropy
Initially, the degree of anisotropy (DA) ranged from 0.24 to 0.53, with a median of 0.4 (Supplementary Material S1). This is indicative of an isotropic (DA = 0) rather than an anisotropic (DA = 1) CB microarchitecture. After the experiments, no noticeable changes of DA were observed, while only a slight shift of the minimum value to 0.27 was observed (Supplementary Material S2). Due to a strong linear dependency between ∆DA and the initial DA, it was not possible to establish a link between the observed differences of DA and the experimental parameters time, temperature, and solution composition.
Changes in Canal Diameter Distribution
To characterize the shape extent of the cortical canal network, the distribution of the canal diameters was determined using an interval of two pixels—one pixel being 3 × 3 µm-and was given as the percentage share of canals of a certain diameter, i.e., the canal diameter (Ca.Dm) distribution. The Ca.Dm distribution was determined for each CB sample before and after the experiments (Supplementary Material S6). The initial and final Ca.Dm distribution of all samples (n = 45) as well as the absolute change for each temperature series (∆Ca.Dm) were plotted. The range of the Ca.Dm distribution covers canals with diameters ranging from 3 to 123 μm, separated into classes of 6 µm each.
The overall Ca.Dm distribution before and after the experiments does not differ significantly from each other (Figure 5A). The general pattern can be described as a strong linear decrease of the percentage of the canal classes with increasing Ca.Dm. Canals with diameters ≤15 µm accounted for the majority of the cortical canal network before and after the experiments (Figure 5A) and reported the strongest change as well (Figure 5B). The Ca.Dm distribution of canals ≥15 µm is characterized by a moderately decreasing number of canals with increasing diameter, showing only little changes. In a transition zone between 42 and 54 μm, the curves strongly flatten and approach percentages of ≤2% and then remain relatively unchanged. Following the experiments, extremely high or low values were absent, thus leading to a more centered distribution.
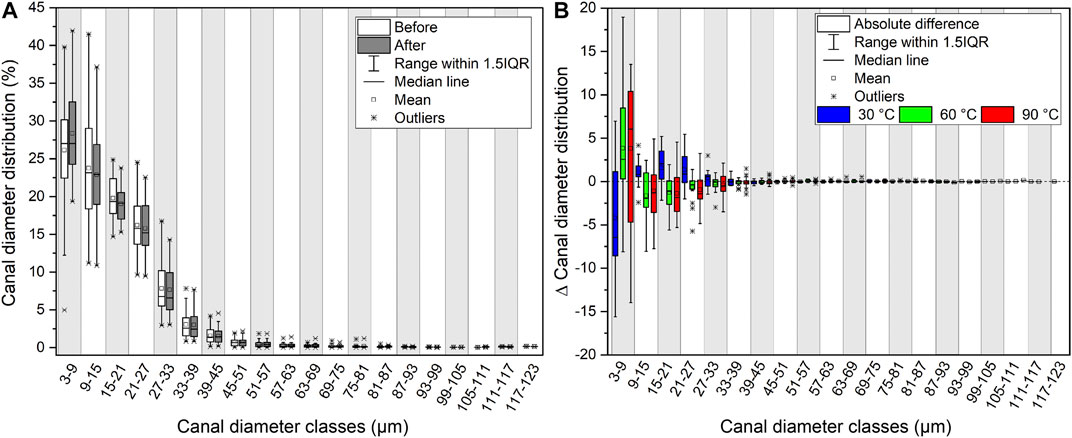
FIGURE 5. Changes in canal diameter distribution. (A) Canal diameter distribution (%) for every sample scanned before and after the experiments (n = 45) shown in classes of 6 µm range each. (B) Difference of the percentage share of each canal diameter class before and after the experiments. The differences in canal diameter of each class are displayed for the three temperature series 30°C (n = 9), 60°C (n = 18), and 90°C (n = 18).
A contrasting development of the Ca.Dm distribution related to temperature was observed. The number of the smallest canals (Ca.Dm = 3–9 µm) was clearly rising with increasing temperature, while larger canals displayed the opposite development (Figure 5B). However, neither the duration of the respective experiments nor the type of solution clearly affected the development of the Ca.Dm distribution.
Changes in Cortical Porosity
In the present study, Ct.Po represented the entire volume of the cortical canal network, including Haversian and Volkmann canals as well as lacunae. At 3 µm isotropic voxel resolution, canaliculi - minute canals with diameters <0.5 µm (Reilly et al., 2001) - were below the detection limit, presumably resulting in an underestimation of the total number of small canals.
In FW solutions, Ct.Po instantly dropped for about 10% at 30°C, but remained on this level over the following 30 d (Figure 6A). At 60°C, Ct.Po rose until it reached a maximum of 30% after 14 d, followed by a decline to 10% after 30 d. At 90°C, following a distinct decrease of Ct.Po directly after 1 d to −15%, Ct.Po steadily increased until a final Ct.Po of 15% was reached.
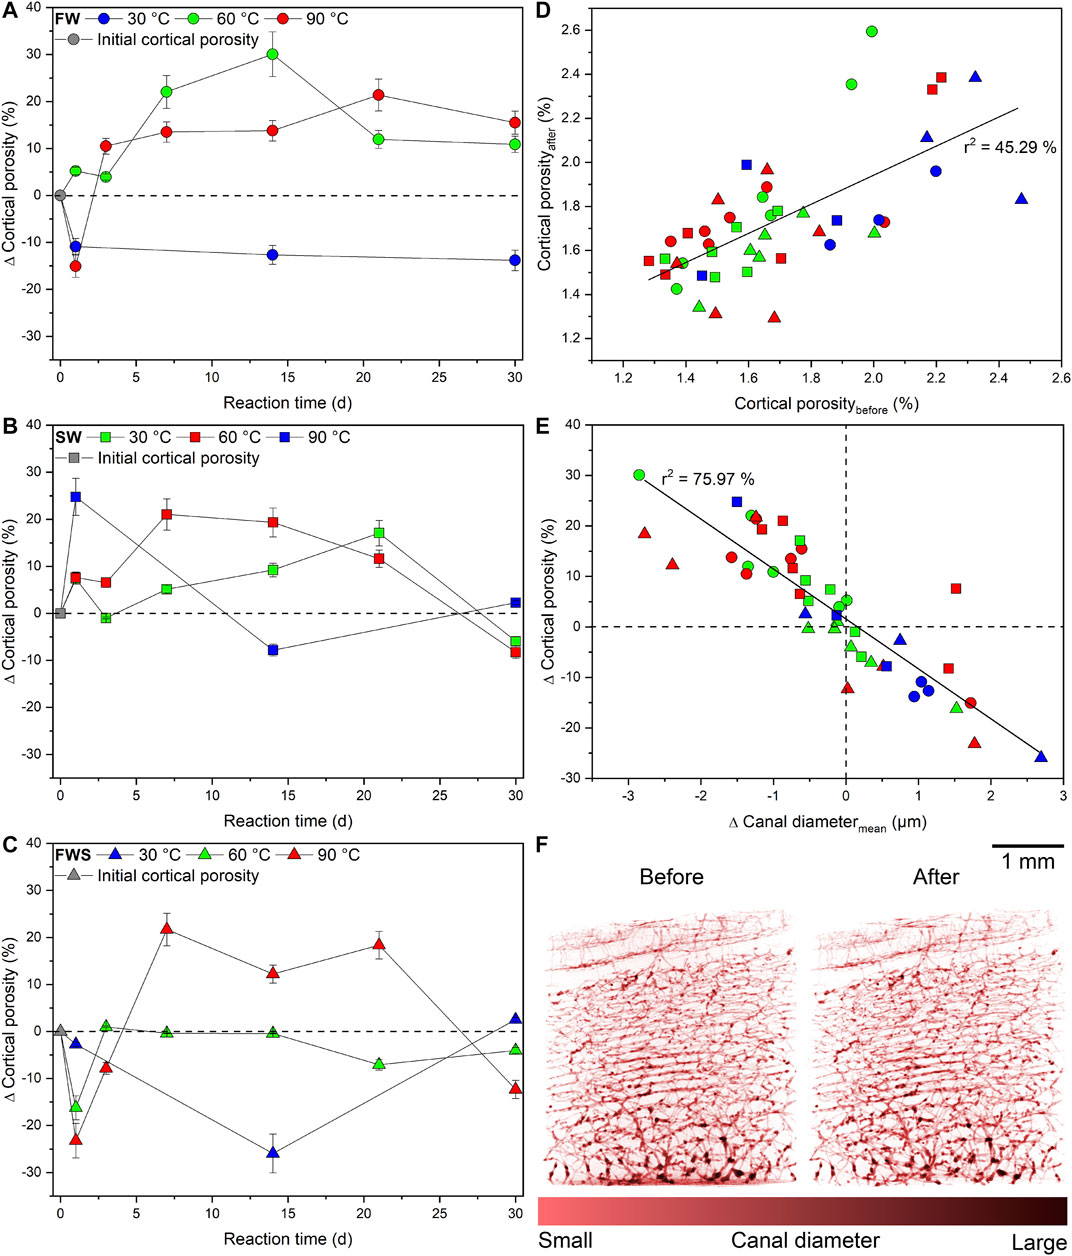
FIGURE 6. Changes in cortical porosity observed during the experiments. (A-C) Changes in cortical porosity given as percentage difference from the initial value as a function of time with 2-sigma error bars. (D) Relationship between the cortical porosity before and after the experiments. (E) Differences in cortical porosity as a function of the average canal diameter of each sample. (F) Comparative volume renderings of the cortical canal network from the sample with the most significant observed quantitative changes in cortical porosity before and after the experiment (FWS, 30°C, 14 d). The dashed reference lines in (A-C, E) represent the initial value of each data point. Fitted linear functions are displayed as a straight line.
Samples of the SW series showed a significant increase in Ct.Po of about 20–25% at 30 and 90°C (Figure 6B), moderately over time at 60°C (∆Ct.Pomax = 17%), but then all values dropped back to the initial level measured at 30°C and even lower at higher temperatures (∆Ct.Po ≈ −10%).
In contrast, directly after 1 d, a significant pore space reduction with increasing temperature was observed in FWS samples (Figure 6C). Over time, for the 30°C experiment, a pronounced negative peak in the pore space development occurred at 14 d (∆Ct.Po = −26%), whereas at 60°C, Ct.Po rose and then remained constant at or slightly below the initial value over time. After 7 d, the loss of bone material was higher at 90°C than the degree of dissolution, but again declined after 30 d (∆Ct.Po = −12%). In addition, the 30 and 60°C samples terminated after 30 d had Ct.Po values similar to their initial values.
A moderate linear correlation with a squared correlation coefficient of r2 = 45.29% was observed between the initial and final Ct.Po (Figure 6D), indicating that the initial Ct.Po partly influenced pore space development during the experiments. Furthermore, the difference of the average Ca.Dm (∆Ca.Dmavg) and ∆Ct.Po were very strongly linearly correlated (r2 = 75.97%), i.e., a decreasing Ct.Po was accompanied by an increase of Ca.Dmavg (Figure 6E). Volume renderings of the cortical canal network of the sample with the most significant quantifiable change in Ct.Po before and after the experiment illustrate that even ∆Ct.Po values of up to ± 30% are below the visual detection limit (Figure 6F).
Finally, plots of ∆pH and ∆Weight against ∆Ct.Po revealed that only for the FW experiments at 90°C, pH and sample weight were decreasing with increasing duration and increasing ∆Ct.Po (Figures 7A,B). This correlation could not be detected in any other experimental series (Figures 7C–F). We also noted that those samples that were reacted at the same temperature in FW and SW solutions did tend to plot together, but not those samples that reacted in the FWS solutions.
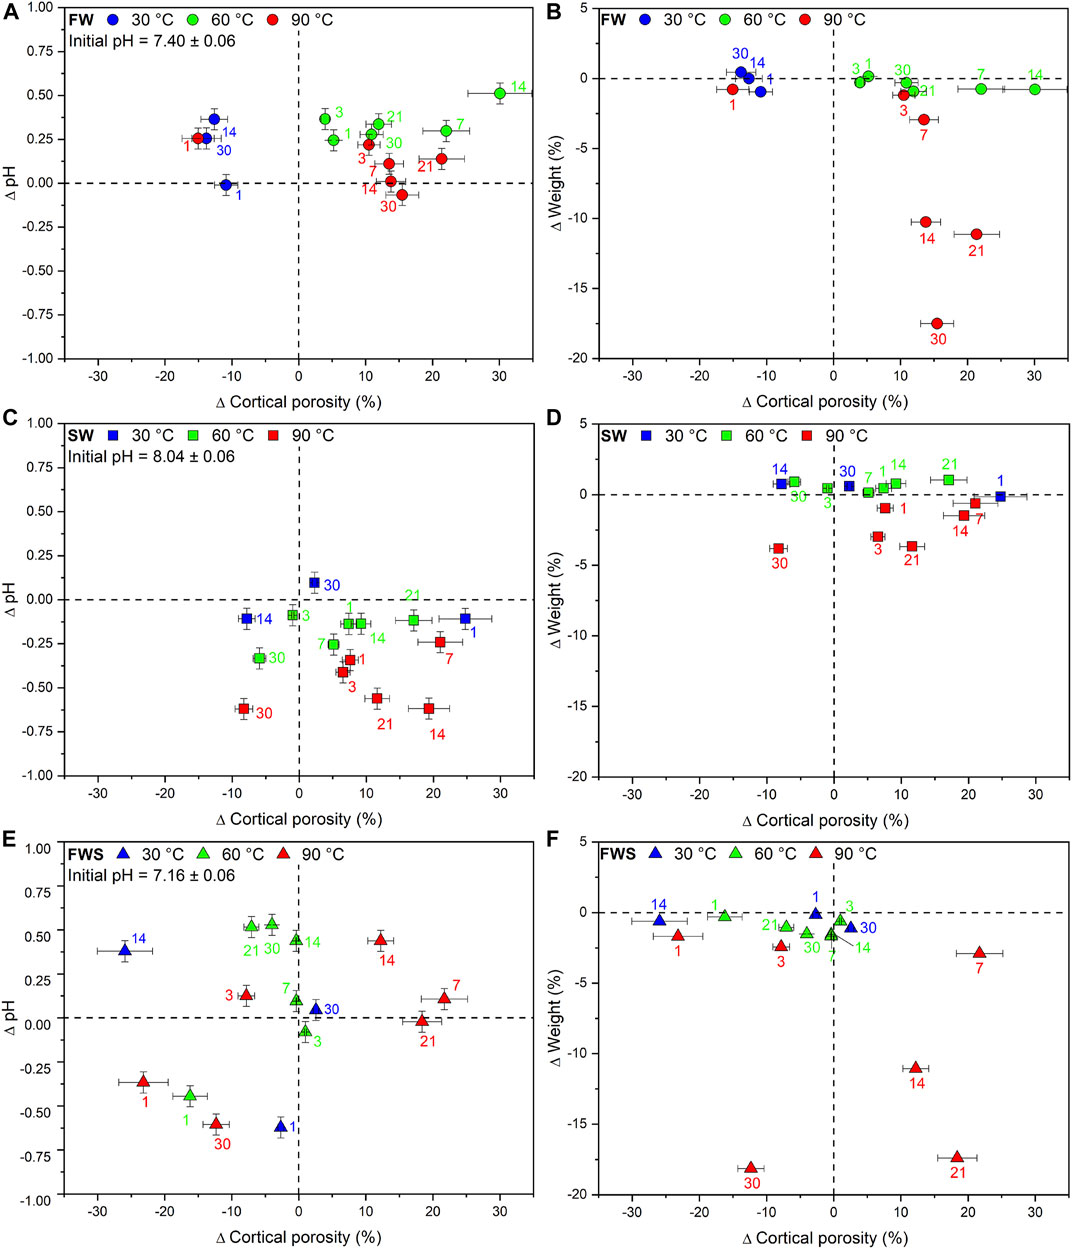
FIGURE 7. Changes in cortical porosity observed during the experiments shown for each type of experimental solution (FW, SW, FWS) and temperature regime (30°C, 60°C, 90°C). (A, C, E) Difference in cortical porosity as a function of pH. (B, D, F) Difference in cortical porosity as a function of weight. Error bars represent the estimated 2-sigma standard deviation (see Table 5). Error bars of the weight loss data points are smaller than the symbols. The dashed reference lines represent the initial value of each data point.
Formation of a Reaction Rim
An important observation during this study was that the majority of the experiments based on FW and FWS solutions resulted in the formation of an unevenly distributed rim (here termed the reaction rim, Rr) that was visible in 3D µCT virtual sections in the form of a bright zone of varying thickness (up to 20 µm) surrounding each sample (Figure 8A). In samples exposed to the SW solution, such a reaction rim was absent. The distinctly different grey-scale values characterizing this reaction rim (Figure 8B) enabled determining the reaction rim volume (Rr.V), which ranged from 0.01 to 0.48 mm3 as well as the reaction rim fraction (Rr.V/BV = Rr.F) (Supplementary Materials S2, S3). A combined volume and surface rendering approach was used to illustrate the shape of the reaction rim (Figure 8C); note that fine-scale marks on the sample surface resulting from drilling are still visible following the respective experiments. Rr.F ranged from 0.02 to 1.67% (Figures 9A–C). Samples from both freshwater series (Figures 9A,C) showed a distinct increase of Rr.V over time (FW and FWS: Rr.Fmax = 1.24% and 1.67%, respectively). These data indicate that in FW and FWS experiments the reaction time influenced the development of the thickness of the reaction rim, although no clear correlation with temperature or ∆pH was observed (Figures 9D,E). To independently verify the presence and extent of the reaction rim as well as to document the visually undetectable changes in CB microarchitecture, a backscattered electron (BSE) micrograph of a representative cut sample was made (Figure 9F).
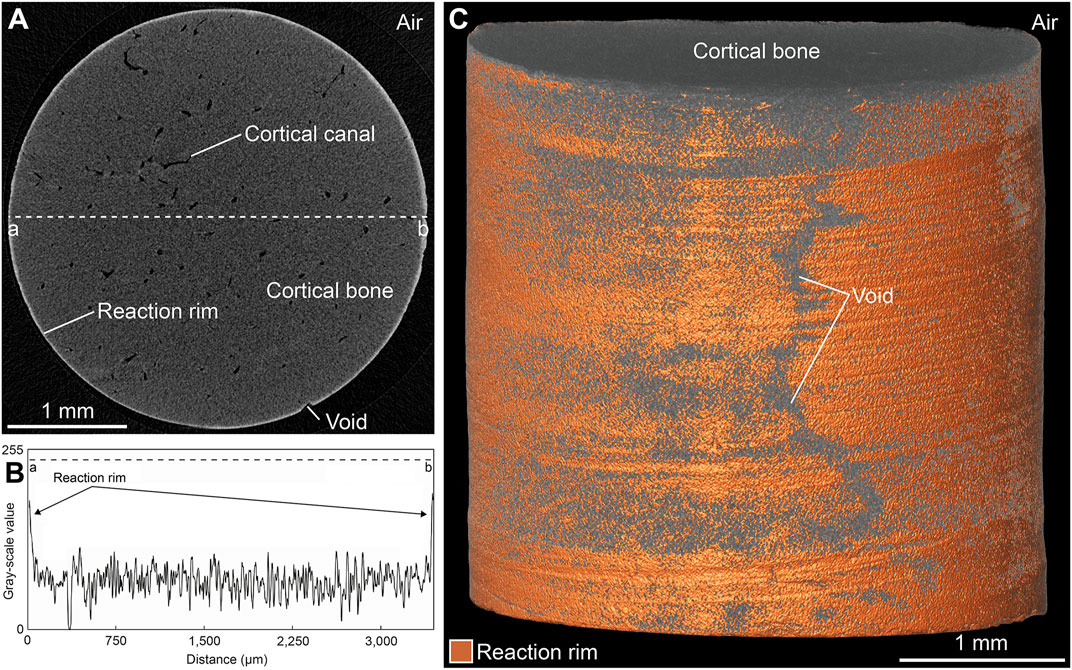
FIGURE 8. Visualization of the reaction rim found in FW and FWS samples following the experiments. (A) Virtual section of a representative sample. (B) Grey value distribution of a line from point a to b as indicated in (A). (C) Combined volume and surface rendering of the sample virtually sectioned in (A) illustrates an unevenly distributed reaction rim. Note the presence of areas not possessing a reaction rim (“void”).
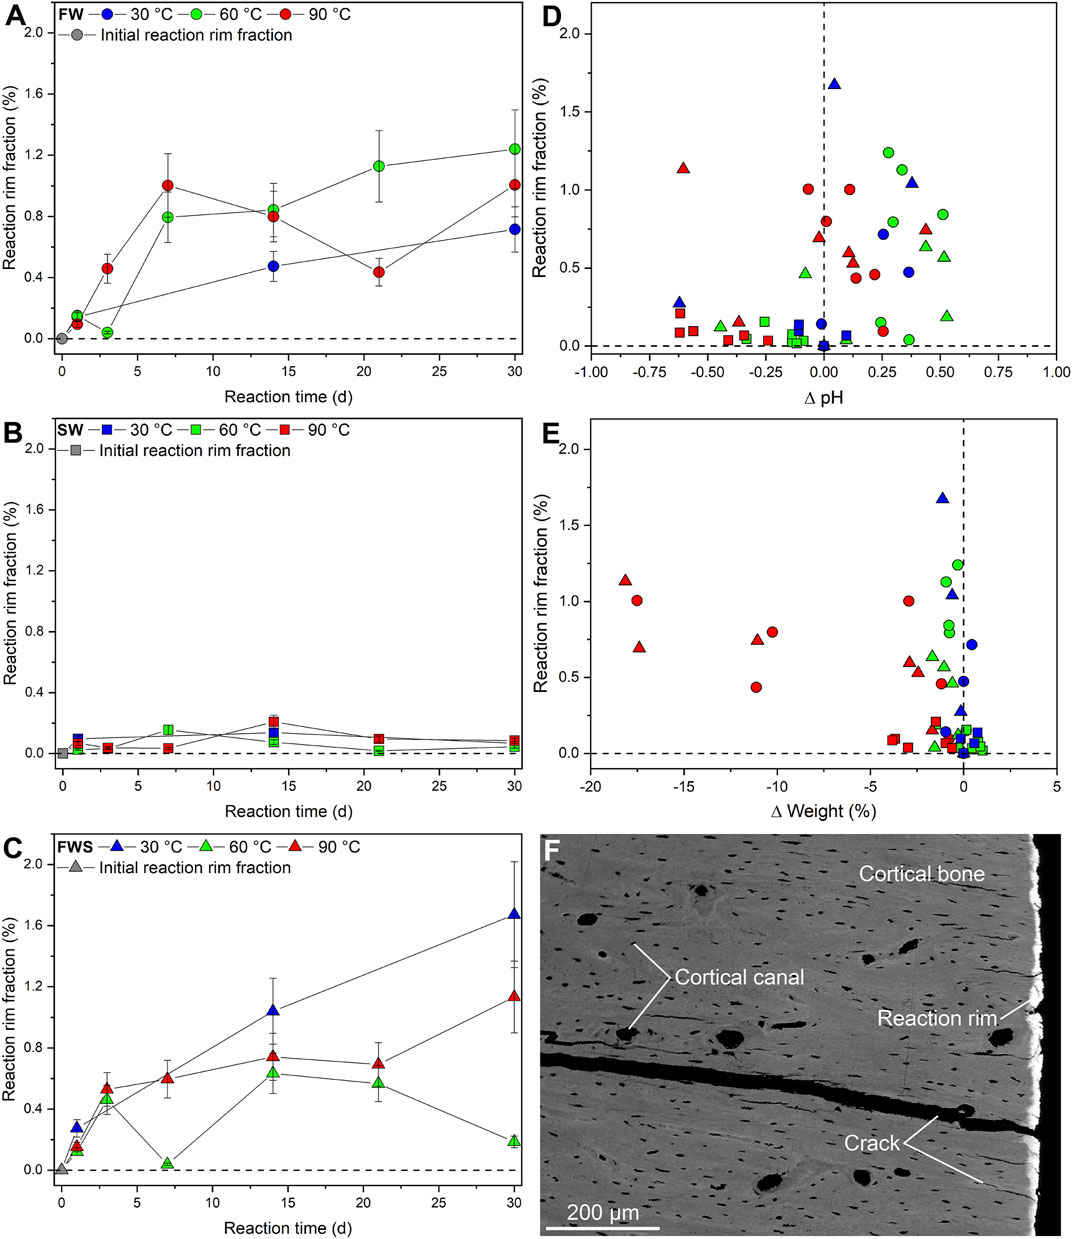
FIGURE 9. Changes in the reaction rim observed during the experiments. (A-C) Development of the reaction rim fraction as percentage of the bone volume over time. (D,E) Reaction rim fraction plotted against changes in pH and weight. Error bars of the reaction rim fraction represent the estimated 2-sigma standard deviation (see Table 5). The weight loss errors are smaller than the symbols. (F) Backscattered electron micrograph of a representative sample altered in the FW solution. Note the presence of the reaction rim and the absence of notable changes to the overall microarchitecture of the cortical bone.
Discussion
The present study represents the first comparative, µCT-based, quantitative 3D characterization of CB experimentally altered under controlled physicochemical conditions. The in vitro experiments conducted here were intended to study processes that occur under early diagenetic conditions typically encountered in terrestrial, fluvial, or marine depositional settings. They were further aimed at investigating whether diagenesis-induced changes do occur on a micrometer scale already after a short period of time, and precisely which diagenetic parameters could be responsible for the modifications or loss of information stored in the organic and inorganic phases of CB. To allow for predictions of how these modifications may develop over longer periods of time, elevated temperature regimes of 60 and 90°C—even though the latter must be considered as unrealistic for most bone fossilization settings—were used to accelerate bone ageing. The ostrich tibia was here selected as it constitutes a good reference for fossilized bone from bipedal, larger terrestrial vertebrates.
Overall, the results show that CB parameters were only slightly modified over a period of up to one month under experimental conditions. The results further suggest that in bone deposited in aqueous milieus post mortem, CB microarchitecture is mostly unaffected by early diagenetic alteration processes on a micrometer scale and thus remains intact. These findings are underlined by the well preserved microarchitecture often observed in fossil bones (Hedges et al., 1995; Hedges, 2002; Trueman and Martill, 2002).
Application of Micro-Computed Tomography in Cortical Bone Research
Here, µCT was used to determine bone parameters that quantify and describe the unaltered CB microarchitecture in three dimensions, but also the modifications induced by aqueous alteration as a function of time, temperature, and solution composition. µCT is an established tool for non-invasive investigations in TB research and has over the last two decades been increasingly used in quantitative analyses of CB microarchitecture (Wachter et al., 2001; Cooper et al., 2003; Cooper et al., 2004; Britz et al., 2010; Campbell and Sophocleous, 2014; Ostertag et al., 2014; Gauthier et al., 2018; Boughton et al., 2019; Fournier et al., 2019; Caruso et al., 2020). However, in quantitative CB research, this approach still suffers from a number of technical and analytical obstacles, such as the lack of a standardized nomenclature or of guidelines for the assessment of morphological parameters used across different scientific disciplines. Consequently, comparing data generated in different laboratories with widely differing analytical µCT setups can pose a problem (Cooper et al., 2007, 2016; Bouxsein et al., 2010). In addition, µCT has thus far only rarely been used in experimental taphonomy (Schwermann et al., 2012; Le Garff et al., 2017; Gäb et al., 2020).
A noticable technical challenge is presented by the small diameter of canals in CB compared to TB. The diameter of the cortical canals may vary significantly depending on the state of the secondary osteons, which form the Haversian system (Currey, 2012 and references cited therein). Depending on the scanning system used as well as the size of the investigated sample, osteocyte lacunae with diameters between 4 and 10 µm lie within a size range that conventional µCT systems usually cannot resolve due to limitations in spatial resolution. Therefore, only the macroporosity of CB can at present be reliably determined using µCT, but not CB’s meso- and microporosity, which leads to a systematic underestimation of Ct.Po and Ca.Dm distribution as bone parameters (Cooper et al., 2004; Palacio-Mancheno et al., 2014). However, at the 3 µm isotropic voxel resolution achieved here, the bias of Ct.Po is reduced to only 0.15%, whereas Ca.Dm is afflicted with a relatively large bias of −5.73 ± 4.02 µm (Britz et al., 2010). To minimize these technical biases, all CB samples were scanned before and after the experiments. Thus, each unaltered sample represents the reference with which the µCT data of the respective altered sample could be directly compared. Furthermore, the isotropic voxel resolution achieved in the present study did constitute a solid compromise between scan duration and a relatively low bias of CB parameters.
Microarchitectural Changes
In the present study, CB parameters were obtained using previously published guidelines (Cooper et al., 2003; Basillais et al., 2007). From a total of ten standard bone parameters, Ct.Po, Ca.Dm distribution, Ca. Dmavg, and DA were here selected as they best described CB microarchitecture and its modifications (Table 3).
Because the canal network acts as a major pathway for fluids penetrating CB, initial modifications due to diagenetic alteration occur predominantly along these canals. The present data show that the cortical canal network of all samples was clearly isotropic before and after the experiments, which does not agree with the established finding that cortical canals are anisotropically organized (Dempster and Liddicoat, 1952; Petrtýl et al., 1996). However, due to the small size of the individual CB samples, localized differences in isotropy are bound to have a significant effect. In future studies, a more representative sample of an entire CB would therefore be required to address this topic.
The results presented here unequivocally show that changes in the relative percentage of cortical canals of a certain diameter are small and were predominantly observed for canals with diameters up to 27 µm (Figure 5A). These modifications can primarily be attributed to a single experimental parameter: temperature. At 30°C the development of the Ca.Dm distribution is contrary to the development at 60 and 90°C (Figure 5B). An increase in temperature seems to accelerate the formation of canals with diameters ≤9 µm and the reduction of those canals >9 µm in diameter. An increase in the proportion of small canals suggests the formation of fractures, cracks, or the decay of collagen, in particular at 90°C, while decreasing proportions indicate crack or canal filling caused by the formation of secondary minerals (see below). As would be expected, canals with a large diameter were significantly less modified than smaller canals, presumably because enlargement or reduction of the diameter of larger canals would be the result of apatite dissolution or (re-)precipitation of minerals, respectively. An additional reason might be, that the impact of generally small changes is stronger on the smallest canals than on the larger ones. Using µCT, it was not possible to determine whether dissolution of bioapatite or the formation of alteration-induced fractures or cracks were the predominant factors responsible for an increase of pore space in the lower-diameter canal range. Further investigations using CT systems with spatial resolution on the nanometer scale are therefore necessary to study the development of CB pore space in detail at the ultrastructural level.
The average Ct.Po of all samples increased only insignificantly from 1.70 ± 0.03 to 1.75 ± 0.03%, suggesting a good preservation of the cortical canal network (Supplementary Materials S1–S3). In general, no clear correlation with any of the controlled experimental parameters could be identified. There was only a tendency toward decreasing pore space at 30°C and increasing pore space at 90°C, whereas the pore space development at 60°C was in-between, depending on the type of experimental solution (Figures 6A–C).
A correlation of the average ∆Ca.Dm with ∆Ct.Po revealed a negative linear relationship (Figure 6D), suggesting that increasing pore space, e.g., as a result of fracture or crack formation always resulted in a decline of the Ca.Dmavg. This increases the percentage of small-diameter canals relative to large-diameter canals, which applies in particular to the 90°C experiments. Consequently, if pore space is reduced and smaller canals are most likely filled, the percentage of larger canals should increase, resulting in a larger Ca.Dmavg, which is precisely what was observed here.
Of particular interest are the results of the 30 and 60°C FWS experiments, because only in these experiments Ct.Po decreased or remained unchanged (Figure 6C), suggesting the formation of secondary minerals inside the CB canals. Precipitation might here by facilitated due to the presence of finely milled sediment (Table 2) that provided an additional and presumably more easily available source for dissolved calcium phosphate, in turn leading to a more rapid supersaturation of the pore fluid. Surprisingly, at 90°C, Ct.Po of the 7, 14, and 21 d experiments increased, which could be explained by faster dissolution than (re-) precipitation rates due to higher temperatures. As this process was reversed after one month, the experiment resulted in a distinct pore space reduction (Figure 6C).
Another important finding was that all freshwater experiments terminated after 1 d resulted in a temperature-dependent decrease of the pore space (∆Ct.Po = −4 to −25%; Figures 6A,C). However, neither did the respective CB samples show a significant gain of material (Figure 3) nor a conspicuous increase of the TV (Supplementary Material S1). But, the respective final aqueous solutions were the only ones that showed pH values below 7 at room temperature, which does not necessarily reflect the pH of the pore fluids.
Influence of the Chemical Environment on the Inorganic Phase
In bone taphonomy, the dissolution or preservation of the inorganic phase was found to strongly correlate with pH of the aqueous solution (Collins et al., 2002). Whereas bioapatite is stable under neutral to alkaline conditions, it is already well soluble under slightly acidic conditions. In solutions with pH values below 7, the rate of dissolution increases about seven to eight times with each lower pH log unit (Horvath, 2006). However, previously conducted bone solubility experiments (Berna et al., 2004) showed that there is a small pH range, termed the recrystallization window (pH = 7.6 to 8.1 at 25°C) in which bone apatite recrystallization can occur. Therefore, in neutral rather than alkaline conditions, bioapatite is most likely dissolved, and phosphate is then released to the solution, which acts as buffer at a pH ranging from 6.2 to 8.2. Because mass transfer is likely slow between the in- and outside of the bone, the milieu within the pores may have been relatively stable and dissolved ions might not have been efficiently transported away from the bone and into the solution. Following this reasoning, it is conceivable that after a certain period of time the pore fluid may have become supersaturated in apatite components, which most likely (re-)precipitated in a more insoluble apatite phase such as fluorapatite or hydroxylapatite instead of carbonated hydroxylapatite, because apatite solubility is directly proportional to the carbonate content (Ito et al., 1997; Elliott, 2002).
A further variable to consider is the presence of F in all experimental solutions. It is known that fossilized bone can consist of up to 99% of highly insoluble fluorapatite instead of the original hydroxyl-like bioapatite (Pasteris and Ding, 2009). In addition, Larsen (1986) found that the solubility of apatite phases is also regulated by the amount of F in the system, which substantially slows down dissolution rates, even at pH values between 4 and 6. Here, the three stock solutions were enriched with 11 mg/L of NaF (Tab. 1) compared to typical values of 0.43 mg/L in freshwater (Azami-Aghdash et al., 2013 and references cited therein) and 1.4 mg/L in seawater (Warner, 1969). Another potential, but unquantifiable source of F could have been the polytetrafluoroethylene (Teflon) reactors that might have released F into the experimental solutions.
The results show that the pH of the majority of the experiments ranged from pH 7 to 8 (Figures 4A,C,E) and hence fell into the small window where dissolution and precipitation are relatively balanced, thus resulting in a limited increase of the pore space, although only at elevated temperatures (Figures 7A,C,E). However, in FW and FWS experiments conducted at 30°C the change in Ct.Po ranged from relatively steady to significantly decreasing. For FW experiments, a clear correlation between decreasing pore space and increasing ∆Weight over time was found (Figure 7B), which could be related to the formation of secondary minerals inside cortical canals with diameters ≤9 µm (Figure 5B). However, this cannot be unequivocally shown with the approach chosen here. Moreover, this trend could not be entirely confirmed for the equivalent FWS experiments, probably due to the added sediment, which influenced the chemical environment (Figure 7F). For the 60 and 90°C experiments it would be expected that an increase in Ct.Po of up to 30% is reflected by an appropriate weight loss. However, significant weight loss was only measured for samples reacted at 90°C, which did not clearly correlate with the observed change in Ct.Po (Figures 7B,D,F). Therefore, the observation of a strong decrease of pore space after 1 d in both freshwater solutions (Figures 6A,C) is of interest, because these CB samples had in common that the pH of the solution dropped below 7, thus an increase of the pore space would be expected rather than the opposite. However, it should be noted that the pH of the pore fluids most likely developed differently from the surrounding solution, i.e., toward alkaline pH values, due to the buffering effect of dissolved apatite components (Pfretzschner, 1998). Nonetheless, the apparent decrease in pore space after 1 d in freshwater solutions as well as the distinct weight loss of samples reacted at 90°C (Figure 3) cannot be entirely explained just by dissolution and reprecipitation processes. Therefore, this effect must also be related to the interaction between the aqueous solution and the organic phase of CB, in particular through collagen degradation, which is known to be accelerated at higher temperatures and to result in a decline in the pH value (Roberts et al., 2002).
Influence of the Chemical Environment on the Organic Phase
The interaction between collagen and aqueous solutions has been studied for almost a century. However, the majority of research on this topic was focused on the interaction of aqueous solutions with soft tissue collagen (e.g., Jordan Lloyd et al., 1933; Bowes and Kenten, 1947; Zhang et al., 2000). In contrast, comparable data on the significantly more stable mineralized collagen are sparse (McKernan and Dailly, 1966; Lees, 1989; Pfretzschner, 2000; Fernández-Seara et al., 2002; Pfretzschner, 2006; Ni et al., 2007; Marinozzi et al., 2014). However, in particular during early stages of bone fossilization, the collagen-water interaction and the resulting degradation through chemical hydrolysis are of great importance (Collins et al., 2002; Pfretzschner, 2004; Dobberstein et al., 2009; Turner-Walker, 2011).
Under natural conditions collagen degradation is a slow process, because fluid transport is initially restricted to occur along larger compartments such as the Haversian canals in secondary osteons, which are covered by highly mineralized cement lines that impede diffusion (Francillon-Vieillot et al., 1990). In addition, collagen builds strong intermolecular bridges between peptide chains (Horvath, 2006), further hampering its dissolution. In the present study, collagen degradation was artificially accelerated by applying elevated temperatures. This effect is best observed in the almost exponential weight loss over time in the FW and FWS experiments at 90°C (Figure 3). A previous study on water exchange in CB showed that already at 40°C an exchange of water molecules between cortical canals and osteocyte lacunae is possible within minutes (Fernández-Seara et al., 2002). Here, we have further accelerated the accessibility of CB to fluids by providing additional pathways for diffusion through sample surface cutting and drilling. Therefore, it is very likely that in these CB samples collagen degradation began shortly after the experiments had started.
Correspondingly, a previous study showed that only 24 h after bone samples were immersed into an aqueous solution heated to 60°C total porosity significantly increased and tensile strength was reduced (Turner-Walker, 2011), the latter being associated with deterioration of collagen post mortem (Collins et al., 1995). A comparison of the development of the micro- vs. macroporosity in this particular study revealed that the increase of the total porosity correlated with a strong reduction in microporosity. The author proposed that the initial degradation of unmineralized or only poorly mineralized collagen led to Ca and P saturation in the respective pore fluids, in turn causing formation of secondary minerals. Similar observations were made in the present study, although only during the 30°C temperature regime. The 60 and 90°C experiments showed an increase in the number of cortical canals with a diameter <9 µm at the expense of cortical canals with larger diameters (Figure 5B). During the process of collagen degradation, water uptake leads to collagen swelling, which is facilitated in alkaline milieus (McKernan and Dailly, 1966) and can lead to a timely restricted reduction in Ct.Po, as was here observed already after 1 d in the FW and FWS experiments (Figures 6A,C). In addition, mechanical stress induced by swelling can also result in the formation of radial cracks within the stiff, highly mineralized cement line surrounding the secondary osteons (Pfretzschner, 2000), thus increasing the relative number of canals with a small diameter, as also observed here for the 60 and 90°C experiments (Figure 5B). The respective FW and FWS experiments started under neutral conditions (pHFW = 7.40 ± 0.06 and pHFWS = 7.16 ± 0.06) and therefore did not fall into the above mentioned recrystallization window (pH = 7.6 to 8.1 at 25°C). This could have led to an increase of bone dissolution in these experiments, resulting in a rapid increase in dissolved phosphate ions, which in turn buffered the solution inside the cortical canals to alkaline pH values where collagen swelling is facilitated.
In contrast, in the SW experimental series from the beginning on an increase in Ct.Po (Figure 6B) was observed as well as limited weight loss (Figure 3), although without a clear correlation with ∆Ct.Po (Figure 7D). Here, the SW experiments initially had a slightly alkaline pH of 8.04 ± 0.06 and therefore fit within the recrystallization window proposed by Berna et al. (2004), which suggests that dissolution of the apatite phase was rather reduced, but collagen degradation rather preferred. This is reflected by a decline of the pH with increasing temperature (Figure 4C), potentially even more pronounced in canal fluids. However, the indirect effect of collagen swelling was not observed, presumably, because pH directly decreased to more neutral values. While collagen constitutes about 30 wt.% of CB, it can account for up to 50 vol.%. Therefore, a strong reduction of collagen might not have such a strong effect on the weight as compared to the volume of a sample, thus resulting in an overall higher Ct.Po. However, it remains unclear at this point why exactly Ct.Po leveled off at almost the initial value after 30 d in the SW experimental series, but weight decreased more substantially. Obviously, the methodology used in this study is adequate for quantifying microarchitectural changes, but does not permit unambiguously determining the cause for this timely restricted decrease in porosity.
Significance of the Reaction Rim
A reaction rim was only observed in samples from the FW and FWS experimental series. The reaction rim was unevenly distributed over the entire outer sample surface, with a thickness of up to 20 µm (Figures 8, 9F). In addition, its extent was clearly time-dependent (Figures 8A–C), although, no correlation with temperature or pH was observed (Figures 9D,E). In µCT datasets in general, the density of different materials is displayed relative to each other through different grey-scale intensities. Black is representative for low-density materials, such as air, which usually does not absorb X-rays. Denser materials have a higher absorption coefficient and are displayed in different shades of gray, while materials that X-rays cannot penetrate are displayed in white. The average density of CB is 1.9 g/cm3 (Currey, 2006) and therefore absorbs X-rays significantly more than air (0.0012 g/cm3) or water (∼1 g/cm3). Consequently, the bright reaction rim must be significantly denser than the CB material itself. It is thus conceivable that this bright zone could represent hypermineralized CB tissue caused through precipitation within the outermost layer. Furthermore, as a bright reaction rim was only observed in CB samples exposed to FW and FWS solutions, the rim formation must be related to the composition of the solution. However, to what extent the added sediment used in FWS experiments might have influenced the formation of the reaction rim cannot be determined using µCT.
Among other parameters, the solution compositions differed with regard to the presence of U and the rare earth elements Lu and Nd in the FW and FWS solutions. The atomic masses of these elements are high and so an enrichment along the sample rim could have caused such different X-ray absorption. It is well known that bone tissue can incorporate significant amounts of U (Neuman and Neuman, 1948; Rowland and Farnham, 1969; Hamilton, 1971; Bourgeois et al., 2015), which can be used for U-series dating (e.g., Millard and Hedges, 1996; Stirling and Andersen, 2009; Grün et al., 2014) and with limited success also for U-Pb dating (Tomaschek et al., 2008; Chelle-Michou and Schaltegger, 2018).
To be able to observe such density differences using µCT, a strong enrichment of one or all of the elements Nd, Lu, and U would be required. In dissolved form, Nd3+ is the predominant species of NdCl3 at temperatures between 25 and 100°C (Panigrahi et al., 2016). In solutions with low concentrations of LuCl3, a fully hydrated Lu3+ species ([Lu(OH2)8]3+) exists (Rudolph and Irmer, 2018), while the dissolved form of UO2(NO3)2*6H2O in aqueous solutions are nitric oxide anions [NO−] and uranyl di-cations [UO2]2+(VI). There are in principle two, likely coexisting mechanisms that could have led to this enrichment: 1) pH-dependent precipitation or recrystallization of Nd-, Lu-, or U-bearing minerals (Pfretzschner, 2004) or 2) binding of cations, e.g., [UO2]2+ di-cations to negatively-charged residues of amino acids in collagen (Tzaphlidou et al., 1982). However, to facilitate the precipitation of insoluble mineral phases, the pH of the solution that already penetrated CB must be more alkaline than the pH of the aqueous solution outside the sample (Pfretzschner, 2004). This scenario is a reasonable assumption when taking into account the in situ observation of pH gradients on dissolving silicate glass surface using novel fluid-cell Raman spectroscopic experiments (Geisler et al., 2019).
Furthermore, it should be noted that the reaction rim does not represent the total penetration depth of the solutions into CB. Even though the total penetration depth cannot be quantified using the present analysis, it is clear that the volume of the reaction rim (Rr.Vavg = 0.23 mm3) is too small to be the only area where changes to the CB microarchitecture occurred, in particular with regard to changes in the Ca.Dm distribution (Figure 9F). In any case, the observations made in this study suggest that different types of reactions likely did occur on the surface and inside the CB samples. Detailed chemical analyses will be required to determine the penetration depth of the solution, to assess changes in concentrations of elements lighter than Nd, Lu, or U, and finally to investigate whether chemical modifications are restricted to the surface area or also do occur at the center of the sample.
Conclusion
For a detailed understanding of how bones are preserved over geological time scales, it is pivotal to study how their microarchitecture changes over time. Porosity is a parameter of particular importance, because the cortical canal network plays a crirical role in the degradation process by providing pathways for mass transfer between bones and aqueous solutions. By analyzing the individual samples before and after the experiments, it was here possible to obtain information about the influence of different aqueous solutions on CB microarchitecture and to what degree it was affected by the parameters temperature, time, and solution composition. In our experimental approach, temperatures of 30 and 60°C were chosen, because they best reflect the temperature ranges prevailing during early diagenesis. However, CB samples of these two experimental series often showed similar, but rather limited alteration effects after the maximum experimental duration of about one month. In contrast, experiments performed at 90°C showed the comparatively strongest modifications of CB microarchitecture as a function of time. Although 90°C represents a rather unrealistic temperature setting during the pre-burial phase of bone fossilization, it was used to experimentally accelerate aging. Such an approach assumes that the increased temperature partially compensates for the significantly shorter reaction time compared to geological time scales, whereby it has to be kept in mind that, depending on the activation energy a process may be activated that at lower temperatures would not be activated even over geological time scales. Unfortunately, the data are not comprehensive enough to reliably extract quantitative kinetic information. However, the most conspicuous observation was the occurrence of a thin reaction rim on the surface of the CB samples, although exclusively in those samples exposed to FW and FWS solutions. These data suggest the presence of different alteration mechanisms occurring in the surface-near area compared to the center of the samples. Apart from that, it was shown that the overall microarchitecture of CB is generally well preserved on the micrometer scale and that CB material did not display strong alteration effects. In fact, the most pronounced changes occurred in cortical canals with diameters <15 μm, and this so already within a single day. In addition, the response of CB microarchitecture to the alteration experiments was relatively uniform, as the observed structural modifications were not restricted to a specific area. Such modifications are likely the result of dissolution and (re-)precipitation of bioapatite as well as collagen degradation, all factors that are strongly correlated with the composition and, thereby pH of an aqueous solution. In fact, our results showed differences in the extent of alteration of CB microarchitecture depending on the composition of the experimental solution, i.e., the seawater solution (pHSW = 8.04 ± 0.06) and the freshwater solutions without (pHFW = 7.40 ± 0.06) and with added sediment (pHFWS = 7.16 ± 0.06). CB samples in FW experiments experienced the greatest modification, in SW experiments the least, and in FWS experiments behaved entirely different from the other two experimental series. In the latter, the solution was continuously brought back into equilibrium through the sediment so that the solution composition was kept relatively constant during the course of the experiment.
Previous studies on fossil bones from different diagenetic settings, e.g., aqueous or arid environments have shown that the chemical environment is one of the main factors controlling diagenetic changes (Tütken 2003; Pfretzschner 2004; Keenan 2016, Keenan, 2021). However, systematic experimental studies that focus on the pre-burial aqueous alteration of CB at the micrometre scale in marine, fluvial, and terrestrial settings were lacking thus far. Our µCT study can be considered as the first attempt to fill this gap. The results presented here provide a solid framework for future experimental studies under controlled physicochemical conditions aimed at identifying and quantifying the various transport and reaction process that occur during the early stages of diagenetic taphonomy of bone. Such data are crucial for the development of quantitative and predictive models describing the complex process of bone fossilization.
Data Availability Statement
The raw data supporting the conclusions of this article will be made available by the authors, without undue reservation.
Author Contributions
AK and TG conceived the study. AK conducted the alteration experiments. AK and AZ performed the µCT experiments. AK, AZ, and TG conducted data analysis. TT provided literature and information on bone diagenesis. AK wrote the first draft of the manuscript. All authors contributed to data interpretation and the final manuscript.
Funding
Funding for this study was provided by the Deutsche Forschungsgemeinschaft (DFG), grant nos. GE 1094/23-1, TU 148/9-1, and INST 217/849-1 FUGG. This is contribution no. 31 of the DFG Research Unit 2685 “The limits of the fossil record: analytical and experimental approaches to fossilization.”
Conflict of Interest
The authors declare that the research was conducted in the absence of any commercial or financial relationships that could be construed as a potential conflict of interest.
Acknowledgments
We are grateful to Nils Jung and Deniz Öz for preparation of samples and would like to thank Gerrit Müller for help with the alteration experiments. Frank Schildberg and Werner Masson are thanked for discussion of the analytical approach. Stuart R. Stock provided invaluable help with interpretation of the data. We also would like to thank the ostrich farm Gemarkenhof for the supply of ostrich bone samples. Finally, we are very grateful for constructive comments, corrections, and suggestions from Alida M. Bailleul and Graciela H. Pineiro, and, in particular the associate editor Gordon Turner-Walker.
Supplementary Material
The Supplementary Material for this article can be found online at: https://www.frontiersin.org/articles/10.3389/feart.2021.609496/full#supplementary-material.
References
Abdel-Maksoud, G. (2010). Comparison between the properties of ‘accelerated-aged’ bones and archaeological bones. Mediterr. Archaeol. Archaeom. 10, 89–112.
Aufort, J., Gommery, D., Gervais, C., Segalen, L., Labourdette, N., Coelho-Diogo, C., et al. (2019). Assessing bone transformation in late Miocene and Plio-Pleistocene deposits of Kenya and South Africa. Archaeometry 61, 1129–1143. doi:10.1111/arcm.12471
Azami-Aghdash, S., Ghojazadeh, M., Pournaghi Azar, F., Naghavi-Behzad, M., Mahmoudi, M., and Jamali, Z. (2013). Fluoride concentration of drinking waters and prevalence of fluorosis in Iran: a systematic review. J. Dent. Res. Dent. Clin. Dent. Prospects 7, 1–7.
Basillais, A., Bensamoun, S., Chappard, C., Brunet-Imbault, B., Lemineur, G., Ilharreborde, B., et al. (2007). Three-dimensional characterization of cortical bone microstructure by microcomputed tomography: validation with ultrasonic and microscopic measurements. J. Orthop. Sci. 12, 141–148. doi:10.1007/s00776-006-1104-z
Berna, F., Matthews, A., and Weiner, S. (2004). Solubilities of bone mineral from archaeological sites: the recrystallization window. J. Archaeol. Sci. 31, 867–882. doi:10.1016/j.jas.2003.12.003
Binkley, D. M., Deering, J., Yuan, H., Gourrier, A., and Grandfield, K. (2020). Human bone mesoscale 3D structure revisited by plasma focused ion beam serial sectioning. bioRxiv. doi:10.1101/2020.07.01.180729
Bjørnerem, A. (2016). The clinical contribution of cortical porosity to fragility fractures. BoneKey Rep. 5, 846. doi:10.1038/bonekey.2016.77
Blake, R. E., O'Neil, J. R., and Garcia, G. A. (1997). Oxygen isotope systematics of biologically mediated reactions of phosphate: I. Microbial degradation of organophosphorus compounds. Geochim. Cosmochim. Acta 61, 4411–4422. doi:10.1016/S0016-7037(97)00272-X
Blake, R. E., O'Neil, J. R., and Garcia, G. A. (1998). Effects of microbial activity on the δ18O of dissolved inorganic phosphate and textural features of synthetic apatites. Am. Mineral. 83, 1516–1531. doi:10.2138/am-1997-11-1240
Boskey, A. L. (2007). Mineralization of bones and teeth. Elements 3, 385–391. doi:10.2113/GSELEMENTS.3.6.385
Boskey, A. L., and Coleman, R. (2010). Aging and bone. J. Dent. Res. 89, 1333–1348. doi:10.1177/0022034510377791
Boughton, O. R., Ma, S., Cai, X., Yan, L., Peralta, L., Laugier, P., et al. (2019). Computed tomography porosity and spherical indentation for determining cortical bone millimetre-scale mechanical properties. Sci. Rep. 9, 7416. doi:10.1038/s41598-019-43686-6
Bourgeois, D., Burt-Pichat, B., Le Goff, X., Garrevoet, J., Tack, P., Falkenberg, G., et al. (2015). Micro-distribution of uranium in bone after contamination: new insight into its mechanism of accumulation into bone tissue. Anal. Bioanal. Chem. 407, 6619–6625. doi:10.1007/s00216-015-8835-7
Bouxsein, M. L., Boyd, S. K., Christiansen, B. A., Guldberg, R. E., Jepsen, K. J., and Müller, R. (2010). Guidelines for assessment of bone microstructure in rodents using micro-computed tomography. J. Bone Miner. Res. 25, 1468–1486. doi:10.1002/jbmr.141
Bowes, J. H., and Kenten, R. H. (1947). Uptake of water by collagen in solutions of alkalis and strong and weak organic bases. Nature 160, 827–828. doi:10.1038/160827a0
Britz, H. M., Jokihaara, J., Leppänen, O. V., Järvinen, T., and Cooper, D. M. (2010). 3D visualization and quantification of rat cortical bone porosity using a desktop micro-CT system: a case study in the tibia. J. Microsc. 240, 32–37. doi:10.1111/j.1365-2818.2010.03381.x
Bryant, J. D., and Froelich, P. N. (1995). A model of oxygen isotope fractionation in body water of large mammals. Geochim. Cosmochim. Acta 59, 4523–4537. doi:10.1016/0016-7037(95)00250-4
Burch, J., Rice, S., Yang, H., Neilson, A., Stirk, L., Francis, R., et al. (2014). Systematic review of the use of bone turnover markers for monitoring the response to osteoporosis treatment: the secondary prevention of fractures, and primary prevention of fractures in high-risk groups. Health Technol. Assess. 18, 1–180. doi:10.3310/hta18110
Campbell, G. M., and Sophocleous, A. (2014). Quantitative analysis of bone and soft tissue by micro-computed tomography: applications to ex vivo and in vivo studies. BoneKey Rep. 3, 564. doi:10.1038/bonekey.2014.59
Caruso, V., Marinoni, N., Diella, V., Berna, F., Cantaluppi, M., Mancini, L., et al. (2020). Bone diagenesis in archaeological and contemporary human remains: an investigation of bone 3D microstructure and minero-chemical assessment. Archaeol. Anthropol. Sci. 12, 1–18. doi:10.1007/s12520-020-01090-6
Chelle-Michou, C., and Schaltegger, U. (2018). U-Pb dating of mineral deposits: from age constraints to ore-forming processes. EarthArXiv. doi:10.31223/osf.io/b7pw9
Clementz, M. T., Fox-Dobbs, K., Wheatley, P. V., Koch, P. L., and Doak, D. F. (2009). Revisiting old bones: coupled carbon isotope analysis of bioapatite and collagen as an ecological and palaeoecological tool. Geol. J. 44, 605–620. doi:10.1002/gj.1173
Collins, M. J., Nielsen-Marsh, C. M., Hiller, J., Smith, C. I., Roberts, J. P., Prigodich, R. V., et al. (2002). The survival of organic matter in bone: a review. Archaeometry 44, 383–394. doi:10.1111/1475-4754.t01-1-00071
Collins, M. J., Riley, M. S., Child, A. M., and Turner-Walker, G. (1995). A basic mathematical simulation of the chemical degradation of ancient collagen. J. Archaeol. Sci. 22, 175–183. doi:10.1006/jasc.1995.0019
Cooper, D. M., Turinsky, A. L., Sensen, C. W., and Hallgrímsson, B. (2003). Quantitative 3D analysis of the canal network in cortical bone by micro-computed tomography. Anat. Rec. B New Anat. 274, 169–179. doi:10.1002/ar.b.10024
Cooper, D. M., Matyas, J. R., Katzenberg, M. A., and Hallgrimsson, B. (2004). Comparison of microcomputed tomographic and microradiographic measurements of cortical bone porosity. Calcif. Tissue Int. 74, 437–447. doi:10.1007/s00223-003-0071-z
Cooper, D., Turinsky, A., Sensen, C., and Hallgrimsson, B. (2007). Effect of voxel size on 3D micro-CT analysis of cortical bone porosity. Calcif. Tissue Int. 80, 211–219. doi:10.1007/s00223-005-0274-6
Cooper, D. M., Kawalilak, C. E., Harrison, K., Johnston, B. D., and Johnston, J. D. (2016). Cortical bone porosity: what is it, why is it important, and how can we detect it? Curr. Osteoporos. Rep. 14, 187–198. doi:10.1007/s11914-016-0319-y
Currey, J. D. (2006). Bones: structure and mechanics. Princeton & Oxford: Princeton University Press.
Currey, J. D. (2012). The structure and mechanics of bone. J. Mater. Sci. 47, 41–54. doi:10.1007/s10853-011-5914-9
Dempster, W. T., and Liddicoat, R. T. (1952). Compact bone as a non-isotropic material. Am. J. Anat. 91, 331–362. doi:10.1002/aja.1000910302
DeNiro, M. J., and Epstein, S. (1978). Influence of diet on the distribution of carbon isotopes in animals. Geochim. Cosmochim. Acta 42, 495–506. doi:10.1016/0016-7037(78)90199-0
Dobberstein, R. C., Collins, M. J., Craig, O. E., Taylor, G., Penkman, K. E. H., and Ritz-Timme, S. (2009). Archaeological collagen: why worry about collagen diagenesis? Archaeol. Anthropol. Sci. 1, 31–42. doi:10.1007/s12520-009-0002-7
Elliott, J. C. (2002). Calcium phosphate biominerals. Rev. Mineral. Geochem. 48, 427–453. doi:10.2138/rmg.2002.48.11
Erickson, G. M. (2005). Assessing dinosaur growth patterns: a microscopic revolution. Trends Ecol. Evol. 20, 677–684. doi:10.1016/j.tree.2005.08.012
Feik, S. A., Thomas, C. D., and Clement, J. G. (1997). Age-related changes in cortical porosity of the midshaft of the human femur. J. Anat. 191, 407–416. doi:10.1046/j.1469-7580.1997.19130407.x
Feller, R. L. (1994). Accelerated aging: photochemical and thermal aspects. Research in conservation 4. Marina del Rey, CA: Getty Conservation Institute.
Fernández-Seara, M. A., Wehrli, S. L., and Wehrli, F. W. (2002). Diffusion of exchangeable water in cortical bone studied by nuclear magnetic resonance. Biophys. J. 82, 522–529. doi:10.1016/S0006-3495(02)75417-9
Fournier, D. E., Norley, C. J. D., Pollmann, S. I., Bailey, C. S., Al Helal, F., Willmore, K. E., et al. (2019). Ectopic spinal calcification associated with diffuse idiopathic skeletal hyperostosis (DISH): a quantitative micro-CT analysis. J. Orthop. Res. 37, 717–726. doi:10.1002/jor.24247
Francillon-Vieillot, H., de Buffrénil, V., Géraudie, J., Meunier, F. J., et al. (1990). “Microstructure and mineralization of vertebrate skeletal tissues,” in Skeletal Biomineralization: Patterns, Processes and Evolutionary Trends. Editor J. G. Carter (New York: Van Nostrand Reinhold), 471–530. doi:10.1029/SC005p0175
Frost, H. M. (1969). Tetracycline-based histological analysis of bone remodeling. Calcif. Tissue Res. 3, 211–237. doi:10.1007/bf02058664
Gäb, F., Ballhaus, C., Stinnesbeck, E., Kral, A. G., Janssen, K., and Bierbaum, G. (2020). Experimental taphonomy of fish - role of elevated pressure, salinity and pH. Sci. Rep. 10, 7839. doi:10.1038/s41598-020-64651-8
Gauthier, R., Langer, M., Follet, H., Olivier, C., Gouttenoire, P. J., Helfen, L., et al. (2018). 3D microstructural analysis of human cortical bone in paired femoral diaphysis, femoral neck and radial diaphysis. J. Struct. Biol. 204, 182–190. doi:10.1016/j.jsb.2018.08.006
Geisler, T., Dohmen, L., Lenting, C., and Fritzsche, M. B. K. (2019). Real-time in situ observations of reaction and transport phenomena during silicate glass corrosion by fluid-cell Raman spectroscopy. Nat. Mater. 18, 342–348. doi:10.1038/s41563-019-0293-8
Gilbert, M. M., Snively, E., and Cotton, J. (2016). The tarsometatarsus of the ostrich Struthio camelus: anatomy, bone densities, and structural mechanics. PLoS One 11, e0149708. doi:10.1371/journal.pone.0149708
Glimcher, M. J. (2006). Bone: nature of the calcium phosphate crystals and cellular, structural, and physical chemical mechanisms in their formation. Rev. Mineral. Geochem. 64, 223–282. doi:10.2138/rmg.2006.64.8
Greenlee, D. M. (1996). An electron microprobe evaluation of diagenetic alteration in archaeological bone. Archaeol. Chem. 625, 334–354. doi:10.1021/bk-1996-0625.ch024
Grün, R., Eggins, S., Kinsley, L., Moseley, H., and Sambridge, M. (2014). Laser ablation U-series analysis of fossil bones and teeth. Palaeogeogr. Palaeoclimatol. Palaeoecol. 416, 150–167. doi:10.1016/j.palaeo.2014.07.023
Hamilton, E. I. (1971). The concentration and distribution of uranium in human skeletal tissues. Calcif. Tissue Res. 7, 150–162. doi:10.1007/BF02062603
Harrison, K. D., Hiebert, B. D., Panahifar, A., Andronowski, J. M., and Ashique, A. M. (2020). Cortical bone porosity in rabbit models of osteoporosis. J. Bone Miner. Res. 35, 2211–2228. doi:10.1002/jbmr.4124.Hedges
Heaney, R. P. (2006). “Bone as the calcium nutrient reserve,”. Calcium in Human Health. Nutrition and Health. Editors C. M. Weaver, and R. P. Heaney (New Jersey: Humana Press). 7–11.
Hedges, R. E. M (2002). Bone diagenesis: an overview of processes. Archaeometry 44, 319–328. doi:10.1111/1475-4754.00064
Hedges, R. E. M., and Millard, A. R. (1995). Bones and groundwater: towards the modelling of diagenetic processes. J. Archaeol. Sci. 22, 155–164. doi:10.1006/jasc.1995.0017
Hedges, R. E. M., Millard, A. R., and Pike, A. W. G. (1995). Measurements and relationships of diagenetic alteration of bone from three archaeological sites. J. Archaeol. Sci. 22, 201–209. doi:10.1006/jasc.1995.0022
Hemmatian, H., Laurent, M. R., Ghazanfari, S., Vanderschueren, D., Bakker, A. D., Klein-Nulend, J., et al. (2017). Accuracy and reproducibility of mouse cortical bone microporosity as quantified by desktop microcomputed tomography. PLoS One 12, e0182996. doi:10.1371/journal.pone.0182996
Heuser, A., Tütken, T., Gussone, N., and Galer, S. J. G. (2011). Calcium isotopes in fossil bones and teeth - diagenetic versus biogenic origin. Geochim. Cosmochim. Acta 75, 3419–3433. doi:10.1016/j.gca.2011.03.032
Hildebrand, T., Laib, A., Müller, R., Dequeker, J., and Rüegsegger, P. (1999). Direct three-dimensional morphometric analysis of human cancellous bone: microstructural data from spine, femur, iliac crest, and calcaneus. J. Bone Miner. Res. 14, 1167–1174. doi:10.1359/jbmr.1999.14.7.1167
Hildebrand, T., and Rüegsegger, P. (1997). A new method for the model-independent assessment of thickness in three-dimensional images. J. Microsc. 185, 67–75. doi:10.1046/j.1365-2818.1997.1340694.x
Hinz, E. A., and Kohn, M. J. (2010). The effect of tissue structure and soil chemistry on trace element uptake in fossils. Geochim. Cosmochim. Acta 74, 3213–3231. doi:10.1016/j.gca.2010.03.011
Horvath, A. L. (2006). Solubility of structurally complicated materials: II. Bone. J. Phys. Chem. Ref. Data 35, 1653–1668. doi:10.1063/1.2360606
Ito, A., Maekawa, K., Tsutsumi, S., Ikazaki, F., and Tateishi, T. (1997). Solubility product of OH-carbonated hydroxyapatite. J. Biomed. Mater. Res. 36, 522–528. doi:10.1002/(sici)1097-4636(19970915)36:4<522::aid-jbm10>3.0.co;2-c
Jordan Lloyd, D., Marriott, R. H., and Pleass, W. B. (1933). The swelling of protein fibres. Part I. The swelling of collagen. Trans. Faraday Soc. 29, 554. doi:10.1039/tf9332900554
Keenan, S. W. (2016). From bone to fossil: a review of the diagenesis of bioapatite. Am. Mineral. 101, 1943–1951. doi:10.2138/am-2016-5737
Keenan, S. W., and Engel, A. S. (2017). Early diagenesis and recrystallization of bone. Geochim. Cosmochim. Acta 196, 209–223. doi:10.1016/j.gca.2016.09.033
Keenan, S. W. (2021). “Fossilization,” in Encyclopedia of Geology. Editors D. Alderton, and A. E. Scott (Boston: Academic Press), 1–11. doi:10.1016/B978-0-12-409548-9.12067-6
Kendall, C., Eriksen, A. M. H., Kontopoulos, I., Collins, M. J., and Turner-Walker, G. (2018). Diagenesis of archaeological bone and tooth. Palaeogeogr. Palaeoclimatol. Palaeoecol. 491, 21–37. doi:10.1016/j.palaeo.2017.11.041
Koch, P. L., Halliday, A. N., Walter, L. M., Stearley, R. F., Huston, T. J., and Smith, G. R. (1992). Sr isotopic composition of hydroxyapatite from recent and fossil salmon: the record of lifetime migration and diagenesis. Earth Planet. Sci. Lett. 108, 277–287. doi:10.1016/0012-821X(92)90028-T
Koch, P. L., Fogel, M. L., and Tuross, N. (1994). “Tracing the diets of fossil animals using stable isotopes,” in Stable Isotopes in Ecology and Environmental Science. Editors K. Lajtha, and B. Michener (Boston: Blackwell Scientific Publication), 63–92.
Kohn, M. J., and Moses, R. J. (2013). Trace element diffusivities in bone rule out simple diffusive uptake during fossilization but explain in vivo uptake and release. Proc. Natl. Acad. Sci. USA 110, 419–424. doi:10.1073/pnas.1209513110
Kohn, M. J., and Cerling, T. E. (2002). Stable isotope compositions of biological apatite. Rev. Mineral. Geochem. 48, 455–488. doi:10.2138/rmg.2002.48.12
Kohn, M. J., and Law, J. M. (2006). Stable isotope chemistry of fossil bone as a new paleoclimate indicator. Geochim. Cosmochim. Acta 70, 931–946. doi:10.1016/j.gca.2005.10.023
Kohn, M. J. (1996). Predicting animal δ18O: accounting for diet and physiological adaptation. Geochim. Cosmochim. Acta 60, 4811–4829. doi:10.1016/S0016-7037(96)00240-2
Kohn, M. J., Schoeninger, M. J., and Barker, W. W. (1999). Altered states: effects of diagenesis on fossil tooth chemistry. Geochim. Cosmochim. Acta 63, 2737–2747. doi:10.1016/S0016-7037(99)00208-2
Kohn, M. J. (2008). Models of diffusion-limited uptake of trace elements in fossils and rates of fossilization. Geochim. Cosmochim. Acta 72, 3758–3770. doi:10.1016/j.gca.2008.05.045
Larsen, M. J. (1986). An investigation of the theoretical background for the stability of the calcium-phosphate salts and their mutual conversion in aqueous solutions. Arch. Oral Biol. 31, 757–761. doi:10.1016/0003-9969(86)90008-7
Le Garff, E., Mesli, V., Delannoy, Y., Colard, T., Demondion, X., Becart, A., et al. (2017). Technical note: early post-mortem changes of human bone in taphonomy with μCT. Int. J. Leg. Med. 131, 761–770. doi:10.1007/s00414-016-1509-y
Lee, B. E. J., Langelier, B., and Grandfield, K. (2020). Visualization of collagen-mineral arrangement using atom probe tomography. bioRxiv. doi:10.1101/2020.07.10.197673
Lee-Thorp, J. A., Sealy, J. C., and van der Merwe, N. J. (1989). Stable carbon isotope ratio differences between bone collagen and bone apatite, and their relationship to diet. J. Archaeol. Sci. 16, 585–599. doi:10.1016/0305-4403(89)90024-1
Lees, S. (1989). “Some characteristics of mineralised collagen,” in Calcified Tissue. Topics in Molecular and Structural Biology. Editor D. W. L. Hukins (London: Palgrave). 153–173. doi:10.1007/978-1-349-09868-2_7
Longinelli, A. (1984). Oxygen isotopes in mammal bone phosphate: a new tool for paleohydrological and paleoclimatological research? Geochim. Cosmochim. Acta 48, 385–390. doi:10.1016/0016-7037(84)90259-X
Luz, B., Kolodny, Y., and Horowitz, M. (1984). Fractionation of oxygen isotopes between mammalian bone-phosphate and environmental drinking water. Geochim. Cosmochim. Acta 48, 1689–1693. doi:10.1016/0016-7037(84)90338-7
Marenzana, M., and Arnett, T. R. (2013). The key role of the blood supply to bone. Bone Res. 1, 203–215. doi:10.4248/BR201303001
Marino, B. D., and DeNiro, M. J. (1987). Isotopic analysis of archaeobotanicals to reconstruct past climates: effects of activities associated with food preparation on carbon, hydrogen and oxygen isotope ratios of plant cellulose. J. Archaeol. Sci. 14, 537–548. doi:10.1016/0305-4403(87)90037-9
Marinozzi, F., Bini, F., Quintino, A., Corcione, M., and Marinozzi, A. (2014). Experimental study of diffusion coefficients of water through the collagen: apatite porosity in human trabecular bone tissue. Biomed. Res. Int. 2014, 1–8. doi:10.1155/2014/796519
McKernan, W. M., and Dailly, S. D. (1966). “The relationship between swelling of hard tissue collagen in acid and alkali and the presence of phosphate cross-links,” in Calcified Tissues 1965. Editors H. Fleisch, H. J. J. Blackwood, and M. Owen (Berlin, Heidelberg: Springer), 171–174. doi:10.1007/978-3-642-85841-3_33
Millard, A. R., and Hedges, R. E. M. (1996). A diffusion-adsorption model of uranium uptake by archaeological bone. Geochim. Cosmochim. Acta 60, 2139–2152. doi:10.1016/0016-7037(96)00050-6
Neuman, M. W., and Neuman, W. F. (1948). The deposition of uranium in bone; radioautographic studies. J. Biol. Chem. 175, 711–714. doi:10.1016/s0021-9258(18)57188-x
Ni, Q., Nyman, J. S., Wang, X., Santos, A. D. L., and Nicolella, D. P. (2007). Assessment of water distribution changes in human cortical bone by nuclear magnetic resonance. Meas. Sci. Technol. 18, 715–723. doi:10.1088/0957-0233/18/3/022
Nielsen-Marsh, C. M., and Hedges, R. E. M. (1999). Bone porosity and the use of mercury intrusion porosimetry in bone diagenesis studies. Archaeometry 41, 165–174. doi:10.1111/j.1475-4754.1999.tb00858.x
Nielsen-Marsh, C. M., and Hedges, R. E. M. (2000a). Patterns of diagenesis in bone I: the effects of site environments. J. Archaeol. Sci. 27, 1139–1150. doi:10.1006/jasc.1999.0537
Nielsen-Marsh, C. M., and Hedges, R. E. M. (2000b). Patterns of diagenesis in bone II: effects of acetic acid treatment and the removal of diagenetic CO32−. J. Archaeol. Sci. 27, 1151–1159. doi:10.1006/jasc.1999.0538
Ostertag, A., Peyrin, F., Fernandez, S., Laredo, J. D., De Vernejoul, M. C., and Chappard, C. (2014). Cortical measurements of the tibia from high resolution peripheral quantitative computed tomography images: a comparison with synchrotron radiation micro-computed tomography. Bone 63, 7–14. doi:10.1016/j.bone.2014.02.009
Pack, A., Gehler, A., and Süssenberger, A. (2013). Exploring the usability of isotopically anomalous oxygen in bones and teeth as paleo-CO2-barometer. Geochim. Cosmochim. Acta 102, 306–317. doi:10.1016/j.gca.2012.10.017
K. Padian, and E. T. Lamm (Editors) (2013). Bone Histology of Fossil Tetrapods. Advancing Methods, Analysis, and Interpretation. Berkeley: University of California Press. doi:10.1525/9780520955110
Palacio-Mancheno, P. E., Larriera, A. I., Doty, S. B., Cardoso, L., and Fritton, S. P. (2014). 3D assessment of cortical bone porosity and tissue mineral density using high-resolution µCT: effects of resolution and threshold method. J. Bone Miner. Res. 29, 142–150. doi:10.1002/jbmr.2012
Panigrahi, M., Grabda, M., Kozak, D., Dorai, A., Shibata, E., Kawamura, J., et al. (2016). Liquid-liquid extraction of neodymium ions from aqueous solutions of NdCl3 by phosphonium-based ionic liquids. Separation Purif. Tech. 171, 263–269. doi:10.1016/J.SEPPUR.2016.07.044
Parfitt, A. M. (1979). Quantum concept of bone remodeling and turnover: implications for the pathogenesis of osteoporosis. Calcif. Tissue Int. 28, 1–5. doi:10.1007/BF02441211
Parfitt, A. M. (2002). Misconceptions (2): turnover is always higher in cancellous than in cortical bone. Bone 30, 807–809. doi:10.1016/S8756-3282(02)00735-4
Pasteris, J. D., and Ding, D. Y. (2009). Experimental fluoridation of nanocrystalline apatite. Am. Mineral. 94, 53–63. doi:10.2138/am.2009.2926
Pasteris, J. D., Wopenka, B., and Valsami-Jones, E. (2008). Bone and tooth mineralization: why apatite?. Elements 4, 97–104. doi:10.2113/GSELEMENTS.4.2.97
Pasteris, J. D., Yoder, C. H., and Wopenka, B. (2014). Molecular water in nominally unhydrated carbonated hydroxylapatite: the key to a better understanding of bone mineral. Am. Mineral. 99, 16–27. doi:10.2138/am.2014.4627
Petrtýl, M., Heřt, J., and Fiala, P. (1996). Spatial organization of the Haversian bone in man. J. Biomech. 29, 161–169. doi:10.1016/0021-9290(94)00035-2
Pfretzschner, H. U. (1998). Early diagenetic processes in the fossilisation of bone. N. Jb. Geol. Paläont. Abh. 210, 369–397. doi:10.1127/njgpa/210/1998/369
Pfretzschner, H. U. (2004). Fossilization of Haversian bone in aquatic environments. C. R. Palevol. 3, 605–616. doi:10.1016/j.crpv.2004.07.006
Pfretzschner, H. U. (2006). Collagen gelatinization: the key to understand early bone-diagenesis. Palaeontographica Abt. A 278, 135–148. doi:10.1127/pala/278/2006/135
Pfretzschner, H. U. (2000). Microcracks and fossilization of Haversian bone. N. Jb. Geol. Paläont. Abh. 216, 413–432. doi:10.1127/njgpa/216/2000/413
Piemontese, M., Almeida, M., Robling, A. G., Kim, H. N., Xiong, J., Thostenson, J. D., et al. (2017). Old age causes de novo intracortical bone remodeling and porosity in mice. JCI Insight 2, e93771. doi:10.1172/jci.insight.93771
Recker, R. R., Kimmel, D. B., Dempster, D., Weinstein, R. S., Wronski, T. J., and Burr, D. B. (2011). Issues in modern bone histomorphometry. Bone 49, 955–964. doi:10.1016/j.bone.2011.07.017
Reilly, G. C., Knapp, H. F., Stemmer, A., Niederer, P., and Knothe Tate, M. L. (2001). Investigation of the morphology of the lacunocanalicular system of cortical bone using atomic force microscopy. Ann. Biomed. Eng. 29, 1074–1081. doi:10.1114/1.1424910
Reynard, B., and Balter, V. (2014). Trace elements and their isotopes in bones and teeth: diet, environments, diagenesis, and dating of archeological and paleontological samples. Palaeogeogr. Palaeoclimatol. Palaeoecol. 416, 4–16. doi:10.1016/j.palaeo.2014.07.038
Reznikov, N., Bilton, M., Lari, L., Stevens, M. M., and Kröger, R. (2018). Fractal-like hierarchical organization of bone begins at the nanoscale. Science 360, eaao2189. doi:10.1126/science.aao2189
Rigo, J., Pieltain, C., Viellevoye, R., and Bagnoli, F. (2012). “Calcium and phosphorus homeostasis: pathophysiology,” in Neonatology. Editors G. Buonocore, R. Bracci, and M. Weindling (Milano: Springer). doi:10.1007/978-88-470-1405-3_49
Roberts, S. J., Smith, C. I., Millard, A., and Collins, M. J. (2002). The taphonomy of cooked bone: characterizing boiling and its physico-chemical effects. Archaeometry 44, 485–494. doi:10.1111/1475-4754.t01-1-00080
Rowland, R. E., and Farnham, J. E. (1969). The deposition of uranium in bone. Health Phys. 17, 139–144. doi:10.1097/00004032-196907000-00015
Rudolph, W., and Irmer, G. (2018). Hydration and ion pair formation in aqueous Lu3+- solution. Molecules 23, 3237. doi:10.3390/molecules23123237
Schwermann, A. H., Wuttke, M., and Schultz, J. A. (2012). Virtopsy of the controlled decomposition of a dormouse Eliomys quercinus as a tool to analyse the taphonomy of Heterohyus nanus from Messel (Eocene, Germany). Palaeobio. Palaeoenv. 92, 29–43. doi:10.1007/s12549-011-0063-3
Sponheimer, M., and Lee-Thorp, J. A. (1999). Isotopic evidence for the diet of an early hominid, Australopithecus africanus. Science 283, 368–370. doi:10.1126/science.283.5400.368
Steele, D. G., and Bramblett, C. A. (1988). The Anatomy and Biology of the Human Skeleton. College Station: Texas A&M University Press. doi:10.1002/ca.980030210
Stirling, C. H., and Andersen, M. B. (2009). Uranium-series dating of fossil coral reefs: extending the sea-level record beyond the last glacial cycle. Earth Planet. Sci. Lett. 284, 269–283. doi:10.1016/j.epsl.2009.04.045
Stock, S. R. (2020). Microcomputed Tomography: Methodology and Applications. Boca Raton, FL: CRC Press. doi:10.1201/9780429186745
Stout, S., and Crowder, C. (2011). “Bone remodeling, histomorphology and histomorphometry,” in Bone Histology: an Anthropological Perspective. Editors C. Crowder and S. Stout (Boca Raton, FL: CRC Press), 1–21. doi:10.1201/b11393-2
Tieszen, L. L., Boutton, T. W., Tesdahl, K. G., and Slade, N. A. (1983). Fractionation and turnover of stable carbon isotopes in animal tissues: implications for δ13C analysis of diet. Oecologia 57, 32–37. doi:10.1007/BF00379558
Tieszen, L. L., and Fagre, T. (1993). “Effect of diet quality and composition on the isotopic composition of respiratory CO2, bone collagen, bioapatite, and soft tissues,” in Prehistoric Human Bone. Editors J. B. Lambert, and G. Grupe (Berlin, Heidelberg: Springer), 121–155. doi:10.1007/978-3-662-02894-0_5
Tomaschek, F., Keiter, M., Kennedy, A. K., and Ballhaus, C. (2008). Pre-alpine basement within the northern cycladic blueschist unit on Syros island, Greece. Z. dt. Ges. Geowiss. 159, 521–531. doi:10.1127/1860-1804/2008/0159-0521
Tomes, J., and De Morgan, C. G. (1853). IV. Observations on the structure and development of bone. Philos. Trans. R. Soc. 143, 109–139. doi:10.1098/rstl.1853.0004
Trueman, C. N., Behrensmeyer, A. K., Potts, R., and Tuross, N. (2006). High-resolution records of location and stratigraphic provenance from the rare earth element composition of fossil bones. Geochim. Cosmochim. Acta 70, 4343–4355. doi:10.1016/j.gca.2006.06.1556
Trueman, C. N. (2013). Chemical taphonomy of biomineralized tissues. Palaeontology 56, 475–486. doi:10.1111/pala.12041
Trueman, C. N. G., Behrensmeyer, A. K., Tuross, N., and Weiner, S. (2004). Mineralogical and compositional changes in bones exposed on soil surfaces in Amboseli National Park, Kenya: diagenetic mechanisms and the role of sediment pore fluids. J. Archaeol. Sci. 31, 721–739. doi:10.1016/j.jas.2003.11.003
Trueman, C. N., and Martill, D. M. (2002). The long-term survival of bone: the role of bioerosion. Archaeometry 44, 371–382. doi:10.1111/1475-4754.t01-1-00070
Trueman, C. N., Privat, K., and Field, J. (2008). Why do crystallinity values fail to predict the extent of diagenetic alteration of bone mineral? Palaeogeogr. Palaeoclimatol. Palaeoecol. 266, 160–167. doi:10.1016/j.palaeo.2008.03.038
Trueman, C. N., and Tuross, N. (2002). Trace elements in recent and fossil bone apatite. Rev. Mineral. Geochem. 48, 489–521. doi:10.2138/rmg.2002.48.13
Turner-Walker, G. (2011). The mechanical properties of artificially aged bone: probing the nature of the collagen-mineral bond. Palaeogeogr. Palaeoclimatol. Palaeoecol. 310, 17–22. doi:10.1016/j.palaeo.2011.03.024
Tuross, N., Behrensmeyer, A. K., Eanes, E. D., Fisher, L. W., and Hare, P. E. (1989a). Molecular preservation and crystallographic alterations in a weathering sequence of wildebeest bones. Appl. Geochem. 4, 261–270. doi:10.1016/0883-2927(89)90027-9
Tuross, N., Behrensmeyer, A. K., and Eanes, E. D. (1989b). Strontium increases and crystallinity changes in taphonomic and archaeological bone. J. Archaeol. Sci. 16, 661–672. doi:10.1016/0305-4403(89)90030-7
Tütken, T. (2003). Die Bedeutung der Knochenfrühdiagenese für die Erhaltungsfähigkeit in vivo erworbener Element- und Isotopenzusammensetzungen in fossilen Knochen. Dissertation. Eberhard-Karls-Universität Tübingen, 343pp. http://hdl.handle.net/10900/48514.
Tütken, T., Pfretzschner, H.-U., Vennemann, T. W., Sun, G., and Wang, Y. D. (2004). Paleobiology and skeletochronology of Jurassic dinosaurs: implications from the histology and oxygen isotope compositions of bones. Palaeogeogr. Palaeoclimatol. Palaeoecol. 206, 217–238. doi:10.1016/j.palaeo.2004.01.005
Tütken, T., and Vennemann, T. W. (2011). Fossil bones and teeth: preservation or alteration of biogenic compositions? Palaeogeogr. Palaeoclimatol. Palaeoecol. 310, 1–8. doi:10.1016/j.palaeo.2011.06.020
Tütken, T., Vennemann, T. W., and Pfretzschner, H. U. (2008). Early diagenesis of bone and tooth apatite in fluvial and marine settings: constraints from combined oxygen isotope, nitrogen and REE analysis. Palaeogeogr. Palaeoclimatol. Palaeoecol. 266, 254–268. doi:10.1016/j.palaeo.2008.03.037
Tzaphlidou, M., Chapman, J. A., and Al-Samman, M. H. (1982). A study of positive staining for electron microscopy using collagen as a model system-II. Staining by uranyl ions. Micron 13, 133–145. doi:10.1016/0047-7206(82)90080-2
Uppuganti, S., Granke, M., Makowski, A. J., Does, M. D., and Nyman, J. S. (2016). Age-related changes in the fracture resistance of male Fischer F344 rat bone. Bone 83, 220–232. doi:10.1016/j.bone.2015.11.009
Wachter, N. J., Augat, P., Krischak, G. D., Sarkar, M. R., Mentzel, M., Kinzl, L., et al. (2001). Prediction of strength of cortical bone in vitro by microcomputed tomography. Clin. Biomech. 16, 252–256. doi:10.1016/S0268-0033(00)00092-9
Waite, E. R., Child, A. M., Craig, O. E., Collins, M. J., Gelsthorpe, K., and Brown, T.A. (1997). A preliminary investigation of DNA stability in bone during artificial diagenesis. Bull. Soc. Géol. Fr. 168, 547–554.
Warner, T. B. (1969). Fluoride in seawater: measurement with lanthanum fluoride electrode. Science 165, 178–180. doi:10.1126/science.165.3889.178
Wopenka, B., and Pasteris, J. D. (2005). A mineralogical perspective on the apatite in bone. Mater. Sci. Eng. C. 25, 131–143. doi:10.1016/j.msec.2005.01.008
Zazzo, A., Lécuyer, C., and Mariotti, A. (2004). Experimentally-controlled carbon and oxygen isotope exchange between bioapatites and water under inorganic and microbially-mediated conditions. Geochim. Cosmochim. Acta 68, 1–12. doi:10.1016/S0016-7037(03)00278-3
Zhang, Q., Liu, L., Zhou, H., Wu, X., and Yao, K. D. (2000). Ph-responsive swelling behavior of collagen complex materials. Artif. Cell Blood Substitutes Immobilization Biotechnol. 28, 255–262. doi:10.3109/10731190009119356
Zhu, W., Robey, P. G., and Boskey, A. L. (2008). The regulatory role of matrix proteins in mineralization of bone. Osteoporosis, 191–240. doi:10.1016/b978-012370544-0.50011-2
Keywords: early diagenesis, fossilization, cortical porosity, 3D quantitative analysis, experimental taphonomy, canal network, microstructure, μCT
Citation: Kral AG, Ziegler A, Tütken T and Geisler T (2021) Experimental Aqueous Alteration of Cortical Bone Microarchitecture Analyzed by Quantitative Micro-Computed Tomography. Front. Earth Sci. 9:609496. doi: 10.3389/feart.2021.609496
Received: 23 September 2020; Accepted: 15 February 2021;
Published: 22 April 2021.
Edited by:
Gordon Turner-Walker, National Yunlin University of Science and Technology, TaiwanReviewed by:
Alida M. Bailleul, Chinese Academy of Sciences, ChinaGraciela Helena Piñeiro, Universidad de la República, Uruguay
Copyright © 2021 Kral, Ziegler, Tütken and Geisler. This is an open-access article distributed under the terms of the Creative Commons Attribution License (CC BY). The use, distribution or reproduction in other forums is permitted, provided the original author(s) and the copyright owner(s) are credited and that the original publication in this journal is cited, in accordance with accepted academic practice. No use, distribution or reproduction is permitted which does not comply with these terms.
*Correspondence: Anna G. Kral, YWtyYWxAdW5pLWJvbm4uZGU=