 Heng Luo
 Teng Wang
 Shengji Wei
 Mingsheng Liao
 Jianya Gong1,5
- 1State Key Laboratory of Information Engineering in Surveying, Mapping, and Remote Sensing, Wuhan University, Wuhan, China
- 2School of Earth and Space Sciences, Peking University, Beijing, China
- 3Asian School of the Environment, Nanyang Technological University, Singapore, Singapore
- 4Earth Observatory of Singapore, Nanyang Technological University, Singapore, Singapore
- 5School of Remote Sensing and Information Engineering, Wuhan University, Wuhan, China
Small-to-moderate earthquakes (e.g. ≤Mw5.5) occur much more frequently than large ones (e.g. >Mw6.0), yet are difficult to study with InSAR due to their weak surface deformation that are severely contaminated by atmospheric delays. Here we propose a stacking method using time-series SAR images that can effectively suppress atmospheric phase screens and extract weak coseismic deformation in centimeter to sub-centimeter level. Using this method, we successfully derive coseismic surface deformations for three small-to-moderate (Mw∼5) earthquakes in Tibet Plateau and Tienshan region from time-series Sentinel-1 SAR images, with peak line-of-sight deformation ranging from 5–6 mm to 13 mm. We also propose a strategy to downsample interferograms with weak deformation signal based on quadtree mesh obtained from preliminary slip model. With the downsampled datasets, we invert for the centroid locations, fault geometries and slips of these events. Our results demonstrate the potential of using time-series InSAR images to enrich earthquake catalog with geodetic observations for further study of earthquake cycle and active tectonics.
Introduction
Surface deformations produced by shallow earthquakes have been widely studied by Interferometric Synthetic Aperture Radar (InSAR) since the 1992 Landers earthquake (Massonnet et al., 1993). In complementary with seismological observations, InSAR images provide static, high spatial-resolution, near-field surface deformation measurements for earthquakes, allowing for better resolving the absolute location and depth of the slip distribution (e.g., Ferreira et al., 2011; Weston et al., 2011). Thanks to the continuously improving data quality provided by space-borne SAR satellites, more and more studies have been conducted to earthquakes that produce measurable surface deformations (e.g., Elliott et al., 2016; Merryman Boncori, 2019), which improves our understanding of earthquake cycle and tectonic evolution. However, earthquakes that have been studied by InSAR observations mostly have relatively large magnitudes (e.g. >Mw6.0), associated with decimeters to meters of surface deformation. Detailed source properties of smaller earthquakes (e.g. ≤Mw5.5) with coseismic deformation in the level of centimeter or less are in general less studied by InSAR data, despite that they occur much more frequently than larger ones. Some of these small-to-moderate events can cause substantial damages to the infrastructures if occur at very shallow depths (e.g. Wei et al., 2015; Qian et al., 2019). Small-to-moderate earthquakes can also reveal clues about the local fault systems and stress field as they often rupture on unmapped faults (e.g., Xu et al., 2015).
An important reason for the scarce studies on small-to-moderate earthquakes by InSAR data is that, SAR interferograms are often severely contaminated by atmospheric delays, bringing difficulties to extract reliable deformation signal from a single interferogram. Time-series InSAR analysis methods can effectively suppress the atmospheric delays, allowing for extracting millimeter-level deformation along the radar’s line-of-sight (LOS) direction. Such techniques have been developed since 2000s, such as PS-InSAR (e.g., Ferretti et al., 2000), SBAS (e.g., Berardino et al., 2002), and Stacking (e.g., Tymofyeyeva and Fialko, 2015). These techniques, however, are generally used for measuring long-term, continuous ground deformation and less applied to coseismic deformation studies. Some efforts have been made aiming at improving the signal-to-noise ratio (SNR) of coseismic deformation measurements from time-series InSAR images. For instance, Xu et al. (2015) stack the coseismic interferograms to reduce atmospheric errors after estimating and removing linearly elevation-dependent atmospheric signals, which is demonstrated through inverting source parameters for the 2004 Mw5.1 Tabuk earthquake in Saudi Arabia. Grandin et al. (2017) implement a step-function model with the sum of a constant term to extract the subtle signal of coseismic displacement from multi-interferograms spanning the 2018 Mw5.8 Pawnee earthquake in Oklahoma. Although these earthquakes are relatively small, they still caused peak coseismic deformations at the level of a few centimeters.
Here, our effort focuses on pushing the capability of InSAR coseismic signal detection to centimeter and sub-centimeter level. To this end, we select the Tibet Plateau and its surrounding areas as the target region, with two reasons. Firstly, Tibet Plateau is one of the most tectonically active regions that has hosted many moderate to large earthquakes (e.g. >Mw6.0) at shallow depths, many of these recent events have been studied by InSAR data (e.g. Elliott et al., 2010). However, much more smaller earthquakes (e.g. ≤Mw5.5) have been left unstudied. Secondly, Tibet Plateau is relatively dry and less vegetated, therefore coherence can be maintained in a higher level, and the atmospheric impact is much weaker than tropical or sub-tropical regions.
We use SAR data acquired by the C-band Sentinel-1A and 1B satellites launched by the European Space Agency (ESA), which began to provide large-coverage SAR images with 250 km-width frame since April 2014 and April 2016, respectively. The satellites image the Earth surface regularly with short revisit period of 12 days for single satellite and 6 days for twin constellation (Yague-Martinez et al., 2016). The high-temporal sampling rate of Sentinel-1 data produce sufficient images for stacking, which is essential to reduce the local atmospheric turbulence that is difficult to be handled by numerical weather models (Tymofyeyeva and Fialko, 2015). Therefore, the large coverage and short revisit period of Sentinel-1 SAR images provide great potential to extract very weak coseismic deformation for small-to-moderate earthquakes.
In this work, we successfully retrieve coseismic deformations for three earthquakes with magnitudes from Mw5.2 to 5.5 in Tibet region by applying a stacking method using time-series SAR images (Figure 1). These three representative events have thrust, strike-slip and normal faulting mechanisms, respectively. To prepare data for slip inversion by these weak coseismic deformation signals, we propose a new downsampling strategy based on initial model-derived surface deformation. Using these downsampled datasets, we invert for their locations, depths, fault geometries and slip vectors. By studying such small-to-moderate events, we show the potential to enrich earthquake catalog with their source imaged by geodetic observations and discuss its potential use in earthquake cycle studies.
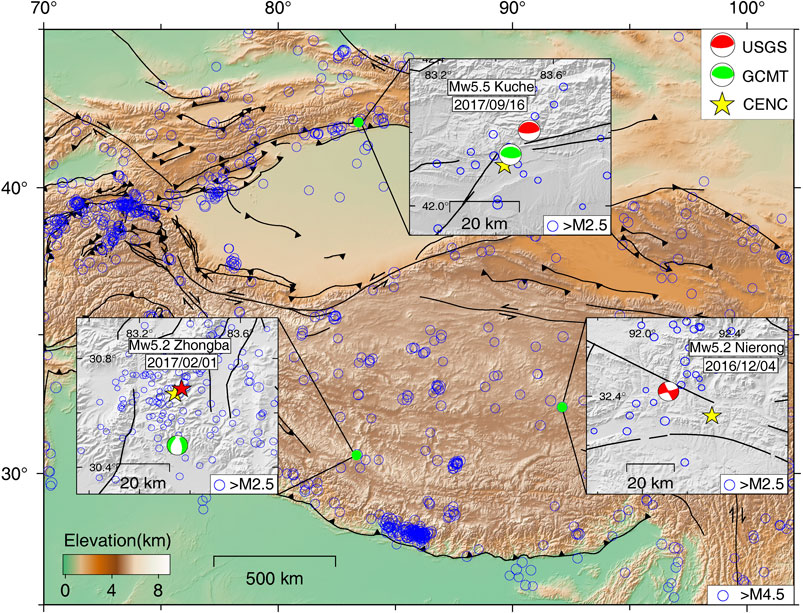
FIGURE 1. The three small-to-moderate earthquakes (2017 Mw5.5 Kuche, 2016 Mw5.2 Nierong and 2017 Mw5.2 Zhongba) studied in this work. The blue circles represent background seismicity (M > 4.5) from the U.S. Geological Survey (USGS). The black solid lines in background represent active fault systems (Xu et al., 2016; Wei et al., 2018). Insets show detailed background seismicity with magnitude larger than M2.5. Within each inset, the colored beachballs represent the locations and mechanisms from USGS (red, star if no mechanism is given) and Global Centroid Moment Tensor (GCMT) (green) (Ekstrom et al., 2012), respectively. Yellow stars are earthquake epicenter locations from China Earthquake Networks Center (CENC).
Data and Method
Time-Series InSAR Data Processing
To derive centimeter to sub-centimeter coseismic deformation, we use time-series Sentinel-1 SAR images acquired before and after an earthquake. The basic SAR interferometry is achieved using the burst-based processing chain implemented in the Sentinel-1 Interferometry Processor (http://sarimggeodesy.github.io/software) (Jiang et al., 2017). The Digital Elevation Model (DEM) from Shuttle Radar Topography Mission (SRTM) is used for coregistration and topography correction. The burst interferograms are mosaicked into one ∼250-km wide interferogram after coregistration. The phase discontinuity between adjacent bursts is estimated from burst-overlap interferometry and satellite parameters, and is corrected before mosaicking (Yague-Martinez et al., 2016). Then the mosaicked interferogram is mutilooked with factors of 4 and 16 in azimuth and range directions, respectively, and is then filtered using the Goldstein method to further improve the SNR (Goldstein and Werner, 1998).
For the proposed stacking method, we select the first SAR image acquired just before the earthquake as reference image and co-register all the other images with it using the above mentioned interferometry processing. We only keep data points with high mean coherence values (i.e., >0.3). Then we unwrap the phases on these selected points based on the Statistical-cost, Network-flow Algorithm for Phase Unwrapping (SNAPHU) (Chen and Zebker, 2000) and manually correct unwrapping errors. After unwrapping, a linear ramp and a linear relation with the elevation are estimated and removed from each interferogram to account for possible long-wavelength and topography-related atmospheric delays (Ding et al., 2008; Jiang et al., 2014). We also discard interferograms with extreme atmospheric turbulence that is difficult to eliminate, or highly decorrelated interferograms that cannot be successfully unwrapped.
If N + M+1 (N+1 before and M after the earthquake) SAR images were acquired around the time of an earthquake, we can derive N interferograms that do not include coseismic deformation and M interferograms that include coseismic deformation using the same reference image. The phases in these unwrapped interferograms could be written as:
where k indicates the reference SAR image acquired just before the earthquake,
Through the stacking, the residual noises
To demonstrate the capability of our method in extracting small coseismic deformation signal, we show a representative application to the 2017/09/16 Mw5.5 Kuche earthquake (Figure 2). For this earthquake, we collect 37 and 36 Sentinel-1 SAR images from the ascending track AT12 and descending track DT165, respectively. SAR images acquired on 2017/09/08 (AT12) and 2017/09/07 (DT165) are selected as reference images because they are the images acquired just before the earthquake. We stack the unwrapped phases on the selected data points (Supplementary Figures S1 and S2) for InSAR interferograms with and without deformation signals in both tracks (Figure 2A and D, B and E). In the stacked InSAR interferograms that cover the earthquake, atmospheric turbulence from the reference images are dominating the data where the coseismic deformation signals are hardly visible due to their weaker amplitudes (Figures 2B,E). As expected, clear coseismic deformation signals emerge when we sum the stacked results with and without the earthquake signals, as this procedure effectively cancels out the atmospheric turbulence phases (Figures 2C,F). Similar enhancements to the coseismic signals in both ascending and descending tracks verify the reliability of our method. For this case, the earthquake locations from USGS, GCMT and CENC are all biased to the northwest of the deformation center, yet within 10 km to the peak of deformation.
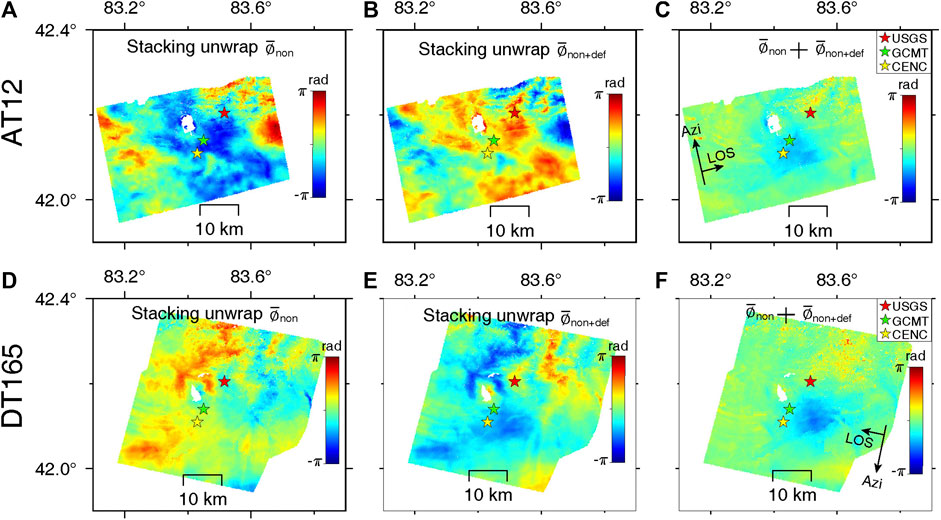
FIGURE 2. Proposed stacking processing for the 2017/09/17 Mw5.5 Kuche earthquake. (A) and (D) show the stacked results of unwrapped interferograms without the earthquake signal. (B) and (E) show the stacked results of unwrapped interferograms with the coseismic signals. (C) and (F) are the final measurements of coseismic deformation signals derived by summing the two previous stacked results in each track. One phase cycle (from –π to π) represents ∼2.8 cm of LOS displacement. Blue means moving towards the satellite. Stars represent earthquake locations from USGS (epicenter, red), GCMT (epicenter, green) and CENC (centroid, yellow), respectively.
To quantitatively evaluate the improvement, we calculate the standard deviations of unwrapped phases in the area out of coseismic deformation for both ascending and descending tracks, before and after applying the proposed stacking method. The values decrease from 1.27 radians and 1.31 radians to 0.27 radians and 0.28 radians, equal to ∼0.12 cm, both achieving a noise reduction of ∼80% (Supplementary Figure S7). This quantitative analysis clearly demonstrates the capability of our method in reducing the influence of atmospheric turbulence and improving SNR. Note that considering the complicated temporal decorrelation mechanism of InSAR, the quantitative evaluation may vary for different earthquakes.
Downsampling Strategy
To reduce the number of data points for slip inversions, we need downsample the original InSAR data. Quadtree partitioning is one of the widely used spatial variant downsampling methods (Jonsson et al., 2002), which is based on calculating variance of the measurements to split original interferograms into different levels of quadrants. If the variance, which represents the gradient of deformation within the quadrant, excesses a pre-determined threshold, the corresponding quadrant is split into four equal sub-quadrants. This procedure is repeated until the variance within each quadrant reaches the pre-assigned minimum threshold or the quadtree level reaches the pre-assigned maximum threshold. The average or median value in each quadrant is calculated to represent this quadrant. Note that this averaging or median-filtering process suppresses the outliers (mostly unwrapping errors) and therefore improves the SNR in the downsampled data.
If the SNR is high, the variance of data points within each quadrant represents the level of deformation gradient of that quadrant. As a consequence, the regions with the densest quadrants are associated with the largest deformation gradients in an unwrapped interferogram. However, for small-to-moderate earthquakes, the residual atmospheric phases and decorrelation noises may have comparable or even larger amplitude relative to the earthquake signal (e.g., Figures 3B,E,H). Therefore, regular quadtree partitioning may lead to many small quadrants, which bring no extra or even negative contribution to constrain the earthquake source parameters.
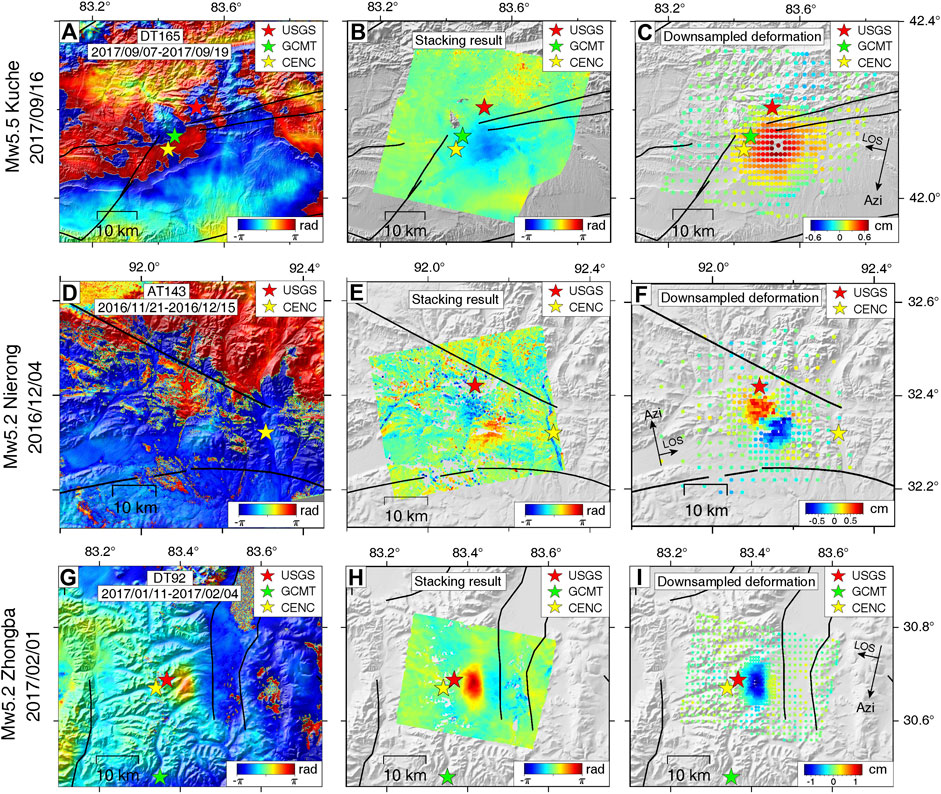
FIGURE 3. Single coseismic interferograms and final deformations derived from the proposed method for the Mw5.5 Kuche, Mw5.2 Nierong, and Mw5.2 Zhongba earthquakes from top to bottom. From left to right, column one shows the coseismic interferograms, column two shows the coseismic deformation signals extracted by the proposed stacking method, column three shows the downsampled data points, with red indicating moving towards and blue indicating moving away from the satellites along the radar’s LOS direction. Stars represent the earthquake locations from USGS (epicenter, red), GCMT (epicenter, green) and CENC (centroid, yellow), respectively.
To overcome this issue, we propose a refinement to the quadtree downsampling strategy. Firstly, we obtain an initial slip model using the standard-quadtree downsampled data points and set the initial values of the source parameters as that from available catalogs (e.g., focal mechanism and fault geometry). We then derive a new quadtree downsampling mesh on the noise free synthetic LOS displacement field produced by this initial slip model. Finally, we apply this new mesh to real InSAR data for downsampling, which effectively reduces the number of data points (Figures 3C,F,I). When the SNR of an interferogram is low, we can also apply the new downsampling process to each interferogram before stacking (Supplementary Figures S3 and S4). Coseismic deformation can be confirmed if their signals continually appear in the time-series downsampled data points after the earthquake. Then we apply the proposed stacking method on these points to obtain the final deformation dataset for inversion.
To quantitatively evaluate the improvement, we compare the downsampled results using standard-quadtree method and the proposed method, and count the numbers of data points inside and outside the deformed area (Supplementary Figure S8). By using standard-quadtree downsampling method, although the number of data points have been reduced from more than one million to about 1,500, many unwanted data points retained due to the high gradients caused by phase noises. After applying the proposed downsampling method, the numbers of data points outside the deformed area have reduce from 1,385 to 260 for the ascending case and from 1,302 to 254 for the descending case, while the numbers of data point inside the deformed area keep nearly the same (217 vs. 199 and 193 vs. 222). The percentages of data points inside the deformed area increase by about 3.2 and 3.6 times for ascending and descending tracks, respectively. Consequently, the InSAR data downsampled by the proposed method show relatively better constraints on fault parameters (e.g. fault width and depth) compared with the result using standard-quadtree downsampling method (Supplementary Figures S9 vs. S7). The misfit in the inversion is also 33% smaller (Supplementary Table S1). This quantitative analysis clearly demonstrates the advantage of our downsampling strategy for studying small-to-moderate earthquakes with weak coseismic deformation.
Fault Geometry Inversion
With the downsampled datasets, we can invert for the source parameters. The earthquake is modeled as a rectangle fault plane with nine unknown parameters describing fault size (width and length), geometry (strike and dip angles), three-dimension location (latitude, longitude and depth) and uniform slip (amplitude and direction) (Okada, 1985). The static Green’s functions are calculated from a homogeneous elastic half-space with Poisson ratio of 0.25. During the inversion of the nine unknown parameters, we use the Geodetic Bayesian Inversion Software (GBIS) to search for the optimal fault geometry and slip vector (Bagnardi and Hooper, 2018).
In the Bayesian framework implemented in GBIS, the posterior probability density function (PDF) is calculated based on the residuals between the data and the model prediction. For each iteration, if the likelihood for the new set of model parameters is greater than previous one, the trial model values are retained. Otherwise the previous set of model parameters is retained. The Markov chain Monte Carlo sampling method is applied during the inversion, incorporating the Metropolis-Hastings algorithm. The final optimal values of model parameters are from the last retained set of model parameters with the maximum posteriori probability after pre-assigned iterations (e.g. 500,000 iterations) (Bagnardi and Hooper, 2018).
For those small-to-moderate earthquakes (e.g. ≤Mw5.5) with centimeter-level surface deformation, the searching result for the optimal parameters, particularly, the strike and dip angles, may not be as robust as that for larger (e.g. >Mw6.0) earthquakes (e.g. Wang et al., 2018). Therefore, we fix the initial strike and/or dip angles based on the focal mechanisms from reputed earthquake catalogs (e.g. USGS or GCMT) and perform the source inversion to obtain the optimal location, depth and slip vector.
Results
We apply the above-mentioned procedure to three earthquakes occurred in Tibet and Tienshan region and present the results in the following sections. These three representative earthquakes have thrust, strike-slip and normal faulting mechanisms, respectively (Figures 1 and 3). According to global catalogs (e.g. USGS, GCMT), they are: the September 16, 2017 Mw5.5 Kuche thrust-faulting earthquake occurred in the south margin of Tienshan; the December 4, 2016 Mw5.2 Nierong strike-slip earthquake occurred in central Tibet Plateau, and the February 1, 2017 Mw5.2 Zhongba normal-faulting earthquake occurred in southern Tibet Plateau. For these three small-to-moderate earthquakes, time-series Sentinel-1 SAR images in both ascending and descending tracks are collected to provide better constraint on the fault geometries and slip vectors (see supplementary figures for time-series results from all tracks).
Mw5.5 Kuche Earthquake
The 2017 Mw5.5 Kuche earthquake (Figure 1, Figures 3A–C and Figure 4A) occurred in the southern Tienshan thrust-and-folding zone, resulted from the converging with the Tarim Basin to the south (Avouac et al., 1993). Seismological solutions from USGS and GCMT all suggest thrust faulting mechanisms, while the earthquake either occurred on a shallowly northward dipping fault (dip = 20°, USGS or 28°, GCMT), or a steeply northward dipping fault (dip = 70°, USGS or 62°, GCMT).
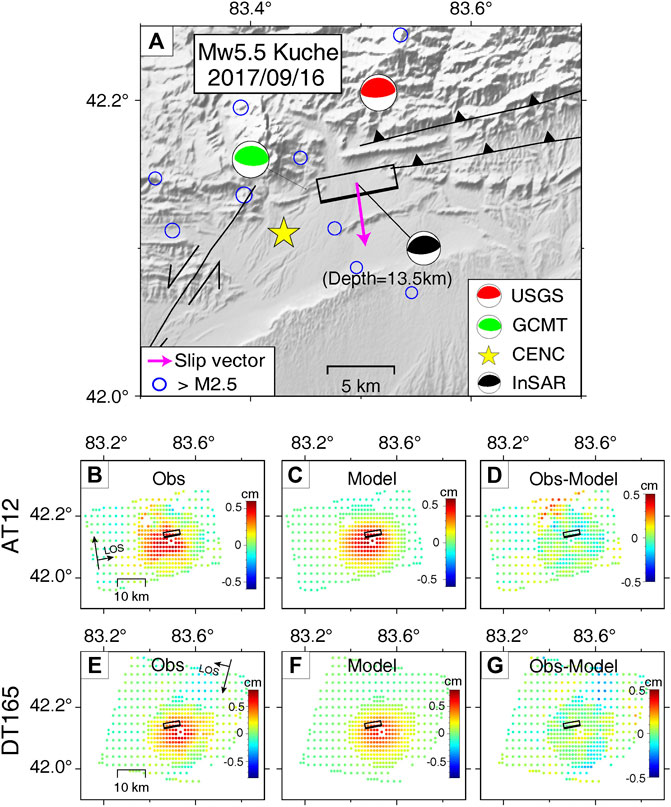
FIGURE 4. Tectonic background and InSAR data modeling results for the 2017/09/17 Mw5.5 Kuche earthquake. (A) Beachball in black shows the focal mechanism derived from InSAR data inversion. Black solid box shows the fault planes with the thick line representing the upper edge. Purple arrow shows map projection of the fault slip vector. Black solid lines represent active faults. Colored beachballs or star represent mechanisms or earthquake locations from USGS (red), GCMT (green) and CENC (yellow). Blue circles denote background seismicity from the USGS catalog. (B) and (E) show coseismic observations from ascending track AT12 and descending track DT165. (C) and (F) show the simulated deformations produced by the preferred slip model. (D) and (G) show the residuals between InSAR observations and model simulations. Black solid boxes represent the fault plane in map view with thicker lines denoting the upper edges.
For the surface deformation, although the coseismic interferogram by single pair of SAR images (Figure 3A) in descending track DT165 is highly coherent without observable phase noises, the atmospheric turbulence seems to be dominating in the interferogram and the deformation signals are hardly visible. It is clear that single interferogram cannot provide reliable measurement for the coseismic deformation for this event. Nevertheless, coseismic signals are much clearer after applying the proposed stacking method (Figures 2 and 3B). We convert the phases to displacement and apply the proposed downsampling strategy.
Besides the descending track DT165 shown in Figure 3C, we also derive the coseismic deformation from ascending track AT12 using 19 and 18 Sentinel-1 SAR images acquired before and after the earthquake, respectively (Supplementary Figure S2). We obtain clear coseismic signal in ascending track AT12 with maximum displacement of 5–6 mm along the LOS direction (Figure 4B), similar to that in the descending track. To our best knowledge, this is the smallest coseismic deformation signal that is robustly observed with InSAR technique. Earthquakes with such weak coseismic deformation has been seldom studied by InSAR data.
The InSAR images from both tracks show a single deformation patch with dominant LOS displacement towards the satellite, suggesting a thrust faulting mechanism that is consistent with seismological focal mechanism. Although the slip model fits the InSAR observations very well (Figures 4B–G), the dipping direction of the fault plane still can’t be resolved due to very small fault dimension and relatively deep centroid depth (13.5 km) (Table 1, Supplementary Figure S7). Also because of deep centroid depth, the other source parameters are not as well constrained as the other shallower events (e.g. Supplementary Figures S7 vs. S8).
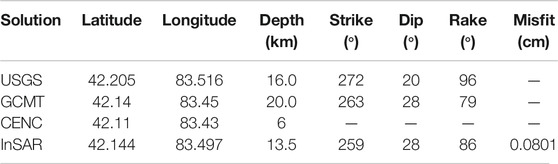
TABLE 1. Solutions in north-dipping plane for the 2017 Mw5.5 Kuche earthquake.
Based on the local tectonic setting, the earthquake is close to two active, thrust-fold faults in the south margin of Tienshan region (Figure 4A). Considering the pervasive, north-dipping thrust faults in the region, we prefer the northward, shallowly dipping fault plane for the Kuche earthquake. We therefore fix the dipping angle as 28° according to the GCMT focal mechanism for the slip inversion (Table 1, Supplementary Figure S7). The best centroid depth of the fault plane is 13.5 km, slightly shallower than that from USGS and GCMT catalogs but deeper than that from CENC catalog. The strike and rake angles derived from our inversion exhibit very similar values to the solutions from GCMT catalog (Table 1).
Mw5.2 Nierong Earthquake
The 2016 Mw5.2 Nierong earthquake (Figure 1, Figures 3D–F and Figure 5A) occurred in the central Tibet. USGS catalog reports a strike-slip focal mechanism, suggesting either a left lateral event on a southwest–northeast striking fault or a right-lateral event on a southeast-northwest striking fault (Table 2). The coseismic deformation can be hardly recognized from the single interferogram, yet emerges after applying the proposed stacking method to the ascending track AT143 (Figures 3D,E). The stacking result for the Nierong earthquake has a lower SNR compared with the Kuche case, mainly due to the larger decorrelation noises (Figure 3E). After applying our proposed downsampling strategy, the downsampled data shows clearer coseismic signals with a maximum amplitude of 8–9 mm along the LOS direction. In the area that is further away from coseismic deformation, the outliers are sufficiently suppressed, although the amplitude in the data (mostly noise) is comparable with the coseismic deformation (Figure 3F). Besides the data for the ascending track AT143 (Figure 3F), time-series Sentinel-1 SAR images from the descending track DT150 are also processed (Supplementary Figures S3, S4). The maximum LOS displacement from descending track is about 1 cm (Figure 5E), slightly larger than that in the ascending data (Figure 3F, Figure 5B).
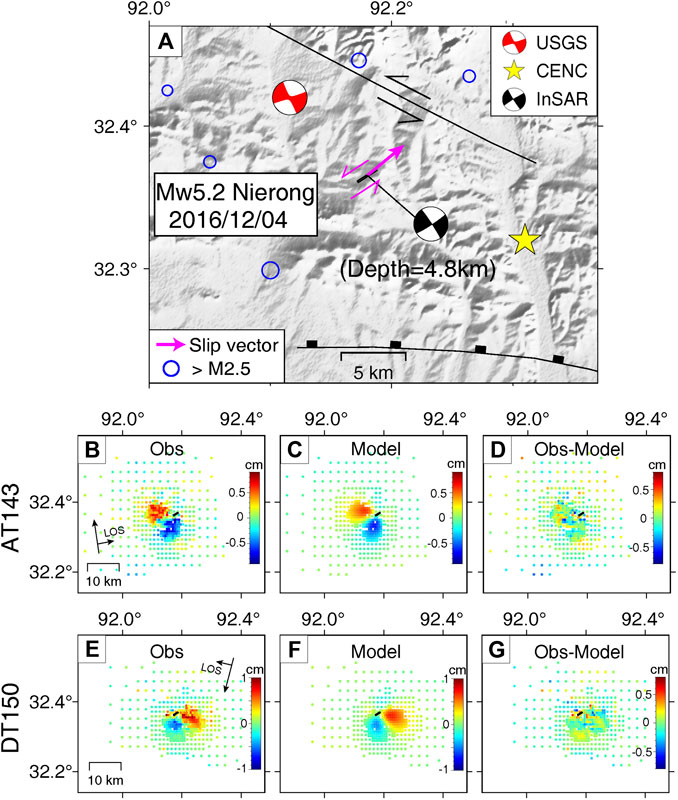
FIGURE 5. Tectonic background and InSAR data modeling results for the 2016/12/04 Mw5.2 Nierong earthquake. (A) Beachball in black shows the focal mechanism from InSAR data inversion. Black solid box shows the fault plane. Thick purple arrow indicates the fault slip vector and thin purple arrows show the left lateral strike-slip direction for this event. Red beachball represents mechanism from USGS catalog and yellow star represents the earthquake locations from CENC catalog. Black solid lines represent active faults. Blue circles denote background seismicity from USGS catalog. (B) and (E) show coseismic observations from ascending track AT143 and descending track DT150. (C) and (F) show the simulated deformations produced by the preferred model. (D) and (G) show the residuals between InSAR observations and model simulations.
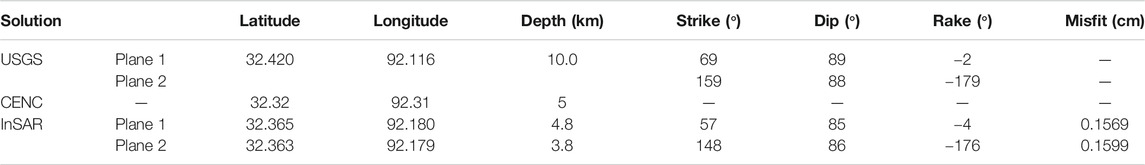
TABLE 2. Solutions for the 2016 Mw5.2 Nierong earthquake.
We use the downsampled dataset for slip model inversion. Similar to what we have done for the Kuche earthquake, we assume uniform slip on a rectangle fault and search for optimal values of all the nine source parameters. While different with the Kuche earthquake, the gradient of observed coseismic deformations for the Nierong earthquake is relative larger to better constrain the coseismic slip model. Therefore, we performed geodetic inversion on both nodal planes and selected the fault plane with smaller misfits (Table 2). As shown in Figures 5B,E, both ascending and descending tracks show typical deformation pattern for a strike-slip faulting mechanism, which is well reproduced by our preferred slip model (Figures 5C,F) (Table 2). Our InSAR derived fault geometry is highly consistent with the solution from USGS catalog. But note that the centroid depth derived from InSAR inversion (4.8 km) agrees better with the CENC report (5 km), both are much shallower than the USGS catalog (10 km). Compared with the Kuche earthquake, the Nierong earthquake is much shallower (4.8 km vs 13.5 km), hence the surface deformations have larger spatial gradient. The inverted source parameters therefore are better constraint with smaller uncertainties (Supplementary Figures S8 vs. S7).
The misfit in the southwest-northeast striking plane (strike angle 57° by InSAR) is slightly smaller than the southeast-northwest striking plane (strike angle 148° by InSAR) (Table 2). The fault plane in northeast-southwest striking direction is nearly perpendicular to the nearly west-east striking faults to the north (Figure 5A). Such striking direction and focal mechanism may be explained as a transition fault connecting the normal fault to the south to the left-lateral fault to the north (Figure 5A). Considering better data fitting and the tectonic background, we prefer the fault plane in southwest-northeast striking direction for the 2016 Mw5.2 Nierong earthquake.
Mw5.2 Zhongba Earthquake
The 2017 Mw5.2 Zhongba earthquake (Figure 1, Figures 3G–I and Figure 6A) occurred in southern Tibet Plateau where a series of major NS-trending rifts accommodate the east-west extension of the plateau (Ryder et al., 2012). Seismological solution from GCMT catalog indicates a normal faulting focal mechanism with nodal planes dipping towards east or west (Figure 1). For the surface deformation, the coseismic signals can be recognized from the single interferogram in the descending track DT92 (Figure 3G), but the signals caused by the temporally uncorrected atmospheric turbulences are also visible with similar magnitude of the coseismic deformation. After applying the proposed stacking method, the atmospheric phase screens have been largely reduced, resulting in very clear coseismic signals (Figure 3H). We then convert the phases to displacements and downsample the observations, which have a maximum deformation of 1.3 cm along the LOS direction (Figure 3I). Besides the observations in descending track DT92 (Figure 3D), coseismic deformation is also measured in ascending track AT158 with the maximum LOS deformation of 1.2 cm (Supplementary Figures S5 and S6, Figure 6E).
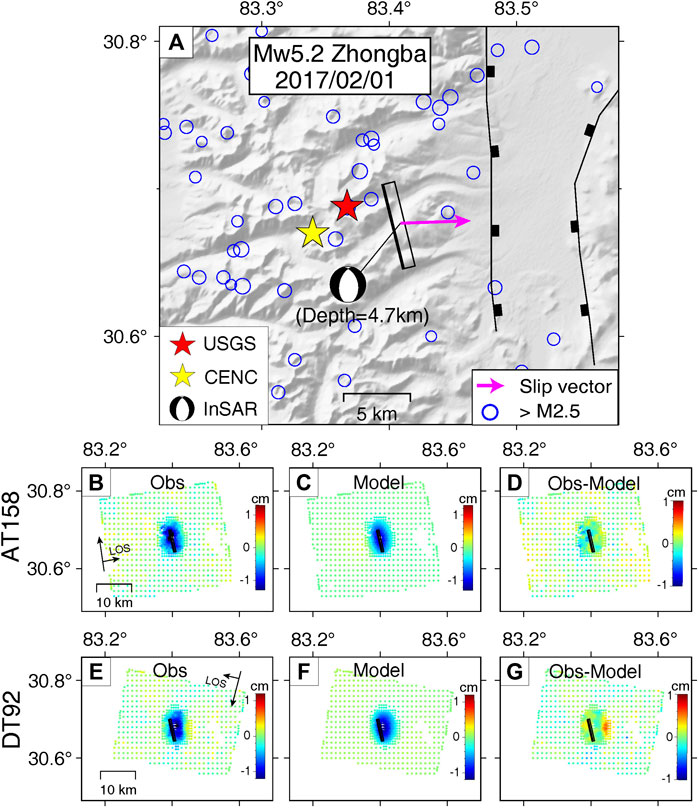
FIGURE 6. Tectonic background and InSAR data modeling results for the 2017/02/01 Mw5.2 Zhongba earthquake. (A) Beachball in black shows the inverted focal mechanism from InSAR data inversion. Black solid box shows the fault planes with the thicker line representing the upper edge. Purple arrow shows map projection of the fault slip vector. Colored stars represent mechanisms or earthquake locations from USGS (red) and CENC (yellow). GCMT location is off the map boundary. Black solid lines represent active faults. Blue circles denote background seismicity from USGS catalog. (B) and (E) show coseismic observations from ascending track AT158 and descending track DT92. (C) and (F) show the simulated deformations produced by the preferred model. (D) and (G) show the residuals between InSAR observations and model simulations. Black solid boxes represent the ground project of fault plane with thicker edges denoting the upper edges.
Although the coseismic deformation is larger than the Kuche and Nierong events, the deformation gradients are still too small to resolve dipping direction of the ruptured fault plane. As Figure 6A shows, the earthquake is located ∼5 km to the west of a graben, which is bounded by two normal faults. We therefore prefer a fault plane that dips towards east, i.e. the graben, for the Zhongba earthquake and fix the dipping angle as 43° according to the GCMT focal mechanism for the slip inversion (Table 3). The preferred slip model fits the InSAR observations very well (Figures 6B–G) and the strike and dip angles are very similar to the solution from GCMT catalog (Table 3).
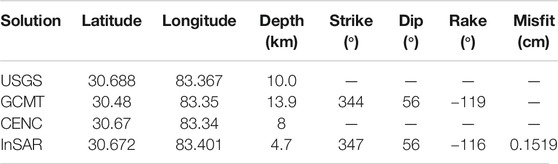
TABLE 3. Solutions in east-dipping plane for the 2017 Mw5.2 Zhongba earthquake.
Discussion and Conclusion
InSAR technique can provide high spatial-resolution surface deformation measurements in sub-centimeter accuracy and has been widely applied in earthquake studies. Nevertheless, for small-to-moderate earthquakes, InSAR observations are restricted by the weak and smooth surface deformation. Thanks to the Sentinel-1A/B satellites that routinely image the Earth surface with a large scan-width of 250 km and short-repeating time, more earthquakes with centimeter-level coseismic deformation can be captured by the proposed stacking method using time-series SAR images. In this study, the maximum LOS deformation amplitude is only ∼6 mm for the 2017 Mw5.5 Kuche earthquake, which is well less than previous earthquake studies using InSAR in the literature.
Note that our method requires large amount of SAR images to achieve the best performance in eliminating atmospheric turbulence. It may be difficult for previous SAR missions such as ERS and Envisat. Nevertheless, the Sentinel-1 mission is designed to monitor the active Plate boundary regions. At least 12-days repeating time can be guaranteed for tectonic active region, such as Tibet Plateau, allowing us to study such regions with high seismicity rate. Another limitation of our method is that we cannot avoid the leakage of post-seismic motion in our measurements. However, the postseismic motion for small-to-moderate earthquakes (e.g. ≤Mw5.5) should be small and have very limited influence on the centroid location and fault geometry inversion, as postseismic slips likely occur on or near the same fault that ruptured coseismically.
The exact number of images used in the proposed method depends on many factors, such as coherence, topography, and the level of atmospheric delays. For example, for the 2017 Mw6.5 Jiuzhaigou earthquake in Sichuan, decorrelation noise leads to no reliable coseismic measurement along the rupture for the interferogram with only 12-days time interval (Sun et al., 2018). While for the 2017 Mw5.5 Kuche earthquake in this study, even with eight-month time interval (Supplementary Figures S1 and S2), the interferogram exhibits good coherence. Therefore, situation varies much with earthquakes occurred at different places. It is difficult to directly define the specific number of images required for applying the method. Generally, for earthquake occurred in less vegetated area, we can use 10–30 SAR images to achieve a large noise reduction. In the highly vegetated area, we need carefully select interferograms with relative high coherences to avoid the effects of decorrelation noises, and therefore, resulted in less SAR images involved in our stacking method.
To further explore the detection threshold for small-to-moderate earthquakes by time-series InSAR images, we perform a large number of forward modeling for earthquakes with various magnitudes and depths. For each model with given magnitude, a square fault plane is assumed with its area calculated by a typical stress drop of 2.7 MPa (Kanamori and Anderson, 1975; Abercrombie, 1995) using a shear modulus of 30 GPa (Jonsson et al., 2002). Despite that different faulting mechanism may result in different deformation patterns and amplitudes, we take the focal mechanisms from the three events studied in this work as examples in the forward modeling and calculate the maximum surface deformations along the descending LOS direction. The maximum LOS deformations are plotted as a function of event magnitude and centroid depth for these three representative events with thrust-faulting, strike-slip and normal-faulting mechanisms, respectively (Figure 7).
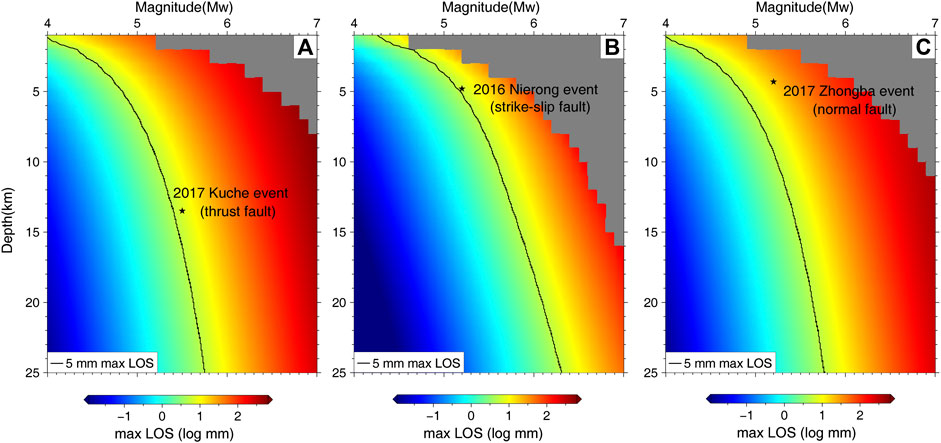
FIGURE 7. InSAR detection boundary for earthquakes with the fault geometries from (A) the 2017 Mw5.5 Kuche earthquake, (B) the 2016 Mw5.2 Nierong earthquake, and (C) the 2017 Mw5.2 Zhongba earthquake. The surface deformation is projected along the descending LOS direction, and plotted along with magnitudes and centroid depths. Black solid line represents 5 mm of LOS deformation, which is supposed to be the maximum coseismic deformation signals that can be extracted by the proposed stacking method.
As expected, there is a clear trade-off between the earthquake magnitude and centroid depth. If the limitation of the maximum LOS deformation that the proposed stacking method can resolve is 5 mm, the detection threshold can then be determined (the black lines in Figure 7), where events beneath the threshold cannot be detected. Because of the large uncertainty of centroid depth determined by tele-seismic observations, such threshold can be generated based on magnitude and fault geometries from reputed earthquake catalogs before InSAR analysis, providing useful information to roughly determine whether the earthquake is suitable to be studied with InSAR.
Given similar magnitudes, the resolvable depths associated with dip-slip earthquakes are relative deeper (Figures 7A,C) than that from the strike-slip event (Figure 7B). This is because InSAR is more sensitive to the vertical ground motion. For an earthquake with given magnitude and depth, normal-faulting or thrust-faulting events produce mainly vertical surface deformation, which is more possible to be detected by InSAR. For strike-slip event that produces mainly horizontal surface deformation, the situation is more complicated, as different strike angles will cause different LOS projections too. Nevertheless, referring to the detection threshold by InSAR, the proposed method allows us to study shallow dip-slip earthquakes (shallower than 5 km) with moment magnitudes less than Mw5.0. Therefore, we believe that more and more small-to-moderate earthquakes can be studied with InSAR constraints, significantly enriching earthquake catalogs with geodetically derived fault parameters.
Repeating earthquakes that occur on the identical fault segment are critical for earthquake cycle study, while large characteristically repeating earthquakes (e.g. >Mw7.0) are rare with long recurrence interval. Most well-documented repeaters are detected by seismic data with small magnitudes (Uchida and Bürgmann, 2019). Such earthquakes maybe in the detection range of our method if with proper magnitude and depth (refer to Figure 7). The large amount of archived Sentinel-1 data in global coverage provide the great opportunity to study these repeating earthquakes if their surface deformation is measurable. We believe that along with more and more small-to-moderate events that can be detected by the proposed method, we may find repeating earthquakes with InSAR measurements spanning the full earthquake cycle. For such case, both geodetic and seismic data can be used to reveal more details of their fault geometry and rupture process, casting new lights on earthquake cycle studies.
Our study shows that InSAR technique can provide high spatial-resolution surface deformation measurements at sub-centimeter accuracy and is successfully applied to earthquake source studies. However, we realize that InSAR data alone may not be sufficient to resolve the ruptured fault plane for the three earthquakes we presented in this study. As Supplementary Figure S13 shows, due to the deep depth (13.5 km) of the Kuche event, the coseismic deformations are very small (6–8 mm) and smooth, providing weak constraints on slip model. The Markov chains for the model parameters (except earthquake location) cannot converge well after 500,000 iterations. Consequently, the optimal solution (red lines in Supplementary Figure S10) can be off from the peak of the model-parameter distribution. While for the Zhongba earthquake, the centroid depth is very shallow (<5 km), coseismic observations of ground deformations can provide relatively strict constraints on the slip model, the Markov chains for the source parameters are well converged (Supplementary Figure S14) and the red lines of inverted parameters are near the peak of the model-parameter distributions (Supplementary Figure S12). Moreover, it is more difficult to resolve the rupture details when the centroid becomes deeper. Our preferences of the ruptured fault plane are primarily based on independent constraints (e.g. nearby fault mapping and background tectonics). Therefore, such geodetic data should be used together with seismological and geological observations to better constrain the source parameters, such as rupture processes, slip distribution and stress drop on the fault.
To conclude, in this study, we propose a stacking method using time-series SAR images to extract reliable sub-centimeter coseismic deformation, reaching an unprecedented level than regular single interferometry for studying earthquakes. Our results imply that it is possible to significantly enrich earthquake catalogs with geodetic observations, thus improving our understanding of earthquake physics and active tectonics.
Data Availability Statement
The original contributions presented in the study are included in the article/Supplementary Material, further inquiries can be directed to the corresponding author.
Author Contributions
TW initialed and conceived the study. HL conducted the InSAR data processing and coseismic slip model inversions. ML provided funding and supervising for the study. HL wrote the manuscript with contributions from TW and SW. All authors discuss and interpret the results and the manuscript.
Funding
This work was supported by the National Key Research and Development Program of China (Grant No. 2019YFC1509201) and the National Science Foundation of China (NSFC Grant Nos. U1939202 and 41974017). Shengji Wei is partially supported by Earth Observatory of Singapore grant 04MNS001909A620.
Conflict of Interest
The authors declare that the research was conducted in the absence of any commercial or financial relationships that could be construed as a potential conflict of interest.
Acknowledgments
Sentinel-1 SAR data are copyrighted by the European Space Agency, and are additionally distributed by the Alaska Satellite Facility. Additional data related to this paper may be requested from the authors.
Supplementary Material
The Supplementary Material for this article can be found online at: https://www.frontiersin.org/articles/10.3389/feart.2021.636398/full#supplementary-material.
References
Abercrombie, R. E. (1995). Earthquake source scaling relationships from −1 to 5MLusing seismograms recorded at 2.5-km depth. J. Geophys. Res. 100, 24015–24036. doi:10.1029/95jb02397
Avouac, J. P., Tapponnier, P., Bai, M., You, H., and Wang, G. (1993). Active thrusting and folding along the northern Tien Shan and late Cenozoic rotation of the Tarim relative to dzungaria and Kazakhstan. J. Geophys. Res. 98, 6755–6804. doi:10.1029/92jb01963
Bagnardi, M., and Hooper, A. (2018). Inversion of surface deformation data for rapid estimates of source parameters and uncertainties: a Bayesian approach. Geochem. Geophys. Geosyst. 19, 2194–2211. doi:10.1029/2018gc007585
Berardino, P., Fornaro, G., Lanari, R., and Sansosti, E. (2002). A new algorithm for surface deformation monitoring based on small baseline differential SAR interferograms. IEEE Trans. Geosci. Remote Sens. 40, 2375–2383.
Chen, C. W., and Zebker, H. A. (2000). Network approaches to two-dimensional phase unwrapping: intractability and two new algorithms. J. Opt. Soc. Am. A Opt. Image Sci. Vis. 17, 401–414. doi:10.1364/josaa.17.000401
Ding, X.-L., Li, Z.-W., Zhu, J.-J., Feng, G.-C., and Long, J.-P. (2008). Atmospheric effects on InSAR measurements and their mitigation. Sensors 8, 5426. doi:10.3390/s8095426
Ekström, G., Nettles, M., and Dziewoński, A. M. (2012). The global CMT project 2004-2010: centroid-moment tensors for 13,017 earthquakes. Phys. Earth Planet. In. 200–201, 1–9. doi:10.1016/j.pepi.2012.04.002
Elliott, J. R., Walters, R. J., England, P. C., Jackson, J. A., Li, Z., and Parsons, B. (2010). Extension on the Tibetan plateau: recent normal faulting measured by InSAR and body wave seismology. Geophys. J. Int. 183, 503–535.
Elliott, J. R., Walters, R. J., and Wright, T. J. (2016). The role of space-based observation in understanding and responding to active tectonics and earthquakes. Nat. Commun. 7, 13844.
Ferretti, A., Prati, C., and Rocca, F. (2000). Nonlinear subsidence rate estimation using permanent scatterers in differential SAR interferometry. IEEE Trans. Geosci. Remote Sens. 38, 2202–2212.
Ferreira, A., Weston, J., and Funning, G. (2011). Global compilation of interferometric synthetic aperture radar earthquake source models: 2. Effects of 3‐D Earth structure. J. Geophys. Res.: Solid Earth 116.
Goldstein, R. M., and Werner, C. L. (1998). Radar interferogram filtering for geophysical applications. Geophys. Res. Lett. 25, 4035–4038. doi:10.1029/1998gl900033
Grandin, R., Vallée, M., and Lacassin, R. (2017). Rupture process of the Mw5.8 Pawnee, Oklahoma, earthquake from sentinel‐1 InSAR and seismological Data. Seismol. Res. Lett. 88, 994–1004.
Jiang, H., Feng, G., Wang, T., and Bürgmann, R. (2017). Toward full exploitation of coherent and incoherent information in Sentinel-1 TOPS data for retrieving surface displacement: application to the 2016 Kumamoto (Japan) earthquake. Geophys. Res. Lett. 72, 253. doi:10.1002/2016gl072253
Jiang, H., Zhang, L., Wang, Y., and Liao, M. (2014). Fusion of high-resolution DEMs derived from COSMO-SkyMed and TerraSAR-X InSAR datasets. J. Geodyn. 88, 587–599. doi:10.1007/s00190-014-0708-x
Jonsson, S., Zebker, H., Segall, P., and Falk, A. (2002). Fault Slip distribution of the 1999 Mw 7.1 hector mine, California, earthquake, estimated from satellite radar and GPS measurements. Bull. Seismol. Soc. Am. 92, 1377–1389. doi:10.1785/0120000922
Kanamori, H., and Anderson, D. L. (1975). Theoretical basis of some empirical relations in seismology. Bull. Seismol. Soc. Am. 65, 1073–1095.
Massonnet, D., Rossi, M., Carmona, C., Adragna, F., Peltzer, G., Feigl, K., et al. (1993). The displacement field of the Landers earthquake mapped by radar interferometry. Nature 364, 138–142.
Merryman Boncori, j. P. (2019). Measuring coseismic deformation with spaceborne synthetic aperture radar: a review. Front. Earth Sci. 7.
Okada, Y. (1985). Surface deformation due to shear and tensile faults in a half-space. Bull. Seismol. Soc. Am. 75, 1135–1154.
Qian, Y., Chen, X., Luo, H., Wei, S., Wang, T., Zhang, Z., et al. (2019). An extremely shallow Mw4.1 thrust earthquake in the Eastern Sichuan Basin (China) likely triggered by unloading during infrastructure construction. Geophys. Res. Lett. 46, 13775–13784.
Ryder, I., Bürgmann, R., and Fielding, E. (2012). Static stress interactions in extensional earthquake sequences: an example from the South Lunggar Rift, Tibet. J. Geophys. Res. Solid Earth 117, 9365. doi:10.1029/2012jb009365
Sun, J., Yue, H., Shen, Z., Fang, L., Zhan, Y., and Sun, X. (2018). The 2017 Jiuzhaigou earthquake: a complicated event occurred in a young Fault System. Geophys. Res. Lett. 45, 2230–2240. doi:10.1002/2017gl076421
Tymofyeyeva, E., and Fialko, Y. (2015). Mitigation of atmospheric phase delays in InSAR data, with application to the eastern California shear zone. J. Geophys. Res. Solid Earth 120, 5952–5963. doi:10.1002/2015jb011886
Uchida, N., and Bürgmann, R. (2019). Repeating earthquakes. Annu. Rev. Earth Planet Sci. 47, 305–332. doi:10.1146/annurev-earth-053018-060119
Wang, T., Wei, S., Shi, X., Qiu, Q., Li, L., Peng, D., et al. (2018). The 2016 Kaikōura earthquake: simultaneous rupture of the subduction interface and overlying faults. Earth Planet Sci. Lett. 482, 44–51. doi:10.1016/j.epsl.2017.10.056
Wei, S., Avouac, J. P., Hudnut, K. W., Donnellan, A., Parker, J. W., Graves, R. W., et al. (2015). The 2012 Brawley swarm triggered by injection-induced aseismic slip. Earth Planet. Sci. Lett. 422, 115–125.
Wei, X., Zheng, H., Wang, P., Tada, R., Clift, P. D., Jourdan, F., et al. (2018). Miocene Volcaniclastic sequence within the Xiyu formation from source to sink: implications for drainage development and tectonic evolution in eastern Pamir, NW Tibetan plateau. Tectonics 37, 3261–3284. doi:10.1029/2018tc005008
Weston, J., Ferreira, A. M. G., and Funning, G. J. (2011). Global compilation of interferometric synthetic aperture radar earthquake source models: 1. Comparisons with seismic catalogsJ. Geophys. Res. 116.
Xu, X., Han, Z., and Yang, X. (2016). Seismotectonic map in China and its adjacent regions (in Chinese). Beijing: Seismological Press.
Xu, W., Dutta, R., and Jónsson, S. (2015). Identifying active faults by improving earthquake locations with InSAR data and Bayesian estimation: The 2004 Tabuk (Saudi Arabia) earthquake sequenceBull. Seismol. Soc. Am. 105, 765–775.
Keywords: centimeter-level coseismic deformation, stacking, fault geometry inversion, small-to-moderate earthquake, Tibet Plateau and Tienshan region
Citation: Luo H, Wang T, Wei S, Liao M and Gong J (2021) Deriving Centimeter-Level Coseismic Deformation and Fault Geometries of Small-To-Moderate Earthquakes From Time-Series Sentinel-1 SAR Images. Front. Earth Sci. 9:636398. doi: 10.3389/feart.2021.636398
Received: 01 December 2020; Accepted: 14 January 2021;
Published: 17 February 2021.
Edited by:
Wanpeng Feng, Sun Yat-sen University, Zhuhai Campus, ChinaReviewed by:
Xiaohui He, Sun Yat-Sen University, ChinaXiaopeng Tong, Institute of Geophysics, China Earthquake Administration, China
Copyright © 2021 Luo, Wang, Wei, Liao and Gong. This is an open-access article distributed under the terms of the Creative Commons Attribution License (CC BY). The use, distribution or reproduction in other forums is permitted, provided the original author(s) and the copyright owner(s) are credited and that the original publication in this journal is cited, in accordance with accepted academic practice. No use, distribution or reproduction is permitted which does not comply with these terms.
*Correspondence: Mingsheng Liao, bGlhb0B3aHUuZWR1LmNu