 Hamdi Omar
 Anne-Christine Da Silva
 Chokri Yaich
- 1Department of Geological Engineering, National Engineering School of Sfax, Sfax University, Sfax, Tunisia
- 2Laboratory of Georessources, Materials Environment and Global Change, Faculty of Sciences of Sfax, University of Sfax, Sfax, Tunisia
- 3Sedimentary Petrology Laboratory, Liège University, Liège, Belgium
High-resolution magnetic susceptibility and % CaCO3 records (5 to 10 cm sampling interval) are used to track astronomical cycles from a Lower Berriasian record from central Tunisia. Six hundred and twenty two samples were measured for magnetic susceptibility and carbonate content as paleoclimate proxies for the detection of potential Milankovitch cycles. Elemental data using X-Ray fluorescence analyses was acquired from 19 samples to prove the reliability of the MS signal on recording the past paleoclimatic changes. We performed multiple spectral analyses and statistical techniques on the magnetic susceptibility signal, such as Multi-taper Method, Evolutive Harmonic Analysis, Correlation Coefficient, Time-optimization, and Average Spectral Misfit to obtain an optimal astronomical model. The application of these spectral analysis techniques revealed a pervasive dominance of E405-kyr and e100-kyr cycles showing that the climate turnover across the early Berriasian—middle Berriasian seems to had been governed by the long and short orbital eccentricity cycles. The identification of Milankovitch cycles in the record also allowed to propose a floating astronomical timescale of the studied section, with ~4 long eccentricity cycles (E405) extracted, which points to a duration estimate of ~1.6 Myr with an average sediment accumulation rate (SAR, after compaction) of 2.77 cm/kyr. The inferred floating ATS was tuned to the La2004 astronomical solution. In addition, we applied the DYNOT and ρ1 methods for seal-level change modeling to reconstruct a local eustatic profile which matches the previously published local and global eustatic charts.
Introduction
The Cretaceous is the only system/period of the Phanerozoic that has not yet been defined by a basal GSSP. The Berriasian base [145.7 ± 0.8 (GTS 2016) vs. 145.0 ± 0.8 (GTS2012)] is defined as follow: In GTS2012, a working definition of the base of magnetic Chron M18r (Wimbledon et al., 2011) was used to place the Jurassic—Cretaceous (J–K) boundary whereas in the GTS2016, the Jurassic/Cretaceous working group favored a slightly older level in the middle of Chron M19n at the “explosion” of small, globular Calpionella alpina (base of Calpionellid Zone B). Some other studies (e.g., Vennari et al., 2014) proposed a completely different chronostratigraphic model for the base of the Berriasian at 139.55 ± 0.09 Ma. More recently, Wimbledon et al. (2020) have proposed the locality of Tré Maroua (Hautes-Alpes, SE France) as a GSSP for the Berriasian stage. However, their work has immediately been criticized by Granier et al. (2020) because the proposed GSSP does not meet at least four of the five geological requirements for a GSSP.
In central Tunisia (Southern Tethys margin), Figure 1A the Lower Cretaceous (Berriasian) stratigraphic record offers a scenic exposure of strata, extremely amenable for stratigraphic investigations. The Sidi Khalif Formation at Jebel Meloussi locality (central Tunisia) is one of the most suitable section for this purpose. Indeed, extensive stratigraphic studies (mainly biostratigraphic investigations) have been widely carried out on this Formation during the last few decades (Burollet, 1956; Memmi, 1967; Busnardo et al., 1976, 1981; Maalaoui and Zargouni, 2016a,b; Ben Nsir et al., 2019) but some of them are controversial (e.g., M'Rabet, 1987; Maalaoui and Zargouni, 2016a; Ben Nsir and Boughdiri, 2017). In this context, several studies (Allen, 1981, 1998; Hallam, 1984, 1985, 1986; Deconinck and Strasser, 1987; Hallam et al., 1991; Deconinck, 1993; Ruffell and Rawson, 1994; Price, 1999) have evidenced the existence of widespread dry and cold climate period during the upper Jurassic. This climatic phase has been followed by a relatively more humid period during the lower Cretaceous (middle to upper Berriasian). Recently, Schnyder et al. (2005) carried out a paleoclimate investigation of the Berriasian stage based on total palynofacies and clay mineralogy from the Sidi Khalif Formation at this locality (Central Tunisia). In their study, Schnyder et al. (2005) reported a major climate change with dry and cool phase, during the late Tithonian to early Berriasian transitioning to a more humid phase in the middle to late Berriasian, indicated by a general increase in kaolinite in the clay mineral assemblages. This trend from a dry climatic phase to a more humid one, is also recorded in higher paleolatitudes, from the boreal area, the northern margin of the Tethys Sea (Deconinck, 1987, 1993; Rasplus et al., 1987; Schnyder, 2003) and also documented southerly in Morocco (Agadir area), on the Atlantic domain (Daoudi et al., 1989; Daoudi and Deconinck, 1994).
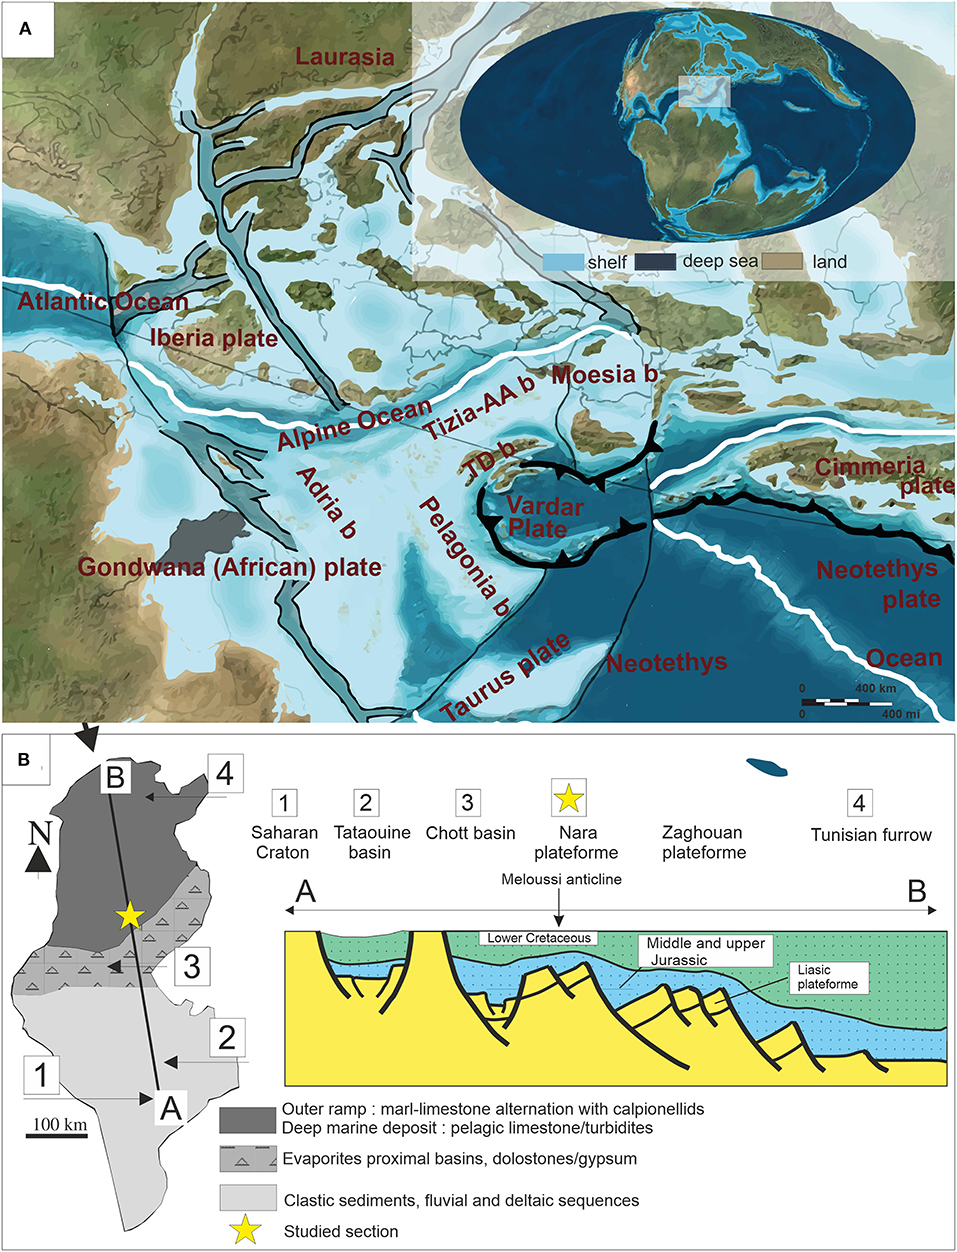
Figure 1. Geologic and geographic setting of the study area. (A) Location of the study area within the Southern Tethys margin during the Late Jurassic (modified after R. Blakey, Colorado Plateau Geosystems, http://cpgeosystems.com/). (B) Late Tithonian paleogeography and facies distribution of Tunisia (modified after Soussi, 2002). The “AB” section shows the Jurassic and Early Cretaceous structural configuration of the Southern Tethys margin (Tunisia). Note the middle position of the Jebel Meloussi outcrop, between the continental saharan craton and the deep marine environments of the “Tunisian furrow” (modified after Soussi, 2002).
In this flopped context of biostratigaphic data, we propose to carry out a cyclostratigraphic study on the Berriasella Jacobi ammonite zone that could help to provide independent data to constrain the duration of this ammonite biozones and thus improve the next GTS (Hinnov and Ogg, 2007). Astrochronology is the field of study (Strasser et al., 2007; Hinnov, 2013) that uses these geologic records of climate rhythms (results of quasiperiodic variations in the Earth's rotation and motion around the sun) to quantify the transit of time from cyclic layers in geologic strata. These climate cycles or the so-called “Milankovitch cycles,” are caused by the change in the astronomical parameters of the earth motion in the solar system: the eccentricity (405, 123, and 95 kyr), the obliquity (41 kyr) and the precession of the Earth's rotational axis (20 kyr, average precession). Astrochronology provides a direct link between climate oscillations and chronometer which make it a powerful tool in measuring the time through Earth history. Traditional biostratigraphy, magnetostratigraphy and radio-isotopy are often insufficient to yield the rate of geologic mechanisms over short timescale (10 kyr), because of limitations of their accuracy and/or the lack of datable horizons in geologic records. Astrochronology provides a very high-resolution timescale and a strong predictive framework which make it an axial component of integrated stratigraphy (e.g., Aswasereelert et al., 2013; Hilgen et al., 2014; Sageman et al., 2014; Meyers, 2019).
In this study, we used an Astronomical Timescale (ATS) for the lower Sidi Khalif Formation in central Tunisia (Southern Tethys margin). The interval of interest is the basal unit of the Cretaceous outcropping at Jebel Meloussi. Here, we provide an orbital tuning of the sedimentary series from magnetic susceptibility (MS) and calcium carbonate content (% CaCO3) measurements. The obtained ATS is relatively independent of biostratigraphic zones and is not based on subjective counting of marl-limestone couplets, but on a combination of multiple spectral analyses and statistical techniques on the magnetic susceptibility signal.
Geological Setting
The studied section belongs to the Jebel Meloussi anticline, which is located in central Tunisia, at ~53 km south of the city of Sidi Bouzid (Figure 1B). During the Jurassic-Cretaceous transition, the southern margin of the Tethys ocean (Tunisia) is divided into tilted grabens of E-W direction delimiting different paleogeographic domains (Figure 1B). The southern part of this margin corresponds to the Saharan craton, to the Tataouine basin and to the Chotts basin (Figure 1B). The more open marine environments are located further northward in the Central Atlas domain and successively include the platforms of Nara and Zaghouan, followed, to the north, by the Tunisian furrow (Figure 1B). In this paleogeographic setting, the studied section is located at the Jurassic-Cretaceous transition in an intermediate position, between the Wealdian facies in the South and deep marine environments in the North (Figure 1B). This site was selected because it has the advantage of being, proximal enough to the continental detrital input, and thus, sensitive to record climatic variations, but also distal enough to be dated by pelagic faunas and provide an initial timescale for cyclostratigraphic investigations. Furthermore, it is ideal for astrochronology to deal with an interval of continuous sedimentation, which is, indeed, supported by the occurrence of all Calpionella alpine subzones (B1, B2, and B3) (Maalaoui and Zargouni, 2016a) and the absence of any evidence of hiatus, subaerial exposure, erosional features or condensation levels, as revealed by meticulous field observation of sedimentological patterns.
Ammonite and calpionellids biozonations have been first established by M'Rabet (1981, 1987) to the Berriasella Jacobi ammonite zone and Calpionallids Zone B, respectively, inferring that this Formation spans the uppermost Tithonian and the entire Berriasian. However, contrasting biostratigraphic hypothesis have been published recently for the Sidi Khalif Formation at Jebel Meloussi by Maalaoui and Zargouni (2016a). The biostratigraphic setting of the Berriasian has been established, but the existence or not of the Tithonian series has been strongly discussed (Ben Nsir and Boughdiri, 2017).
We focus our work on the lower Berriasian (Berriasella Jacobi ammonite zone) which is composed of moderately bioturbated, undisturbed marl-limestone couplets at the base of the section, grayish to greenish marl in the middle part, whereas the upper part consists essentially of limestone (Figures 2, 3). The macrofauna, mainly represented by ammonites, belemnites and occasionally by brachiopods and lamellibranches, irregular echinoids and belemnite guards, is typical of hemipelagic environments, with an estimated water-depth of several hundreds of meters (Hoedemaeker and Leereveld, 1995). The abundance of ammonite specimens and planktonic foraminifera provides the biostratigraphic framework at the zone level (M'Rabet, 1981, 1987) and subzone level (Maalaoui and Zargouni, 2016a). The studied section extends from marls overlaying bed 4 to bed 18 (Figures 2, 3), i.e., from the base of Calpionellid Zone B (first appearance datum (FAD) Calpionella alpine after M'Rabet, 1981, 1987) to the base of Subthurmannia Occitanica ammonite zone (M'Rabet, 1981, 1987; Maalaoui and Zargouni, 2016a).
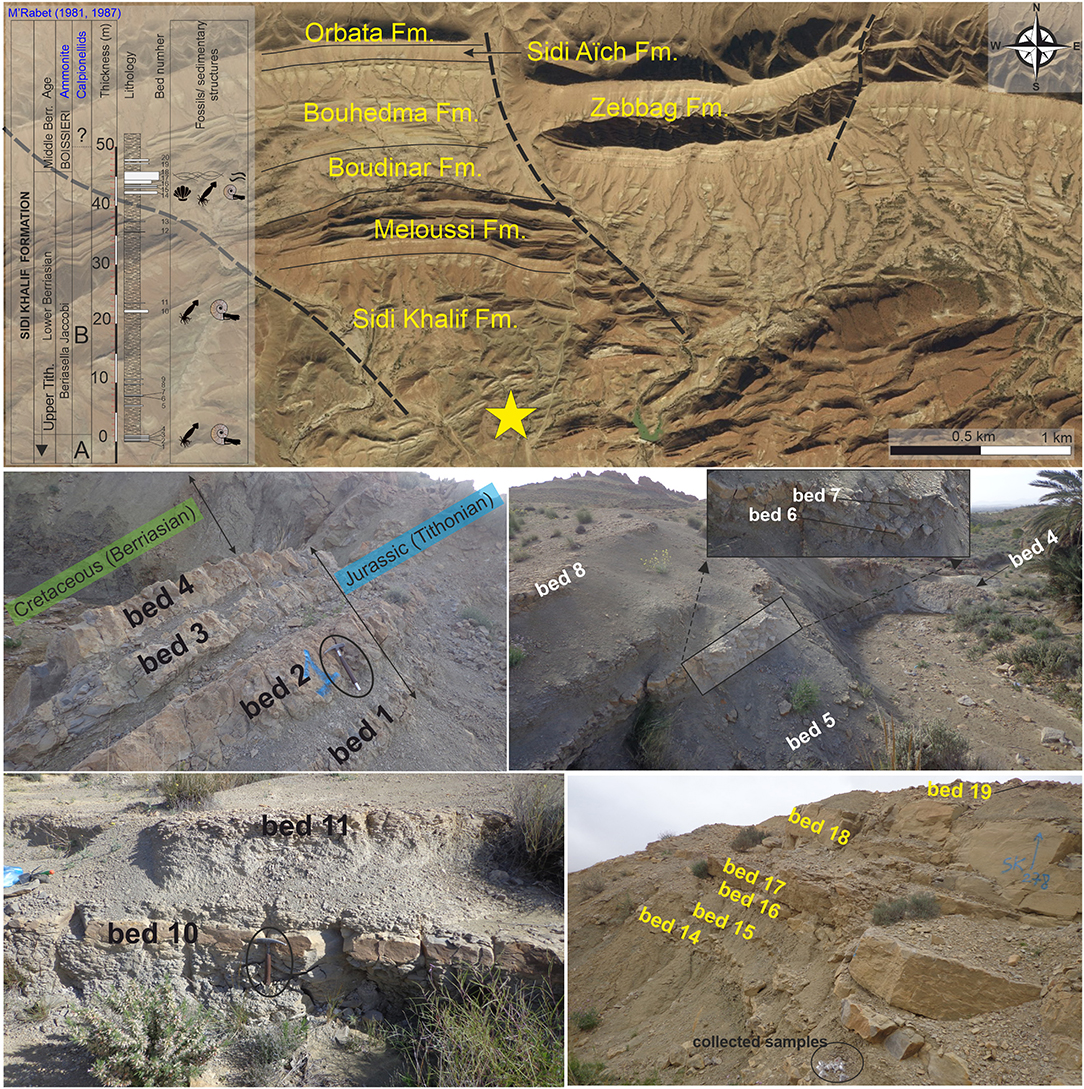
Figure 2. Outcrop photos of beds 1−19 along the sedimentary succession of the studied interval. The top figure shows the outcropping Formations in the study area. The yellow star represents the location of the studied section.
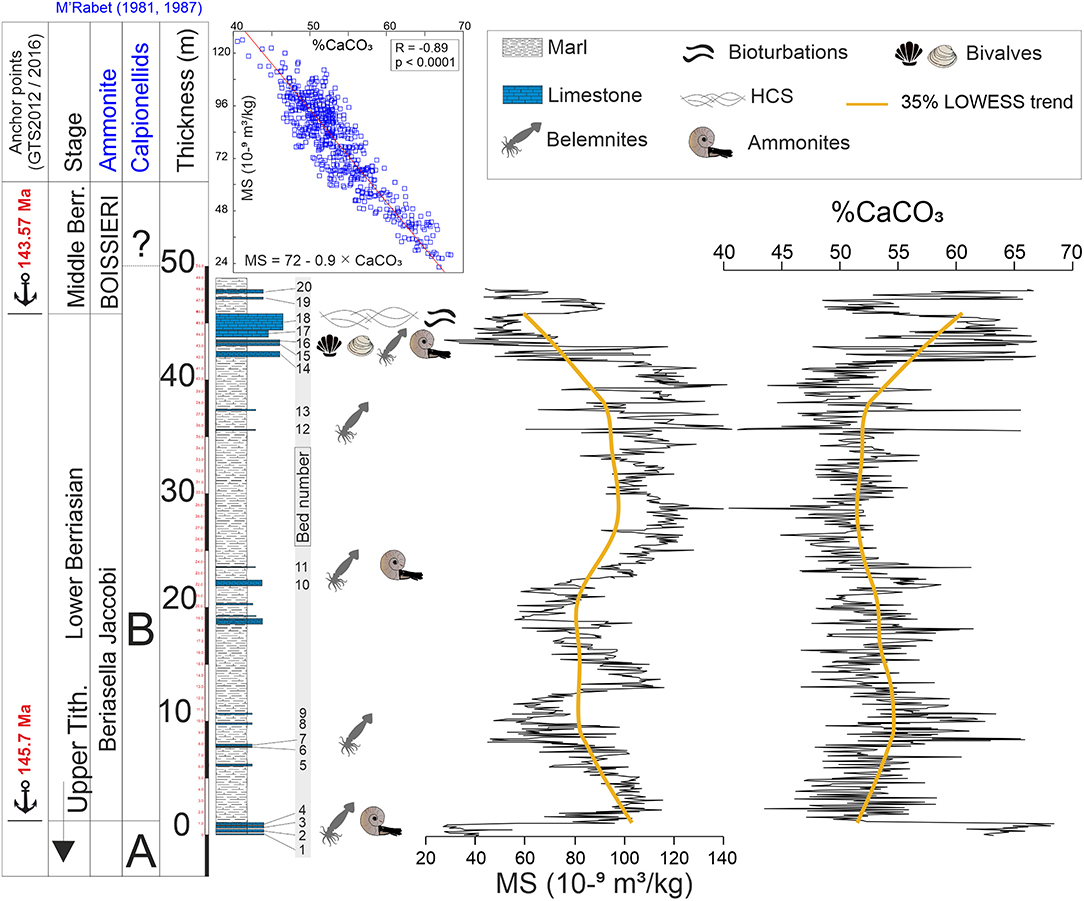
Figure 3. Variations of the used proxies through the studied interval with a 35%LOWESS detrend (thick yellow line). The top left graph shows the linear model of the MS vs. % CaCO3; R = −0.89.
Materials and Methods
Magnetic Susceptibility
Magnetic susceptibility has been widely used as powerful proxy for paleoclimate investigations (Ellwood et al., 2000; Da Silva et al., 2013; Kodama and Hinnov, 2014). It quantifies the ability of a sample to be magnetized in response to an external magnetic field. This response depends mostly on the amount of magnetic minerals (mostly ferromagnetic and paramagnetic), which are classically carried by detrital inputs. The MS method is widely used by cyclostratigraphers for astronomical calibrations (Mayer and Appel, 1999; Weedon et al., 2004) because it is, reproducible, non-destructive and straightforward to acquire.
A total of 622 samples were collected with an average sampling spacing of ~7 cm along a 44.45 m thick section. Low frequency mass specific magnetic susceptibility (MS) measurements were undertaken with a Bartington MS2 magnetometer at the National Engineering School of Sfax (Sfax University). This is a magnetic petrophysical parameter expressed in kg/m3 and given with a precision of ±8 × 10⁻¹⁰ m3/kg (95% confidence level). They are measured under an operating frequency of 0.47 kHz and a 5 s as a measurement period with the MS2B sensor.
Carbonate Content
Multiple studies (e.g., Mayer and Appel, 1999; Weedon et al., 2004; Boulila et al., 2008; Martinez et al., 2012) showed that in hemipelagic environments, MS variations are inversely proportional to % CaCO3 values in hemipelagic environments. This is because the CaCO3 mineral, which is dominant in hemipelagic sediments, dilutes iron-bearing minerals. As a result, % CaCO3 variations could potentially record the same paleoclimate oscillations as the MS proxy but in an opposite pattern (Martinez et al., 2012, 2020; Martinez, 2018; Hilgen et al., 2020). We used a calibrated Bernard calcimeter to analyze the 622 powdered rock samples for calcium carbonate content. Decalcification was achieved by treating samples with HCl (10%) to remove the calcium carbonate fraction. Reproducibility and quality of the measurements were checked by running duplicate-samples and standards every tenth sample. The precision range varies from 1 to 5% (Lamas et al., 2005).
X-Ray Fluorescence (XRF) Analysis for Trace and Major Elements
We analyzed a group of 19 powdered samples (average sampling spacing = ~2.3 m) from the studied section, for trace-and major-elements concentration at the GEOGLOB laboratory (Earth Sciences Department of Faculty of Sciences of Sfax, Sfax University, Tunisia). Geochemical study was realized by X-rays fluorescence XRF with Thermo scientific device Niton FXL FM-XRF Analyzer. This method is used in order to determine chemical elements that constitute the bulk rock.
Time Series Analysis
In this section, we present the step-by-step methodology for the detection and interpretation of potential Milankovitch cycles in the MS and % CaCO3 records to construct a floating astronomical time scale (ATS). Because paleoclimate parameters may have different responses to orbital forcing (Li et al., 2019b; Ma et al., 2019; Sinnesael et al., 2019), relying on one single proxy could affect the reliability of the ultimate inferred astronomical timescale. Therefore, we choose to implement the results of spectral analysis of two paleoclimate proxies (MS and % CaCO3). Spectral analysis was performed on a MATLAB platform using Acycle v2.2 software (Li et al., 2019a):
1) Prior to any analysis, the MS and % CaCO3 data were interpolated linearly at 7 cm intervals (average sampling spacing). We removed long-term trends by running the “smooth” MATLAB script using a moving-average window of 217 points (35% LOWESS).
2) Cyclicities were estimated using the Multi-taper Method (2π-MTM) (Thomson, 1982). The MTM is coupled with a classical red noise model following the Husson's “redconf.m” MATLAB script (Husson, 2014). Afterwards, we applied the frequency ratios method (Huang et al., 1993; Boulila et al., 2008) (Tables 1, 2 and Figure 5) which serves as a preliminary test for the existing of astronomical frequencies in the MS and % CaCO3 stratigraphic series. In addition, we performed two independent evolutionary spectrograms using two different methods which are the Evolutionary Fast Fourier Transform (evoFFT) performed using the “evofft.m” MATLAB script of Kodama and Hinnov (2014) and the Continuous Wavelet Transform (CWT) (Torrence and Compo, 1998) executed using the “Wavelet Transform” function in Acycle v2.2 software. The evoFFT and CWT techniques serve to assess the evolution of astronomical components in both proxies and to track the sediment accumulation rate variations along the studied section.
3) Prominent orbital cycles (in the stratigraphic domain) were extracted by band-pass filtering using the Taner filter (Taner, 2000) of the “Filtering” function in Acycle v2.2. Based on the interpreted “E” (long orbital eccentricity) cycles, we carried out a “minimal tuning with linear interpolation” (Muller and MacDonald, 2000) using depthtotime.m. function under Acycle software.
4) The resulting tuned signal was interpolated to a uniform sampling spacing based on the original sample rates. MTM spectral analysis with harmonic F-testing and Evolutionary power spectra as performed in Step 2 were applied on the newly tuned time-series.
5) Evolutionary power spectra and the MTM spectral analysis with harmonic F-testing as in Step 2 were applied on the newly constructed time-series.
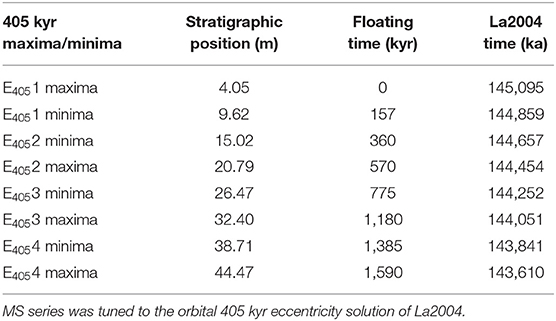
Table 1. Stratigraphic positions, floating geochronology, and anchor points used to build the age model used in this study.
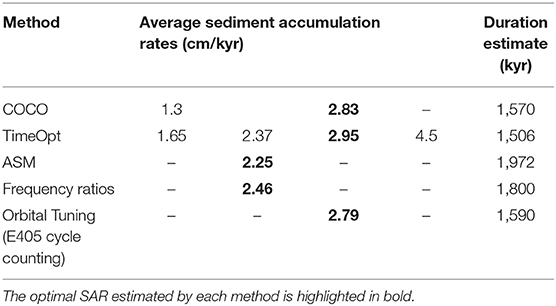
Table 2. Summary of sedimentation rates and durations calculated by the different used methods (see Methods, section Astronomical Target Curve).
Modeling of Sediment Accumulation Rate (SAR)
The changes in SAR are generally problematic for cyclostratigraphy and to depict potential orbital cycles from the analyzed stratigraphic series. All SARs inferred in this study are post compaction. To obtain a meaningful interpretation of the variation in SAR, we applied three independent methods on the Sidi Khalif MS stratigraphic series:
a) Correlation coefficient (COCO) method (Li et al., 2018b), which works in the same way as the frequency ratio method, calculates the coefficient of correlation between the frequencies of power spectra of a given stratigraphic proxy series and an astronomical solution in a given time interval of the GTS, ranging between a minimal and maximal sedimentation rates. To determine this threshold of SARs, we relied on relative ages offered by both Maalaoui and Zargouni (2016a) and M'Rabet (1981, 1987) biostratigraphic models. According to these, average SAR should be around 2–3 cm/kyr. Thus, reasonable SARs was estimated to range between 1 and 5 cm/kyr for the lower Sidi Khalif Formation. To track changes in the SAR along the studied stratigraphic series, we used the evolutionary correlation coefficient method (eCOCO) (Li et al., 2018b). This method allows to calculate the coefficients of correlation between the power spectra of a paleoclimatic proxy series and its corresponding associated astronomical forcing series within a sliding window, then convert the proxy series from a depth domain to time domain to acquire the variation of SAR (Kodama and Hinnov, 2015; Li et al., 2016a,b, 2018b). The MS series is linearly interpolated to an average sampling interval (7 cm) and detrended by removing a 35% (15.55 m) rloess trend, and then the eCOCO method is applied for a range of SARs between 1 and 5 cm/kyr. We performed 5,000 Monte Carlo simulations to calculate both the COCO and eCOCO.
b) Time Optimization (TimeOpt) (Meyers, 2015) and evolutive Time Optimization (eTimeOpt) (Meyers, 2019) analysis evaluates orbital eccentricity-like variations in the data, together with supporting evidence from amplitude modulations of the precession index band, upon a test range of SARs (Meyers, 2015, 2019), which in this case are similar to those selected for eCOCO (1–5 cm/kyr). Additionally, we assessed the statistical significance of the TimeOpt analyses results by performing Monte Carlo AR1 model simulations (Meyers and Malinverno, 2018) under Acycle software (TimeOptSim function). The original TimeOpt analyses (Meyers, 2015, 2019) utilizes a constant SAR model which is often applicable for relatively short stratigraphic record deposited in deep-sea environments. However, it can be problematic over longer time scales, and is less likely to be valid in more proximal shelf and continental realms (Meyers, 2019). We outlined in section Geological Setting that our section is a hemi-pelagic sedimentary succession type, and spans over ~2 Myr-duration of sedimentation, which lead us to consider it amenable for such statistical analysis. If the SAR is indeed changing along the section, the application of the evolutive Time Optimization (eTimeOpt) method can overcome such problem and allow to reconstruct the vertical change the SAR.
c) Meyers and Sageman (2007) developed the Average Spectral Misfit (ASM) technique which compares the spatial frequencies (in depth domain) with the astronomical frequencies of the same age, then calculates an optimal SAR that matches the best astronomical fit. This SAR (in cm/kyr) is statistically assessed by estimating the highest confidence level and, furthermore, by performing a test for rejection of Null Hypothesis of no orbital forcing (H0-SL). We used the target orbital frequencies of Laskar et al. (2004) to perform the ASM analysis.
Astronomical Target Curve
The earth orbital parameters obliquity and precession cannot be calculated accurately before to the Cenozoic times because of the chaotic behavior of the solar system over time. The earth orbital long eccentricity (405 kyr) cycle is the most stable orbital parameter throughout the Phanerozoic that can be used as a metronome for reconstructing reliable ATS prior to the Cenozoic (Laskar et al., 2004; Kent et al., 2018). The La2004 and La2010 astronomical solutions are available for ages older than 42 and 50 Ma, respectively (Laskar et al., 2004, 2011). The La2010d (Laskar et al., 2011) can be used to represent the most reasonable astronomical solution for ages older than 54 Ma. However, Liu et al. (2020) showed that La2004 solution (Laskar et al., 2004) is valid much further back in time than is currently recognized.
Modeling of the Sea-Level-Change: DYNOT and ρ1 Noise Models
The “DYNOT” (Dynamic Noise after Orbital Tuning) model was designed by Li et al. (2018a) to measure noise in climate and sea-level proxies. If proxy-related noise and other contributing factors (e.g., tectonics, bioturbation, volcanism, and sub-Milankovitch cycles) are minor, the variance of the noise can be an indicator for relative sea-level changes. For a 103 to 106 year-band in the power spectra of proxy series, this technique evaluates the ratio of non-orbital signal variance to the total variance, which is calculated along a sliding time window. When sea-level is relatively high, the DYNOT ratio is weaker than the ratio in a time of relatively low sea-level, and vice versa. The DYNOT model was performed using the Acycle v2.2. software.
In addition to the DYNOT model, Li et al. (2018a) designed the ρ1 sea-level model as a second, independent noise indicator for relative sea-level change. The authors demonstrated that increased noise leads to a decreased ρ1 value, and vice versa.
MS and % CACO3 Records
MS values range from 22.4 × 10⁻⁹ to 126.0 × 10⁻⁹ m3/kg and the % CaCO3 ranges from 40.5 to 68.4% along the section. As anticipated, limestone beds show lower MS values than the interbedded marls. MS and % CaCO3 values show a significant negative correlation (R = −0.89, p < 0.001; top left graph in Figure 3), indicating that MS variation is mainly controlled by the lithology, as well-known for pelagic series (e.g., Mayer and Appel, 1999; Boulila et al., 2008). Moreover, this negative correlation is well-documented by the antagonist evolutionary pattern of 211 points Gaussian-weighted moving average (35% LOWESS) applied to the both MS and % CaCO3 (yellow thick lines in Figure 3).
Magnetic susceptibility measurements are being classically used as proxy for climatic and eustatic variation (Da Silva et al., 2013; Kodama and Hinnov, 2014; De Vleeschouwer et al., 2015). The oscillations of Milankovitch cycles affect the amount of solar energy received by the Earth surface on different temporal and spatial scales, which influence, consequently, climatic conditions (dry and humid phases) and, thus, control the detrital input a to the basin. Ultimately, this complex interaction between orbital and climatic process is reflected by the MS variations along the analyzed stratigraphic record (De Vleeschouwer et al., 2015).
However, MS signal in Mesozoic sedimentary series is vulnerable to post-depositional distortion such as diagenesis processes and metamorphism which affect the primary depositional environmental and climatic information (Riquier et al., 2010; Da Silva et al., 2013). To test the reliability of the MS preservation into the analyzed samples, we measured trace-element proxies for detrital input (Ti, Rb, Al, and Zr; Calvert and Pedersen, 2007; De Vleeschouwer et al., 2015) and those geochemical results were compared with MS results for the entire section (Figure 4). The evolution of MS series and these terrestrial input proxies follows parallel large-scale trends and show fair to good correlation (r = 0.71–0.73; N = 19) (Figure 4). Therefore, we assume that diagenesis/remagnetization did not significantly biased the original paleoenvironmental and paleoclimatic information (Riquier et al., 2010).
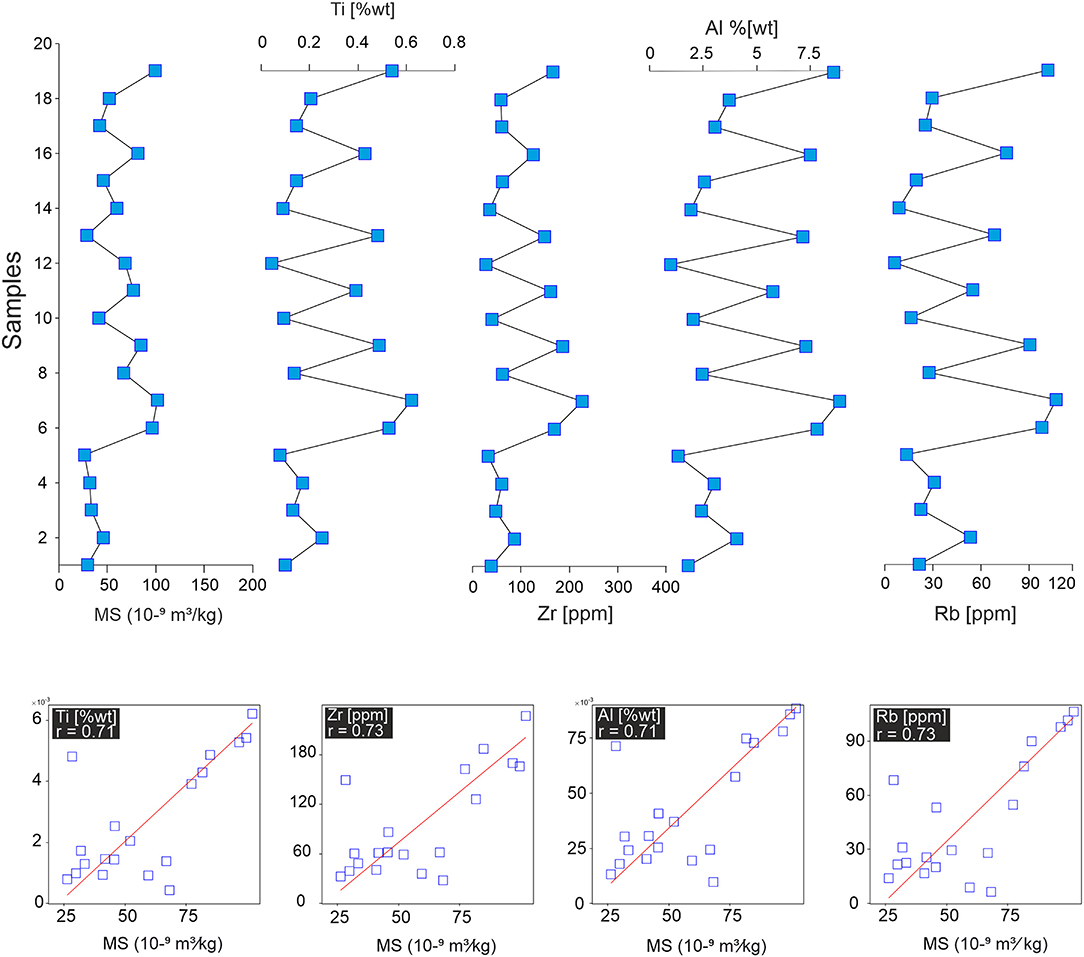
Figure 4. Correlation between magnetic susceptibility (MS) and trace elements (Ti, Zr, Al, and Rb). These elements are proxies for siliciclastic input into the marine depositional environment. The correlation between elemental profiles and MS indicates a magnetic susceptibility signal driven by climatically controlled changes of inputs into the basin.
Moreover, Schnyder et al. (2005) carried out a multidisciplinary study for paleoclimatic investigation on the Berriasian sedimentary series at Jebel Meloussi and reported that no significant diagenesis imprint has been found on the lower Berriasian (Berriasella Jacobi zone, this section). According to the authors, the only few traces of possible diagenesis occur in the middle Berriasian (Subthurmania Occitanica Zone) which fall utterly out of our interval of interest.
Cyclostratigraphic Analysis
Spectral analysis of the ~44 m succession of MS and % CaCO3 records show prominent peaks at ~10, 2.2, 0.87, 0.66, 0.57, 0.43, and 0.34 m with high confidence level values often exceeding 0.9 (Figure 5). To interpret these peaks in terms of possible orbital periods, we calculated, as a preliminary test, their ratios (Supplementary Table 2) and compared them to orbital period ratios relative to the Berriasian stage (Laskar et al., 2004) (Supplementary Table 1) following the frequency ratio method. Spectral period ratios are very close to orbital period ratios with a rather high correlation coefficient of 0.98 and 0.97 for the MS and % CaCO3 signals, respectively (Figure 5). Hence, we accordingly attribute these peaks to the long eccentricity (405 kyr), the short eccentricity (100 kyr), the obliquity (45, 36, and 27 kyr) and the precession (22 and 18 kyr), respectively. This method of frequency ratios indicates an average SAR of ~2.46 cm/kyr. To better ensure the validity of the interpreted Milankovitch cycles in depth domain, we applied the protocol described by Kodama (2019) on the untuned MS series to see whether precession cycles are modulated by short eccentricity cycles. First, we filtered the untuned MS series at a bandwidth frequency that we assume to be the precession cycles (22–18 kyr). Then, we performed an amplitude modulation (AM) test on the obtained output filter (red curve in Supplementary Figure 1A, corresponding to short eccentricity cycles modulating the precession cycles) which are grouped into sets of 4–6 precession cycles. Finally, we ran 2π-MTM on the amplitude envelope of the filtered series and found strong peaks among which the short eccentricity band is significantly highlighted above the 99% CL (Supplementary Figure 1B). Therefore, we can claim that the interpreted short eccentricity and precession cycles are well-selected in the MTM power spectra of Figure 5.
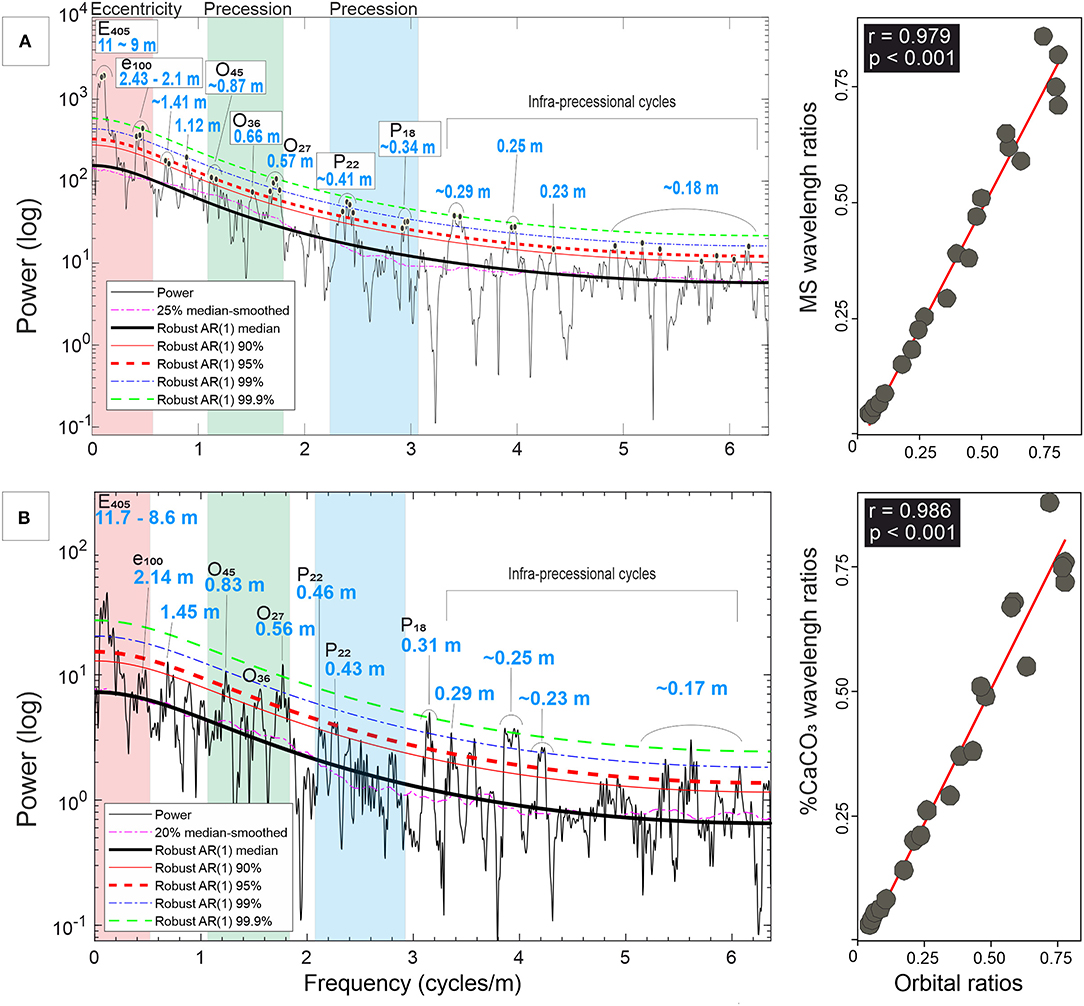
Figure 5. Power spectrum density of the applied 2π-MTM on the untuned (A) MS series and (B) calcium carbonate content series with the corresponding calculated coefficient of correlation for each used proxy.
The long eccentricity (405 kyr) displays the strongest amplitude in the global power spectrum and the 2π-MTM and their corresponding evolutionary tests (CWT and evoFFT) (Figures 6A,D). For both proxies, the continuous wavelet analysis reveals parallel bands with cycle lengths of 11–9, 2.4–2.1, and 1.14–0.9 m (Figures 6A,D). The evolutionary FFT spectrograms of the untuned MS and % CaCO3 series show variations in the cycle lengths vs. the thickness (Figures 6B,C) which may be due to a change in the SAR. As expected, highest-power cycles revealed by the MTM analysis display continuous lines in the EHA analysis. For the MS proxy, the interpreted E405 cycle is dominant for the entire section but its power is dampened at ca. 33–40 m at the expense of the e100 amplitude (Figure 6B). The % CaCO3 proxy exhibits mirrored pattern as the MS proxy for both “E” and “e” cycles. The only exception is the bifurcation into high-amplitude period at 8.6 m and low-amplitude period at 11.7 m occurring over the 33–40 m interval. Such bifurcations could reflect intervals of hiatuses or amplitude modulations (Meyers et al., 2001; Meyers and Sageman, 2004). Also, strong condensation or obliquity/precession recorded while the sedimentation rate decreases can lead to this pattern. Hiatuses are unlikely due to the absence of hardgrounds, subaerial exposure, glauconitic or phosphatic levels.
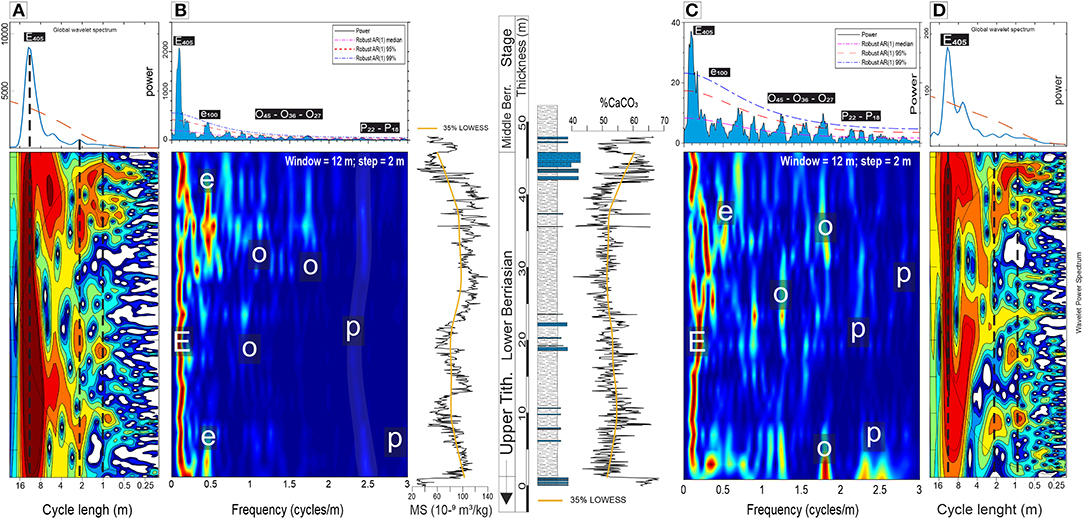
Figure 6. Spectral analysis of the Lower Sidi Khalif Formation. (A,B) are, respectively, the continuous wavelet transform (CWT) and the evolutionary spectrogram (evoFFT coupled to 2π-MTM analysis) of the MS signal. (C,D) are, respectively, and the evolutionary spectrogram (evoFFT coupled to 2π-MTM analysis) and the continuous wavelet transform (CWT) of the % CaCO3 signal.
Because the spectral power of the obliquity and precession cycles are much lower than that of the long eccentricity, it is hard to recognize it on the EHA spectra, in particular for the MS series where the strongly expressed E405 cycles hinder the discrimination of any other potential orbital frequencies. Thus, recognition of the obliquity and precession is primarily based on the relative scale of their spectral power on the spectrogram of amplitudes. To overcome this issue, we performed EHA analysis on each astronomical frequency independently (Figure 10). The purpose is to examine all Milankovitch cycles with better visibility and interpret their variations in terms of change in SAR (detailed later in section Variations of the Sediment Accumulation Rate).
Tracking the Sediment Accumulation Rates
Evolutionary Coefficient of Correlation (eCOCO)
COCO was applied to identify the most likely SAR along the record. The COCO analysis shows one main maxima of stable SAR at 2.83 cm/kyr with a correlation coefficient value exceeding 0.45 (Figure 7). Another secondary maximum arises at 1.2 cm/kyr. Both SAR values have a null hypothesis values (H0, no orbital forcing) lower than the 0.1% (Figure 7) and seven astronomical parameters involved in the estimation. The results of eCOCO analysis (which is evolutive) unravel the history of the SARs variations along the Sidi Khalif Formation. Three distinct portions of record with changing sedimentation rate are visible (Figure 7, top-right graphs) starting by a relatively stable SAR at ~2.2 cm/kyr (1–16 m), followed by an increasing trend with the SAR reaching ~3 cm/kyr between ca. 16–34 m. The rest of the section has a mean SAR of 1.5–1.7 cm/kyr.
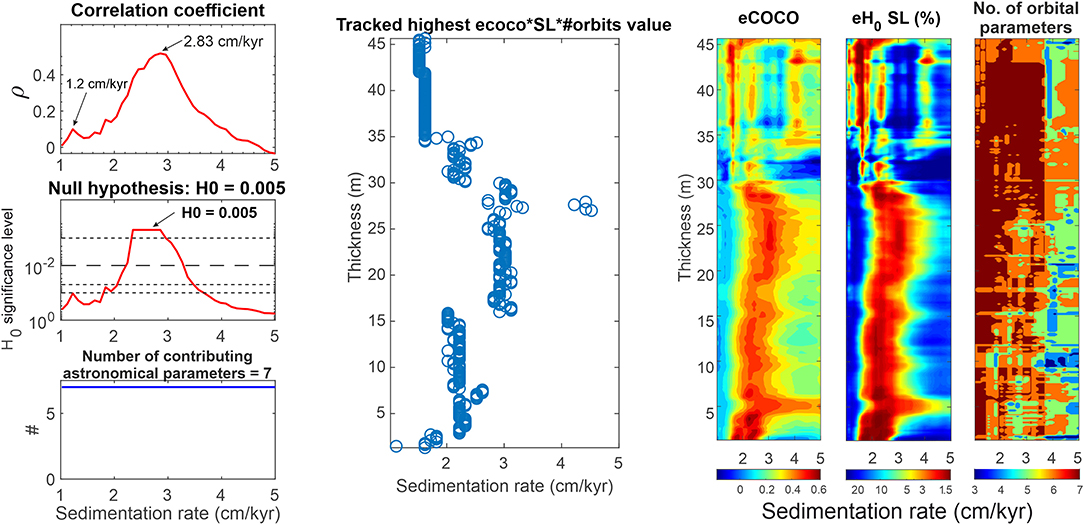
Figure 7. Tracking the sediment accumulation rate along the studied section. The COCO analysis indicates a mean SAR of 2.83 cm/kyr and the eCOCO analyses of the MS series. For both the COCO and eCOCO, tested sedimentation rates range from 1 to 5 cm/kyr with a step of 0.1 cm/kyr, and the number of Monte Carlo simulations is 5,000. For eCOCO analysis, the sliding window size is 15 m; the sliding window step is 0.078 m. In the top-left graphs (Null Hypothesis): the dashed horizontal line indicates H0 = 0.01; the horizontal dotted lines, from top to bottom, indicate H0 = 0.005, 0.05, and 0.1. The top-right graphs are (respectively from left to right) the evolutionary ρ shown with SAR variations; the evolutionary H0 (Null Hypothesis) shown with SAR variations and the evolution of the number of contributing astronomical parameters.
Evolutionary Time Optimization (eTimeOpt)
TimeOpt analysis (Supplementary Figures 2G–I) indicates an maximum at a SAR of 2.95 cm/kyr, for which TimeOptSim analysis estimates a quite low p-value of 0.05776 (Supplementary Figure 2I). This SAR is close to the 2.83 cm/kyr SAR obtained by the COCO analysis (see above). The assessment (Supplementary Figure 2C) indicates a much faster SAR at ca. 4.5 cm/kyr but with a higher p-value of 0.56668 (Supplementary Figure 2J); (Supplementary Figure 2K) indicates ~2.7 cm/kyr, a closer value to those revealed by COCO and ASM techniques, and with an extremely low p-value of 0.00358 (Supplementary Figure 2K). Adopting 2.95 cm/kyr as the optimal SAR leads to a periodogram of the MS series with a strong orbital long eccentricity signature (Supplementary Figure 2F).
Similarly, to the eCOCO, the eTimeOpt analysis (Supplementary Figures 2G–I) suggest long-term changes in average SAR. The sedimentation history is most unambiguously resolved in the spectral power fit (), and the combined envelope and spectral power fit (), identifying three sedimentation rate regimes (Supplementary Figures 2G–I): (1) a region of relatively stable sedimentation (1–21 m) with an average sedimentation rate of ~2 cm/kyr, presenting two emerging peaks of SAR at ~3.8 cm/kyr, (2) a higher sedimentation interval from ~ 21 meters to ~37 meters (SAR ranges between ~2 and ~4 cm/kyr), and (3) a progressive decline in sedimentation rates for the rest of the section (average sedimentation rate = ~1.7 cm/kyr).
Average Spectral Misfit (ASM)
ASM analysis for the MS series indicates a statistically significant (H0 = 0.09%, Supplementary Figure 3C) solution at 2.25 cm/kyr (Supplementary Figure 3A). Seven of the totals of eight astronomical target frequencies were evaluated for this result (Supplementary Figure 3B), excluding only the precession at 25 kyr as indicated by one black vertical dashed line that do not coincide with any of the vertical red lines (Supplementary Figure 3D).
Orbital Tuning
In this study, we compared both tuning on La2010d and La2004 solutions and it appears that the latter fits much better our initial timescale (biostratigraphy of M'Rabet, 1981, 1987). Hence, the Milankovitch cycles identified in the lower Sidi Khalif Formation can be tuned using the target curve filtered from the theoretical astronomical solution of La2004 (Laskar et al., 2004) (Figure 8). The untuned 405-kyr-filtered MS and % CaCO3 series show a strong negative correlation, which indicates that both proxies can be calibrated by La2004 astronomical solutions. Four 405-kyr long eccentricity cycles (E4051 to E4054 in Figure 8) extracted from the MS series were compared to the theoretical target curve of La2004 astronomical solution between 145.7 and 143.57 Ma. Astronomical tuning was further completed by assigning the long eccentricity peaks of the MS series to the 405 kyr filtering peaks of the La2004 astronomical solution (Figure 8). The tuning quality is assessed to be good (for E4051 and E4052) to fair (for E4053 and E4054) (Figure 8). Minima of the filtered 405 kyr cycles of La2004 astronomical solution match well the MS minima along the entire tuned interval (Figure 8) which support more the quality of the tuning. This tuning proposes that our section spans an interval of 1.6 Myr from 145.3 to 143.57 Ma (see Table 1 for anchor points). The appearance of the ~200 kyr cycle on the MTM power spectra of both tuned MS and % CaCO3 series (Figure 8) is interesting. Indeed, this cycle has been recently found by Hilgen et al. (2020) and explained as the expression of alternating distinct and less distinct ~100-kyr CaCO3 maxima and associated magnetic susceptibility (MS) minima, which correspond to successive minima of the short ~100-kyr eccentricity cycle. This observed cycle, which is different than the 173 kyr obliquity cycle, does not represent an artificial harmonic of the 405 kyr cycle, nor a double ~100 kyr cycle. These authors interpreted it to reflect a real but weakened and complex eccentricity component beside the principal eccentricity cycles.
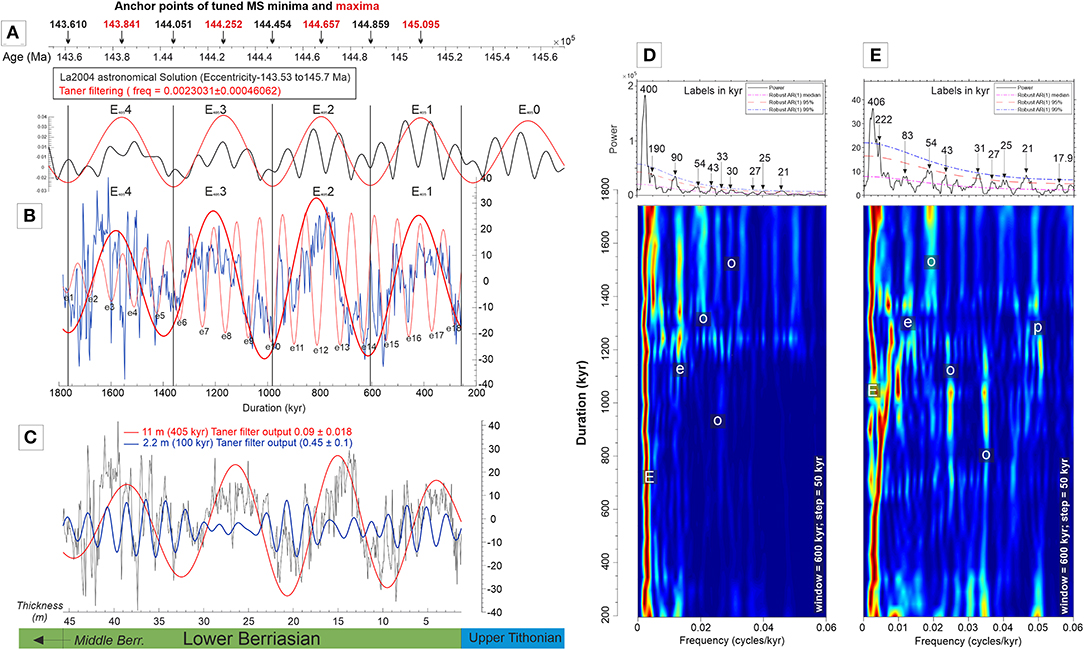
Figure 8. Orbital tuning of the MS series at Jebel Meloussi locality, and geochronology of the lower Sidi Khalif Formation. (A) 405 kyr filter output of the La2004 astronomical solution (from 145.53 to 145.7 Ma). (B) 405 and 100 kyr filter output of the tuned MS stratigraphic series. Duration estimate points to ~1.6 Myr with a mean SAR of ~2.7 cm/kyr. (C) 11 m (405 kyr) and 2.2 m (100 kyr) Taner filter output of the untuned MS series. (D) Spectral analysis (2π-MTM + evolutionary FFT) of the 405 kyr-tuned MS series and (E) % CaCO3 series.
Discussion
Astrochronology of the Lower Sidi Khalif Formation
We implemented different methods to calculate the average SAR along the section. A summary of all obtained SARs is presented in Table 2. The TimeOpt, ASM and the frequency ratios methods showed three close values of SAR at 2.37, 2.25, and 2.46 cm/kyr, respectively. Also, a range of SAR between 2.83 and 2.952 cm/kyr is shared between the COCO and the TimeOpt (Table 2). Each method permitted to estimate a total duration for the section which are highlighted in Table 2.
In addition, we extracted the E405 kyr and e100 kyr cycles from the tuned MS signal and filtered them using Taner filter (Taner, 2000). We, afterward, simply counted the total number of long- and short-eccentricity cycles (405 kyr) along the entire section, which pointed to a number of four complete cycles (Figure 8). This allowed us to construct a floating timescale of a duration of ~1.6 Myr for the studied interval giving, an average SAR of 2.75 cm/kyr (Table 2), which solution was obtained through three methods of SAR calculation [1,570 kyr (COCO), 1,506 kyr (TimeOpt), and 1,590 kyr (counting of E405 cycles), see Table 2]. Based on the biostratigraphy developed by M'Rabet (1981, 1987), initial sedimentation of the studied section began at 145.7 Ma (FAD of Calpionella alpine Zone B), and deposition ended at 143.53 Ma (FAD of Subthurmania Occitanica ammonite zone) (according to GTS2012; Gradstein, 2012; Ogg et al., 2012 and GTS2016). This age constraint suggests a total duration of 2.17 Myr for the section with an average SAR of 2.04 cm/kyr. However, as mentioned in the geologic setting (section Geological Setting), this biostratigraphic setting is controversial with Maalaoui and Zargouni (2016a) who reported that the calpionellids Zone A does not exist in the section, i.e., the section does not cover any Jurassic sedimentary series at Jebel Meloussi locality. The only common stratigraphic point which is not problematic between the two authors is the Berriasella Jacobi—Subthurmania Occitanica (Lower Berriasian—Middle Berriasian) boundary, which we refer to it as a tie point for our floating ATS revealed by the 405 kyr-filter output of the tuned MS series. The duration obtained by M'Rabet; M'Rabet (1981; 1987; 2.17 Myr) is longer than our estimate (~1.6 Myr). However, our estimate is in better agreement with the chronostratigraphy proposed by Maalaoui and Zargouni (2016a). To conclude, our proposed floating ATS points to a duration of 1.6 Myr for the studied interval and are supportive of the biostratigraphy of Maalaoui and Zargouni (2016a).
Reliability of the Used Proxies
For the few recent decades, magnetic susceptibility measurement is being used as a proxy for climatic and eustatic variation (Da Silva et al., 2013; Kodama and Hinnov, 2014; De Vleeschouwer et al., 2015). The oscillations of Milankovitch cycles affect the amount of solar energy received by the Earth surface on different temporal and spatial scales, which influence, consequently, climatic conditions (dry and humid phases) and, thus, control the detrital input a to the basin. Ultimately, this complex interaction between orbital and climatic process is reflected by the MS variations along the analyzed stratigraphic record.
To better explain the link between the MS fluctuations and cyclostratigraphy, we propose the following plausible flow of explanations:
Some paramagnetic minerals (e.g., illite, smectite, and chlorite) are endogenous in origin, which means that their delivery to sedimentary basins must be ensured first by the erosion of preexisting rocks. continental weathering can be triggered by tropical humid climate which results in an enrichment of kaolinite and illite in marls, while this process is relatively weaker during the deposition of carbonate beds. According to the equation of linear regression between MS and % CaCO3 (top left graph in Figure 3), the intercept value is 72 × 10−9 m3/kg (when % CaCO3 = 0). This value falls centered in the full range of paramagnetic minerals proposed by Walden et al. (1999), which are dominant in marls. In other words, the MS values are essentially carried by paramagnetic minerals while their fluctuations are governed by dilution from the diamagnetic CaCO3 mineral (Martinez et al., 2012, 2020; Martinez, 2018). This suggests that clay minerals coming from clastic sediments are considered here as indicative of the fluctuations in terrigenous supply into a background of carbonate production in the near-shore marine environment (Kodama et al., 2010; Gong et al., 2017; Minguez and Kodama, 2017). In a similar context, Moiroud et al. (2012) carried out a cyclostratigraphic study on Mesozoic hemipelagic marl–limestone rhythmites of the Río Argos section (Betic Cordillera, Southeastern Spain). They demonstrated that paramagnetic clay minerals are reliable proxies to record high-frequency climate fluctuations triggered by orbital forcing at several scales, including precession, obliquity, and eccentricity.
Variations of the Sediment Accumulation Rate
Two independent evolutive spectral analysis techniques (eTimeOpt and eCOCO) were applied to track the variations of SAR. We compared them with results from the EHA method (Figure 9) to check whether they correlate together giving similar trends of SAR along the section. The EHA technique was carried out separately for each orbital parameter to reduce the effect of power scale on the detection of orbital frequencies. The Figure 9 shows that the variation of the long orbital eccentricity is more compatible with SARs revealed by the eTimeOpt method whereas the other orbital parameters (short eccentricity, obliquity and precession) fit much better the eCOCO results (compare the indicative SARs arrows in Figure 9). The fact that more astronomical components are fitting for the eCOCO method led us to give more reliability on the eCOCO SARs.
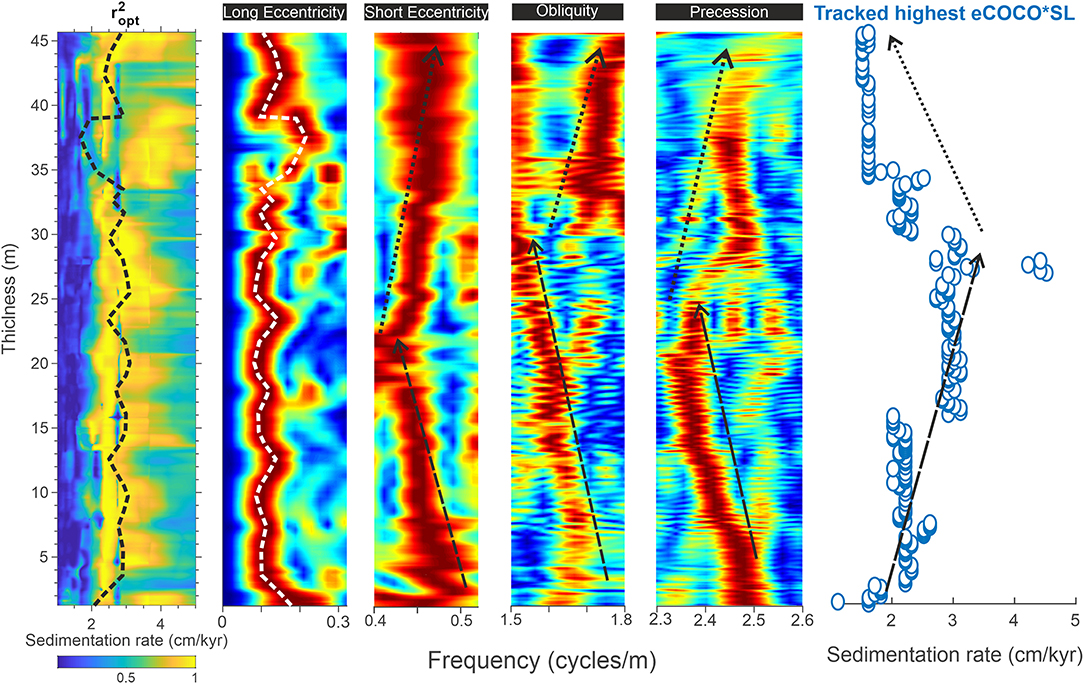
Figure 9. Comparison of the EHA with results from eTimeOpt (extreme left) and eCOCO (extreme right). EHA was applied independently for each orbital parameter apart to allow a better expression of each corresponding amplitude. Dashed arrows indicate increasing SARs while the dotted ones indicate decreasing SARs.
In Figure 10, we plotted the variations of SAR (result of the eCOCO analysis) against the sequence stratigraphic interpretation as well as the paleontological results of Schnyder et al. (2005) on the same section. It seems that this SAR goes in line with major sea-level change along the section. Indeed, the SAR presents a clear increase in the middle part (24–31 m) of the record, which is as the same time as the deposition of the HST and LST (compare Figures 10B,E). This is consistent with the paleontological data that indicate increasing detrital input spurred by the relative sea-level fall during the late Early Berriasian as proven by the dominant total palynofacies and spores/pollen in the upper part of the section (Schnyder et al., 2005) (Figures 10F–H).
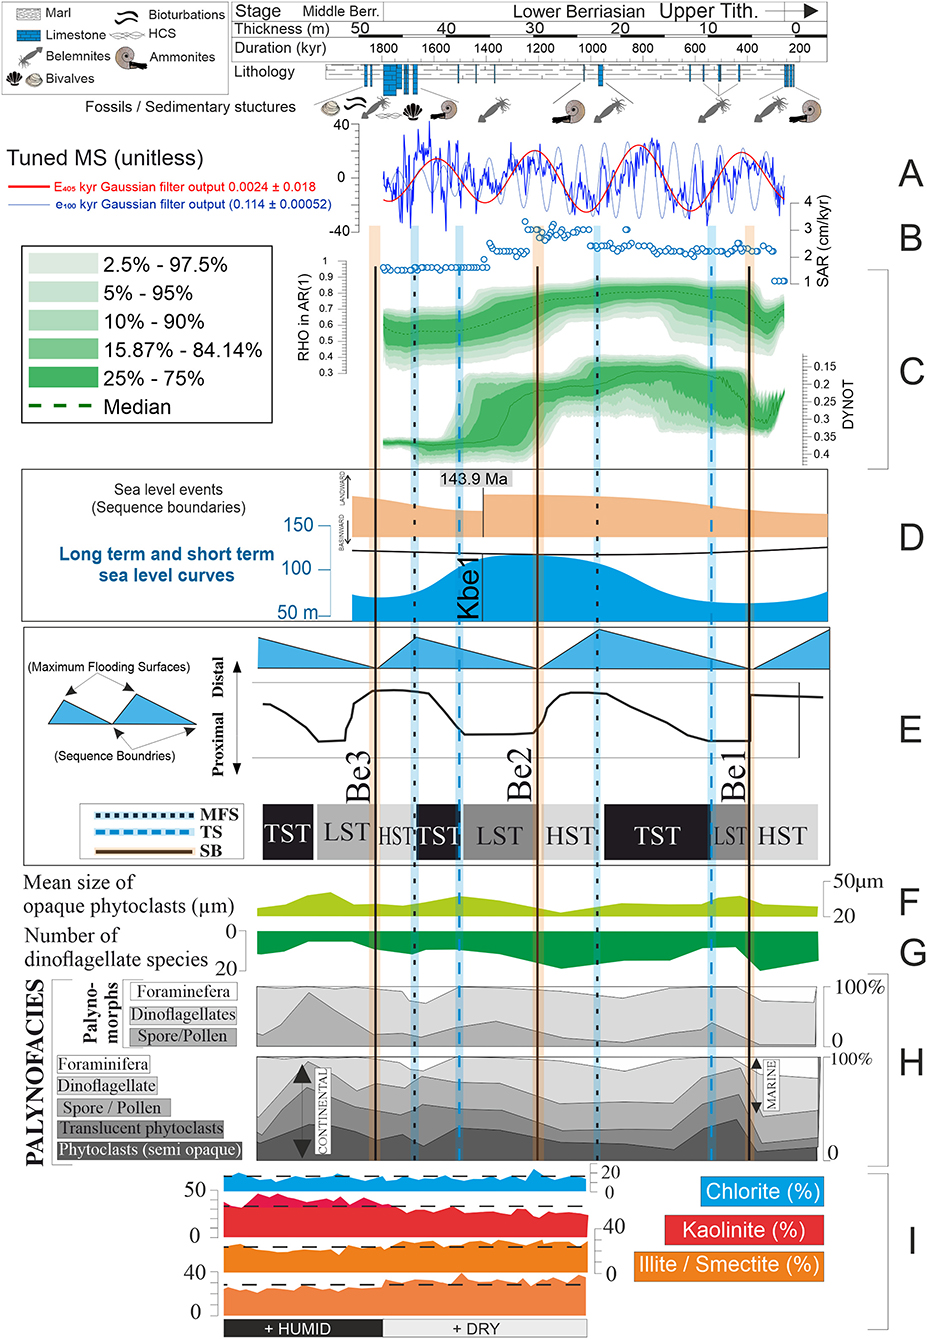
Figure 10. Sequence stratigraphy and paleoclimate change during the Early Berriasian in central Tunisia. Time scale and biostratigraphy are from our ATS (current study) and M'Rabet (1981, 1987), respectively. (A) MS series and filtered long- and short eccentricity cycles. (B) Tracked highest eCOCO × SL (Results), (C) DYNOT and ρ1 models of the MS series. The DYNOT and ρ1 were estimated using a running window of 400, 5 kyr step and a sample rate between 2.26 and 3.18 kyr. Confidence levels were estimated by a Monte Carlo analysis with 5,000 iterations. (D) Sequences and global sea-level variations reported by Haq (2014). (E) Local sequences and seal-level variations estimated by Schnyder et al. (2005) for the lower Sidi Khalif Formation at Jebel Meloussi locality. (F–H) Synthesis of the palynofacies data in the lower Sidi Kralif Formation at the Jebel Meloussi (modified after Schnyder et al., 2005). (I) Clay mineral percentages (modified after Schnyder et al., 2005).
The evolution of SAR (Figure 10B) exhibits two abrupt decreases at ca. 32 and 35 m as the lithology changes from dominant marl to medium-thick limestone beds. Consequently, the marls are interpreted, relative to carbonates, as deposited with higher SARs. This could be explained by the increased runoff and continental detrital input during the deposition of marls (as explained previously in section Cyclostratigraphic Analysis). In contrast, carbonate sedimentation seems to had occurred with lower SAR than marls that is why the SAR decreases significantly upward the section even though DYNOT and ρ1 (Figure 10C) and paleontological data (Figures 10F,G) indicate an obvious contemporaneous sea-level fall. Notably, the eCOCO results, including the evolutive null hypothesis test H0 (Figure 7), display obvious perturbations (the least COCO values across the eCOCO map) along the stratigraphic interval ca. 35–40 m. Interestingly, this discontinuity is parallel to the major shift in the DYNOT curve toward higher values (Figure 10C) that could indicate shallower sedimentary environments. This suggests that the eCOCO analysis could also help to evaluate the depositional environments stability/instability during major sea-level fluctuations (Wang et al., 2020).
Application of Sedimentary Noise Modeling for Sea-Level Change
For multi-million-year-long deep-time datasets from marginal marine environments, DYNOT and ρ1 models can be used to provide an independent, high-resolution sea-level curve (Li et al., 2018a). Dynamic noise in the global sea-level curve may also be linked to changes in the Earth's climate state (Li et al., 2018a). However, the utility and efficacity of the sedimentary noise models is still being explored. Hitherto, only few studies attempted to establish links between sea-level change and DYNOT and ρ1 models (Li et al., 2018a; Wang et al., 2020; Xu et al., 2021). While Li et al., 2018a dealt with Triassic marine sedimentary successions, Wang et al. (2020) focused rather on a paleolake fillings across the Eocene-Oligocene transition. Both studies have been carried out using Gamma Ray (GR) records as a paleoclimate proxy. This study provides a relatively different paleoenvironmental context using MS variations to assess and widen the validity of this method.
We applied the DYNOT and ρ1 models on the MS series of the studied interval (Figure 10C). DYNOT and ρ1 models with a 400 kyr running window correlate well with each other but in an opposite pattern. To compare the noise models (DYNOT and ρ1) with major 3rd order sea-level fluctuations, we proposed the global chart of sea-level change of Haq (2014) (Figure 10D) and an additional local eustatic profile proposed by the palynologic data of Schnyder et al. (2005) (Figure 10E).
At the global scale of sea-level change, KBe1 (143.9 Ma) is the main Early Berriasian eustatic event which marks a minor sea-level fall recorded in the western European basins (Hardenbol and Robaszynski, 1998; Haq, 2014), as well as in the Russian Platform (Sahagian et al., 1996). The sedimentary noise models of sea-level change in central Tunisia correlate with this major eustatic change (compare Figures 10C–E). The eustatic variations interpreted from the sedimentary noise models at Jebel Meloussi are supported by field observations at the outcrop and by MS variations. For example, the sequence boundary KBe1 in Figure 10D corresponds to the highest noise value (DYNOT = 0.37).
At the local scale, Schnyder et al. (2005) reported a succession of at least three complete sedimentary sequences, namely Be1, Be2, and Be3 (Figure 10E) which were estimated to be the Lower Berriasian sequences of Hardenbol et al. (1998). The interpreted sequence boundaries Be1, Be2, and Be3 also coincide with elevated DYNOT except for Be2 with a slight temporal lag that could be related to the mis-fitting of the sequence stratigraphic limits of Schnyder et al. (2005) to our section. This is because the superposition of two independent data (the dataset of Schnyder et al., 2005 and our own data) resulting from the study of the same section separately could result in some slight (more or less) lag in chronostratigraphic context. Hence, it is worth further considering this sequence boundary (Be2) and rescale theoretically the current ATS which would result to shifting the Be2 event toward higher DYNOT values.
Interestingly, we observe an increasing trend in the DYNOT curve toward the upper part of the section which is consistent with major lithologic changes from thin bedded marly sediments to medium-thick limestone beds (Figure 10) indicating sea-level fall characterized by proximal ramp sedimentary environments. Moreover, sedimentary structures and fossil content indicative of high-energy and shallow water conditions, e.g., bivalves, ripples, and cross stratifications (beds 17 and 18 in Figures 2, 3), correlate with increased noise levels indicative of shallow sea levels. Indeed, sedimentary noise can come from instability in depositional environments as discussed above. Also, it may be related to abrupt change in paleoclimatic conditions (Meyers and Hinnov, 2010; Meyers, 2019), which is observed in the “noisiest” part of the section (35–47 m). This interval is marked by a turnover from arid condition to more humid conditions (discussed later in section Application of Sedimentary Noise Modeling for Sea-Level Change). The DYNOT values appear to increase also when the used proxy (MS) displays higher contrast between its least and highest values (compare Figures 10A,C).
Likewise, Li et al. (2018a) documented very similar features between the DYNOT model and lithologic behavior from two Early Triassic marine sections in South China. Those authors outlined mainly four sequence boundaries in their sections, which (three out of four) correspond to higher DYNOT values and are coherent with lithologic change that indicates sea-level falls. These constatations are very comparable to those of our case study.
On the other hand, the increase in the proportions of kaolinite at ca. 47 m (Schnyder et al., 2005) is located in a 2-m thick limestone bed rich in ammonite and belemnite corresponding to an MFS indicated by a peak in relative abundance of dinoflagellates and foraminifera, the specific diversity of dinoflagellates, as well as a reduction in the size of opaque phytoclasts [Figures 10F–H, Schnyder et al., 2005)]. This MFS, placed around the lower Berriasian—middle Berriasian boundary, at the top of callpinellids zone B, is interpreted by Schnyder et al. (2005) as the MFS of the Be2 sequence of Hardenbol et al. (1998). However, the DYNOT model shows higher values in this part of the section (up to 0.4). We, thus, associate this Be2 MFS to an eustatic peak at the fourth order preceding the general drop in sea level relative to the middle/upper Berriasian transition (Jacquin et al., 1998).
Paleoenvironmental Context of the Recorded Milankovitch Cycles
Depositional environments respond to climate, tectonic motions and sea-level change, but this response is mediated by the so-called “environmental shredding” which can fully destroys sedimentary signals of external forcing (e.g., Milankovitch cycles) (Jerolmack and Paola, 2010).
In our section, HCS structures and bioturbations can also lead to the distortion of the recording of the paleoclimate information. A critical look at the precessional cycles (22 kyr, Figure 9, rightmost graph) shows that this astronomical frequency is well-recorded over the section. The only shredded parts occur at (1) ca. 25–27 m and at (2) ca. 43–45 m. For the first interval (1), the disturbance could be related to the relatively low sampling resolution because the calculated SAR is the highest all along the studied interval. Strong condensation could be another possible reason for the diminish of the precession spectral power at this interval (25–27 m); condensations may lead to aliasing, that in turn, cause weakening of spectral powers and high background noise near the highest frequency that can be detected (Nyquist Frequency) (Martinez et al., 2013). The second case (2) could be explained by a likely local effect of environmental shredding as witness the HCS structures and bioturbations (Figures 3, 10A) and also confirmed by the highest DYNOT values (Figure 10C).
Likewise, the obliquity cycles are interestingly well-recorded in the EHA (Figure 9) but they are weaker in the lowermost part (ca. 0–5 m and ca. 30 m) which rises attention. Notwithstanding, obliquity is expected to be badly visualized at lower paleolatitudes. Nonetheless, some previous works have reported strong obliquity expression unlikely to be observed at lower latitudes (Gunderson et al., 2013; Kodama, 2019).
Over and above that, central Tunisia has been relatively quiescent during the J-C transition. Also, there is no sedimentological evidence, nor published works that report a contemporaneous nearby volcanic activity that could amplify the effect of autogenic process on the encoding of Milankovitch cycles. In conclusion, our arguments corroborate that environmental shredding is not at a similar time and amplitude scale as precession and obliquity; therefore, it does not interfere significantly with the recording of these cycles.
Paleoclimate Implications: The Lower Berriasian Arid Climate
The main climatic event during the Berriasian occurred across the lower/middle Berriasian boundary. It is marked by a turnover from dry to more humid conditions indicated by a drastic change in clay mineralogy (Figure 10I) in the southern Tethys margin (Daoudi et al., 1989; Daoudi and Deconinck, 1994; Schnyder et al., 2005) as well as in the northern Tethys margins (Deconinck, 1987, 1993; Rasplus et al., 1987; Schnyder, 2003). Our MS data (Figure 3) may indicate this dry to humid transition, through a gradual upward increase as the detrital input continue to feed the basin. According to the model of Mutterlose and Ruffell (1999), weathering conditions that may lead to the deposition of marl and limestones into a basin depends strongly on the paleoclimatic conditions. The same model proposes that MS values should increase in line with kaolinite and illite percentages under a tropical humid condition, whereas a semi-arid (dry) climate conditions would result in less runoff and thus lower MS values but higher I/S concentrations. This model is in a good agreement with our results (compare Figures 10A,J) throughout the early/middle Berriasian climate turnover: increasing MS (Figure 3) and XRF (Figure 4) values in the upper part of the section coincide with a noticeable higher concentration in %kaolinite and a slight decrease in I/S clay minerals. Also, it is worth noting that the E405 and e100 filters output display a less dominant amplitude in the upper part of the section (compare Figures 10A–J), i.e., toward the upper Lower Berriasian stratigraphic series. This may imply that this climatic turnover from dry to more humid condition had occurred under the control of both long and short eccentricity cycles.
Conclusions
High-resolution cyclostratigraphic investigation from MS and % CaCO3 proxies was undertaken on the Lower Berriasian sedimentary series in central Tunisia (Southern Tethys). This study allowed to depict the following points:
(1) The first outcome of this study is a floating astronomical timescale (ATS) for the target section.
(2) Geochemical investigation using major and trace elements (XRF analysis) helped as a preliminary test to check the validity of the MS signal as a paleoclimate proxy for such study.
(3) Various techniques of spectral analysis and modeling of sediment accumulation rate have been used to reach an optimal orbital model. Four long eccentricity cycles (E405) have been identified through the tuned MS stratigraphic series which points to a total duration of ~1.6 Myr. The resulting floating ATS was tuned to the La2004 solution which allowed to propose an age constraint between 145.13 and 143.57 Ma for the Lower Sidi Khalif Formation.
(4) Three objective tests of sediment accumulation rate (COCO, TimeOpt and ASM) have been applied on the MS series to unravel the vertical variations in SARs. These latter are ranging from 1.3 to 4.5 cm/kyr: the middle part has the highest values and the upper part has the least ones.
(5) Moreover, the application of the DYNOT and ρ1 noise modeling for sea-level change has allowed to reconstruct a local short-term eustatic profile, showing a similar trend to those reported by previous published studies, and is consistent with major SAR and lithological changes along the section.
(6) In terms of paleoclimate change, this study showed that the main climate turnover from arid to more humid condition across the lower/middle Berriasian may had occurred under the control of long and short orbital eccentricity cycles.
Data Availability Statement
The raw data supporting the conclusions of this article will be made available by the authors, without undue reservation.
Author Contributions
This work comes as a part of the cyclostratigraphy project across the Jurassic-Cretaceous transition in Tunisia which was proposed by CY. HO planned the study, measured the dataset, and carried out the spectral analysis and modeling techniques. AD helped on the spectral analysis on the Acycle software and Astrochron package, on the interpretation of the results and on the writing of the manuscript. All authors provided a direct scientific contribution to this article.
Funding
AD acknowledges the FNRS Grant PDR T.0051.19.
Conflict of Interest
The authors declare that the research was conducted in the absence of any commercial or financial relationships that could be construed as a potential conflict of interest.
Acknowledgments
We are grateful to the UNESCO International Geoscience Program (IGCP-652) for their courses and training on cyclostratigraphy and astrochronology. Warmly thanks to Dr. Adnen Lafi and Dr. Mouna Amami for guidance and help in the field sampling campaign.
Supplementary Material
The Supplementary Material for this article can be found online at: https://www.frontiersin.org/articles/10.3389/feart.2021.638441/full#supplementary-material
References
Aswasereelert, W., Meyers, S. R., Carroll, A. R., Peters, S. E., Smith, M. E., and Feigl, K. L. (2013). Basin-scale cyclostratigraphy of the Green River formation, Wyoming, GSA. Bulletin 125, 216–228. doi: 10.1130/B30541.1
Ben Nsir, S., and Boughdiri, M. (2017). Commentaires sur: “Biozones de calpionelles et d'ammonites du Berriasien inférieur et moyen de la Formation Sidi Khalif au Jebel Meloussi, Tunisie centrale” par Kamel Maalaoui and Fouad Zargouni. Rev. Paléobiol. 35, 561–569.
Ben Nsir, S., Boughdiri, M., Cherif, I., Bahrouni, N., Ferchichi, R., and Zrelli, A. (2019). “Berriasian ammonite and calpionellid associations from the North-South range of Central Tunisia: updated biozonation, regional geodynamic context and paleobiogeography,” in First Conference of the Arabian Journal of Geosciences, 12–15 November 2018 (Hammamet).
Boulila, S., Galbrun, B., Hinnov, L. A., and Collin, P. Y. (2008). High-resolution cyclostratigraphic analysis from magnetic susceptibility in a Lower Kimmeridgian (Upper Jurassic) marl-limestone succession (La Méouge, Vocontian Basin, France). Sediment. Geol. 203, 54–63. doi: 10.1016/j.sedgeo.2007.10.004
Burollet, P. F. (1956). Contribution à l'étude stratigraphique de la Tunisie centrale. Ann. Mines Géol. Tunis 18:345.
Busnardo, R., Donze, P., Khessibi, M., Le Hegarat, G., Memmi, L., and M'Rabet, A. (1981). La formation Sidi Kralif (Tithonien-Berriasien) en Tunisie centrale, synthèse stratigraphique et sédimentologique. Ann. Mines Géol. Tunis 31, 115–122.
Busnardo, R., Donze, P., Le Hegarat, G., Memmi, L., and M'Rabet, A. (1976). Précisions biostratigraphiques nouvelles sur le Berriasien des Djebel Nara et Sidi Kralif (Tunisie Centrale). Géobios 9, 231–249. doi: 10.1016/S0016-6995(76)80033-2
Calvert, S. E., and Pedersen, T. F. (2007). “Elemental proxies for palaeoclimatic and palaeo-ceanographic variability in marine sediments: interpretation and application,” in Developments in Marine Geology, eds H. M. Claude and D. V. Anne (Amsterdam: Elsevier), 567–644.
Da Silva, A. C., De Vleeschouwer, D., Boulvain, F., Claeys, P., Fagel, N., Humblet, M., et al. (2013). Magnetic susceptibility as a high-resolution correlation tool and as a climatic proxy in Paleozoic rocks – merits and pitfalls: examples from the Devonian in Belgium. Mar. Pet. Geol. 46, 173–189. doi: 10.1016/j.marpetgeo.2013.06.012
Daoudi, L., and Deconinck, J.-F. (1994). Contrôles paléogéographiques et diagénétiques des successions sédimentaires argileuses du bassin atlasique au Crétacé (Haut-Atlas occidental, Maroc). J. Afr. Earth Sci. 8, 123–134. doi: 10.1016/0899-5362(94)90025-6
Daoudi, L., Deconinck, J. F., Beauchamp, J., and Debrabant, P. (1989). Minéraux argileux du bassin d'Agadir (Maroc) au Jurassique supérieur- Crétacé. Comparaison avec le domaine est-atlantique voisin. Ann. Soc. Géol. Nord 108, 15–24.
De Vleeschouwer, D., Boulvain, F., Da Silva, A. C., Pas, D., Labaye, C., and Claeys, P. (2015). The astronomical calibration of the Givetian (Middle Devonian) timescale (Dinant Synclinorium, Belgium). Geol. Soc. Spec. Publ. 414, 245–256. doi: 10.1144/SP414.3
Deconinck, J. F. (1987). Minéraux argileux des faciès purbéckiens: Jura suisse et français, Dorset (Angleterre), et Boulonnais (France). Ann. Soc. Géol. Nord, 106, 285–297.
Deconinck, J. F. (1993). Clay mineralogy of the Upper Tithonian-Berriasian deep-sea carbonates of the Vocontian Trough (SE France): relationships with sequence stratigraphy. Bull. Centres Rech. Explor. Prod. Elf-Aquitaine 17, 223–234.
Deconinck, J. F., and Strasser, A. (1987). Sedimentology, clay mineralogy and depositional environments of Purbeckian green marls (Swiss and French Jura). Eclogae Geol. Helv. 80, 753–772.
Ellwood, B. B., Crick, R. E., El Hassani, A., Benoist, S. L., and Young, R. H. (2000). Magnetosusceptibility event and cyclostratigraphy method applied to marine rocks: detrital input versus carbonate productivity. Geology 28, 1135–1138. doi: 10.1130/0091-7613(2000)28<1135:MEACMA>2.0.CO;2
Gong, Z., Kodama, K. P., and Li, Y. (2017). Rock magnetic cyclostratigraphy of the Doushantuo Formation, South China and its implications for the duration of the Shuram carbon isotope excursion. Precambrian Res. 289, 62–74. doi: 10.1016/j.precamres.2016.12.002
Gradstein, F. M. (2012). “Introduction,” in The Geologic Time Scale eds F. M. Gradstein, J. G. Ogg, M. D. Schmitz, and G. M. Ogg (Amsterdam: Elsevier), 1–29.
Granier, B. R. C., Ferry, S., and Benzaggagh, M. (2020). A critical look at Tré Maroua (Le Saix, Hautes-Alpes, France), the berriasian GSSP candidate section. Carnets Geol. 20, 1–17. doi: 10.4267/2042/70714
Gunderson, K. L., Kodama, K. P., Anastasio, D. J., Pazzaglia, F. J., et al. (2013). Rock-magnetic cyclostratigraphy for the Late Pliocene-Early Pleistocene Stirone section, Northern Apennine mountain front, Italy. Geol. Soc. Spec. Publ. 373, 309–323. doi: 10.1144/SP373.8
Hallam, A. (1984). Continental humid and arid zones during the Jurassic and Cretaceous. Palaeogeogr. Palaeoclimatol. Palaeoecol. 47, 195–223. doi: 10.1016/0031-0182(84)90094-4
Hallam, A. (1985). A review of Mesozoic climates. J. Geol. Soc. Spec. Publ. 142, 433–445. doi: 10.1144/gsjgs.142.3.0433
Hallam, A. (1986). Role of climate in affecting late Jurassic and early Cretaceous sedimentation in the North Atlantic. Geol. Soc. Spec. Publ. 21, 277–281. doi: 10.1144/GSL.SP.1986.021.01.20
Hallam, A., Grose, J. A., and Ruffell, A. H. (1991). Palaeoclimatic significance of changes in clay mineralogy across the Jurassic-Cretaceous boundary in England and France. Palaeogeogr. Palaeoclimatol. Palaeoecol. 81, 173–187. doi: 10.1016/0031-0182(91)90146-I
Haq, B. U. (2014). Cretaceous eustasy revisited. Glob. Planet. Change 113, 44–58. doi: 10.1016/j.gloplacha.2013.12.007
Hardenbol, J., and Robaszynski, F. (1998). Introduction to the upper Cretaceous. SEPM Spec. Publ. 60, 329–332.
Hardenbol, J., Thierry, J., Farley, M. B., Jacquin, T., Graciansky, P. C., and Vail, P. R. (1998). Mesozoic and Cenozoic sequence chronostratigraphic framework of European Basins. SEPM Spec. Publ. 60, 3–13.
Hilgen, F., Zeeden, C., and Laskar, J. (2020). Paleoclimate records reveal elusive ~200-kyr eccentricity cycle for the first time. Global Planet. Change 194:103296. doi: 10.1016/j.gloplacha.2020.103296
Hilgen, F. J., Hinnov, L. A., Abdul Aziz, H., Abels, H. A., Batenburg, S., Bosmans, J. H. C., et al. (2014). “Stratigraphic continuity and fragmentary sedimentation: the success of cyclostratigraphy as a part of integrated stratigraphy,” in Strata and Time: Probing the Gaps in Our Understanding, eds D. G. Smith, R. J. Bailey, P. M. Burgess, and A. J. Fraser (London: Geological Society), 404.
Hinnov, L. A. (2013). Cyclostratigraphy and its revolutionizing applications in the earth and planetary sciences. Bull. Geol. Society Am. 125, 1703–1734. doi: 10.1130/B30934.1
Hinnov, L. A., and Ogg, J. G. (2007). Cyclostratigraphy and the astronomical time scale. Stratigraphy 4, 239–251.
Hoedemaeker, P. J., and Leereveld, H. (1995). Biostratigraphy and sequence stratigraphy of the BerriasianeLowest Aptian (Lower Cretaceous) of the Rio Argos succession, Caravaca, SE Spain. Cretaceous Res. 16, 195–230. doi: 10.1006/cres.1995.1016
Huang, Z., Ogg, J. G., and Gradstein, F. M. (1993). A quantitative study of Lower Cretaceous cyclic sequences from the Atlantic Ocean and the Vocontian Basin (SE France). Paleoceanography 8, 275–291. doi: 10.1029/93PA00253
Husson, D. (2014). MathWorks File Exchange: RedNoise_ConfidenceLevels. Available online at: http://www.mathworks.com/matlabcentral/fileexchange/45539-rednoise~confidencelevels/content/RedNoise_ConfidenceLevels/RedConf.m (accessed April 28, 2014).
Jacquin, T., Dardeau, G., Durlet, C., De Graciansky, P. C, and Hantzpergue, P. (1998). “The North-Sea cycle: an overview of 2nd-order transgressive/regressive facies cycles in western Europe,” in Mesozoic and Cenozoic Sequence Stratigraphy of European Basins. 445–466.
Jerolmack, D. J., and Paola, C. (2010). Shredding of environmental signals by sediment transport. Geophys. Res. Lett. 37, 1–5. doi: 10.1029/2010GL044638
Kent, D. V., Olsen, P. E., Rasmussen, C., Lepre, C., Mundil, R., Irmis, R. B., et al. (2018). Empirical evidence for stability of the 405-kiloyear Jupiter-Venus eccentricity cycle over hundreds of millions of years. PNAS 115, 6153–6158. doi: 10.1073/pnas.1800891115
Kodama, K. P. (2019). Rock magnetic cyclostratigraphy of the carboniferous Mauch Chunk formation, Pottsville, PA, United States. Earth Sci. 7:285. doi: 10.3389/feart.2019.00285
Kodama, K. P., Anastasio, D. J., Newton, M. L., Pares, J. M., and Hinnov, L. A. (2010). High-resolution rock magnetic cyclostratigraphy in an Eocene flysch, Spanish Pyrenees. Geochem. Geophys. Geosyst. 11, 1–22. doi: 10.1029/2010GC003069
Kodama, K. P., and Hinnov, L. A. (2014). Rock Magnetic Cyclostratigraphy. Oxford: John Wiley and Sons, Ltd.
Lamas, F., Irigaray, C., Oteo, C., and Chacon, J. (2005). Selection of the most appropriate method to determine the carbonate content for engineering purposes with particular regard to marls. Eng. Geol. 81, 32–41. doi: 10.1016/j.enggeo.2005.07.005
Laskar, J., Robutel, P., Joutel, F., Gastineau, M., Correia, A. C. M., and Levrard, B. (2004). A long-term numerical solution for the insolation quantities of the Earth. Astron. Astrophys. 428, 261–285. doi: 10.1051/0004-6361:20041335
Laskar, L., Fienga, A., Gastineau, M., and Manche, H. (2011). La2010: a new orbital solution for the long-term motion of the Earth. Astron. Astrophys. 532:A89. doi: 10.1051/0004-6361/201116836
Li, M., Hinnov, L., and Lee, K. (2019a). Acycle: Time-series analysis software for paleoclimate research and education. Comput. Geosci. 127, 12–22. doi: 10.1016/j.cageo.2019.02.011
Li, M., Hinnov, L. A., Huang, C., and Ogg, J. G. (2018a). Sedimentary noise and sea levels linked to land–ocean water exchange and obliquity forcing. Nat. Commun. 9:1004. doi: 10.1038/s41467-018-03454-y
Li, M., Huang, C., Ogg, J., Zhang, Y., Hinnov, L., Wu, H., et al. (2019b). Paleoclimate proxies for cyclostratigraphy: comparative analysis using a Lower Triassic marine section in South China. Earth Sci. Rev. 189, 125–146. doi: 10.1016/j.earscirev.2019.01.011
Li, M., Kump, L. R., Hinnov, L. A., and Mann, M. E. (2018b). Tracking variable sedimentation rates and astronomical forcing in Phanerozoic paleoclimate proxy series with evolutionary correlation coefficients and hypothesis testing. Earth Planet. Sci. Lett. 501, 165–179. doi: 10.1016/j.epsl.2018.08.041
Li, M. S., Huang, C. J., Hinnov, L. A., Ogg, J., Chen, Z. Q., and Zhang, Y. (2016a). Obliquity forced climate during the early triassic hothouse in China. Geology 44, 623–626. doi: 10.1130/G37970.1
Li, M. S., Ogg, J., and Zhang, Y. (2016b). Astronomical tuning of the end-permian extinction and the early triassic epoch of south China and Germany. Earth Planet. Sci. Lett. 441, 10–25. doi: 10.1016/j.epsl.2016.02.017
Liu, W., Wu, H., Hinnov, L. A., Xi, D., He, H., Zhang, S., et al. (2020). Early cretaceous terrestrial milankovitch cycles in the Luanping Basin, North China and time constraints on early stage Jehol Biota evolution. Front. Earth Sci. 8:178. doi: 10.3389/feart.2020.00178
Ma, C., Meyers, S. R., and Sageman, B. B. (2019). Testing Late Cretaceous astronomical solutions in a 15 million year astrochronologic record from North America. Earth Planet Sci. Lett. 513, 1–11. doi: 10.1016/j.epsl.2019.01.053
Maalaoui, K., and Zargouni, F. (2016a). Biozones de calpionelles et d'ammonites du Berriaisien inférieur et moyen de la Formation Sidi Khalif au Jebel Meloussi, Tunisie centrale. Rev. Paléobiol. 35, 373–384. doi: 10.5281/zenodo.51883
Maalaoui, K., and Zargouni, F. (2016b). The Lower and Middle Berriasian in Central Tunisia: integrated ammonite and calpionellid biostratigraphy of the Sidi Kralif Formation. Acta Geol. Polonica 66,43–58. doi: 10.1515/agp-2016-0002
Martinez, M. (2018). “Mechanisms of preservation of the eccentricity and longer-term milankovitch cycles in detrital supply and carbonate production in hemipelagic marl-limestone alternations,” in Stratigr. Timesc. 3, 189–218. doi: 10.1016/bs.sats.2018.08.002
Martinez, M., Aguado, R., Company, M., Sandoval, J., and Dogherty, O. (2020). Integrated astrochronology of the Barremian stage (Early Cretaceous) and its biostratigraphic subdivisions. Glob. Planet. Change 195:103368. doi: 10.1016/j.gloplacha.2020.103368
Martinez, M., Deconinck, J. F., Pellenard, P., Reboulet, S., and Riquier, L. (2013). Astrochronology of the Valanginian stage from reference sections (Vocontian Basin, France) and palaeoenvironmental implications for the Weissert event. Palaeogeogr. Palaeoclimatol. Palaeoecol. 376, 91–102. doi: 10.1016/j.palaeo.2013.02.021
Martinez, M., Pellenard, P., Deconinck, J.-F., Monna, F., Riquier, L., Boulila, S., et al. (2012). An orbital floating time scale of the Hauterivian/ Barremian GSSP from a magnetic susceptibility signal (Río Argos, Spain). Cretaceous Res. 36, 106–115. doi: 10.1016/j.cretres.2012.02.015
Mayer, H., and Appel, E. (1999). Milankovitch cyclicity and rock-magnetic signatures of palaeoclimatic change in the Early Cretaceous Biancone Formation of the Southern Alps, Italy. Cretaceous Res. 20, 189–214. doi: 10.1006/cres.1999.0145
Memmi, L. (1967). Succession de faunes dans le Tithonique supérieur et le Berriasien du Djebel Nara (Tunisie centrale). Bull. Soc. Géol. France 9, 267–272. doi: 10.2113/gssgfbull.S7-IX.2.267
Meyers, S. R. (2015). The evaluation of eccentricity-related amplitude modulation and bundling in paleoclimate dataastrochron: an inverse approach for astrochronologic testing and time scale optimization. Paleoceanography 30, 1625–1640. doi: 10.1002/2015PA002850
Meyers, S. R. (2019). Cyclostratigraphy and the problem of astrochronologic testing. Earth Sci. Rev. 190, 190–223. doi: 10.1016/j.earscirev.2018.11.015
Meyers, S. R., and Hinnov, L. A. (2010). Northern Hemisphere glaciation and the evolution of Plio-Pleistocene climate noise. Paleoceanography 25:PA3207. doi: 10.1029/2009PA001834
Meyers, S. R., and Malinverno, A. (2018). Proterozoic milankovitch cycles and the history of the solar system. Proc. Natl. Acad. Sci. U.S.A. 115, 6363–6368. doi: 10.1073/pnas.1717689115
Meyers, S. R., and Sageman, B. B. (2004). Detection, quantification, and significance of hiatuses in pelagic and hemipelagic strata. Earth Planet. Sci. Lett. 224, 55–72. doi: 10.1016/j.epsl.2004.05.003
Meyers, S. R., and Sageman, B. B. (2007). Quantification of deep-time orbital forcing by average spectral misfit. Am. J. Sci. 307, 773–792. doi: 10.2475/05.2007.01
Meyers, S. R., Sageman, B. B., and Hinnov, L. A. (2001). Integrated quantitative stratigraphy of the Cenomanian-turonian bridge creek limestone member using evolutive harmonic analysis and stratigraphic modeling. J. Sediment. Res. 71, 628–644. doi: 10.1306/012401710628
Minguez, D., and Kodama, K. P. (2017). Rock magnetic chronostratigraphy of the Shuram carbon isotope excursion : Wonoka Formation, Australia. Geology 45, 1–4. doi: 10.1130/G38572.1
Moiroud, M., Martinez, M., Deconinck, J., Monna, F., Pellenard, P., Riquier, L., et al. (2012). High-resolution clay mineralogy as a proxy for orbital tuning : example of the Hauterivian – Barremian transition in the Betic Cordillera (SE Spain). Sediment. Geol. 282, 336–346. doi: 10.1016/j.sedgeo.2012.10.004
M'Rabet, A. (1981). Stratigraphie, sédimentation et diagenèse carbonatée des séries du Crétacé inférieur de Tunisie centrale. [Thèse] Université Paris Sud, Orsay, France.
M'Rabet, A. (1987). Stratigraphie, sédimentation et diagenèse carbonatée des séries du Crétacé inférieur de la Tunisie centrale. Ann. Min. Géol. Tunis 30:412.
Muller, R. A., and MacDonald, G. J. (2000). Ice Ages and Astronomical Causes: Data, Spectral Analyses and Mechanisms. Chichester: Springer-Praxis.
Mutterlose, J., and Ruffell, A. H. (1999). Milankovitch-scale palaeoclimate changes in paledark bedding rhythms from the Early Cretaceous (Hauterivian and Barremian) of eastern England and northern Germany. Palaeogeogr. Palaeoclimatol. Palaeoecol. 154, 133–160. doi: 10.1016/S0031-0182(99)00107-8
Ogg, J. G., Hinnov, L. A., and Huang, C. (2012). “Cretaceous,” The Geologic Time Scale eds F. M. Gradstein, J. G. Ogg, M. D. Schmitz, and G. M. Ogg (Amsterdam: Elsevier), 793–853.
Price, G. D. (1999). The evidence and implication of polar ice during the Mesozoic. Earth Sci. Rev. 48, 183–210. doi: 10.1016/S0012-8252(99)00048-3
Rasplus, L., Fourcade, S., Ambroise, D., Andeol, B., Azéma, J., Blanc, P., et al. (1987). Stratigraphie intégrée du sillon citrabétique (Sierra de Fontcalent, Province d'Alicante, Espagne). Geobios 20, 337–387. doi: 10.1016/S0016-6995(87)80047-5
Riquier, L., Averbuch, O., Devleeschouwer, X., and Tribovillard, N. (2010). Diagenetic ver-sus detrital origin of the magnetic susceptibility variations in some carbonate Frasnian–Famennian boundary sections from Northern Africa and Western Eu-rope: implications for paleoenvironmental reconstructions. Int. J. Earth Sci. 99, 57–73. doi: 10.1007/s00531-009-0492-7
Ruffell, A. H., and Rawson, P. F. (1994). Paleoclimate control on sequence stratigraphic patterns in the late Jurassic to mid-Cretaceous, with a case study from eastern England. Palaeogeogr. Palaeoclimatol. Palaeoecol. 110, 43–54. doi: 10.1016/0031-0182(94)90109-0
Sageman, B. B. S. E, Singer, B. S., Meyers, S. R., Siewert, S. E., Condon, D., et al. (2014). Integrating 40Ar/39Ar, U-Pb, and astronomical clocks in the Cretaceous Niobrara Formation, Western Interior Basin. Geol. Soc. Am. Bull. 126, 956–973. doi: 10.1130/B30929.1
Sahagian, D., Pinous, O., Olferiev, A., and Zakharov, V. (1996). Eustatic curve for the Middle Jurassic–Cretaceous based on Russian platform and Siberian stratigraphy: zonal resolution. AAPG Bull. 80, 1433–1458. doi: 10.1306/64ED9A56-1724-11D7-8645000102C1865D
Schnyder, J. (2003). Le passage Jurassique/Crétacé: événements instantanés, variations climatiques enregistrées dans les faciès purbéckiens français (Boulonnais, Charentes) et anglais (Dorset). Comparaison avec le domaine téthysien (Thèse de 3ème cycle), Universités de Lille, Paris, 389.
Schnyder, J., Gorin, G., Soussi, M., Baudin, F., and Deconinck, J. F. (2005). A record of the Jurassic/Cretaceous boundary climatic variation on the southern margin of the Tethys: clay minerals and palynofacies of the early Cretaceous Jebel Meloussi section (Central Tunisia, Sidi Kralif Formation). Bull. Soc. Géol. France 176, 171–182. doi: 10.2113/176.2.171
Sinnesael, M., De Vleeschouwer, D., Zeeden, C., Batenburg, S. J., Da Silva, A. C., de Winter, N. J., et al. (2019). The Cyclostratigraphy Intercomparison Project (CIP): consistency, merits and pitfalls. Earth Sci. Rev. 199:102965. doi: 10.1016/j.earscirev.2019.102965
Soussi, M. (2002). Le Jurassique de la Tunisie atlasique: stratigraphie, dynamique sédimentaire, paléogéographie et intérêt pétrolier. Docum. Lab. Geol. Lyon 157:363.
Strasser, A., Hilgen, F. J., and Heckel, P. H. (2007). Cyclostratigraphy - concepts, definitions, and applications. Newslett. Stratigr. 42, 75–114. doi: 10.1127/0078-0421/2006/0042-0075
Thomson, D. J. (1982). Spectrum estimation and harmonic analysis. Proc. IEEE 70, 1055–1096. doi: 10.1109/PROC.1982.12433
Torrence, C., and Compo, G. P. (1998). A practical guide to wavelet analysis. Bull. Am. Meteorol. Soc. 79, 61–78. doi: 10.1175/1520-0477(1998)079andlt;0061:APGTWAandgt;2.0.CO;2
Vennari, V. V., Lescano, M., Naipauer, M., Aguirre-Urreta, B., Concheyro, A., Schaltegger, U., et al. (2014). New constraints on the Jurassic-Cretaceous boundary in the High Andes using high-precision U-Pb data. Gondwana Res. 26, 374–385. doi: 10.1016/j.gr.2013.07.005
Walden, J., Oldfield, F., and Smith, J. (1999). Environmental Magnetism: A Practical Guide. Technical Guide n°6. London: Quaternary Research Association.
Wang, M., Chena, H., Huang, C., Kemp, D. B., Xu, T., Zhang, H., et al. (2020). Astronomical forcing and sedimentary noise modeling of lake-level changes in the Paleogene Dongpu Depression of North China. Earth Planet. Sci. Lett. 535:116. doi: 10.1016/j.epsl.2020.116116
Weedon, G. P., Coe, A. L., and Gallois, R. W. (2004). Cyclostratigraphy, orbital tuning and inferred productivity for the type Kimmeridge Clay (Late Jurassic), southern England. J. Geol. Soc. Lond. 161, 655–666. doi: 10.1144/0016-764903-073
Wimbledon, W. A. P., Reháková, D., Svobodová, A., Elbra, T., Schnabl, P., Pruner, P., et al. (2020). The proposal of a GSSP for the Berriasian stage (Cretaceous system): part 2. Volumina Jurassica 18, 121–160. doi: 10.7306/vj.18.5
Wimbledon, W. A. P., Casellato, C. E., Rehákov,á, D., Bulot, L. G., Erba, E., Gardin, S., et al. (2011). Fixing a basal Berriasian and Jurassic–Cretaceous (J-K) boundary – is there perhaps some light at the end of the tunnel? Riv. Ital. Paleontol. Stratigr. 117, 295–307. doi: 10.13130/2039-4942/5976
Keywords: Berriasian, cyclostratigraphy, Sidi Khalif formation, orbital tuning, sediment accumulation rate
Citation: Omar H, Da Silva A-C and Yaich C (2021) Linking the Variation of Sediment Accumulation Rate to Short Term Sea-Level Change Using Cyclostratigraphy: Case Study of the Lower Berriasian Hemipelagic Sediments in Central Tunisia (Southern Tethys). Front. Earth Sci. 9:638441. doi: 10.3389/feart.2021.638441
Received: 06 December 2020; Accepted: 26 February 2021;
Published: 26 March 2021.
Edited by:
Junsheng Nie, Lanzhou University, ChinaCopyright © 2021 Omar, Da Silva and Yaich. This is an open-access article distributed under the terms of the Creative Commons Attribution License (CC BY). The use, distribution or reproduction in other forums is permitted, provided the original author(s) and the copyright owner(s) are credited and that the original publication in this journal is cited, in accordance with accepted academic practice. No use, distribution or reproduction is permitted which does not comply with these terms.
*Correspondence: Hamdi Omar, aGFtZGkub21hckBlbmlzLnRu