 Drake M. Singleton1,2*†
 Jillian M. Maloney1
 Daniel S. Brothers3
 Shannon Klotsko4Neal W. Driscoll2
 Thomas K. Rockwell1
- 1Department of Geological Sciences, San Diego State University, San Diego, CA, United States
- 2Scripps Institution of Oceanography, University of California, San Diego, San Diego, CA, United States
- 3Pacific Coastal and Marine Science Center, U.S. Geological Survey, Santa Cruz, CA, United States
- 4Department of Earth and Ocean Sciences, University of North Carolina Wilmington, Wilmington, NC, United States
In Southern California, plate boundary motion between the North American and Pacific plates is distributed across several sub-parallel fault systems. The offshore faults of the California Continental Borderland (CCB) are thought to accommodate ∼10–15% of the total plate boundary motion, but the exact distribution of slip and the mechanics of slip partitioning remain uncertain. The Newport-Inglewood-Rose Canyon fault is the easternmost fault within the CCB whose southern segment splays out into a complex network of faults beneath San Diego Bay. A pull-apart basin model between the Rose Canyon and the offshore Descanso fault has been used to explain prominent fault orientations and subsidence beneath San Diego Bay; however, this model does not account for faults in the southern portion of the bay or faulting east of the bay. To investigate the characteristics of faulting and stratigraphic architecture beneath San Diego Bay, we combined a suite of reprocessed legacy airgun multi-channel seismic profiles and high-resolution Chirp data, with age and lithology controls from geotechnical boreholes and shallow sub-surface vibracores. This combined dataset is used to create gridded horizon surfaces, fault maps, and perform a kinematic fault analysis. The structure beneath San Diego Bay is dominated by down-to-the-east motion on normal faults that can be separated into two distinct groups. The strikes of these two fault groups can be explained with a double pull-apart basin model for San Diego Bay. In our conceptual model, the western portion of San Diego Bay is controlled by a right-step between the Rose Canyon and Descanso faults, which matches both observations and predictions from laboratory models. The eastern portion of San Diego Bay appears to be controlled by an inferred step-over between the Rose Canyon and San Miguel-Vallecitos faults and displays distinct fault strike orientations, which kinematic analysis indicates should have a significant component of strike-slip partitioning that is not detectable in the seismic data. The potential of a Rose Canyon-San Miguel-Vallecitos fault connection would effectively cut the stepover distance in half and have important implications for the seismic hazard of the San Diego-Tijuana metropolitan area (population ∼3 million people).
Introduction
Pull-apart basins form in extensional step-overs between strike-slip fault sections and are common features of strike-slip fault systems around the word (Mann, 2007 and references therein). These structures receive considerable attention in academic studies not only due to their abundance, but also their high potential in resource extraction, and their role in earthquake rupture processes (e.g., Mann et al., 1983; Oglesby, 2005; Mann, 2007; Wesnousky, 2008; Brothers et al., 2009; 2011; Wu et al., 2009; Watt et al., 2016; van Wijk et al., 2017). A significant amount of previous work has focused on the evolution of pull-apart basins, from early-stage spindle-shaped basins through the extreme case of significant lithospheric thinning and the development of a spreading ridge (Mann et al., 1983; Lonsdale, 1995; Mann, 2007; Wu et al., 2009; Dooley and Schreurs, 2012; Ye et al., 2015; van Wijk et al., 2017).
As a result of the continuum of development exhibited by pull-apart basins (Mann, 2007), a variety of structural conditions have been observed ranging from relatively simple geometries, i.e., two parallel fault strands experiencing pure strike-slip motion with a central depocenter [e.g., the Dead Sea (Garfunkel and Ben-Avraham, 1996)], to more complex fault structures found in basins undergoing transtension [e.g., the Gulf of California-Salton Trough system (Lonsdale, 1995; Brothers et al., 2009)]. Distinctive structural features have been identified that can separate pull-apart basins into two end-member models based on deformation style (i.e., pure strike-slip or transtensional) (Wu et al., 2009). In the classical model of a pull-apart basin experiencing pure strike-slip deformation, a central basin is bounded by terraced normal faults striking ∼30° to the master strike-slip fault sections; in contrast, basins undergoing transtension appear to develop en-echelon sidewall faults and more complex central basins with multiple depositional centers (Wu et al., 2009).
From a seismic hazard perspective, pull-apart basins are of particular interest as regions where extensional normal stress is elevated (i.e., unclamping), which may promote the nucleation of earthquake ruptures that can continue onto the larger master strike-slip faults (Oglesby, 2005; Brothers et al., 2011; Watt et al., 2016). Additionally, analysis of mapped historical ruptures indicate that step-over regions may sometimes act as barriers to through-going ruptures and so potentially act as termination points (Wesnousky, 2008). Therefore, the potential role of pull-apart basins in earthquake rupture length and consequently magnitude, as well as nucleation and potential rupture directivity, highlights their importance for an accurate regional seismic hazard assessment.
Through field observation (e.g., Garfunkel and Ben-Avraham, 1996; Mann, 2007; Wesnousky, 2008; Brothers et al., 2009; Watt et al., 2016), analogue models (e.g., Wu et al., 2009; Dooley and Schreurs, 2012), and numerical studies (e.g., Oglesby, 2005; Ye et al., 2015; van Wijk et al., 2017), a basic understanding of pull-apart basins has emerged that focuses on fault structure and stratigraphic character of the central region of subsidence that develops in the space between the two principal displacement zones (i.e., the main strike-slip fault sections). The predictive models produced by such studies investigate strike-slip fault step-overs and oblique deformation at a range of different scales and boundary conditions. Kinematic models using plate boundary conditions and fault geometry (but not explicitly considering stress conditions), provide a broad scale perspective on deformation characteristics and strain partitioning (e.g., Tikoff and Teyssier, 1994; Teyssier et al., 1995). Predictions of smaller scale (intra-basin) faulting and deformation through time is provided by analogue and numerical models that simulate lithospheric conditions with either proxy material (e.g., sand and clay) (e.g., Dooley and Schreurs, 2012), or simplified fault geometries and stress conditions (e.g., Ye et al., 2015). While valuable as a framework for field observations, these models may have scaling limitations, or may be over simplified due to real-world crustal heterogeneities. These studies highlight the advances that have been made in understanding pull-apart basins but are primarily focused on basins that are located between two master strike-slip segments. Less well known is the resulting evolution or fault structure of a basin in which an additional, competing principal displacement zone may influence the basin development.
In the San Diego, California, region, the Rose Canyon fault represents the boundary between the Peninsular Range geologic province and the complex tectonic fabric of the Inner Continental Borderland (ICB) (Figure 1). The Rose Canyon fault is the southern section of the larger Newport-Inglewood-Rose Canyon fault system, which is the easternmost fault in the ICB and has been mapped as a continuous ∼190 km long fault zone from Los Angeles to San Diego (Figure 1B; Moore, 1972; Wright, 1991; Lindvall and Rockwell, 1995; Maloney et al., 2016; Sahakian et al., 2017). A broad area of transtension exists south of downtown San Diego, where the Rose Canyon fault splays out into a complex network of faults that together results in the subsidence of the San Diego Bay pull-apart basin (Figure 1C).
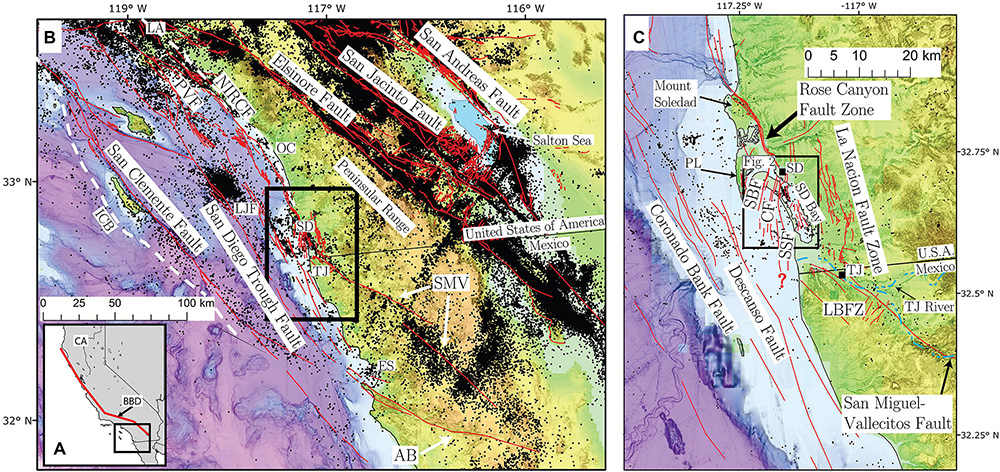
Figure 1. (A) Map of the southwestern United States and northern Baja California, Mexico. Red line marks general trace of the San Andreas Fault. Black box corresponds to location of (B). (B) Map of southwestern California and northwestern Baja California, Mexico. Quaternary active faults are shown in red and the transpeninsular faults are labeled (i.e., AB and SMV). White dashed line indicates boundary of ICB. Regional seismicity (black circles) between 1981-2019 are from Hauksson et al. (2012) and Ross et al. (2019). Black box corresponds to location of (C). (C) Overview map of the San Diego region with regional faults (red lines). The faults that trend south away from San Diego Bay (i.e., SBF, CF, SSF) likely continue beyond the international border, but lack reliable data to extend the mapped trace. Black box marks location of Figure 2. AB, Agua Blanca fault; BBD, Big Bend Domain of the San Andreas Fault; CA, California; CF, Coronado fault; ES, Ensenada; LJF, La Jolla Fan; LBFZ, Los Buenos fault zone; ICB, Inner Continental Borderland; NIRCF, Newport-Inglewood-Rose Canyon fault; OC, Oceanside; PL, Point Loma; SD, San Diego; SMV, San Miguel-Vallecitos fault; SBF, Spanish Bight fault; SSF, Silver Strand fault; TJ, Tijuana. Fault traces north of the international border are from the USGS fault database (USGS, 2019) and the USGS offshore fault database (Walton et al., 2020a); faults south of the border are from Fletcher et al. (2014). Background topography and bathymetry are from ESRI topography and the National Centers for Environmental Information Southern California Coastal Relief Model (v2) (Calsbeek et al., 2013).
The boundaries of the San Diego Bay pull-apart basin are the offshore Descanso fault to the west, the La Nacion fault zone to the east, the Rose Canyon fault to the north, and the Tijuana River valley to the south (Figure 1C) (Kennedy, 1975; Marshall, 1989; Maloney, 2013). Faults in the northwestern portion of the bay can be explained as linking faults oriented ∼30–40° to the dextral Rose Canyon and Descanso faults in a classic pull-apart basin model (Figure 1C) (Legg, 1985; Treiman, 1993; Kennedy and Clarke, 1996; Rockwell, 2010). In southeastern San Diego Bay, a series of faults has been imaged that together with the La Nacion fault zone, strike at a low angle to the Rose Canyon and Descanso faults and are located outside of the apparent active basin (Figure 1C; Kennedy and Welday, 1980; Kennedy and Clarke, 1996), suggesting additional factors are influencing deformation in San Diego Bay.
Some studies have suggested a possible connection between the Rose Canyon and the San Miguel-Vallecitos fault to the south that may be responsible for the orientations of the southeastern bay faults (Figure 1C; Wiegand, 1970; Marshall, 1989; Treiman, 1993). However, the exact mechanics of this connection remain uncertain and definitive evidence of faulting south of San Diego Bay remains elusive. The southern continuation of the Newport-Inglewood-Rose Canyon fault has important consequences for understanding the distribution of plate boundary strain accommodated in the ICB, and thus regional seismic hazard.
In this study, we use a combination of high-resolution seismic Chirp profiles, reprocessed legacy multi-channel seismic (MCS) lines, and borehole-core sampling to resolve the stratigraphic character and structural framework beneath San Diego Bay and to determine the recency of faulting. Additionally, we develop conceptual models using structural analysis of the fault orientations and regional plate boundary characteristics to explain the observed features of the San Diego Bay pull-apart basin.
Regional Geology and Local Tectonics
The ICB is the offshore extension of the Big Bend Domain of the San Andreas plate boundary, which dominates the tectonics of Southern California (Figure 1). The San Diego Bay pull-apart lies along a complex transitional area that separates predominantly transpressional structures to the north, from transtensional structures to the south (Legg et al., 2015; Wetmore et al., 2019). Faults within the ICB play an important role in transferring 10-15% of plate motion from the Gulf of California around the big bend in the San Andreas Fault and into the faults of the Western Transverse Ranges (Humphreys and Weldon, 1991; Platt and Becker, 2010). Slip is fed into the ICB by the faults of the Transpeninsular fault system in Baja California, Mexico, mainly the Agua Blanca (and associated strands) and the San Miguel-Vallecitos faults (Figure 1).
The Agua Blanca Fault and Associated Offshore Strands
The Agua Blanca fault cuts across the Baja Peninsula and transfers ∼2–8 mm/yr of slip into the faults of ICB (Legg et al., 1991; Rockwell et al., 1993; Dixon et al., 2002; Gold et al., 2020). Within the ICB, the Descanso and Coronado Bank faults are strands of the Agua Blanca fault zone that help carry a portion of this slip northward, potentially partitioning it into the Rose Canyon fault through the San Diego Bay pull-apart basin (Figure 1; Legg, 1985; Legg et al., 1991). Studies in the 1980s and 1990s (e.g., Legg, 1985; Legg et al., 1991) postulated that the Coronado Bank fault is a section of an extensive Palos Verdes-Coronado-Agua Blanca fault system, but recently collected seismic reflection data have shown that the Coronado Bank fault decreases in recency and continuity of faulting offshore Oceanside, California, and does not have a clear connection to the Palos Verdes fault (Figure 1B; Ryan et al., 2009; Brothers et al., 2015). Therefore, any slip carried northward by the Coronado Bank fault is likely transferred onto an adjacent fault structure (Conrad et al., 2018). The Descanso fault trends N25°W offshore San Diego (Figure 1), and its termination may mark the northern limit of the larger Estero-Descanso fault, but the exact location of the Descanso fault south of the international border is poorly understood due to a “lack of good seismic data” (Legg, 1985).
Reprocessed industry MCS profiles suggest that at the latitude of San Diego Bay, the Descanso fault is an eastern strand of the larger Coronado Bank fault system (Maloney, 2013). Hanging wall rollover imaged in MCS data along the eastward-dipping Coronado Bank fault indicates a degree of soling at depth that may be a consequence of participation in the San Diego Bay pull-apart basin (Maloney, 2013). Combined high-resolution Chirp and MSC data show that the Descanso-Coronado Bank fault zone reaches its locally greatest width adjacent to the deepest portion of the San Diego Bay pull-apart basin where it displaces the transgressive surface (Maloney, 2013). Northward, the fault zone narrows and Chirp data indicate a non-faulted transgressive surface, suggesting a northward decrease in activity on the Descanso fault (Maloney, 2013). Recent faulting is observed on the Coronado Bank fault until it reaches and becomes buried by the La Jolla Fan (Ryan et al., 2009). Several earthquakes (M < 4) have been located between the Coronado Bank fault and the Rose Canyon fault, providing additional evidence of a connection between these two fault systems (Figure 1C; Astiz and Shearer, 2000; Hauksson et al., 2012; Ross et al., 2019).
The San Miguel-Vallecitos Fault and Associated Strands
The San Miguel-Vallecitos fault is composed of en-echelon fault sections that trend northwest across the Baja Peninsula and is well-aligned to connect with the Rose Canyon fault (Figure 1). Mapped offsets of magmatic dikes suggest a small (∼600–1000 m) total offset, while slip rate estimates vary considerably, with geologic estimates (∼0.2 mm/yr) significantly lower than geodetic estimates (∼2–4 mm/yr) (Hirabayashi et al., 1996; Dixon et al., 2002; Wilson et al., 2011). Together, these characteristics (i.e., short en-echelon segments, small total offset, and order of magnitude difference between geologic and geodetic slip rates) may be an indication of the fault’s incipient nature. The San Miguel-Vallecitos fault is active, hosting several M > 6 surface rupturing earthquakes in the past century and high rates of microseismicity (Figure 1B; Hirabayashi et al., 1996; Frez et al., 2000). The mapped trace of the San Miguel-Vallecitos fault ends ∼30 km south of San Diego Bay, but previous studies have postulated a connection to the Rose Canyon fault zone based on the alignment of warm water wells, elongated north-south trending depressions (possible sag ponds), offset terraces, and stratigraphic and lithological changes across the proposed fault lineament (Wiegand, 1970; Gastil et al., 1979; Treiman, 1993). Youthful faulting may be obscured by fluvial sedimentation along the Tijuana River and its tributaries.
Faults west of the Tijuana River valley, in northwestern Tijuana, Mexico, have been studied in detail by Minch (1967) and are referred to as the Los Buenos fault zone (Figure 1). The primary structural fabric in this area consists of north-south oriented normal faults that run parallel to the coastline, and secondary northeast-southwest and northwest-southeast oriented normal faults. The north-south faults are dominantly down-to-the-east (Minch, 1967), similar to faults in San Diego Bay. Pleistocene deposits are offset and folded along several faults, but most deformation appears to have occurred during the Miocene (Minch, 1967). The Pleistocene Avondale Terrace, mapped by Ellis and Lee (1919), is at an elevation of 106–121 m and is offset by faults in the Los Buenos fault zone, but north of the Tijuana River valley the same terrace is at 60 m elevation and is not offset by faulting (Gastil et al., 1979).
The Rose Canyon Fault Zone and San Diego Bay
North of San Diego, the Rose Canyon fault trends ∼S25°E from offshore Oceanside and extends for 35 km south to La Jolla, where the fault takes a leftward compressional bend uplifting Mt. Soledad before continuing on a similar trend south along the I-5 corridor towards San Diego Bay (Figure 1). The Rose Canyon fault has ∼4 km of total offset based on the displaced Eocene Mt. Soledad Formation and is thought to have initiated in Pliocene-Quaternary time as the upper portion of the late-Pliocene age San Diego Formation is a tectono-stratigraphic unit that records the down-dropping and sedimentation in San Diego Bay (Demere, 1983; Kies, 1982; Treiman, 1993). The San Diego Formation is overlain by a series of marine terraces of Pleistocene age that are locally deformed in the San Diego region in response to movement on regional faults (Kern and Rockwell, 1992; Haaker et al., 2016).
Just north of downtown San Diego, the Rose Canyon fault splays out into a complex network of faults that make up the San Diego Bay pull-apart basin (Figures 1C, 2). The northernmost splay trends offshore into northern San Diego Bay as the Spanish Bight fault (Figures 1C, 2). Through downtown, the Rose Canyon fault zone is mapped as the western San Diego fault and an eastern zone of faulting that includes the “downtown graben” (Figure 2; Treiman, 1993, 2002; Weidman et al., 2019). These splays trend into the bay as the Coronado and Silver Strand faults, respectively (Figures 1C, 2). Gravity measurements indicate that San Diego Bay overlies a northwest-oriented, ∼20-km-long, ∼12-km-wide, and 2–3-km-deep basin that reaches its greatest depth beneath south San Diego Bay (Marshall, 1989). The faults in the northwestern bay (the Spanish Bight, Coronado, and Silver Strand faults) are well-defined and well-imaged. These faults have a north-northeasterly surface trend and have been mapped from the northern portion of San Diego Bay, across the Coronado Peninsula, and offshore to at least the United States-Mexico border, where poor data quality prevented the establishment of a southern continuation (Figures 1C, 2; Legg, 1985; Maloney, 2013). These three ‘linking’ faults all show predominantly down to the east displacement in seismic data and displace sediment close to the bay floor with potential displacement of the bay floor on some strands (Maloney, 2013).
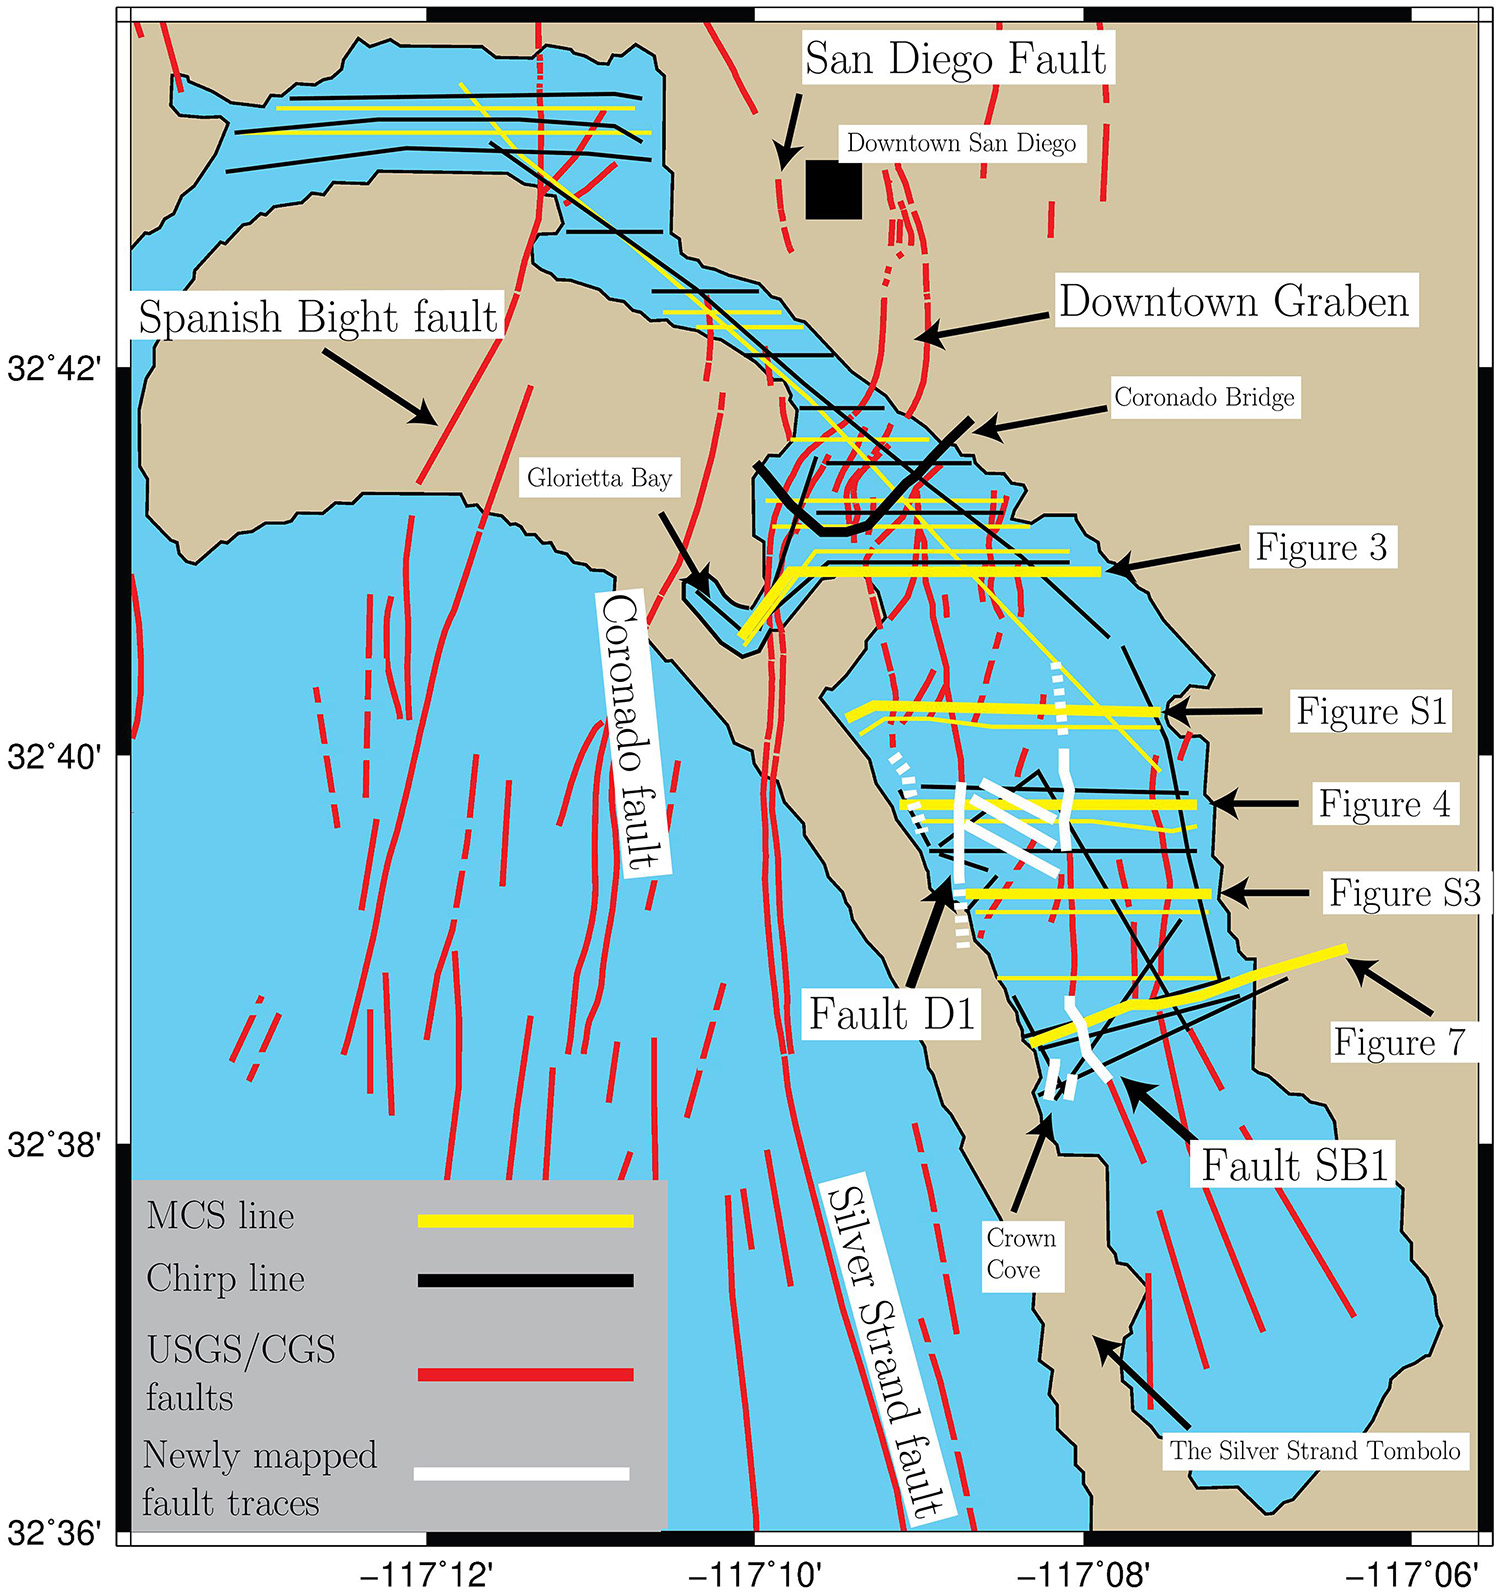
Figure 2. Map of San Diego Bay showing previously mapped fault traces from USGS Quaternary fault database (red lines) (USGS, 2019), seismic data used in this study (yellow and black lines), and extended fault traces as part of this study (white lines). Bolded seismic lines are the location of figures presented in the text. Dashed red fault lines are older Quaternary fault traces, dashed white fault traces are obscured, but inferred fault traces. Figure created using Generic Mapping Tools (Wessel et al., 2019).
South of the Silver Strand fault, in the southeastern portion of San Diego Bay, is a series of north-northwest trending faults that also exhibit normal motion with down-to-the-east displacement (Figure 2). These southeastern bay faults appear to lie outside of the Rose Canyon-Descanso pull-apart basin. East of San Diego Bay, the La Nacion fault zone is composed of north-south oriented, west-dipping, anastomosing normal faults (Figure 1C) with more than 60 m of vertical offset of the Pliocene San Diego Formation (Hart, 1974). Holocene activity has not been observed in paleoseismic excavations (Hart, 1974), and the long-term slip rate is likely very low (Anderson et al., 1989). The La Nacion fault has traditionally been interpreted as the eastern boundary of the San Diego Bay pull-apart basin.
Methods and Datasets
The MCS data used in this study were collected as part of a seismic hazard assessment of the Coronado Bridge in the mid-1990s (Kennedy and Clarke, 1996; 1999). The original survey collected 130 km of MCS lines with a 14-cubic-inch sleeve-gun source, 24-channel streamer, and 3.125-m shot spacing. Unfortunately, all of the original computer data (stored on magnetic tape files) were destroyed in a warehouse fire before they could be transferred to modern digital format, including the original navigation files. Thus, the only surviving copies of the MCS data were thought to be working paper copies (owned by the original investigators) and the figures included in the final report filed with the City of San Diego and the California Division of Mines and Geology (Kennedy and Clarke, 1996). However, a spring-cleaning effort at the offices of the United States Geological Survey-Menlo Park unearthed a set of the original magnetic tape copies of the MCS lines collected in San Diego Bay. These lines were transcribed to modern digital format and reprocessed through the Shearwater Reveal software package (Reveal., 2019).
The original 24-trace shot gathers were sampled at 250 ms with a total length of 0.75 s. Linear moveout and f-k filters were applied to shot gathers to reduce linear coherent noise and energy from refracted arrivals at longer offsets, which were especially prevalent in shallow San Diego Bay and in portions of the bay proximal to large cement structures such as Naval docks. Next, shot gathers were sorted into common-mid-point (CMP) gathers using a 3.125-m bin spacing (12-fold). Velocity analysis was performed every 100 CMPs by maximizing semblance for supergathers constructed using 15 CMPs, and the resulting velocity models were used to apply normal moveout corrections (NMO). Following NMO corrections, water-bottom and stretch-mutes were applied, and the traces were stacked. Lastly, Stolt migration was applied to stacked sections using a constant velocity of 1600 m/s. Reprocessing the older MCS data with improved computational techniques dramatically improved the imaging at depth allowing for better characterization of fault geometry and stratigraphy.
The magnetic tapes did not include navigation for the MCS lines, so the locations were determined from the figures included in the original paper report (Kennedy and Clarke, 1996). To rectify the MCS lines, the figures were scanned and georeferenced in ESRI ArcMap, then the individual MCS lines were digitized. The total length of each digitized line was divided into equal spaced points at 3.125-m spacing (representing CMP gathers). A comparison of previously mapped fault locations in the norther portion of the bay (i.e., crossing the Spanish Bight fault) showed good agreement with the same features imaged in the reprocessed, georeferenced MCS profiles. However, due to uncertainties in the digitization of the original figure, the final locations of some profiles likely carry a location error of ∼10–100 m. Given the uncertainty associated with the MCS navigation from georeferencing, higher precision fault locations are determined from Chirp profiles where possible.
In 2011, 2013, and 2019, high-resolution seismic reflection data were collected in San Diego Bay using Scripps Institution of Oceanography’s Edgetech Chirp subbottom profiler, operated with a 30 ms sweep pulse of 1–15 kHz and a 50 ms sweep pulse of 0.7–3.0 kHz, providing sub-meter vertical resolution with sub-bottom penetration up to ∼40 m, and location accuracy within 5 m. Chirp data were processed using SIOSEIS and Seismic Unix.
Both the MCS and Chirp data were interpreted using IHS Kingdom Suite to examine changes in stratigraphy and fault geometry. Gridded surfaces of mapped horizons were generated for improved visualization. However, due to the geometry of the original MCS survey, several large (∼1.0 km2) areas of the gridding interpolation are unconstrained (Figure 2). Survey details and access to the reprocessed MCS dataset is available through Singleton et al. (2021). The high-resolution Chirp data are publicly available through the USGS National Archive of Marine Seismic Surveys (NAMSS; Triezenberg et al., 2016).
The original Coronado Bridge seismic hazard assessment included a transect of boreholes beneath the Coronado Bridge that provided age constraints (radiocarbon, amino acid stratigraphy, and paleontological analysis) on the underlying strata (Kennedy and Clarke, 1999). In the southern portion of San Diego Bay, shore-based vibracores provide ground-truthing and age correlation for the southern Chirp profiles. The cores were split, photographed, and described, before being scanned for magnetic susceptibility to aid in stratigraphic correlation. Samples from the sediment cores were dated for radiocarbon ages by accelerated mass spectrometry at the University of California-Irvine Keck Carbon Lab. An age model was constructed using OxCal v4.3.2 and Marine Calibration Curve 13 (Reimer et al., 2013; Bronk Ramsey, 2017) with a local reservoir age of 171+154 years before present (Holmquist et al., 2015).
To develop kinematic models of the San Diego Bay pull-apart basin, the surface trends of faults potentially involved with the San Diego Bay pull-apart basin were measured within 1.5 × 1.5 km grid cells from an overlay of a recent fault map (Kennedy and Tan, 2005). Averages of fault trends were calculated using Fisher statistics. Assuming plate motion provides boundary conditions, and deformation of a continuum provides the best kinematic analysis (Jackson and McKenzie, 1983; Fossen and Tikoff, 1993), the relationship between plate motion, instantaneous strain axes, and degree of strike-slip partitioning were used to distinguish between two end-members: wrench (simple-shear) dominated and pure-shear dominated deformation (Fossen and Tikoff, 1993).
Results
Observations From Nested MCS and Chirp Datasets With Age Control
Reprocessing the legacy MCS data resulted in good-quality, interpretable data down to ∼450–500 ms two-way travel time (twtt) and imaged many of the fault segments previously mapped in San Diego Bay. The processed Chirp data resulted in sub-meter vertical resolution seismic images down to ∼50 ms twtt (∼40 m using a sonic velocity of 1500 m/s). Previous studies in San Diego Bay have delineated relatively narrow fault zones in the northwestern portion of the bay that trend north-south across the width of the bay (e.g., the Spanish Bight, Coronado, and Silver Strand faults) (Figure 2; Kennedy and Clarke, 1996; Kennedy, 1975; Maloney, 2013; USGS, 2019). The southeastern portion of the bay is characterized by short discontinuous fault segments and is comparatively understudied (Kennedy and Clarke, 1996; USGS, 2019).
With no tie-lines collected in the southern portion of the bay during the original MCS survey (Figure 2), we relied on several distinctive stratigraphic sequences to correlate stratigraphy between survey lines that were spaced on average ∼400 m apart. Five distinctive sets of high-amplitude reflections separate packages of more chaotic to homogenous low-amplitude reflections (Figure 3) and were used to divide the stratigraphy into four main units. These five horizons were mapped across the study area to observe changes in stratigraphic character. As the deepest map horizon, horizon 5 will have experienced the longest record of deformation associated with San Diego Bay pull-apart basin (Figures 3, 4, and 5). Therefore, the horizon 5 gridded surface is chosen to best represent the deformational record of the San Diego Bay pull-apart basin during later discussions on basin evolution and fault models.
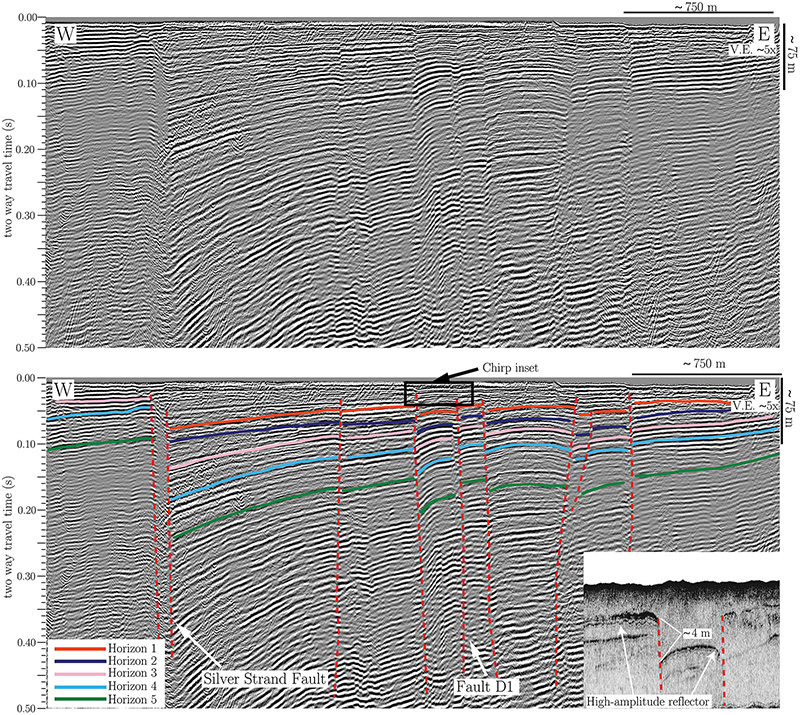
Figure 3. Multi-channel seismic (MCS) profile T196-098 showing large displacement across the Silver Strand fault and westward dip of stratigraphy into both the Silver Strand fault and Fault D1. West of the Silver Strand fault, stratigraphy is flat lying to gently west dipping. Large apparent offset across the Silver Strand fault and uniform character of reflectors west of the fault make stratigraphic correlations difficult and increase uncertainty in interpretations across the fault. Inset shows offset high amplitude irregular reflector interpreted to represent the MIS stage 5e Nestor Terrace. Shown in the bottom panel are the five horizons used to observe changes in stratigraphy across San Diego Bay. Profile location shown in Figure 2.
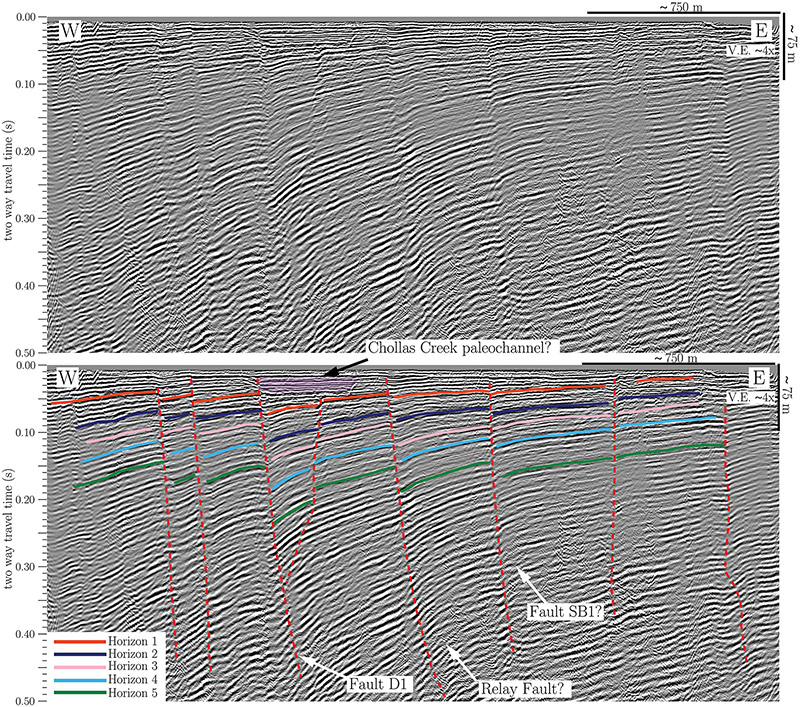
Figure 4. MCS profile T196-088 showing distributed faulting associated with Fault D1, and potential relay fault structure between Faults D1 and SB1. Location shown in Figure 2.
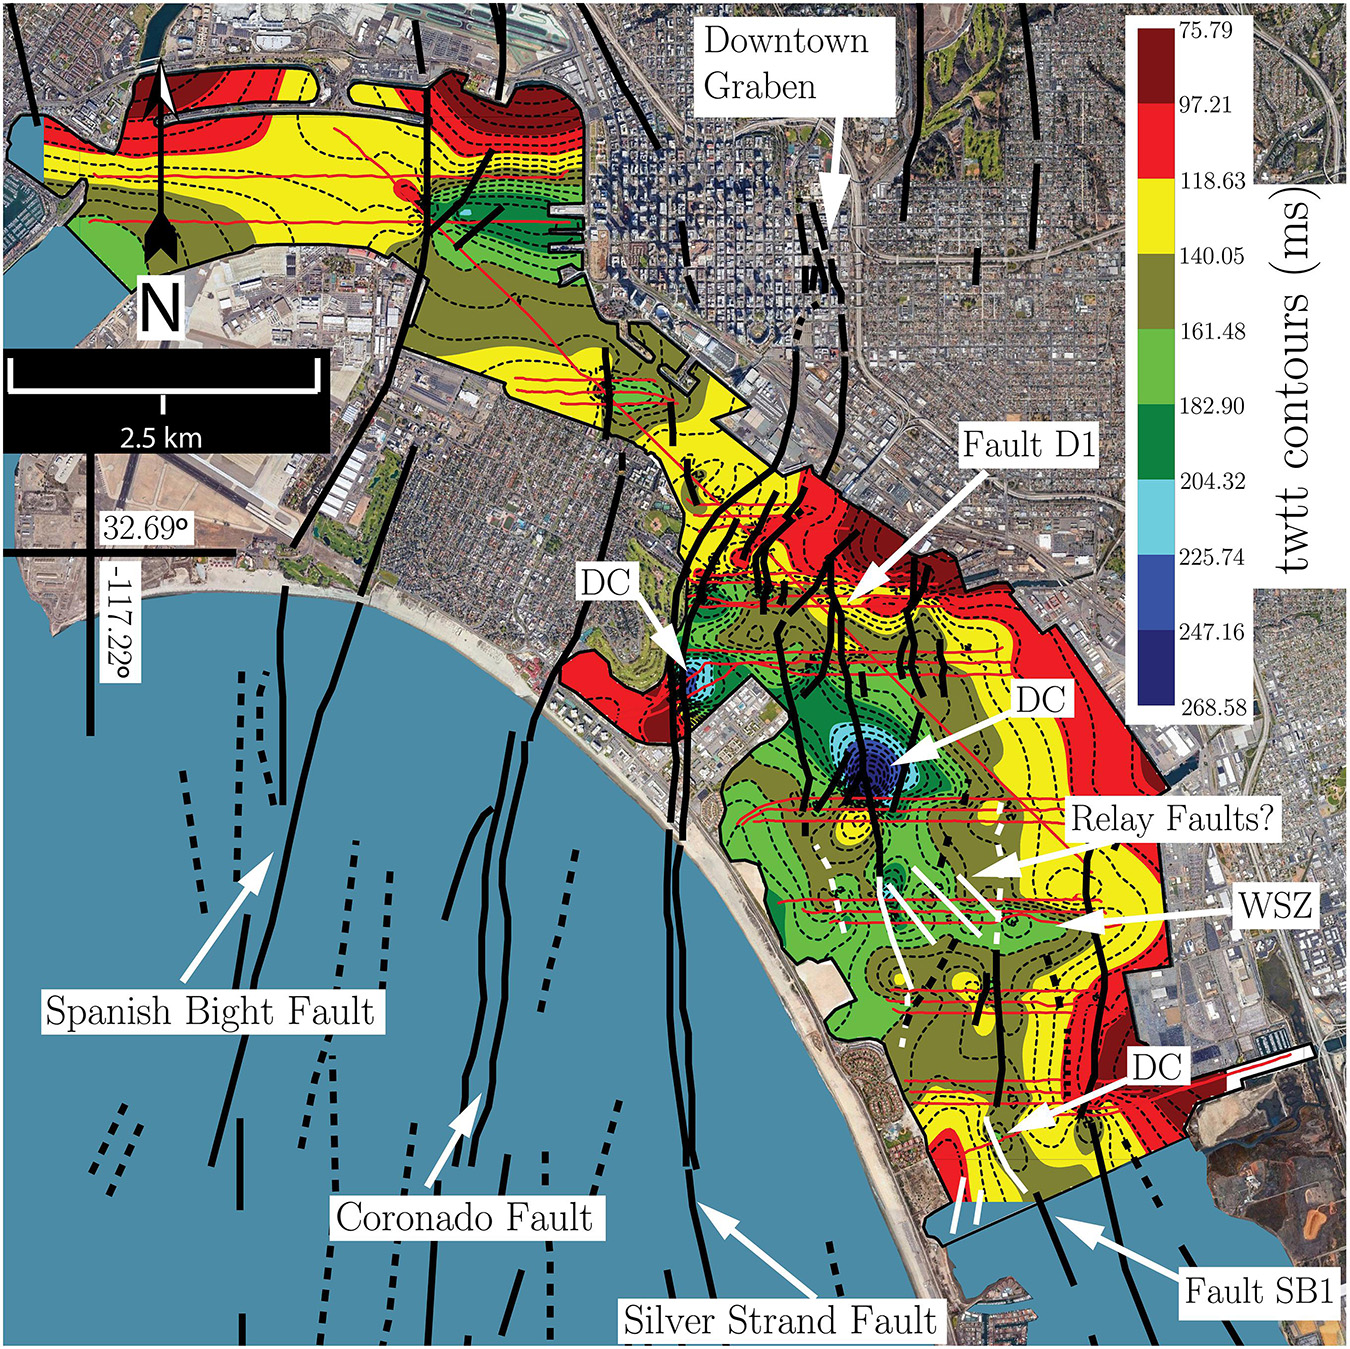
Figure 5. Horizon 5 gridded surface representing depth to horizon 5 in two-way travel time (twtt). Faults from the USGS Quaternary fault database are shown as black lines (USGS, 2019). White lines are the extended fault traces from this study. Localized depositional centers are seen adjacent to D1, SB1, and the Silver Strand faults. A more westerly oriented area of subsidence (WSZ) is observed between Faults SB1 and D1, possibly corresponding to a potential relay fault structure. Outside the study area, in the northeastern part of San Diego Bay local depositional centers are also observed adjacent Spanish Bight and Coronado faults. DC, Depositional Center; WSZ, Western Subsidence Zone. Figure 5 is approximately collocated with Figure 2. Background satellite image from Google Earth (earth.google.com/web).
In the northernmost portion of the bay, previous observations are confirmed as both the Spanish Bight and the Coronado faults exhibit northerly trends and dip steeply to the east, with a down-to-the-east sense of displacements. The Silver Strand fault is a major fault in San Diego Bay and dips steeply east with ∼100 m of down-to-the-east displacement of the horizon 5 surface observed in the Glorietta Bay area (using ∼1500 m/s velocity) (Figure 3). However, poor data quality on the western side of the Silver Strand fault hampered efforts to correlate stratigraphy across the fault confidently, therefore a large uncertainty may be associated with this estimate. Nevertheless, the amount of displacement on the Silver Strand fault appears to decrease northward towards downtown San Diego (Figure 5).
South of the Coronado Bridge, fault segments are generally northwest trending, discontinuous, and exhibit a down-to-the-east sense of displacement (Moore and Kennedy, 1975; Kennedy and Clarke, 1996). Sporadic small (∼50–300 m length), northeast-trending fault segments with variable senses of displacement are also observed. By combining the MCS and Chirp datasets, the surface traces of short discontinuous fault segments are extended to form longer continuous faults in south San Diego Bay (see Figure 2 for locations of seismic profiles). Two of these continuous faults (D1 and SB1) trend for longer distances and exhibit larger vertical displacements than other fault segments in the southeastern portion of the bay (Figures 3–6, Supplementary Figures 1, 3).
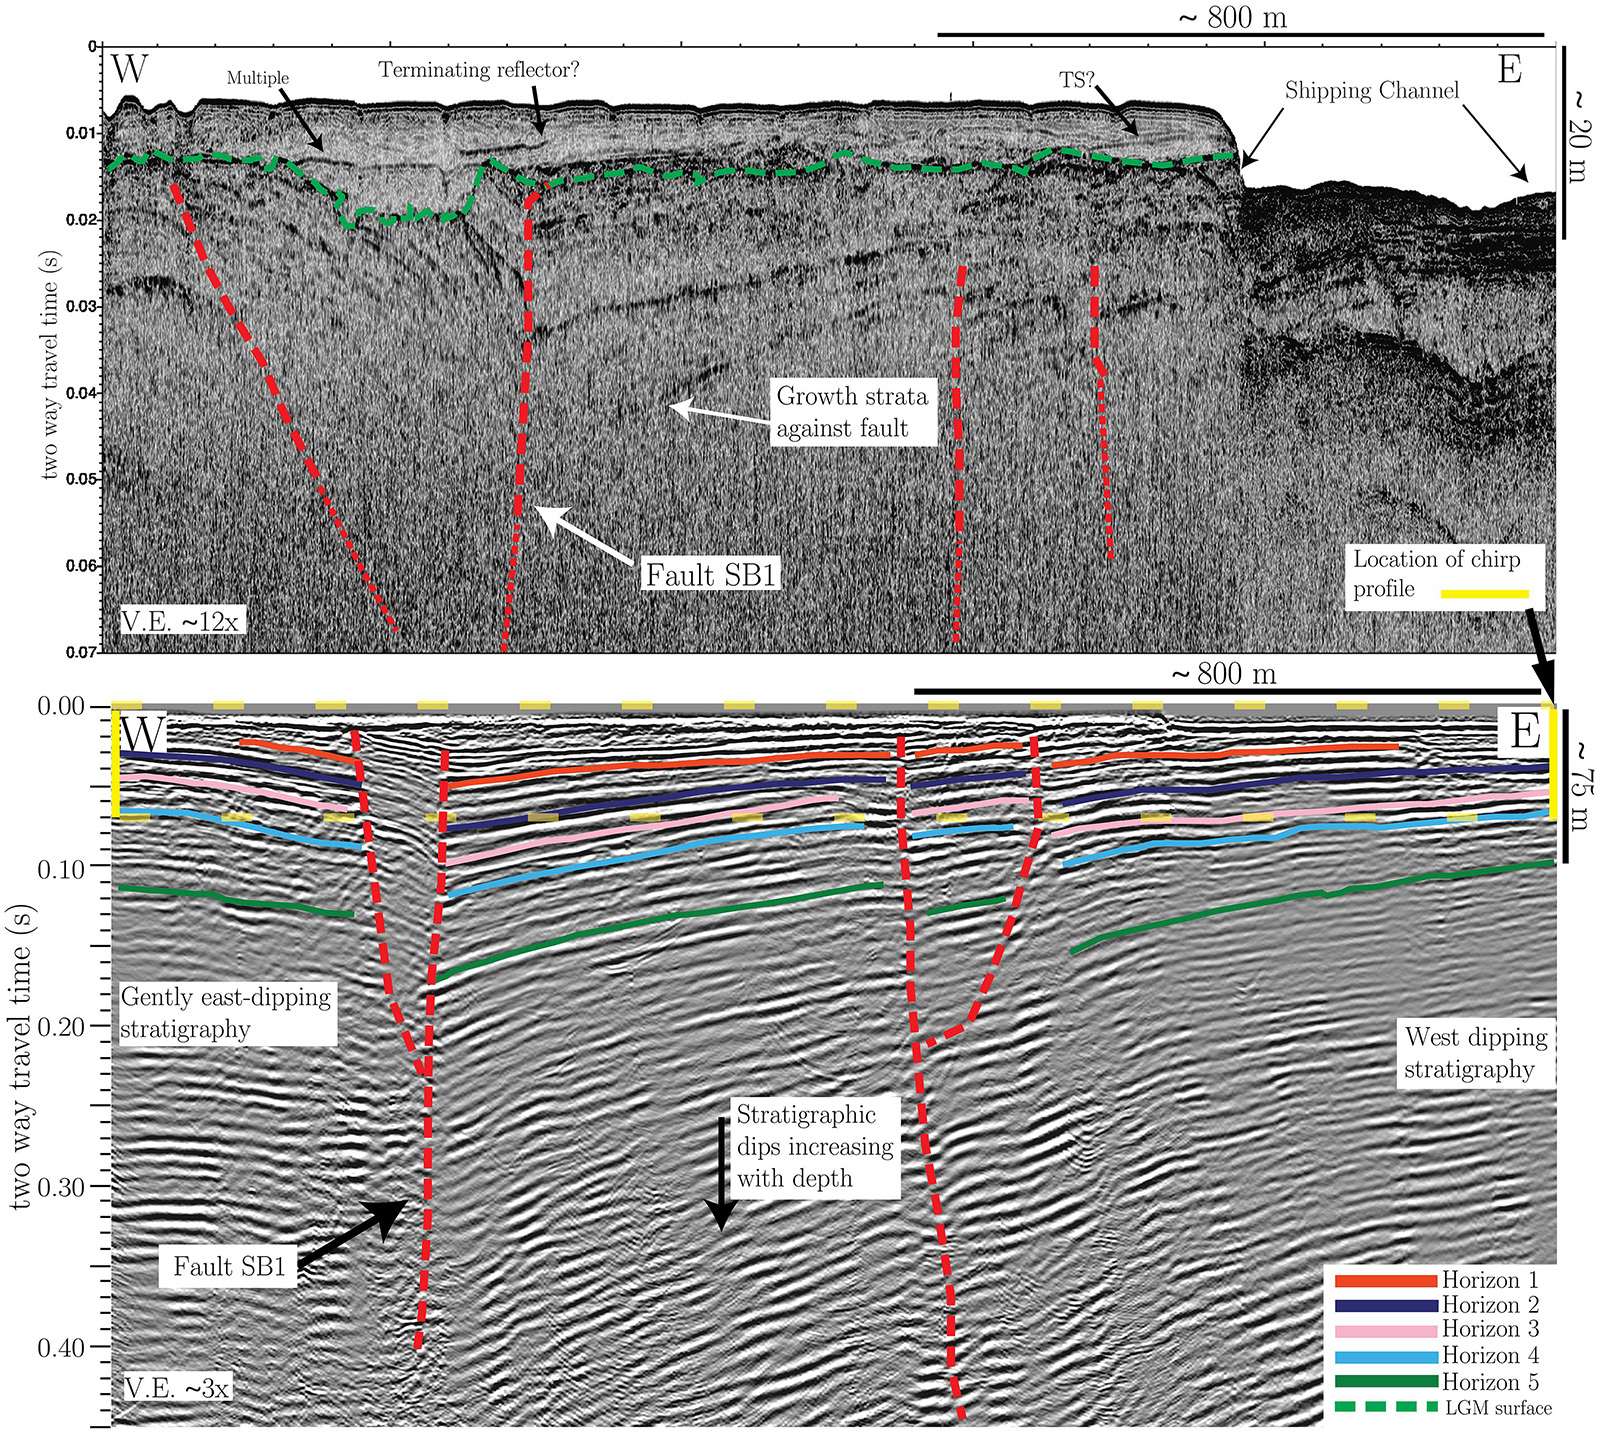
Figure 6. Nested Chirp profile SSB03 (top profile) and MCS profile T196-a792 (bottom profile). Effect of Fault SB1 is seen as increasing dips with depth in the MCS profile, and growth strata terminating against the fault in the Chirp profile. Green dashed horizon in Chirp profile is the interpreted subaerially exposed surface from the Last Glacial Maximum sea level low-stand. Location shown in Figure 2. See Supplementary Figure 4 for unannotated profiles.
Fault D1, previously mapped by Kennedy and Clarke (1996), is located just south of the Coronado Bridge and trends ∼N10°W towards the Silver Strand tombolo. We confirm and extend its trace south from the Coronado Bridge towards the Silver Strand tombolo (Figures 2–4, Supplementary Figures 1, 2, moving north to south). Fault D1 dips steeply to the east for its entire length but changes its sense of slip from locally down-to-the-west in the north near the intersection with the Silver Strand fault and the faults of the “downtown graben” (where its dip is nearly vertical) (Figure 3), to down-to-the-east southward (Figure 4 and Supplementary Figure 1). As first noted by Kennedy and Clarke (1996), at the latitude of the Coronado Bridge, Fault D1 forms a localized horst and graben structure with the adjacent Silver Strand and downtown graben faults (Figure 3). Faulting associated with D1 is distributed across several closely spaced strands that are typically observed in the footwall of the main fault and appear to act as a localized nested graben to accomplish the down-to-the-east sense of motion (Supplementary Figure 1). Towards the southern end of the mapped trace, fewer auxiliary strands are observed. Some strands located in the hanging wall dip west and exhibit a down-to-the-west sense of motion as a result of hanging wall collapse (Figure 4; Kennedy and Clarke, 1996).
Increasing stratigraphic dips and progressively larger separations with depth are observed along D1 in the MCS data (Figure 4 and Supplementary Figure 1). At the location of Figure 4, observed down-to-the-east displacements across D1 include a vertical separation of ∼22 m for horizon 1, ∼34 m for horizon 2, ∼39 m for horizon 3, ∼48 m for horizon 4, and ∼64 m for horizon 5 (assuming a velocity of 1500 m/s). The gridded horizon 5 surface (Figure 5) shows that as Fault D1 extends away from the intersection with the Silver Strand fault, the horizon surface reaches its locally greatest depth of ∼163 m (assuming a 1500 m/s velocity) and begins to shallow southward. A lens shaped channel feature is observed to extend away from the Chollas Creek drainage and is diverted upon contact with the Fault D1, following the fault trace south towards the Silver Strand with the western channel bank potentially aligning with an apparent paleo-scarp of Fault D1 (Figures 4, 7, Supplementary Figures 1–3). The paleochannel intersects with the larger Sweetwater River paleochannel and together exits San Diego Bay through the Silver Strand tombolo (Figure 7). The exact location of where the paleochannels intersect the Silver Strand tombolo is unknown due to a gap in data coverage, but Chirp profiles indicate that these paleochannels did not flow south of the current Sweetwater channel and likely exited San Diego Bay between Crown Cove and Fiddlers Cove (Figure 7).
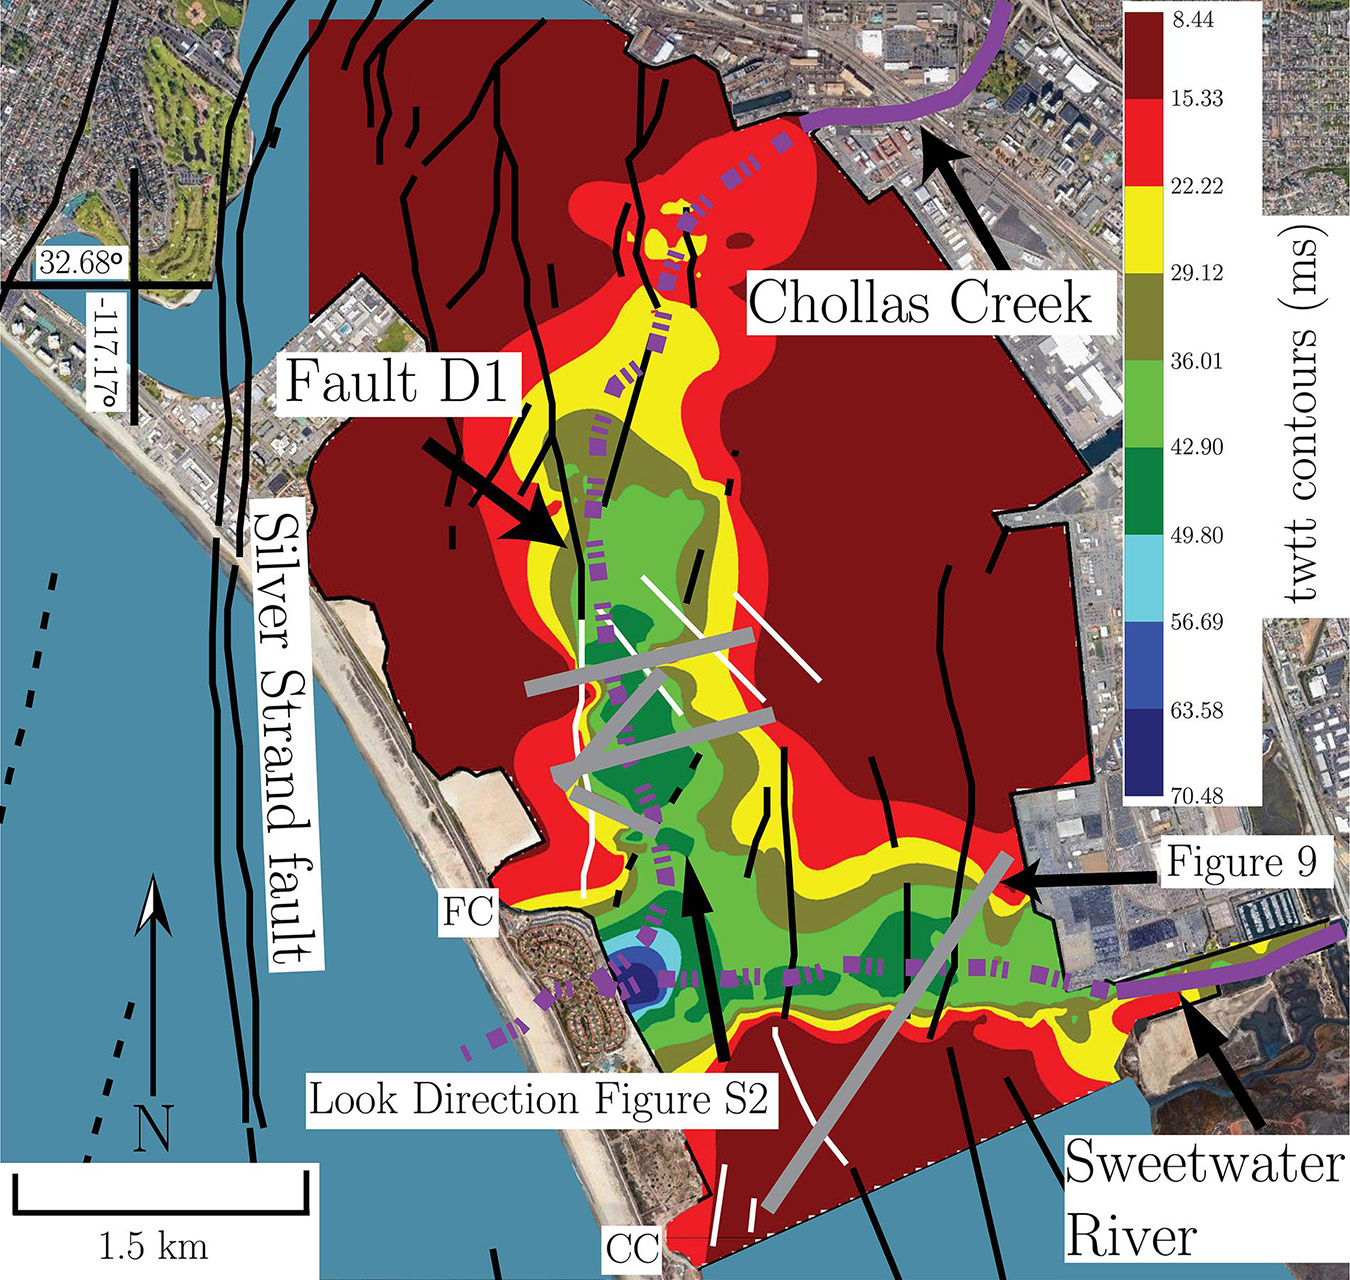
Figure 7. Gridded surface showing base of paleochannel horizon observed in combined MCS and Chirp dataset (e.g., Figures 4, 9, Supplementary Figures 2, 3). Previously mapped faults are shown in black (USGS, 2019), newly mapped faults in white. Purple dashed lines are the approximate locations of paleochannels. Grey lines are locations of Chirp profiles. FC, Fiddlers Cove; CC, Crown Cove. Background satellite image from Google Earth (earth.google.com/web).
Potential recency of faulting for D1 is difficult to establish due to the shallow location of the water bottom multiple reflection in the Chirp data and a general lack of coherent reflectors in the water-saturated upper ∼5 ms of data. The high-amplitude reflection surface that is displaced across Fault D1 (inset of Figure 3) and adjacent faults has been dated by amino acid stratigraphy and paleontological analysis to most likely correlate with MIS stage 5e (Kennedy and Clarke, 1996), providing a maximum age of this offset of ∼125 ka. Additional radiocarbon dates from beneath the Coronado Bridge may suggest that this fault is Holocene active, but conclusive evidence is not present in the high-resolution Chirp profiles (Kennedy and Clarke, 1999).
To the southeast of Fault D1 is Fault SB1, which trends ∼N25°W and is aligned with the long axis of the bay (Figure 2). The fault dips steeply to the east and exhibits a down-to-the-east sense of motion (Figures 2, 4, 6, Supplementary Figures 1, 3). The character and geometry of Fault SB1 is variable along strike. In the south, displacement is concentrated onto a single fault and a few hanging wall splays (Figures 6, 8). As the fault trends northward, deformation becomes distributed onto a series of sub-parallel fault strands that continue to express a down-to-the-east sense of motion (Supplementary Figures 1, 3). To the east of Fault SB1, several MCS profiles image a fault with notable displacement (Figures 4, 6, Supplementary Figure 3), but the surface trace appears to come in-and-out of the data coverage area, hindering a comprehensive observation.
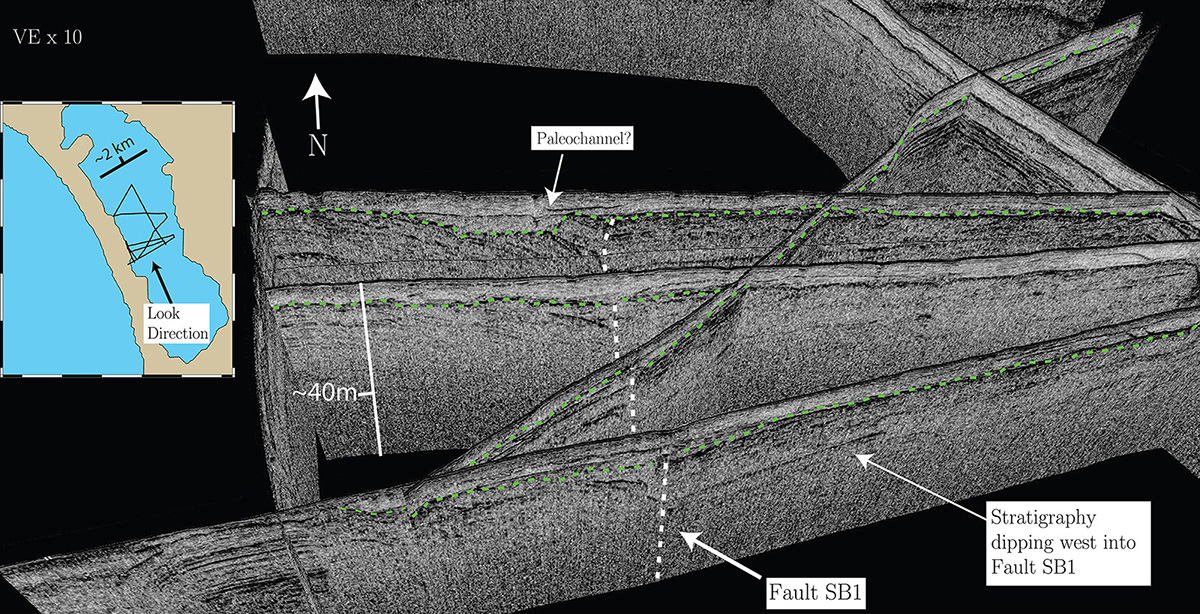
Figure 8. Fence diagram of southernmost Chirp lines that image Fault SB1. Vertical white dashed line is trace of SB1. Green dashed horizon is the interpreted subaerially exposed surface from the Last Glacial Maximum sea level low-stand. Inset shows look direction and location of Chirp profiles.
The northern section of SB1 is observed in the high-resolution Chirp data to extend southward and connect to a previously mapped fault segment, which extends beyond our data coverage into the southern extreme of San Diego Bay (Figures 2, 8). The MCS data show progressively increasing vertical separation and stratigraphic dips with depth associated with Fault SB1. Observed down-to-the-east displacements across SB1 include a vertical separation of ∼11 m for horizon 1, ∼21 m for horizon 2, ∼25 m for horizons 3 and 4, and ∼32 m for horizon 5 (Figure 6). Additionally, growth strata terminating against the fault are imaged in the high-resolution Chirp data (Figures 6, 8, and 9). The high-resolution Chirp data also show that the down-to-the-east sense of displacement develops into a negative flower structure towards the surface (Figure 6).
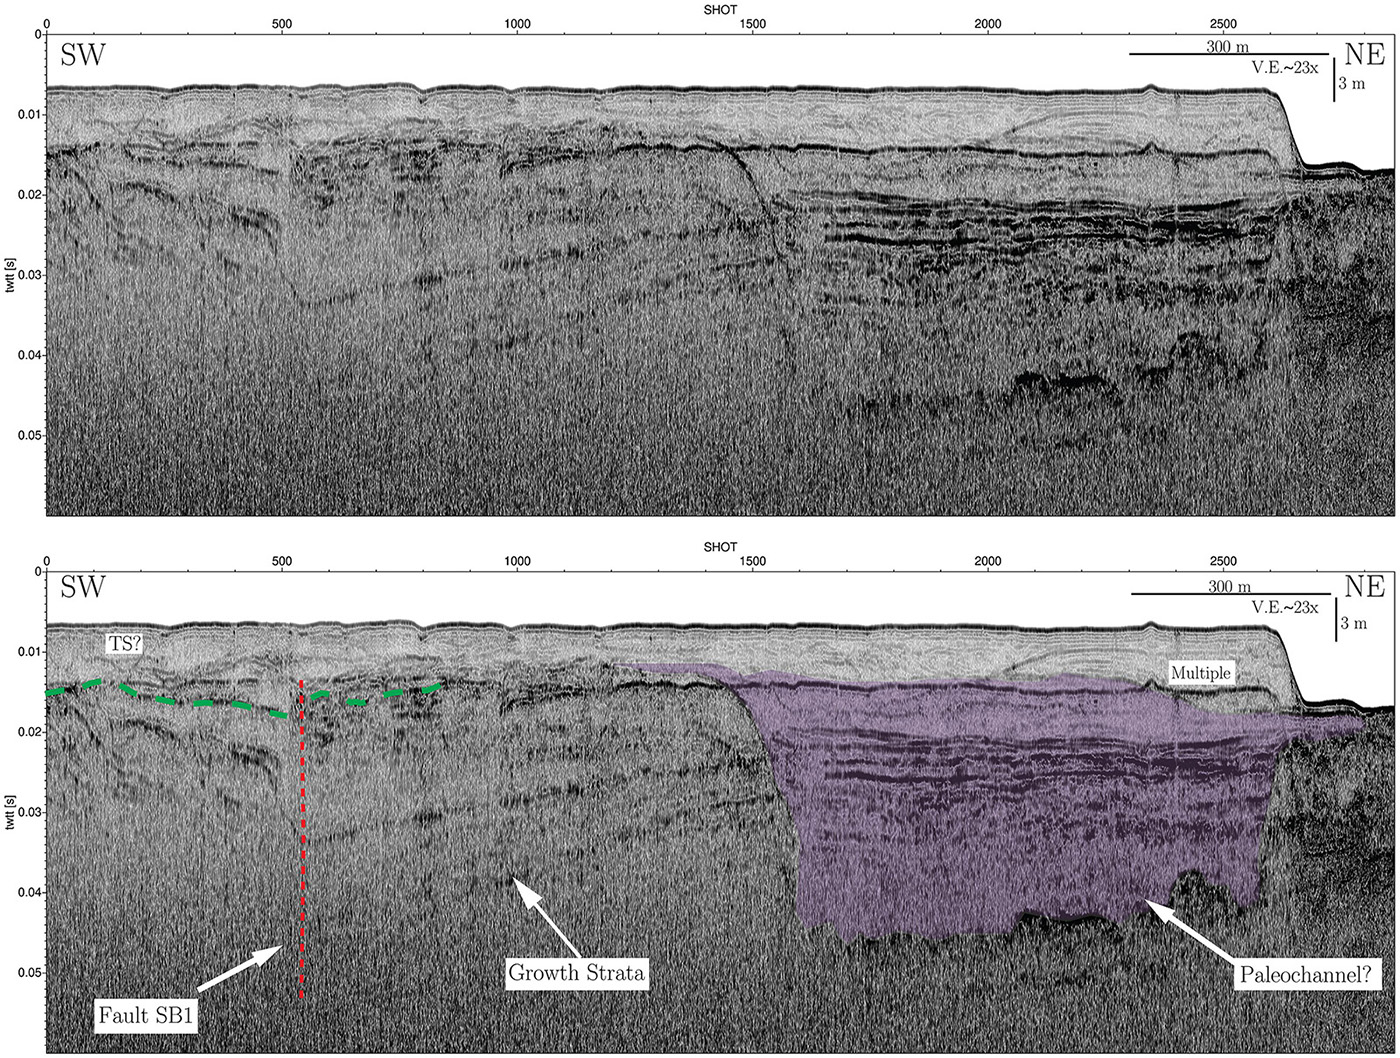
Figure 9. Chirp profile SSB06 across the Sweetwater paleochannel. Red dashed line is location of Fault SB1. Green dashed horizon is the interpreted subaerially exposed surface from the Last Glacial Maximum sea level low-stand. Purple unit is interpreted channel-fill deposit. Location shown in Figure 7.
Fault SB1 may offset a high-amplitude, irregular reflection that is spatially extensive throughout the southern portion of San Diego Bay, although the location of the bayfloor multiple makes interpretations difficult (Figures 6, 8). At ∼0.01 s twtt, a high-amplitude reflection located above the spatially extensive high-amplitude irregular surface appears to terminated against the projected trace of Fault SB1 (Figure 6). However, it is unclear if this truncated reflector is due to faulting, or the result of data resolution loss from fluid flow which is seen in the water column and has indented the seafloor above SB1. Therefore, although SB1 appears to exert some control on the geometry of the shallow (∼8 ms twtt) high-amplitude, irregular reflection, no definitive evidence of Holocene movement is observed (Figure 6).
Subsurface Architecture From Gridded Horizon Surface
The gridded horizon 5 surface shows that the stratigraphy of southern San Diego Bay generally dips towards the west with several depositional basins formed by down-to-the-east movement along the Silver Strand, D1, and SB1 faults (Figure 5). Along Fault D1, subsidence reaches its greatest depth just south of the intersection with the Silver Strand fault and faults of the downtown graben, a pattern similar to that observed along the Silver Strand fault (Figure 5). Amino acid stratigraphy and paleontological analysis of material collected adjacent to the Coronado Bridge suggests the presence of mid-Pleistocene deposits at a depth of at least ∼140 m, a depth similar to the interpreted depth of horizon 5 in that area (assuming a 1500 m/s velocity) (Figure 5; Kennedy and Clarke, 1999). In the south-central portion of San Diego Bay, a smaller, more westerly oriented area of subsidence is located between the overlapping tips of Fault D1 and Fault SB1 (Figure 5). This localized area of subsidence (WSZ in Figure 5) appears to correspond with a decrease in subsidence associated with Fault SB1 moving northward, and Fault D1 moving southward.
Stratigraphic dips are variable across the three main faults in south San Diego Bay. In the vicinity of the Coronado Bridge, the Silver Strand fault separates moderate to steeply westward-dipping stratigraphy in the east, from gently flat-lying to gently westward dipping stratigraphy to the west (Figure 3). Moving southward the stratigraphy of the eastern portion of the bay continues to dip west, but Fault D1 begins to accommodate more of the subsidence, and strata are observed to dip more steeply into D1 than in the north (Figures 3, 4, Supplementary Figure 1). Similar to the Silver Strand fault, the stratigraphy west of Fault D1 continues to dip gently westward. South of the localized area of more westerly oriented subsidence between D1 and SB1, in the south-central portion of the bay, this pattern of westward dips across faults shifts (Figure 5). The stratigraphy in the eastern portion of the bay continues to dip westward but becomes more concentrated onto Fault SB1. The steepness of dips progressively increases from north to south along SB1, with the steepest dips observed along the southernmost profile (Figures 4, 6). Interestingly, the stratigraphy on the west side of SB1 changes from gently flat lying (Supplementary Figure 3) to slightly eastward dipping southward (Figure 6).
The spatial width of faulting is also variable along strike. Near the intersection between the Silver Strand, downtown graben faults, and Fault D1, faulting is confined to a relatively narrow zone (Figures 5, 3). Southward of this intersection, the spatial width between the main fault strands and the number of associated strands increases towards the central part of the bay (Figure 4). This trend appears to reverse with faulting becoming more concentrated into a narrower spatial zone by the southernmost MCS line (T196-a792; Figure 6), with a majority of the displacement observed on Fault SB1 and a couple of adjacent fault strands in the MCS data.
In the southwest corner of the study area (Crown Cove) (Figure 2), Chirp data image two subparallel northeast-trending auxiliary faults that extend from beneath the Silver Strand ∼500 m into the bay to form a localized pop-up structure (Figures 10, 11). The western strand appears to displace sediment within ∼2 ms twtt of the bay floor and displaces the locally extensive high-amplitude, irregular reflection surface by approximately 5.7 m (Figure 11).
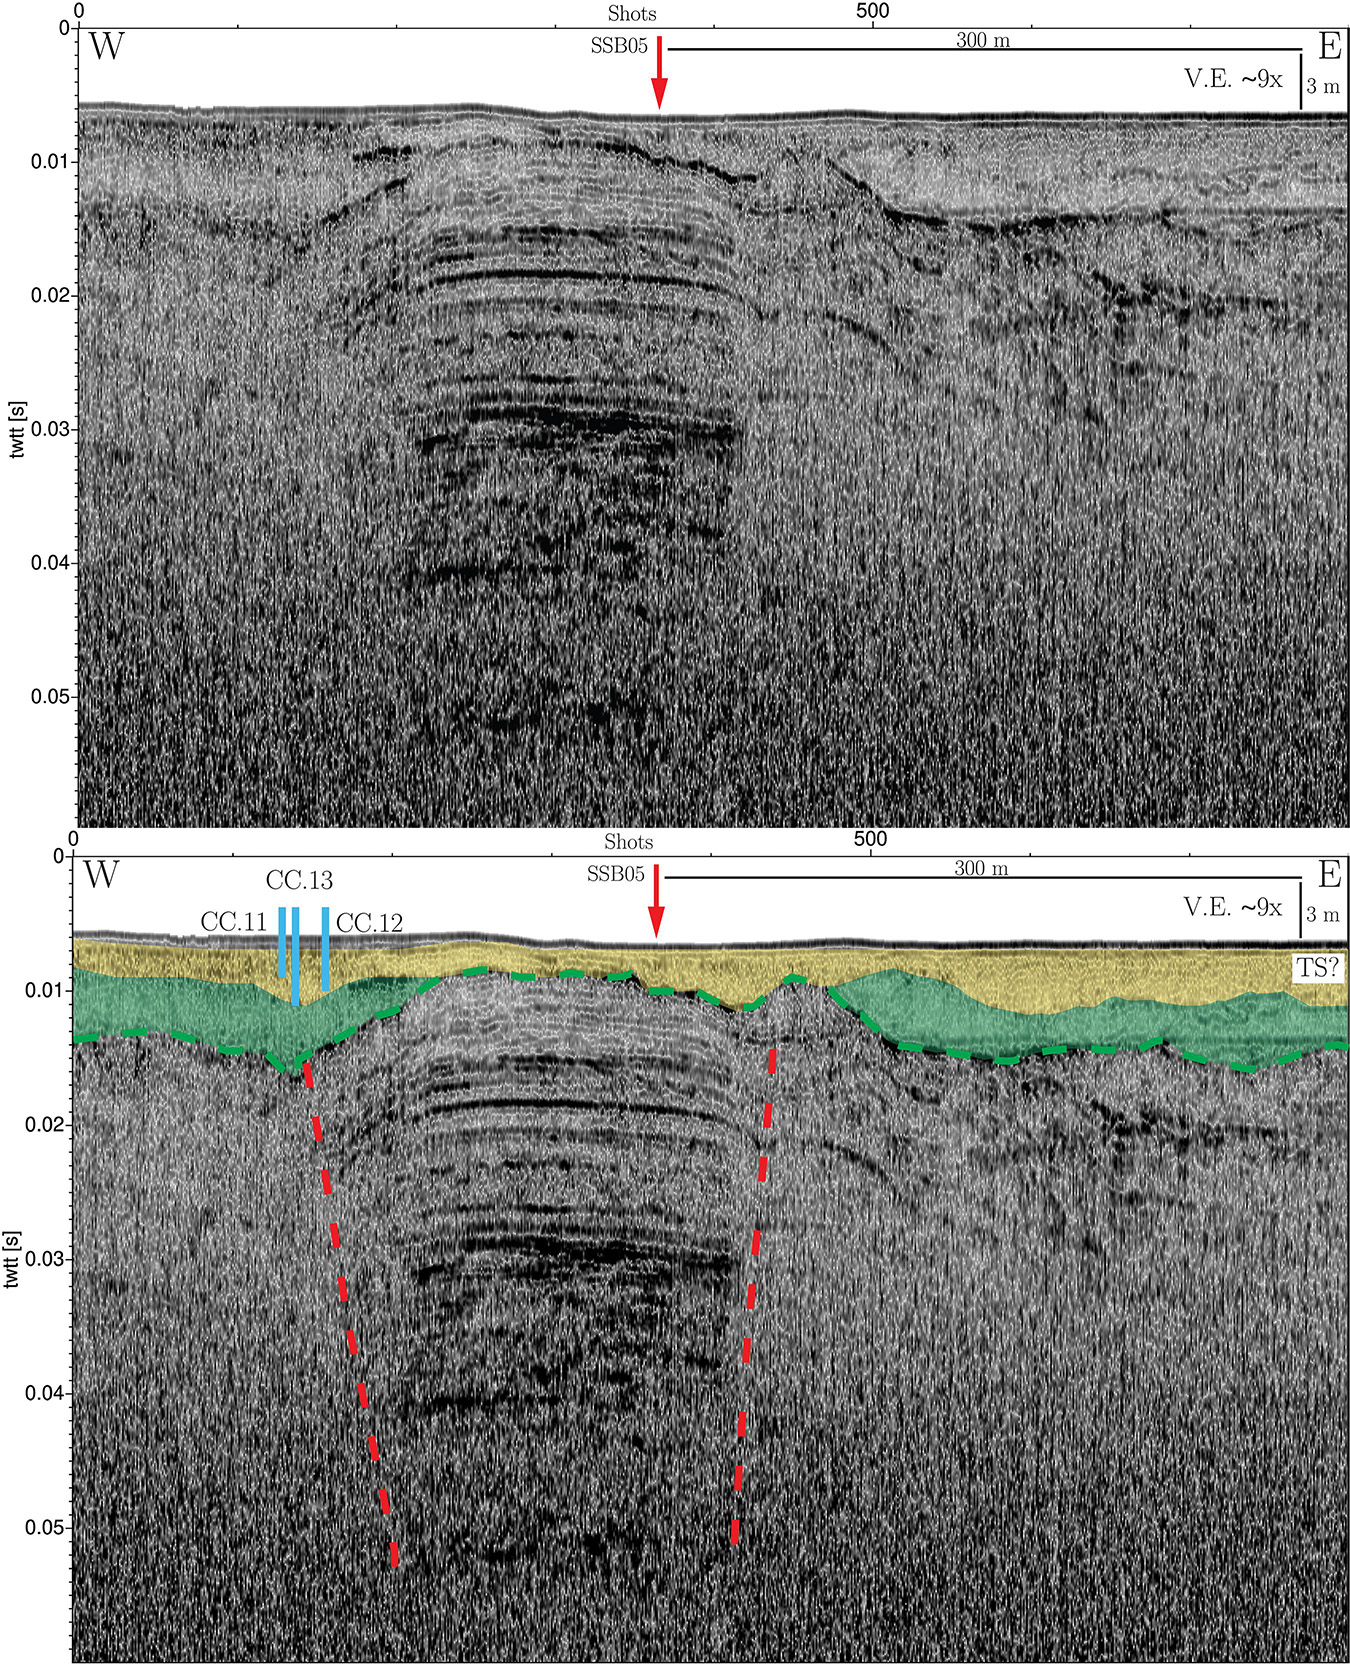
Figure 10. Chirp profile SSB02 with core correlation in the Crown Cove area. Red dashed lines are faults forming a potential pop-up structure. Green dashed horizon is the interpreted subaerially exposed surface from the Last Glacial Maximum sea level low-stand. Green unit represents deposition from the last sea level low-stand until inundation (transgressive deposit) and yellow unit represents estuarine/marine deposition following inundation of the bay (high-stand deposit) (TS, Transgressive Surface). Boundary between green and yellow units is interpreted as the transgressive / inundation surface. Red arrow marks location of north-south oriented SSB05 profile (Figure 11). See Supplementary Figure 5a for location.
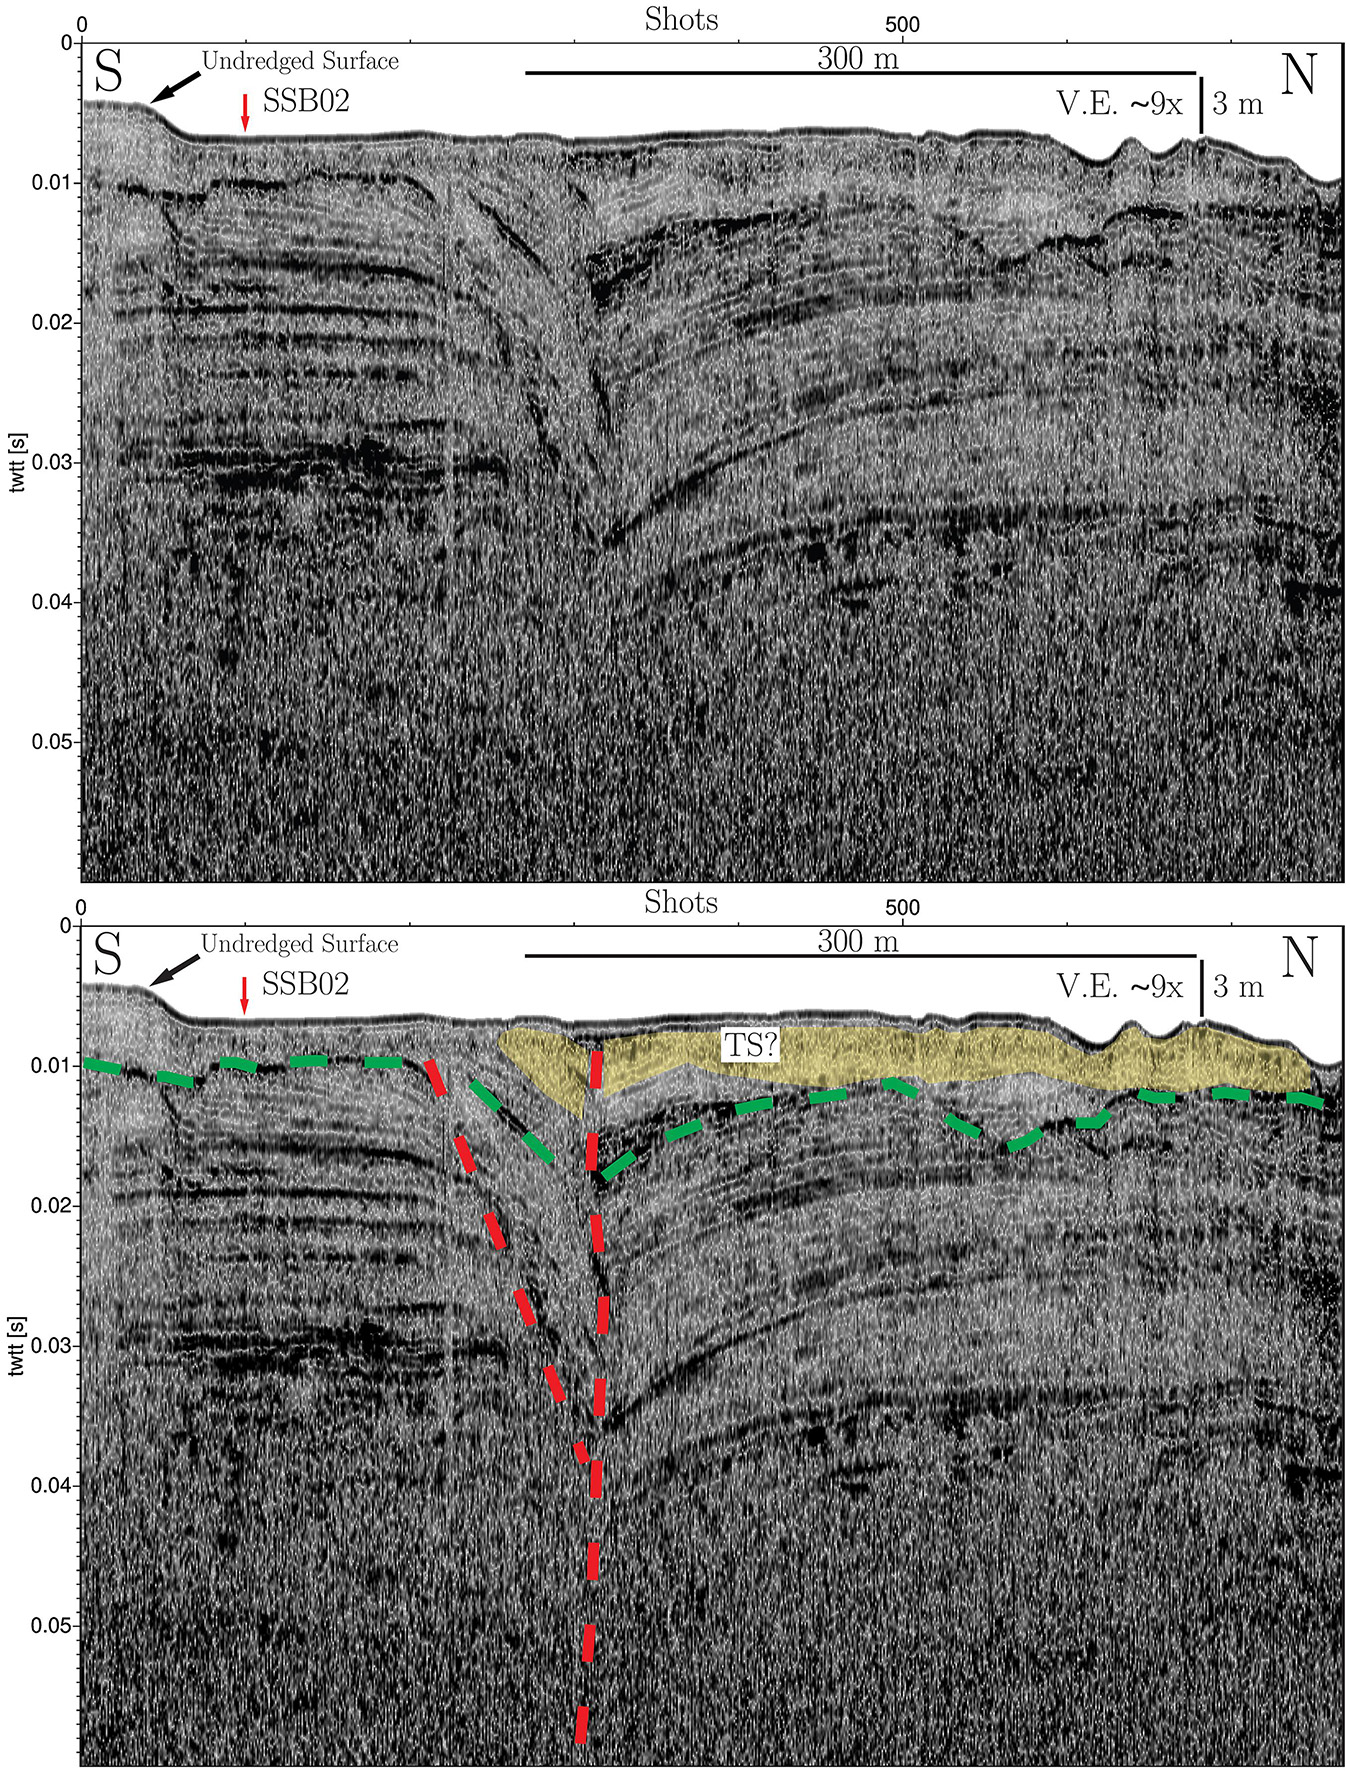
Figure 11. Chirp profile SSB05 from the Crown Cove area showing displacement associated with western pop-up structure fault. Red dashed lines are faults. Green dashed horizon is the interpreted subaerially exposed surface from the Last Glacial Maximum sea level low-stand. Yellow unit is the interpreted estuarine/marine high-stand deposit, with the base representing the transgressive / inundation surface (TS, Transgressive Surface). Red arrow marks the location of the east-west oriented SSB02 profile (Figure 10). See Supplementary Figure 5a for location.
Shallow Subsurface Shoreline Lithology
In the Crown Cove area (Figure 2 and Supplementary Figure 5), both the Chirp profiles and the northeast trending faults are within 10-50 m of the shore and offer an opportunity for low-cost, shore-based coring to ground truth the Chirp data. Three cores were collected on a sand spit that has built out ∼80 m since dredging of the area in 1945 (Figures 10, 12, Supplementary Figure 5). Based on a 1941 aerial photograph (Supplementary Figure 5d) and 1927 Nautical Chart (Supplementary Figure 5e), this location was the pre-development shoreline on a subaerially exposed salt marsh or tidal flat.
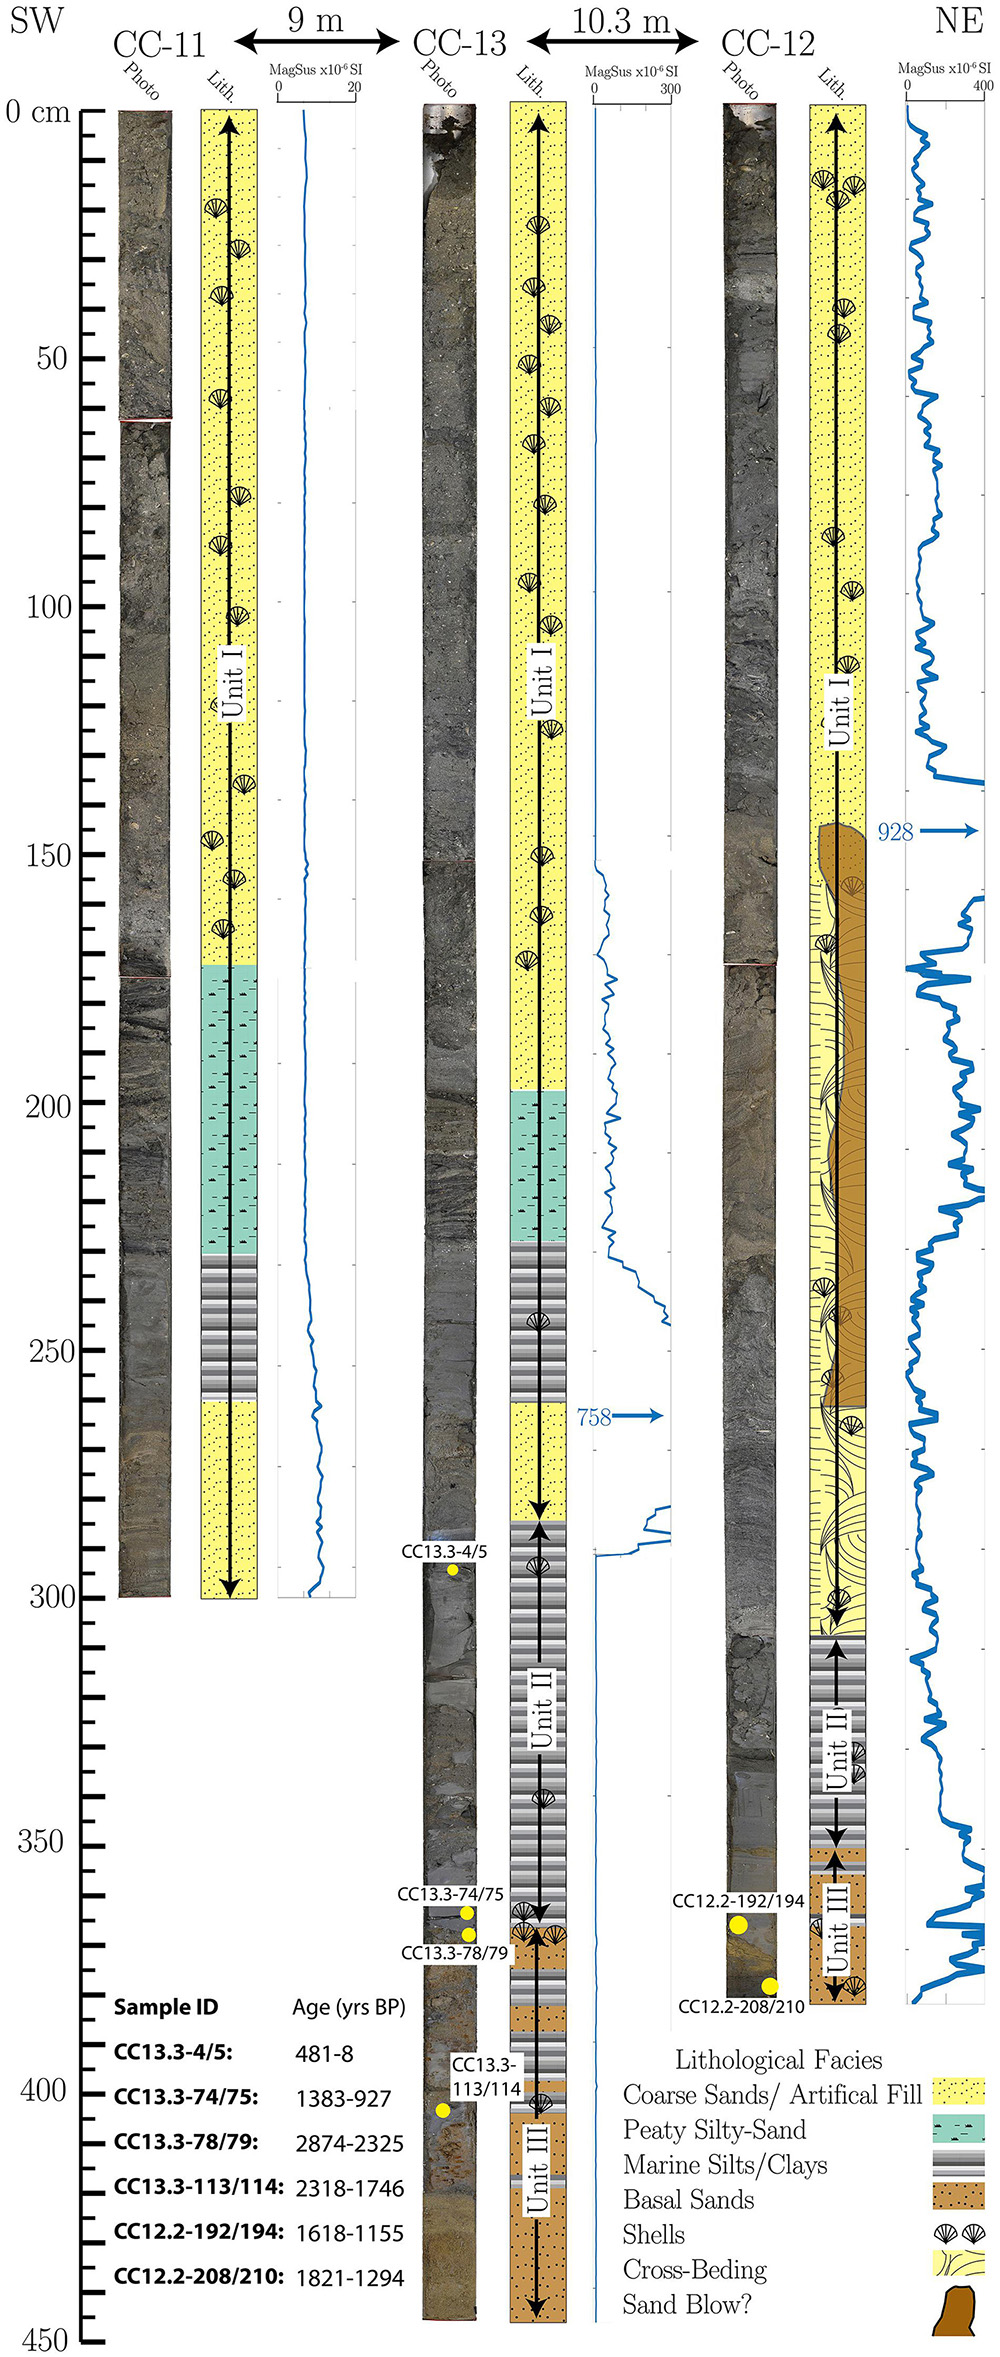
Figure 12. Crown Cove cores. Shown is core photographs, a simplified lithology, and magnetic susceptibility (max value indicated when beyond scale). Yellow dots are sample locations for radiocarbon dating (yrs BP, years Before Present and is expressed as years before 1950 CE). Transition from post 1940s dredge surface and natural estuarine/marine deposit can be seen in cores CC-13 (∼285 cm) and CC-12 (∼305 cm) and mark the beginning of unit two. Oxidized sands (unit three) interpreted to represent subaerial exposure is observed at the bottom of cores CC-12 and CC-13. Location of cores is shown in Supplementary Figure 5a.
The lithology of the cores consists of three main units (Figure 12). The upper ∼3 m of the cores (unit one) is composed of medium- to fine-grained clastic sands with abundant broken shell fragments. The lower portions of this upper unit varies between cores, with CC11 and CC13 exhibiting peaty-sand deposits overlying a silty-sand section and core CC12 exhibiting cross-bedding of medium- to fine-sands. The cross-bedding is interrupted at ∼140 cm depth by a ∼1 m thick section of chaotic sands that lack internal bedding and appear to deflect individual foreset beds vertically towards the top of the core (Figure 12). At a depth of ∼285 cm in CC13 and ∼308 cm in CC12, a sharp contact separates the coarser sands above from clayey-silts below, forming the second unit. The clayey-silts are generally dark-grey to very-dark-grey with scattered medium- to fine-sand stringers and shells, both fragmented and whole. The lowest portion of the cores consists of alternating medium-coarse sand and dark-grey silt deposits that give way to oxidized coarse sand as seen in cores CC13 and CC12, at a depth of 365 cm and 350 cm, respectively (Figure 12). The contact between the oxidized basal sands and marine silts is sharp and forms the beginning of the third unit. Datable material collected throughout the bottom two units gives an approximate age of ∼1.3 ka before present (BP) for the age of this lithology change (transition from the second to third unit) (Figure 12, Supplementary Figure 6).
In the Chirp data (Figure 10), a medium- to high-amplitude reflection surface is seen diverging from the pop-up structure at the depth corresponding to this change in lithology from basal sand to dark-grey clayey-silts (i.e., contact between units two and three). This surface is separated from the deeper high-amplitude, irregular reflection that is spatially extensive in the southern bay by a transparent homogenous package infilling the accommodation space that was potentially created by movement on the pop-up structure faults. To the east of the cores, the medium- to high-amplitude reflection that corresponds to the lithology change observed in the cores appears to merge with the high-amplitude irregular reflection surface as part of the pop-up structure, and may then diverge again to the east (Figure 10).
Line SSB05 (Figure 11) runs north-south perpendicular to SSB02 (Figure 10) and images the western strand of the pop-up structure faults. SSB05 also images a small portion of the undredged San Diego Bay and shows a mostly homogenous sediment package overlying the high-amplitude irregular reflection surface. The western strand of the pop-up structure displaces sediment that may correspond to the basal lithology changed observed in the Crown Cove cores (Figure 12), which would indicate movement in the past ∼1,300 years.
Structural Analysis
Traditional conceptual models for pull-apart basins cannot fully explain the deformation patterns and fault geometry we observe in the San Diego Bay pull-apart basin (Figure 13). A Rose Canyon-Descanso fault pull-apart basin model can predict the orientation of faults in the northwestern portion of the basin (the Spanish Bight, Coronado, and Silver Strand faults; Figure 2), whose strikes are oriented at ∼30–40° to the master strike-slip faults. However, the northwest trending faults in the southeastern portion of the bay, as well as the La Nacion fault, are oriented at a low angle to the Rose Canyon fault (Supplementary Table 2 and Figure 13), conflicting with a classical pull-apart basin model and suggesting the possibility for additional influences from other regional faults. Therefore, toward developing a more accurate model for the San Diego Bay pull-apart basin, we conduct a kinematic analysis using the regional fault orientations and plate boundary conditions to explain the observed faulting in terms of two end member models, simple shear dominated and pure shear dominated transtension.
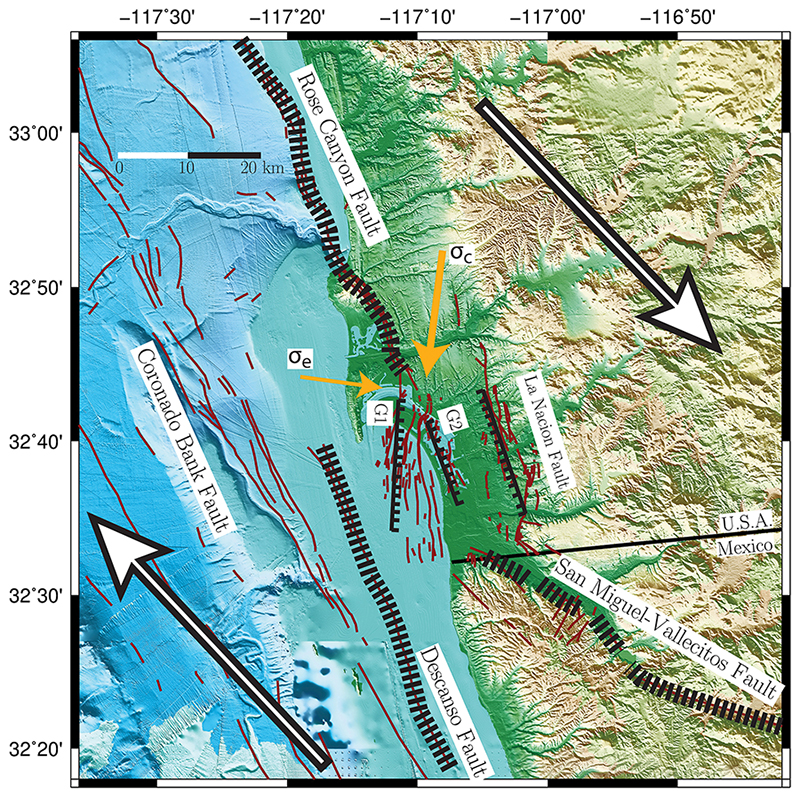
Figure 13. Regional fault orientations and plate boundary parameters used for kinematic analysis and interpretation. Solid orange arrows are maximum and minimum horizontal stress orientations, σc and σe, respectively (Hardebeck and Hauksson, 2001), large black and white outlined arrows are plate motion vectors, and the average orientations for Group-1, Group-2, and La Nacion fault zones are solid black, toothed lines. Large black hatched lines are regional faults. G1, Group 1; G2, Group 2. Background fault traces (thin red lines) are from USGS Quaternary fault database (USGS, 2019). Background topography and bathymetry are from the National Centers for Environmental Information Southern California Coastal Relief Model (v2) (Calsbeek et al., 2013). Figure created using Generic Mapping Tools (Wessel et al., 2019).
The north-northeasterly trending oblique faults in the northwestern half of the San Diego Bay pull-apart basin (hereafter referred to as Group-1 faults; Figure 13) have three primary splays: the Spanish Bight, Coronado, and Silver Strand faults (Figures 1, 2) (Kennedy and Welday, 1980; Kennedy and Clarke, 1999). Group-1 faults have an average strike of N1.5°E (Supplementary Table 2). The north-northwesterly trending faults in the southeastern part of San Diego Bay (including Fault D1 and SB1 and hereafter referred to as Group-2 faults; Figure 13) have an average strike of N22.7°W. Faults in the La Nacion Fault zone have an average strike of N8.7°W (Supplementary Table 2).
Supplementary Table 2 provides the average surface trends represented in Figure 13. We assume that observed surficial faulting of the principal displacement zones (i.e., the Rose Canyon, the Descanso, and the San Miguel-Vallecitos faults) is representative of faulting in the basement. The maximum horizontal compressional stress orientation, σc, is assigned N7°E (Hardebeck and Hauksson, 1999, 2001) and the maximum horizontal extension direction, σe, is assumed to be 90° to σc (Figure 13).
The Group-1 trend is nearly parallel to σc, perpendicular to σe, and is oriented ∼40° to the average trend of the Rose Canyon and Descanso faults. This geometry is well described by both analog and numerical models of pull-apart basins (e.g., Dooley and McClay, 1997; Dooley and Schreurs, 2012; van Wijk et al., 2017). Testing our observations with kinematic models yields a similar result. Following the method of Teyssier et al. (1995), we assign α to be the angle between the plate margin and plate motion vector (N43°W), and θ to be the angle between the direction of maximum instantaneous horizontal extension (assumed to be coaxial with σe) and the plate margin. Assuming that the average trend of the Rose Canyon–Descanso fault (∼N26°W) acts as the plate margin boundary for the San Diego Bay pull-apart basin, we find that α = 17° and θ = 57°. These values are in close agreement to the predicted value of 54° for θ, using θ = 1/2(α + 90) (Tikoff and Teyssier, 1994). Furthermore, these values for α and θ also indicate that the proposed Rose Canyon-Descanso basin would be simple shear dominated, with ∼80% of the deformation between the Rose Canyon fault and the Descanso fault being accommodated through normal faulting (from Figure 3 of Teyssier et al., 1995). Figure 14B represents our conceptual model to explain the orientation of Group-1 faults in terms of a Rose Canyon-Descanso fault connection.
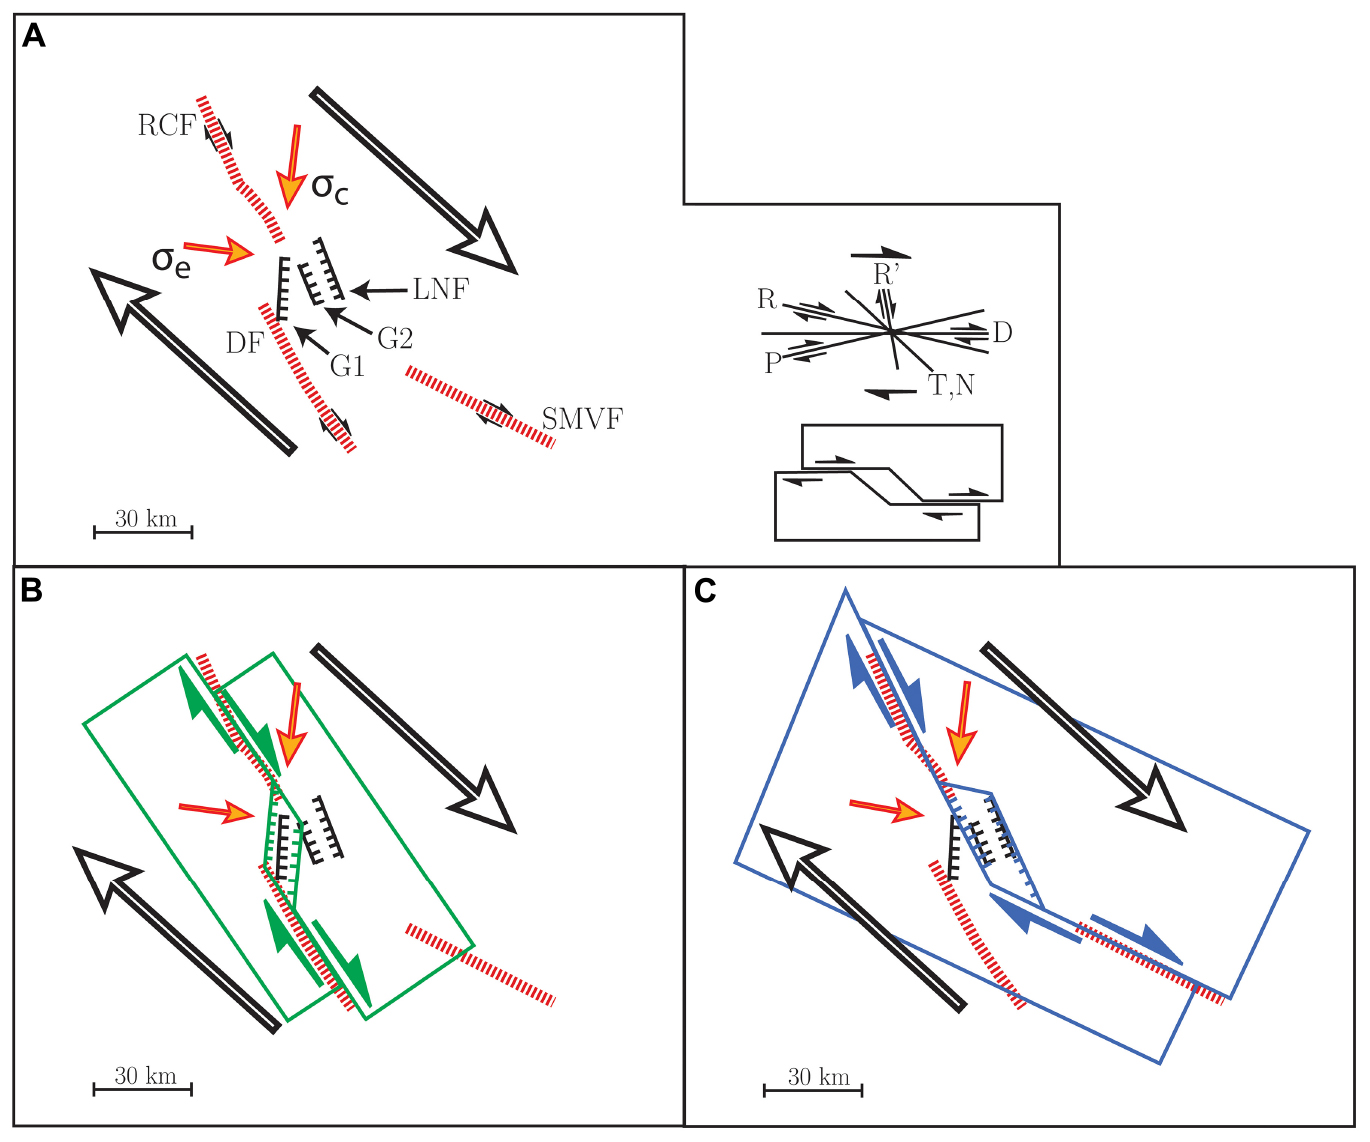
Figure 14. Conceptual model for San Diego Bay pull-apart basin. (A) Model parameters, see Figure 13 for explanation. (B) Conceptual model for Group-1 faults in a Rose Canyon-Descanso fault stepover. (C) Conceptual Model for Group-2 and La Nacion faults in a Rose Canyon-San Miguel-Vallecitos fault stepover. RCF, Rose Canyon fault; DF, Descanso fault; SMV, San Miguel-Vallecitos fault; G1, Group 1; G2, Group 2; LNF, La Nacion fault zone.
Although no definitive evidence for a connection between the Rose Canyon fault and San Miguel-Vallecitos fault has been published, it’s possible that based on strike orientations, that the structure of the Group-2 and La Nacion faults are partially controlled by the San Miguel-Vallecitos fault, with its northernmost segment, the Vallecitos fault, mapped ∼30 km southeast of San Diego Bay. The Group-2 and La Nacion fault zones are oriented at 27° and 41°degrees to the San Miguel-Vallecitos fault, which trends ∼N50°W. If we assume dextral motion along a Rose Canyon–San Miguel-Vallecitos system, rather than the Rose Canyon–Descanso system, provides plate boundary conditions for Group-2 faults, we can apply the same ideas to test for kinematic relationships. This geometry yields values of α = 5°and θ = 45°, which are in close agreement with the predicted value of θ = 50° (Tikoff and Teyssier, 1994). This geometry would imply that the eastern San Diego pull-apart basin would be strongly simple shear dominated with 0% strike-slip partitioning (from Figure 3 of Teyssier et al., 1995).
However, the oblique angle of Group-2 faults and the La Nacion fault system to the maximum compressional stress σc (Figure 13) may be an indication that the maximum horizontal extensional stress direction, σe, is not the best representation of the minimum instantaneous shortening direction for the eastern portion of the San Diego Bay pull-apart basin (Figure 13). Alternatively, if we assume that the minimum instantaneous shortening direction is oriented perpendicular to the average trend of Group-2 faults, we determine a value of α = 5°and θ = 75°, which would indicate a strongly simple shear dominated basin but with 90% strike-slip partitioning (from Figure 3 of Teyssier et al., 1995). Assuming that the minimum instantaneous shortening direction is perpendicular to the average trend of the La Nacion fault zone, we find that α = 5°and θ = 61°, again indicating a strongly simple-shear component to deformation but with slightly less strike-slip partitioning at 80% (from Figure 3 of Teyssier et al., 1995). Either way, the observed geometry in Figure 13 and the kinematic analysis suggests that Group-2 faults are experiencing simple-shear transtension influenced by the San Miguel-Vallecitos fault system. The difference between Group-2 and La Nacion trends may be attributed to a mid-basin transition zone, where the western margin of Group-2 is influenced by the Rose Canyon-Descanso stepover, but the La Nacion fault zone is oriented optimally if a stepover exists between the San Miguel-Vallecitos fault and Rose Canyon faults (Figure 14C).
Discussion
Subsurface Architecture, Fault Linkage, and Stratigraphic Controls Beneath San Diego Bay
To begin a discussion on the subsurface architecture and fault structure beneath San Diego Bay we first interpret the mapped horizons presented in the seismic reflection data. Based on the observation that the high-amplitude reflections in the Chirp data correspond to the depth of a dated marine terrace (Figure 3; Kennedy and Clarke, 1999), we interpret the five high-amplitude horizons mapped in the MCS data (Figures 3, 4, 6, Supplementary Figures 1, 3) to also represent periods of sea-level stability. The medium amplitude homogenous units between the five mapped horizons are interpreted to represent periods of sea-level fluctuations and dynamic depositional environments (Figures 3, 4, 6, Supplementary Figures 1, 3). In the Chirp profiles collected in the southern portions of the bay (Figures 6, 8, 10, 11, and Supplementary Figure 2) the spatially extensive, high-amplitude, irregular reflection surface is interpreted to represent the subaerially exposed surface generated during the most recent sea-level low-stand based on its acoustic characteristics and its position directly below a homogeneous sediment package in the undredged portion of the bay (Figure 11).
As shown in the gridded horizon surface (Figure 5) and MCS profiles (Figures 3, 4, 6, Supplementary Figures 1, 3), Faults D1 and SB1 exert a major influence on the stratigraphic character of southeastern San Diego Bay. Together with the faults of Group-1 (Figure 13), the collective east side down displacement results in the distribution of localized depositional centers throughout San Diego Bay and may therefore be manifestations of sidewall faults that are observed in analog models of pull-apart basins (Figure 5; Dooley and McClay, 1997; Rahe et al., 1998; Dooley and Schreurs, 2012). The two groups of faults would represent sidewall faults for two separate pull-apart basins (Figures 14B,C), with Group-1 faults representing the western boundary of a western basin, and Group-2 faults representing the western boundary of an eastern basin, with a transition zone separating the two fault groups.
The spatial pattern of subsidence observed in the gridded surface for horizon 5 in the southeastern portion of San Diego Bay suggests that the potential sidewall faults (Faults D1 and SB1) may be playing a more significant role than simply accommodating localized subsidence and deposition. As mentioned previously, the localized westerly oriented area of subsidence in the south-central portion of San Diego Bay lies between D1 and SB1 and corresponds to a decrease in the apparent displacement on both faults (Figures 4–6 and Supplementary Figures 1, 3). Fault SB1 accommodates a larger amount of apparent displacement southward (compared to its northern segment), while Fault D1 accommodates greater displacement northward (again compared to its southern segment) (Figure 5). A possible explanation for the apparent change in displacement gradients is that the faults located in the westerly localized area of subsidence represent a relay structure that is connecting these two potential sidewall faults (Figures 4, 5; Dooley and McClay, 1997; Fossen and Rotevatn, 2016). Relay structures typically form in areas of overlap between two closely spaced normal faults (Fossen and Rotevatn, 2016).
The relay faults would act to transfer displacement from Fault D1 to Fault SB1, effectively placing the fault tips of SB1 and D1 in a stress shadow and shutting down displacement on the fault sections between the relay structure and the fault tip (Fossen and Rotevatn, 2016). The presence of relay faults linking these two sidewall faults could imply that the western pull-apart basin may have experienced enough slip to begin developing a through-going linking fault between the master strike-slip sections (Wu et al., 2009). Such through-going faults are common features in models of pull-apart basins (e.g., Dooley and McClay, 1997; Rahe et al., 1998; Wu et al., 2009; Dooley and Schreurs, 2012; van Wijk et al., 2017). The subsidence associated with the relay faults is a potential indication that the relay structure has been breached and a linked sidewall fault has developed (Dooley and McClay, 1997; Fossen and Rotevatn, 2016). However, the variable spatial distribution of the MCS lines does not allow for complete mapping of the relay structure, so the full extent of the connection is uncertain.
If the short discontinuous segments in the southern extreme of San Diego Bay that are similarly oriented to SB1 are in fact one continuous fault system (Figure 2), then the linked D1-SB1 fault system would extend ∼9 km and be oriented sub-parallel to the long axis of the bay. The linked D1-SB1 fault system would then be favorably oriented with the gravity anomalies and the interpreted crystalline basement that underlies the San Diego pull-apart basin (Figure 15C) (Marshall, 1989; Elliott, 1970). Additionally, the deepest portion of the basin is located beneath south San Diego Bay and coincides with the approximate area where SB1 begins to accommodate increased subsidence (Figures 6, 15C; Marshall, 1989). The similar orientation between the potential linked sidewall basin fault (D1-relay-SB1 structure) and the gravity anomalies/crystalline basement suggests a connection between potential basement faults and Faults D1-SB1.
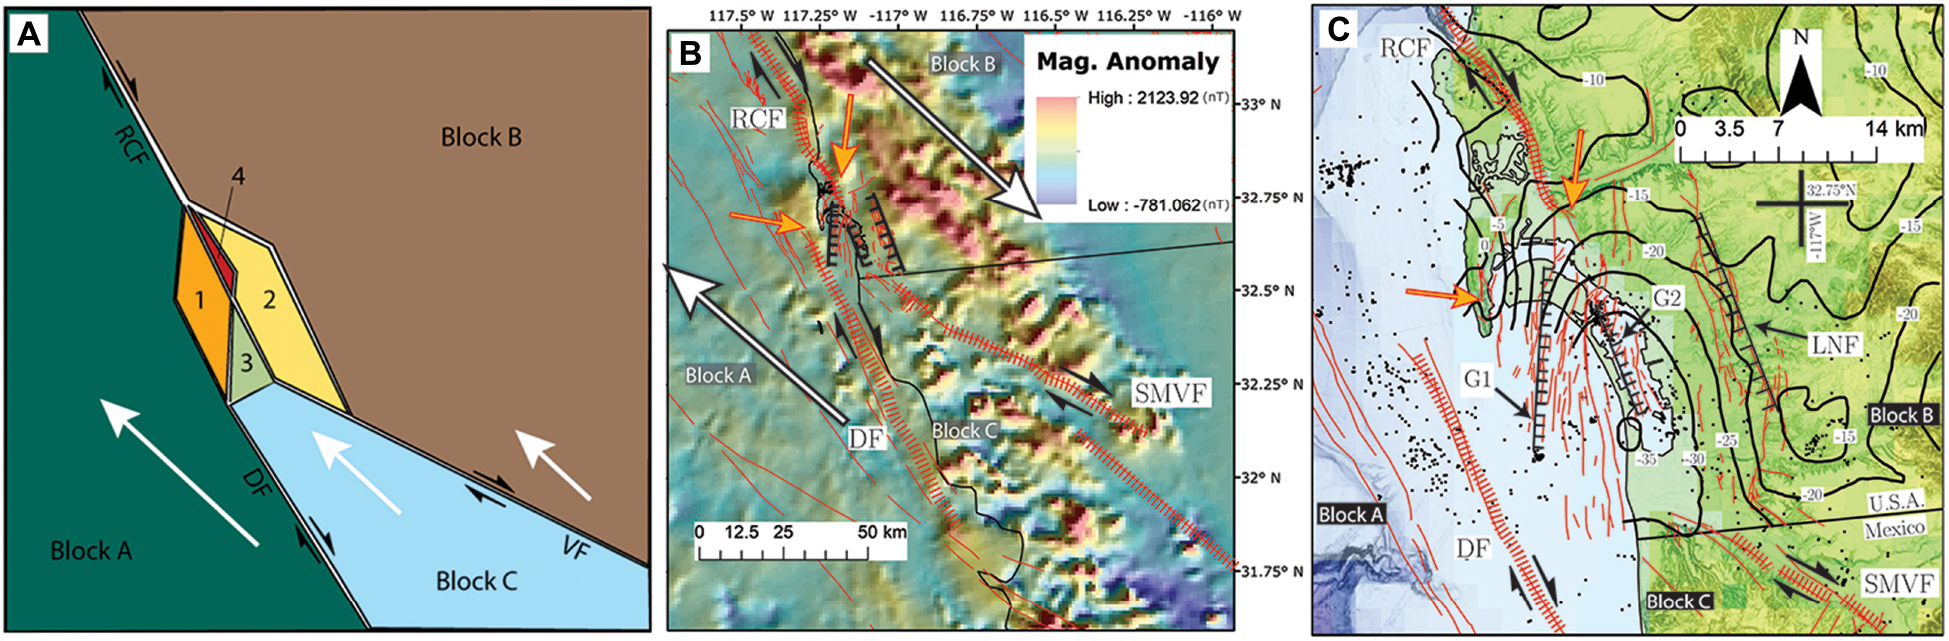
Figure 15. (A) Conceptual kinematic block model for the San Diego region. See section “DISCUSSION” for full model explanation. Block A, B, and C are separated by master strike-slip segments (RCF, DF, and VF) with a region of complex faulting located at their intersection beneath San Diego Bay. (B) Magnetic anomaly data of North America (Bankey et al., 2002). Master strike-slip faults in conceptual block model, particularly the San Miguel-Vallecitos fault, appear to correlate with regional low magnetic anomalies in the otherwise continuous magnetic high associated with the Peninsular Range Batholith. This may be an indication that these faults follow pre-existing weaknesses or delineate terrane boundaries that are responding to the regional strain field. (C) Map of San Diego Bay showing gravity contours from Marshall (1989). Gravity contours (solid black lines) are in mGal and show a potential gravity low in south San Diego Bay. Fault traces (thin red lines) are from USGS (2019) north of the United States-Mexico border and Fletcher et al. (2014) south of the border. Master strike-slip segments are RCF, Rose Canyon fault, DF, Descanso fault, VF, Vallecitos fault, SMVF, San Miguel-Vallecitos fault. Background topography and bathymeter are from ESRI topography and the National Centers for Environmental Information Southern California Coastal Relief Model (v2) (Calsbeek et al., 2013).
In addition to the development of linked sidewall faults, the spatial distribution of faults and the sense of displacement in San Diego Bay are also consistent with analog and numerical models of pull-apart basins. In the northern portion of the bay, the Spanish Bight and Coronado faults are located near the northern termination of the potential Rose Canyon-Descanso fault pull-apart basin (Figures 1, 2). High-resolution Chirp data image stratal-collapse into the fault zone and rotated wedges associated with both faults in the upper ∼50 m of bay sediments (Maloney, 2013). These types of sedimentary structures are typically associated with areas of localized transtension and the development of negative flower structures in strike-slip environments (Yeats et al., 1997). Offshore of the Coronado Peninsula, combined Chirp and MCS data image predominately dip slip displacement for the Group-1 faults (Maloney, 2013). Both observations are consistent with analog models of pull-apart basins that predict the formation of negative flower structures and nested grabens close to the principal displacement zones, and increasing dip-slip motion towards the center of the pull-apart basin (e.g., Dooley and McClay, 1997; Rahe et al., 1998; Dooley and Schreurs, 2012).
The Group-2 faults located in the southeastern portion of San Diego Bay exhibit a similar characteristic with normal, down-to-the-east displacement observed to decrease on Fault D1 towards downtown San Diego (Figure 5), as well as a consolidation of adjacent fault strands to form a localized nested graben structure with the Silver Strand and downtown graben faults near the northern edge of the interpreted eastern pull-apart basin (Figure 3; Kennedy and Clarke, 1996). Towards the center of the proposed eastern pull-apart basin, increased dip-slip motion is observed on D1 as well as an increase in the number of adjacent strands (Figure 4). Both observations are consistent with analog models of pull-apart basins (Dooley and Schreurs, 2012). However, south of the potential relay structures, Fault SB1 deviates from the analog models. As observed in the southernmost seismic profiles (Figure 6 and Supplementary Figure 3), the stratigraphy west of Fault SB1 changes from gently westward dipping north of the relay structures to flat-lying and then gently eastward dipping toward the south. This stratal collapse into the main strand of SB1 and the formation of a negative flower structure observed in Figure 6 suggests that this region of the eastern San Diego Bay pull-apart basin may be experiencing an increased strike-slip component of deformation. The presence of the localized pop-up structure ∼500 m west of SB1 (Figure 10) provides additional evidence of an increased strike-slip component in this region of San Diego Bay. The location of such a structure (characteristic of transpression) in the middle of a pull-apart basin is interesting but may result from a local change in fault strike or the formation of a cross-basin fault, which frequently exhibits localized transpression in analog pull-apart basins models (Dooley and McClay, 1997; Rahe et al., 1998; Dooley and Schreurs, 2012). Alternatively, the localized pop-up may be the result of a reversed polarity structure from unidirectional rupture on the master strike-slip segments (Ben-Zion et al., 2012).
The diversion of Chollas Creek southward by Fault D1 and the paleochannel’s western bank alignment with the fault’s potential paleoscarp (Supplementary Figure 2 and Figure 7) may be evidence for D1’s activity during the Last Glacial Maximum (LGM) when Chollas Creek would have been draining through the subaerially exposed San Diego Bay. Offshore San Diego Bay, recent work has mapped several paleochannels interpreted to be formed during MIS stage 2 that extend away from San Diego Bay and the Point Loma peninsula (Graves, 2017). The location of the interpreted extension of the Sweetwater paleochannel offshore matches very well with the location of interpreted breaching of the Silver Strand tombolo by the combined Sweetwater-Chollas Creek paleochannel imaged within the bay (Figure 7; Graves, 2017).
In the Crown Cove area, the upper ∼3 m of sediment (unit 1) observed in the vibracores (Figure 12) is interpreted to be related to the post-dredge sand spit build out and deposition based on sediment characteristics and modern radiocarbon dates (Supplementary Table 1 and Supplementary Figure 6). In the lower portions of this artificial section in core CC12, the chaotic package of sand that deflects the observed cross-bedding is interpreted to be a potential sand blow or liquefaction feature (Figure 12). The sharp contact between units one and two is interpreted as the dredge surface separating artificial fill above from natural sedimentation below, which is interpreted as marine or estuarine in origin (Figure 12). The oxidized sands of unit three are interpreted to represent the subaerial exposure surface of the last sea-level low-stand. The contact between the basal sands (unit three) and marine silts (unit two) is sharp and is interpreted to represent the most recent sea-level transgression (Figure 12). Radiocarbon samples collected above and below this contact therefore indicate that the bay side shoreline of the Silver Strand tombolo was likely inundated around ∼1.3 ka BP (Supplementary Figure 6).
Conceptual Model for the San Diego Bay Pull-Apart Basin
Since the 1970s, considerable work has focused on understanding the nature of pull-apart basins and regions experiencing transtensional deformation. Three different approaches are typically used to model 3-dimensional deformation and slip patterns in relation to fault geometry and structural development: (1) Analog models involving laboratory experiments using clay and sand as proxies to crustal materials (Dooley and McClay, 1997; Rahe et al., 1998; Wu et al., 2009), (2) kinematic models based on static stress and strain conditions, plate motion boundary conditions, and assumed material properties (Sanderson and Marchini, 1984; Fossen and Tikoff, 1993; Tikoff and Teyssier, 1994; Teyssier et al., 1995), and (3) numerical models grounded in continuum mechanics and conservation laws focused on temporal changes in a system by use of finite element simulations (Rogers, 1980; Gölke et al., 1994; Ye et al., 2015; van Wijk et al., 2017). With conventional pull-apart basin models unable to explain the various strike and dip orientations of the Group-1, Group-2, and La Nacion faults, we provide a new structural interpretation for the San Diego Bay pull-apart basin and compare it to results from these three types of models.
Based on the extensive down-to-the-east fault motion in San Diego Bay, it appears that the right-step between the Rose Canyon and Descanso faults dominates the overall basin architecture. As discussed previously, the ∼40° strike orientation between the linking Group-1 faults and the master strike-slip segments (the Rose Canyon and Descanso faults) is consistent with most classical descriptions of pull-apart basins and with all three model approaches discussed above (Figure 14B; Mann et al., 1983; Burchfiel et al., 1987; Mann, 2007). Both analog and dynamic models, show sidewall faults at a ∼35–40° angle to non-overlapping principal displacement zones (representative of the Rose Canyon–Descanso system), and the formation of a single basin (Rogers, 1980; Gölke et al., 1994; Rahe et al., 1998; van Wijk et al., 2017). The results of the kinematic analysis suggest that wrench-dominated transtension (simple shear) with minimal strike-slip partitioning is expected between a Rose Canyon-Descanso system. Since the basin faults are kinematically linked to the master strike-slip faults, this result is expected and supported by observations of progressively increasing dip-slip towards the center of the western pull-apart basin, with minor amounts of potential strike-slip deformation observed near the edge of the stepover on the Spanish Bight and Coronado Bank faults. Figure 14B illustrates our conceptual model for Group-1 faults.
Based on the more favorable geometry of the San Miguel-Vallecitos system, the fault system appears to be responsible for the different orientation of Group-2 faults, the La Nacion fault zone as well as the uplifted, faulted region in northwest Tijuana, Mexico (Figures 13, 14C). Based on the near parallel alignment between Group-2 faults and a potential Rose Canyon–Descanso pull-apart (Figures 14A,B), analog, kinematic, and numerical models of pull-apart basin development would predict strike-slip dominated motion along Group-2 faults and would imply that they are simply a southern extension of the Rose Canyon fault. However, most evidence shows normal-dominated deformation in the opposite sense, (i.e., down-to-the-east) away from the center of the Rose Canyon-Descanso pull-apart basin (Figures 4, 6, and Supplementary Figures 1, 3). In addition, the presence of the La Nacion fault system, located 5–10 km outside the master strike-slip fault sections, is difficult to explain with a Rose Canyon-Descanso fault stepover model (Figure 14B). Therefore, we propose that the faults in the eastern portion of the basin are controlled/influenced by a Rose Canyon-San Miguel-Vallecitos connection (Figure 14C). The more favorable orientation of Group-2, and especially the La Nacion faults, to a potential Rose Canyon-San Miguel-Vallecitos pull-apart model (∼27° and ∼41°, respectively) provide some evidence that such a model is valid (Figure 14C). However, the results of the kinematic analysis suggest that the deformation between the principal displacement zones in such a model should exhibit a strong degree of strike-slip partitioning, which contrasts with the normal-dominated displacement observed in the proposed eastern basin. Interestingly, several indicators of increased strike-slip deformation are observed in the southernmost seismic data (i.e., negative flower structure above SB1 and the auxiliary pop-up structure, see Figures 6, 10), which may be an indication of increasing strike-slip deformation.
Translation and rotation of crustal blocks has been invoked to explain the tectonic evolution of the ICB (e.g., Nicholson et al., 1994), therefore we conceptually describe the kinematics of the San Diego region as an interaction between three brittle, upper crustal blocks. In Figure 15A, consider block B as a reference block, with blocks A and C both moving northwest at different rates, but with nearly identical azimuths. Boundaries between blocks are defined by major faults; the Rose Canyon fault (block A and B boundary), the Descanso fault (block A and C boundary), and the San Miguel-Vallecitos fault (block C and B boundary).
The structural elements and major faults of our conceptual model may be explained as inherited features from previous stages in the evolution of the ICB and Peninsular Range batholiths. The mapping of magnetic anomalies by the North American Magnetic Anomaly Group shows a magnetic high that extends relatively unbroken for 1200 km along the coast of southwestern North America, from northern San Diego County to the tip of the Baja Peninsula (Bankey et al., 2002; Langenheim and Jachens, 2003). It is notable that along the entire Baja Peninsula, the only area with significant reductions in this extensive magnetic high is between the United States-Mexico Border and the Agua Blanca fault, an area that also coincides with the San Miguel-Vallecitos fault (Figure 15B; Langenheim and Jachens, 2003). Langenheim and Jachens (2003) determined a maximum right-lateral offset of ∼50 km from misaligned magnetic potential highs across this region, approximately half of which (∼23 km) can be assigned to the Agua Blanca fault. Detailed geologic mapping further suggests that the region surrounding the Agua Blanca fault may have initially developed as a suture joining the Alisitos arc segment to the North American continent in the Cretaceous (Wetmore et al., 2002). The misaligned magnetic anomalies and variations in along strike character of batholiths in the Peninsular Ranges point towards the region occupied by the transpeninsular faults (i.e., the Agua Blanca and San Miguel-Vallecitos), potentially developing above pre-existing crustal weaknesses that represent a more mechanically favorable path in response to regional strains. Similar arguments have been invoked to explain fault development in general as well as other areas of the Big Bend Domain (Langenheim et al., 2004, Cooke et al., 2013; Walton et al., 2020b).
In our conceptual model, the orientation of the boundary faults relative to block motion vectors can explain the various structural domains in and around the San Diego Basin. Regions 1-4 in Figure 15A are distinct deformation zones corresponding to Group-1 faults (1), Group-2 faults (2), the Los Buenos fault zone (3) and the transition zone between Group-1 and Group-2 faults (4).
Regions 1 and 2 are described by the corresponding pull-apart basin models (Figures 14B,C), with some complex overprinting occurring at the boundary and in region 4. As first noted by Kennedy and Clarke (1996), “fault D1 is a major fault in San Diego Bay that separates the northwest trending faults of southern San Diego Bay from the more northerly trending faults in the northern part of the bay.” Therefore, the transition between Group-1 and Group-2 is likely to exist between the D1 and Silver Strand faults and may be located directly beneath the current Silver Strand tombolo (Figure 2). Region 4 likely experiences competing hanging wall subsidence associated with Group-1 faults overprinting footwall effects of Group-2, or vice versa. Alternatively, the northeast striking pop-up structure located in Crown Cove (Figures 2, 10, 11) is collocated with seismicity whose focal mechanisms indicate a sinistral northeast striking fault plane, suggesting that the Crown Cove pop-up structures could be the result of block rotation within the San Diego Bay pull-apart basin similar to other pull-apart basin in California (Magistrale, 1993; Brothers et al., 2009). The uplift of region 3, based on elevation differences between Pleistocene terrace deposits (Ellis and Lee, 1919) can be described by relative footwall uplift across a broad zone of down-to-the-east normal faults. This creates a heterogeneous strain field responsible for the complex deformation in northwestern Tijuana, where transtensional deformation from the San Diego basin is overprinting regional scale (and likely older) transpressional deformation (Minch, 1967).
We put forward this conceptual block model to provide a first-order starting point to begin resolving questions about the San Diego pull-apart basin. San Diego Bay appears to occupy a complex region of subsidence overlying two competing pull-apart basins. However, our conceptual model does not address several observations and features related to the San Diego Bay pull-apart basin. For example, no clear connection between the La Nacion fault system and the Rose Canyon fault has been identified, as our model predicts would exist. Additionally, no conclusive evidence for recent movement on the La Nacion fault has been published despite its apparent structural relationship to the San Diego Bay pull-apart basin. The apparent asymmetry of the San Diego Bay pull-apart basin with both Group-1 and Group-2 faults appearing to collapse into the La Nacion fault (or an unmapped eastern strand of the Rose Canyon fault) with prevalent down-to-the-east sense of fault displacement, is not addressed by our model.
While the model presented above accounts for the observed faulting in San Diego Bay, there may be alternative mechanisms that can explain the observed fault strikes and sense of displacement. A potential mechanism may be a localized stress rotation, which is invoked to explain the misorientation of fault segments and principal stress direction along other fault systems (Morley, 2010; Williams et al., 2019). For example, in the Malawi rift, East Africa, fault segments that should be experiencing a component of oblique extension instead exhibit pure extension (Morley, 2010), which is explained as a localized stress rotation that follows pre-existing weaknesses in the basement fabric (Morley, 2010). If, at the latitude of San Diego Bay, the Newport-Inglewood-Rose Canyon fault continues to represent the boundary between the metasedimentary complexes of the ICB and the granitic batholiths of the Peninsular Range (Figure 1; Bohannon and Geist, 1998), then the oblique angle between the regional minimum compression stress and the strike of Group-2 faults (Figure 13) may be a reflection of localized stress rotation from different basement fabrics. However, it should be noted that observed potential stress rotations appear to be consistent across wide (∼40 km) areas (e.g., Morley, 2010; Williams et al., 2019), whereas in San Diego Bay fault strike orientations change between group-1 and group-2 over an area less than 2 km.
Alternatively, the overall geometry of the Rose Canyon-Descanso-San Miguel-Vallecitos fault junction closely resemble the dextral freeway fault triple junction of Platt and Passchier (2016). In such a situation two separate fault segments with the same sense of motion meet to form a third segment (so that the overall geometry resembles an upside-down Y) (Passchier and Platt, 2017). Such a configuration is stable in nature and can accommodate a significant amount of slip (Passchier and Platt, 2017). Unfortunately, no features have been observed that are oriented obliquely to the fault strikes in San Diego Bay to act as slip records to confirm the kinematics characteristic of a dextral freeway.
Recency of Faulting and Seismic Hazard
The Pleistocene marine terraces and sea-level low-stand subaerial surface observed in the seismic data can be used for subsidence and slip rate estimates in San Diego Bay. The displaced high-amplitude reflector observed in Chirp data adjacent to the Coronado Bridge (inset of Figure 3) likely corresponds to the MIS stage 5e Nestor Terrace as indicated by amino acid stratigraphy and paleontological analysis (Kennedy and Clarke, 1999). The Nestor Terrace is located at an elevation of 22–23 m at Point Loma and dates to ∼120 ka (Muhs et al., 1988, 1994; Kern and Rockwell, 1992). Using an approximate average elevation of -18 m for the Nestor Terrace adjacent to the Coronado Bridge and assuming that both locations are experiencing the same regional uplift rate of 0.06 mm/yr (Simms et al., 2020), an approximate subsidence rate for the central portion of San Diego Bay is 0.28 mm/yr. Using the apparent 4 m offset of the Nestor Terrace across the associated strand of Fault D1 yields an apparent vertical slip rate of ∼0.03 mm/yr for that auxiliary strand. Alternatively, the high amplitude reflector interpreted to represent the Nestor Terrace may have been overprinted with the MIS stage 5a Bird Rock Terrace (∼80 ka), as has been observed in other locations around San Diego (Kern and Rockwell, 1992). Using a 9-11 m elevation for the Bird Rock Terrace on Point Loma yields an estimated subsidence rate of 0.29 mm/yr for the central portion of San Diego Bay.
In the Crown Cove area, the interpreted sea-level low-stand subaerial surface is offset ∼5.7 m as a result of movement on the localized pop-up structure (Figures 10, 11). We assume an age of 20–15 ka for a stable sea level low-stand in Southern California responsible for the apparent erosional surface (Reynolds and Simms, 2015). Therefore, the faults associated with the pop-up structure have an apparent vertical slip rate of 0.3–0.4 mm/yr. The potential offset of the interpreted latest transgressive surface observed in the Chirp data (Figure 11) from the Crown Cove area suggests that the pop-up structure faults are Holocene active and may have ruptured in the past ∼1300 years. Focal mechanisms from an earthquake swarm beneath Crown Cove in the 1980s are consistent with a NE-SW striking fault plane and could indicate that the Crown Cove faults, although apparently short in length, may be seismogenic (Figure 4 of Magistrale, 1993). The homogeneous character of the sediments above the interpreted sea level low-stand subaerial surface in the southern Chirp profiles does not allow for the determination of post-LGM movement on other faults in Group-2. However, several terminating reflectors directly above the mapped fault strands may be evidence for recent faulting (Figure 6).
Strike-slip fault stepovers have long been recognized as areas of potential earthquake nucleation and termination (e.g., Oglesby, 2005; Wesnousky, 2008; Brothers et al., 2011; Watt et al., 2016). Empirical data of historical earthquake surface ruptures indicate that stepover distances greater than ∼5 km typically act as barriers to through-going earthquake ruptures (Wesnousky, 2008). Therefore, a through-going rupture across the ∼10 km wide Rose Canyon–Descanso fault stepover is not expected but cannot be ruled out. The proposed Rose Canyon–San Miguel-Vallecitos stepover would be on the order of ∼3–4 km wide, a distance that historical ruptures have jumped. Additionally, the linkage of D1 and SB1 via relay faults may indicate the formation of a through-going cross basin fault, which would provide a fault structure for potential future earthquakes to continue through San Diego Bay. The smaller stepover distance and potential cross basin fault would allow for potentially longer earthquake ruptures, which in turn would result in larger magnitude earthquakes (Oglesby, 2005; Watt et al., 2016). However, without conclusive evidence of faulting south of San Diego Bay to connect the two larger strike-slip systems, a potential cross basin fault earthquake pathway remains speculative. Regardless, small earthquakes and static stress change within the San Diego pull-apart basin might act to trigger earthquakes on any of the three major faults (the Rose Canyon, Descanso, or San Miguel-Vallecitos faults) (Oglesby, 2005), as has potentially happened in the past in San Diego Bay (Singleton et al., 2019) and along other similar strike-slip faults of California (Watt et al., 2016). Additional studies into faulting south and east of San Diego Bay to better resolve regional fault connections would provide valuable information to improve the accuracy of future seismic hazard assessments.
Conclusion
The results of this study show the value of legacy multi-channel seismic (MCS) data to investigate fault structures in urban waterways where data collection may no longer be feasible. Additionally, the improved resolution from reprocessing the legacy MCS dataset allowed for the correlation of stratigraphy across San Diego Bay. When combined with the high-resolution Chirp profiles, the nested dataset allowed for a more comprehensive interpretation of stratigraphy and recency of faulting beneath San Diego Bay. The results of the gridded surface for horizon 5 show several localized depositional centers adjacent to the linking faults identified in San Diego Bay. These faults likely form a set of terraced sidewall faults, which are predicted by analog models of pull-apart basins. The relative amount, and sense of displacement observed on the faults in San Diego Bay in the nested seismic reflection dataset, is consistent with predicted results from pull-apart basin models. In the southeastern portion of San Diego Bay, the nested seismic reflection dataset image fault structures that connect previously mapped short discontinuous fault segments into longer fault structures. Based on this mapping we infer that the linked D1-SB1 fault system is a continuous fault network connected by relay faults. The D1-SB1 linked fault appears to control sedimentary deposition in the southern portion of San Diego Bay and is similarly oriented to gravity anomalies beneath the bay.
The San Diego Bay pull-apart basin can be divided into western and eastern basins based on the different orientation of two groups of faults (Group-1 and Group-2/La Nacion fault zone). Group-1 faults are located in the northwestern portion of San Diego Bay, are well described by classical pull-apart basin models, and support a Rose Canyon–Descanso fault pull-apart basin to explain the subsidence of San Diego Bay. The near parallel orientation of Group-2 and the La Nacion faults to the Rose Canyon fault are in contrast to this model and suggest an additional influence from other regional faults. A potential pull-apart basin between the Rose Canyon and the San Miguel-Vallecitos faults would explain the orientations of the Group-2 and La Nacion faults. Kinematic analysis of the Rose Canyon–San Miguel-Vallecitos pull-apart model predicts a significant component of strike-slip partitioning, which is not observed in the seismic profiles. However, on the southernmost profiles, several indicators of strike-slip motion suggest an increase in strike-slip deformation in the southern portion of the bay. The favorable orientation of the Group-2 and La Nacion faults, as well as the potential formation of a linked D1-SB1 fault, may be evidence for a Rose Canyon–San Miguel-Vallecitos fault connection, but further work is warranted.
Data Availability Statement
Reprocessed MCS survey data is available through Singleton et al. (2021). The high-resolution Chirp data are publicly available through the USGS National Archive of Marine Seismic Surveys (NAMSS; Triezenberg et al., 2016).
Author Contributions
DS, JM, DB, SK, and ND contributed to the data collecting and processing. All authors contributed to the analysis and manuscript editing.
Funding
This research was supported by the Southern California Earthquake Center (SCEC), award number 19107 and contribution number 10099. SCEC is funded by National Science Foundation Cooperative Agreement EAR1033462 and United States Geological Survey Cooperative Agreement G12AC20038. This research was also supported by the Shepard Foundation at Scripps Institution of Oceanography, University of California San Diego.
Disclaimer
Any use of trade, product, or firm names is for descriptive purposes only and does not imply endorsement by the United States Government.
Conflict of Interest
The authors declare that the research was conducted in the absence of any commercial or financial relationships that could be construed as a potential conflict of interest.
Acknowledgments
We would like to thank Jared Kluesner and Ray Siter for assistance locating and reprocessing the legacy MCS data. We also thank Michael Kennedy for his many helpful discussions over the years and his foundational work in understanding the geology of San Diego. We would also like to thank the SDSU and UCSD Earth Science graduate students for their assistance in the field. Part of the work present in this article have been modified from portions of DMS’s doctoral dissertation (Singleton, 2020).
Supplementary Material
The Supplementary Material for this article can be found online at: https://www.frontiersin.org/articles/10.3389/feart.2021.641346/full#supplementary-material
References
Anderson, J. G., Rockwell, T., and Agnew, D. C. (1989). Past and possible future earthquakes of significance to the San Diego region. Earthquake Spect. 5, 299–335. doi: 10.1193/1.1585524
Astiz, L., and Shearer, P. M. (2000). Earthquake locations in the inner Continental Borderland, offshore southern California. Bull. Seismol. Soc. Am. 90, 425–449. doi: 10.1785/0119990022
Bankey, V., Cuevas, A., Daniels, D., Finn, C. A., Hernandez, I., Hill, P., et al. (2002). Digital Data Grids for the Magnetic Anomaly Map of North America (No. 2002-414). Denver, CO: U.S. Geological Survey.
Ben-Zion, Y., Rockwell, T. K., Shi, Z., and Xu, S. (2012). Reversed-polarity secondary deformation structures near fault stepovers. J. Appl. Mech. 79:031025.
Bohannon, R. G., and Geist, E. (1998). Upper crustal structure and Neogene tectonic development of the California continental borderland. Geol. Soc. Am. Bull. 110, 779–800. doi: 10.1130/0016-7606(1998)110<0779:ucsant>2.3.co;2
Brothers, D., Kilb, D., Luttrell, K., Driscoll, N., and Kent, G. (2011). Loading of the San Andreas fault by flood-induced rupture of faults beneath the Salton Sea. Nat. Geosci. 4, 486–492. doi: 10.1038/ngeo1184
Brothers, D. S., Conrad, J. E., Maier, K. L., Paull, C. K., McGann, M., and Caress, D. W. (2015). The Palos Verdes fault offshore Southern California: late Pleistocene to present tectonic geomorphology, seascape evolution, and slip rate estimate based on AUV and ROV surveys. J. Geophys. Res. Solid Earth 120, 4734–4758. doi: 10.1002/2015JB011938
Brothers, D. S., Driscoll, N. W., Kent, G. M., Harding, A. J., Babcock, J. M., and Baskin, R. L. (2009). Tectonic evolution of the Salton Sea inferred from seismic reflection data. Nat. Geosci. 2, 581–584. doi: 10.1038/ngeo590
Burchfiel, B. C., Hodges, K. V., and Royden, L. H. (1987). Geology of Panamint valley-saline valley pull-apart system, California: palinspastic evidence for low-angle geometry of a Neogene range-bounding fault. J. Geophys. Res. Solid Earth 92, 10422–10426. doi: 10.1029/jb092ib10p10422
Calsbeek, N., Eakins, B. W., and Love, M. (2013). Revised Coastal Relief Model of Southern California: Procedures, Data Sources, and Analysis. Boulder, CO: National Geophysical Data Center, 25.
Conrad, J., Brothers, D., Maier, K. L., Ryan, H. F., Dartnell, P., and Sliter, R. W. (2018). “Right-lateral fault motion along the slope-basin transition, Gulf of Santa Catalina, Southern California: SEPM Special Publication No. 110,” in From the Mountains to the Abyss: The California Borderland as an Archive of Southern California Geologic Evolution, 110 Edn, ed. S. Cochran (Tulsa, OK: Society for Sedimentary Geology), doi: 10.2110/sepmsp.110.07
Cooke, M. L., Schottenfeld, M. T., and Buchanan, S. W. (2013). Evolution of fault efficiency at restraining bends within wet kaolin analog experiments. J. Struct. Geol. 51, 180–192. doi: 10.1016/j.jsg.2013.01.010
Demere, T. A. (1983). “The Neogene San Diego basin: a review of the marine Pliocene San Diego formation,” in Cenozoic Marine Sedimentation, Pacific Margin, eds D. K. Larue and R. J. Steel (Los Angeles, CA: U.S.A. Society of Economic Paleontologists and Mineralogists), 187–195.
Dixon, T., Decaix, J., Farina, F., Furlong, K., Malservisi, R., Bennett, R., et al. (2002). Seismic cycle and rheological effects on estimation of present-day slip rates for the Agua Blanca and San Miguel-Vallecitos faults, northern Baja California, Mexico. J. Geophys. Res. Solid Earth 107, ETG 5-1–ETG 5-23.
Dooley, T. P., and Schreurs, G. (2012). Analogue modelling of intraplate strike-slip tectonics: a review and new experimental results. Tectonophysics 574, 1–71. doi: 10.1016/j.tecto.2012.05.030
Elliott, W. J. (1970). “Gravity survey and regional geology of the San Diego Embayment, southwest San Diego County, California,” in Pacific Slip Geology of Northern Baja California and Adjacent Alta California, ed. E. C. Allison, et al. (Tulsa, OK: American Association of Petroleum Geologists), 10–22.
Ellis, A. J., and Lee, C. H. (1919). Geology and ground waters of the western part of San Diego County, California. Supply Pap. US Geol. Surv. 446, 121–123.
Fletcher, J. M., Teran, O. J., Rockwell, T. K., Oskin, M. E., Hudnut, K. W., Mueller, K. J., et al. (2014). Assembly of a large earthquake from a complex fault system: surface rupture kinematics of the 4 April 2010 El Mayor–Cucapah (Mexico) Mw 7.2 earthquake. Geosphere 10, 797–827. doi: 10.1130/ges00933.1
Fossen, H., and Rotevatn, A. (2016). Fault linkage and relay structures in extensional settings–a review. Earth Sci. Rev. 154, 14–28. doi: 10.1016/j.earscirev.2015.11.014
Fossen, H., and Tikoff, B. (1993). The deformation matrix for simultaneous simple shearing, pure shearing and volume change, and its application to transpression-transtension tectonics. J. Struct. Geol. 15, 413–422. doi: 10.1016/0191-8141(93)90137-y
Frez, J., González, J. J., Acosta, J. G., Nava, F. A., Méndez, I., Carlos, J., et al. (2000). A detailed microseismicity study and current stress regime in the Peninsular Ranges of northern Baja California, Mexico: the Ojos Negros region. Bull. Seismol. Soc. Am. 90, 1133–1142. doi: 10.1785/0119990164
Garfunkel, Z., and Ben-Avraham, Z. (1996). The structure of the Dead Sea basin. Tectonophysics 266, 155–176. doi: 10.1016/s0040-1951(96)00188-6
Gastil, R. G., Patterson, D. L., and Abbott, P. L. (1979). “The Valle Formation-physical stratigraphy and depositional model, southern Vizcaino Peninsula, Baja California Sur,” in Baja California Geology, Field Guides and Papers, (San Diego, CA: Geological Society of America Annual Meeting Guidebook), 73–76.
Gold, P. O., Behr, W. M., Fletcher, J. M., Rockwell, T. K., and Figueiredo, P. M. (2020). Time-invariant late quaternary slip rates along the Agua Blanca fault, Northern Baja California, Mexico. Tectonics 39:e2019TC005788.
Gölke, M., Cloetingh, S., and Fuchs, K. (1994). Finite-element modelling of pull-apart basin formation. Tectonophysics 240, 45–57. doi: 10.1016/0040-1951(94)90263-1
Graves, L. (2017). Tectonic and Eustatic Control on Channel Formation, Erosion, and Deposition in the San Diego Bight, CA. Doctoral dissertation. San Diego, CA: UC San Diego.
Haaker, E. C., Rockwell, T. K., Kennedy, G. L., Grant-Ludwig, L., Freeman, S. T., Zumbro, J. A., et al. (2016). “Long – term uplift of the Southern California coast between San Diego and newport beach resolved with new dGPS survey data: testing blind thrust models in the offshore California Borderland,” in Applied Geology in California: Association of Environmental and Engineering Geologists Special Publication, Vol. 26, eds R. L. Anderson and H. Ferriz (Belmont, CA: Star Publishing Company, Inc), 679–720.
Hardebeck, J. L., and Hauksson, E. (1999). Role of fluids in faulting inferred from stress field signatures. Science 285, 236–239. doi: 10.1126/science.285.5425.236
Hardebeck, J. L., and Hauksson, E. (2001). Crustal stress field in southern California and its implications for fault mechanics. J. Geophys. Res. Solid Earth 106, 21859–21882. doi: 10.1029/2001jb000292
Hart, M. W. (1974). Radiocarbon ages of alluvium overlying La Nacion fault, San Diego, California. Geol. Soc. Am. Bull. 85, 1329–1332. doi: 10.1130/0016-7606(1974)85<1329:raoaol>2.0.co;2
Hauksson, E., Yang, W., and Shearer, P. M. (2012). Waveform relocated earthquake catalog for southern California (1981 to June 2011). Bull. Seismol. Soc. Am. 102, 2239–2244. doi: 10.1785/0120120010
Hirabayashi, C. K., Rockwell, T. K., Wesnousky, S. G., Stirling, M. W., and Suarez-Vidal, F. (1996). A neotectonic study of the San Miguel-Vallecitos fault, Baja California, Mexico. Bull. Seismol. Soc. Am. 86, 1770–1783.
Holmquist, J. R., Reynolds, L., Brown, L. N., Southon, J. R., Simms, A. R., and MacDonald, G. M. (2015). Marine radiocarbon reservoir values in southern California estuaries: interspecies, latitudinal, and interannual variability. Radiocarbon 57, 449–458. doi: 10.2458/azu_rc.57.18389
Humphreys, E. D., and Weldon, R. J., II. (1991). Kinematic constraints on the rifting of baja California. AAPG Memoir. 47, 217–229.
Jackson, J., and McKenzie, D. (1983). The geometrical evolution of normal fault systems. J. Struct. Geol. 5, 471–482. doi: 10.1016/0191-8141(83)90053-6
Kennedy, M. P. (1975). Geology of the western San Diego metropolitan area, California: Del Mar, La Jolla, and Point Loma quadrangles. Calif. Div. Mines Geol. Bull. A 200, 709–722.
Kennedy, M. P., and Clarke, S. H. (1996). Analysis of Late Quaternary Faulting in San Diego Bay and Hazard to the Coronado Bridge, Vol. 97. Sacramento, CA: California Department of Conservation.
Kennedy, M. P., and Clarke, S. H. (1999). Age of Faulting in San Diego Bay in the Vicinity of the Coronado Bridge, An Addendum to: Analysis of late Quaternary faulting in San Diego Bay and Hazard to the Coronado Bridge, Vol. 97. Division of Mines and Geology: California Department of Conservation.
Kennedy, M. P., and Tan, S. S. (2005). “Geologic map of the San Diego 30’x 60’quadrangle,” in California: A digital database: California Geological Survey, Preliminary Geologic Maps, Scale, 1(100,000), (Reston, VA: United States Geological Survey),Google Scholar
Kennedy, M. P., and Welday, E. E. (1980). Character and recency of faulting offshore, metropolitan San Diego. California 40, 50–50.
Kern, J. P., and Rockwell, T. R. (1992). “Chronology and deformation of Quaternary marine shorelines, San Diego County, California,” in Quaternary Coasts of the United States: Marine and Lacustrine Systems, SEPM Special Publication No. 48, (Tulsa, OK: SEPM Society for Sedimentary Geology), 377–382. doi: 10.2110/pec.92.48.0377
Kies, R. P. (1982). Paleogene Sedimentology, Lithostratigraphic Correlations and Paleogeography, San Miguel Island, Santa Cruz Island, and San Diego, California. Ph. D. Thesis. San Diego, CA: San Diego State University.
Langenheim, V. E., and Jachens, R. C. (2003). Crustal structure of the Peninsular Ranges batholith from magnetic data: implications for Gulf of California rifting. Geophys. Res. Lett. 30:1597.
Langenheim, V. E., Jachens, R. C., Morton, D. M., Kistler, R. W., and Matti, J. C. (2004). Geophysical and isotopic mapping of preexisting crustal structures that influenced the location and development of the San Jacinto fault zone, southern California. GSA Bull. 116, 1143–1157. doi: 10.1130/B25277.1
Legg, M. R. (1985). Geological Structure and Tectonics of the Inner Continental Borderland Offshore Northern Baja California, Mexico. Ph. D. Thesis. Santa Barbara: University of California.
Legg, M. R., Kohler, M. D., Shintaku, N., and Weeraratne, D. S. (2015). High-resolution mapping of two large-scale transpressional fault zones in the California Continental Borderland: Santa Cruz-Catalina Ridge and Ferrelo faults. J. Geophys. Res. Earth Surf. 120, 915–942. doi: 10.1002/2014JF003322
Legg, M. R., Wong, V., and Suarez, F. (1991). Geologic structure and tectonics of the inner continental Borderland of Northern Baja California: chapter 9: Part III. Region. Geophys. Geol. 47, 145–177.
Lindvall, S. C., and Rockwell, T. K. (1995). Holocene activity of the Rose Canyon fault zone in San Diego, California. J. Geophys. Res. Solid Earth 100, 24121–24132. doi: 10.1029/95jb02627
Lonsdale, P. (1995). Segmentation and disruption of the East Pacific Rise in the mouth of the Gulf of California. Mar. Geophys. Res. 17, 323–359. doi: 10.1007/bf01227039
Magistrale, H. (1993). Seismicity of the Rose Canyon fault zone near San Diego, California. Bull. Seismol. Soc. Am. 83, 1971–1978.
Maloney, J. M. (2013). Fault Segments and Step-Overs: Implications for Geohazards and Biohabitats. San Diego, CA: University of California.
Maloney, J. M., Driscoll, N., Kent, G., Duke, S., Freeman, T., Bormann, J., et al. (2016). “Segmentation and step-overs along strike-slip fault systems in the inner California borderlands: implications for fault architecture and basin formation,” in Applied Geology in California, Environmental Engineering Geologists 26, (Singapore: Star Publishing Pte Ltd), 655–677.
Mann, P. (2007). Global catalogue, classification and tectonic origins of restraining-and releasing bends on active and ancient strike-slip fault systems. Geol. Soc. Lond. Spec. Public. 290, 13–142. doi: 10.1144/sp290.2
Mann, P., Hempton, M. R., Bradley, D. C., and Burke, K. (1983). Development of pull-apart basins. J. Geol. 91, 529–554.
Marshall, M. (1989). “Detailed gravity studies and the tectonics of the Rose Canyon–Point Loma–La Nacion Fault System, San Diego, California,” in The Seismic Risk in the San Diego Region: Special Focus on the Rose Canyon Fault Systems: Workshop Proceedings, ed. S. Tanges (San Diego, CA: San Diego Association Of Geologists), 80–100.
Minch, J. A. (1967). Stratigraphy and structure of the Tijuana-Rosarito Beach area, northwestern Baja California, Mexico. Geol. Soc. Am. Bull. 78, 1155–1178. doi: 10.1130/0016-7606(1967)78[1155:sasott]2.0.co;2
Moore, G. W. (1972). Offshore Extension of the Rose Canyon fault, San Diego, California. Geology Survey Professional Paper 800-2. Reston, VA: United States Geological Survey.
Moore, G. W., and Kennedy, M. P. (1975). Quaternary faults at San Diego Bay, California. J. Res. US Geol. Surv. 3, 589–595.
Morley, C. K. (2010). Stress re-orientation along zones of weak fabrics in rifts: an explanation for pure extension in ‘oblique’ rift segments? Earth Planet. Sci. Lett. 297, 667–673. doi: 10.1016/j.epsl.2010.07.022
Muhs, D. R., Kennedy, G. L., and Rockwell, T. K. (1988). “Uranium-series ages of corals from marine terraces, Pacific coast of North America: Implications for the timing and magnitude of late Pleistocene sea level changes,” in Programs and Abstracts of the 10th Biennial Meeting, (Philadelphia, PA: AACR), 140.
Muhs, D. R., Kennedy, G. L., and Rockwell, T. K. (1994). Uranium-series ages of marine terrace corals from the Pacific coast of North America and implications last interglacial sea level history. Quat. Res. 42, 72–87. doi: 10.1006/qres.1994.1055
Nicholson, C., Sorlien, C. C., Atwater, T., Crowell, J. C., and Luyendyk, B. P. (1994). Microplate capture, rotation of the western Transverse Ranges, and initiation of the San Andreas transform as a low-angle fault system. Geology 22, 491–495. doi: 10.1130/0091-7613(1994)022<0491:mcrotw>2.3.co;2
Oglesby, D. D. (2005). The dynamics of strike-slip step-overs with linking dip-slip faults. Bull. Seismol. Soc. Am. 95, 1604–1622. doi: 10.1785/0120050058
Passchier, C. W., and Platt, J. P. (2017). Shear zone junctions: of zippers and freeways. J. Struct. Geol. 95, 188–202. doi: 10.1016/j.jsg.2016.10.010
Platt, J. P., and Becker, T. W. (2010). Where is the real transform boundary in California? Geochem. Geophys. Geosyst. 11. doi: 10.1029/2010GC003060
Platt, J. P., and Passchier, C. W. (2016). Zipper junctions: a new approach to the intersections of conjugate strike-slip faults. Geology 44, 795–798. doi: 10.1130/g38058.1
Rahe, B., Ferrill, D. A., and Morris, A. P. (1998). Physical analog modeling of pull-apart basin evolution. Tectonophysics 285, 21–40. doi: 10.1016/s0040-1951(97)00193-5
Reimer, P. J., Bard, E., Bayliss, A., Beck, J. W., Blackwell, P. G., Ramsey, C. B., et al. (2013). IntCal13 and Marine13 radiocarbon age calibration curves 0–50,000 years cal BP. Radiocarbon 55, 1869–1887. doi: 10.2458/azu_js_rc.55.16947
Reveal. (2019). Reveal. Available online at: https://www.shearwatergeo.com/6/reveal-software (accessed April 19, 2019)
Reynolds, L. C., and Simms, A. R. (2015). Late Quaternary relative sea level in southern California and Monterey Bay. Quat. Sci. Rev. 126, 57–66. doi: 10.1016/j.quascirev.2015.08.003
Rockwell, T. K. (2010). “The Rose Canyon fault zone in San Diego,” in Proceedings of the 2010 - Fifth International Conference on Recent Advances in Geotechnical Earthquake Engineering and Soil Dynamics, no. 7.06c, (Santa Ana, CA: Earth Consultants International), 1–9.
Rockwell, T. K., Schug, D. L., and Hatch, M. E. (1993). “Late quaternary slip rates along the Agua Blanca fault, Baja California, Mexico,” in Geological Investigations of Baja California: South Coast Geological Society, Annual Field Trip Guidebook No. 21, ed. P. L. Abbott (San Diego, CA: San Diego State University), 53–92.
Rogers, D. A. (1980). “Analysis of pull-apart basin development produced by en echelon strike-slip faults,” in Sedimentation in Oblique-Slip Mobile Zones: International Association of Sedimentologist Special Publication 4, eds P. F. Ballance and H. G. Reading (Belgium: The International Association of Sedimentologists).
Ross, Z. E., Trugman, D. T., Hauksson, E., and Shearer, P. M. (2019). Searching for hidden earthquakes in Southern California. Science 364, 767–771. doi: 10.1126/science.aaw6888
Ryan, H. F., Legg, M. R., Conrad, J. E., and Sliter, R. W. (2009). “Recent faulting in the Gulf of Santa Catalina: San Diego to Dana Point,” in Earth Science in the Urban Ocean: The Southern California Continental Borderland. GSA Special Papers 454, eds H. Lee and W. Normark (Boulder, CO: Geological Society of America), 291–315.
Sahakian, V., Bormann, J., Driscoll, N., Harding, A., Kent, G., and Wesnousky, S. (2017). Seismic constraints on the architecture of the Newport-Inglewood/Rose Canyon fault: Implications for the length and magnitude of future earthquake ruptures. J. Geophys. Res. Solid Earth 122, 2085–2105.
Simms, A. R., Rood, D. H., and Rockwell, T. K. (2020). Correcting MIS5e and 5a sea-level estimates for tectonic uplift, an example from southern California. Q. Sci. Rev. 248:106571. doi: 10.1016/j.quascirev.2020.106571
Singleton, D. M. (2020). Neotectonics in San Diego, California: Paleoseismology, Slip Rate, and Offshore Structure of the Rose Canyon Fault. Doctoral dissertation. San Diego, CA: University of California.
Singleton, D. M., Brothers, D. S., Kluesner, J. W., and Sliter, R. W. (2021). Reprocessed Multichannel Airgun Seismic-Reflection Data of USGS Field Activity T-1-96-SC Collected in San Diego Bay, California in 1996: U.S. Geological Survey Data Release. Reston, VA: United States Geological Survey.
Singleton, D. M., Rockwell, T. K., Murbach, D., Murbach, M., Maloney, J. M., Freeman, T., et al. (2019). Late-Holocene rupture history of the Rose Canyon fault in Old Town, San Diego: Implication for cascading earthquakes on the Newport-Inglewood-Rose Canyon fault system. Bull. Seismol. Soc. Am. 109, 855–874. doi: 10.1785/0120180236
Teyssier, C., Tikoff, B., and Markley, M. (1995). Oblique plate motion and continental tectonics. Geology 23, 447–450. doi: 10.1130/0091-7613(1995)023<0447:opmact>2.3.co;2
Tikoff, B., and Teyssier, C. (1994). Strain modeling of displacement-field partitioning in transpressional orogens. J. Struct. Geol. 16, 1575–1588. doi: 10.1016/0191-8141(94)90034-5
Treiman, J. A. (1993). The Rose Canyon Fault Zone, Southern California: California Division of Mines and Geology Open File Report 93-02. San Diego, CA: California Division of Mines, 45.
Treiman, J. A. (2002). Silver Strand Fault, Coronado Fault, Spanish Bight fault, San Diego Fault, and Downtown Graben: Southern Rose Canyon fault zone. San Diego, CA: California Division of Mines, 13.
Triezenberg, P. J., Hart, P. E., and Childs, J. R. (2016). National Archive of Marine Seismic Surveys (NAMSS): A U.S. Geological Survey Data Website of Marine Seismic Reflection Data within the U.S. Exclusive Economic Zone (EEZ): U.S. Geological Survey data release. Reston, VA: United States Geological Survey, doi: 10.5066/F7930R7P
USGS (2019). U.S. Geological Survey and California Geological Survey, Quaternary fault and fold Database for the United States. Available online at: https://www.usgs.gov/natural-hazards/earthquake-hazards/faults (accessed March 1, 2019)
van Wijk, J., Axen, G., and Abera, R. (2017). Initiation, evolution and extinction of pull-apart basins: Implications for opening of the Gulf of California. Tectonophysics 719, 37–50. doi: 10.1016/j.tecto.2017.04.019
Walton, M. A. L., Brothers, D. S., Conrad, J. E., Maier, K. L., Roland, E. C., Kluesner, J. W., et al. (2020b). Morphology, structure, and kinematics of the San Clemente and Catalina faults based on high-resolution marine geophysical data, southern California Inner Continental Borderland (USA). Geosphere 16, 1312–1335. doi: 10.1130/GES02187.1
Walton, M. A. L., Papesh, A. G., Johnson, S. Y., Conrad, J. E., and Brothers, D. S. (2020a). Quaternary Faults Offshore of California: U.S. Geological Survey Data Release. Available online at: https://doi.org/10.5066/P91RYEZ4 (accessed October 20, 2020).
Watt, J., Ponce, D., Parsons, T., and Hart, P. (2016). Missing link between the Hayward and Rodgers Creek faults. Sci. Adv. 2:e1601441. doi: 10.1126/sciadv.1601441
Weidman, L., Maloney, J., and Rockwell, T. (2019). Geotechnical data synthesis for GIS-based analysis of fault zone geometry and hazard in an urban environment. Geosphere 15, 1999–2017. doi: 10.1130/GES02098.1
Wesnousky, S. G. (2008). Displacement and geometrical characteristics of earthquake surface ruptures: Issues and implications for seismic-hazard analysis and the process of earthquake rupture. Bull. Seismol. Soc. Am. 98, 1609–1632. doi: 10.1785/0120070111
Wessel, P., Luis, J. F., Uieda, L., Scharroo, R., Wobbe, F., Smith, W. H. F., et al. (2019). The generic mapping tools version 6. Geochem. Geophys. Geosyst. 20, 5556–5564. doi: 10.1029/2019GC008515
Wetmore, P. H., Malservisi, R., Fletcher, J. M., Alsleben, H., Wilson, J., Callihan, S., et al. (2019). Slip history and the role of the Agua Blanca fault in the tectonics of the North American–Pacific plate boundary of southern California, USA and Baja California, Mexico. Geosphere 15, 119–145. doi: 10.1130/ges01670.1
Wetmore, P. H., Schmidt, K. L., Paterson, S. R., and Herzig, C. (2002). Tectonic implications for the along-strike variation of the Peninsular Ranges batholith, southern and Baja California. Geology 30, 247–250. doi: 10.1130/0091-7613(2002)030<0247:tiftas>2.0.co;2
Wiegand, J. W. (1970). Evidence of a San Diego Bay-Tijuana fault. Bull. Assoc. Eng. Geol. 7, 107–121.
Williams, J. N., Fagereng, Å, Wedmore, L. N., Biggs, J., Mphepo, F., Dulanya, Z., et al. (2019). How do variably striking faults reactivate during rifting? Insights from southern Malawi. Geochem. Geophys. Geosyst. 20, 3588–3607. doi: 10.1029/2019gc008219
Wilson, J., Wetmore, P. H., Fletcher, J., Teran, O., Yelil, R., and Courtland, L. M. (2011). “The Northwestern San Miguel-Vallecitos-Calabasas Fault System, Baja California, Mexico: Total Offset Constraints,” in Proceedings of the 2011 GSA Annual Meeting, (Minneapolis, MN).
Wright, T. L. (1991). Structural Geology and Tectonic Evolution of the Los Angeles Basin, California. Chapter 3, Active Margin Basins. Tulsa, OK: AAPG.
Wu, J. E., McClay, K., Whitehouse, P., and Dooley, T. (2009). 4D analogue modelling of transtensional pull-apart basins. Mar. Petrol. Geol. 26, 1608–1623. doi: 10.1016/j.marpetgeo.2008.06.007
Ye, J., Liu, M., and Wang, H. (2015). A numerical study of strike-slip bend formation with application to the Salton Sea pull-apart basin. Geophys. Res. Lett. 42, 1368–1374. doi: 10.1002/2015gl063180
Keywords: pull-apart basin, fault structure, marine paleoseismology, marine geophysics, Newport-Inglewood-Rose Canyon fault system, Inner California Continental Borderland, San Diego bay
Citation: Singleton DM, Maloney JM, Brothers DS, Klotsko S, Driscoll NW and Rockwell TK (2021) Recency of Faulting and Subsurface Architecture of the San Diego Bay Pull-Apart Basin, California, USA. Front. Earth Sci. 9:641346. doi: 10.3389/feart.2021.641346
Received: 14 December 2020; Accepted: 08 April 2021;
Published: 11 June 2021.
Edited by:
James D. Muirhead, The University of Auckland, New ZealandReviewed by:
Jack Williams, Cardiff University, United KingdomFrancesco Mazzarini, Istituto Nazionale di Geofisica e Vulcanologia (INGV), Italy
Copyright © 2021 Singleton, Maloney, Brothers, Klotsko, Driscoll and Rockwell. This is an open-access article distributed under the terms of the Creative Commons Attribution License (CC BY). The use, distribution or reproduction in other forums is permitted, provided the original author(s) and the copyright owner(s) are credited and that the original publication in this journal is cited, in accordance with accepted academic practice. No use, distribution or reproduction is permitted which does not comply with these terms.
*Correspondence: Drake M. Singleton, ZHNpbmdsZXRAdWNzZC5lZHU=
†Present address: Drake M. Singleton, Pacific Coastal and Marine Science Center, U.S. Geological Survey, Santa Cruz, CA, United States