 Carlos Peña
 Oliver Heidbach
 Marcos Moreno3,4
 Daniel Melnick
- 1Helmholtz Centre Potsdam, GFZ German Research Centre for Geosciences, Potsdam, Germany
- 2Department of Earth Sciences, Freie Universität Berlin, Berlin, Germany
- 3Departamento de Geofísica, Universidad de Concepción, Concepción, Chile
- 4Millenium Nucleus CYCLO “The Seismic Cycle along Subduction, Zones”, Valdivia, Chile
- 5Instituto de Ciencias de la Tierra, TAQUACh, Universidad Austral de Chile, Valdivia, Chile
Evaluating the transfer of stresses from megathrust earthquakes to adjacent segments is fundamental to assess seismic hazard. Here, we use a 3D forward model as well as GPS and seismic data to investigate the transient deformation and Coulomb Failure Stresses (CFS) changes induced by the 2010 Maule earthquake in its northern segment, where the Mw 8.3 Illapel earthquake occurred in 2015. The 3D model incorporates the coseismically instantaneous, elastic response, and time-dependent afterslip and viscoelastic relaxation processes in the postseismic period. We particularly examine the impact of linear and power-law rheology on the resulting postseismic deformation and CFS changes that may have triggered the Illapel earthquake. At the Illapel hypocenter, our model results in CFS changes of ∼0.06 bar due to the coseismic and postseismic deformation, where the coseismic deformation accounts for ∼85% of the total CFS changes. This is below the assumed triggering threshold of 0.1 bar and, compared to the annual loading rate of the plate interface, represents a clock advance of approximately only 2 months. However, we find that sixteen events with Mw ≥ 5 in the southern region occurred in regions of CFS changes > 0.1 bar, indicating a potential triggering by the Maule event. Interestingly, while the power-law rheology model increases the positive coseismic CFS changes, the linear rheology reduces them. This is due to the opposite polarity of the postseismic displacements resulting from the rheology model choice. The power-law rheology model generates surface displacements that fit better to the GPS-observed landward displacement pattern.
Introduction
Megathrust earthquakes induce local and large-scale deformations (e.g., Hu et al., 2004; Vigny et al., 2011; Moreno et al., 2012), which may last several decades due to viscoelastic relaxation (Khazaradze et al., 2002; Hu et al., 2004; Wang et al., 2012). The crust continues to move after the coseismic instantaneous response, exhibiting different deformation patterns that are observed by GPS measurements (Wang et al., 2012; Tomita et al., 2015; Klein et al., 2016). Inland GPS data show that the crust moves in the sense of the main shock in front of the rupture area, which in most subduction zones represents trenchward movement. At neighboring segments of the rupture area, however, the GPS horizontal displacements exhibit landward motion (Heki and Mitsui, 2013; Tomita et al., 2015; Klein et al., 2016; Loveless, 2017; Melnick et al., 2017), as envisioned by Anderson (1975). While the trenchward motion patterns are mostly attributed to afterslip on the fault interface and viscous relaxation in the lower crust and upper mantle (e.g., Hu et al., 2004; Hergert and Heidbach, 2006; Wang et al., 2012; Peña et al., 2019, 2020), the driving mechanisms controlling landward patterns following megathrust earthquakes are currently a matter of controversial debate. For instance, Hu et al. (2016) and Tomita et al. (2015) showed that landward acceleration of the oceanic plate following the 2011 Tohoku-oki earthquake in Japan may be attributed to upper mantle viscoelastic relaxation. Alternatively, other authors have proposed that the slab pull balance of forces after large earthquakes is the driving mechanism of the GPS-observed postseismic landward patterns (Heki and Mitsui, 2013; Yuzariyadi and Heki, 2020).
The deformation patterns induced by the coseismic and postseismic deformation are of vital importance, as they can potentially modify the state of stress at adjacent segments, which may be mature segments critically stressed, and ultimately triggering large-magnitude earthquakes. Examples of earthquake triggering because of coseismic stress release and its subsequent postseismic deformation can be found in the Sumatran-Andaman region, Indonesia (McCloskey et al., 2005; Pollitz et al., 2006; Hughes et al., 2010; Qiu and Chan, 2019) and earthquakes in strike-slip fault systems such as the 1999 Hector Mine earthquake in Southern California, United States (Freed and Lin, 2001) and the 2016 Visso earthquake in Italy (Tung and Masterlark, 2018).
On the 27th of February 2010, the Maule earthquake occurred in Central Chile with a magnitude of Mw 8.8, breaking a 500 km long plate boundary segment along strike (Figure 1 and Vigny et al., 2011; Moreno et al., 2012). About 5 years later, a segment approximately 200 km north of the Maule rupture area ruptured with the Mw 8.3 Illapel earthquake that occurred on September 16th, 2015 (Figure 1). This earthquake broke a presumably mature segment, where the last event occurred in 1943 with a magnitude of Mw 7.9 (Beck et al., 1998). In the Illapel segment (enclosed area in Figure 2), an enhancement of landward displacement was observed following the 2010 Maule event (Figure 2 and Klein et al., 2016; Melnick et al., 2017; Ruiz et al., 2016). Using GPS data, Ruiz et al. (2016) revealed an increase of the annual interseismic velocity in this segment of approximately 15% between the 2010 event and the end of 2014, but they did not measure the locking degree directly or the stress changes due to this increase. Melnick et al. (2017) found an increase of 20% in the apparent locking degree by using GPS observations in the period within the 2010 Maule and the 2015 Illapel events. In the study of Melnick et al. (2017), however, the effect of exponential transient components, e.g., viscous relaxation, were not included, as they only focused on the change in the linear trend component of the observations between the 2010 and 2015 events to calculate the locking changes. By contrast, Klein et al. (2016) showed that a possible mechanism to explain such a pattern may be viscoelastic relaxation in the asthenosphere, as well as in a deep, low-viscosity channel along the fault interface, using a linear Burgers rheology model. Despite these advances in understanding the kinematics of these patterns, it remains unclear how the 3D power-law rheology affects the landward postseismic displacements and how stresses were built-up on the fault interface in the Illapel segment due to the coseismic and postseismic deformation of the 2010 Maule event.
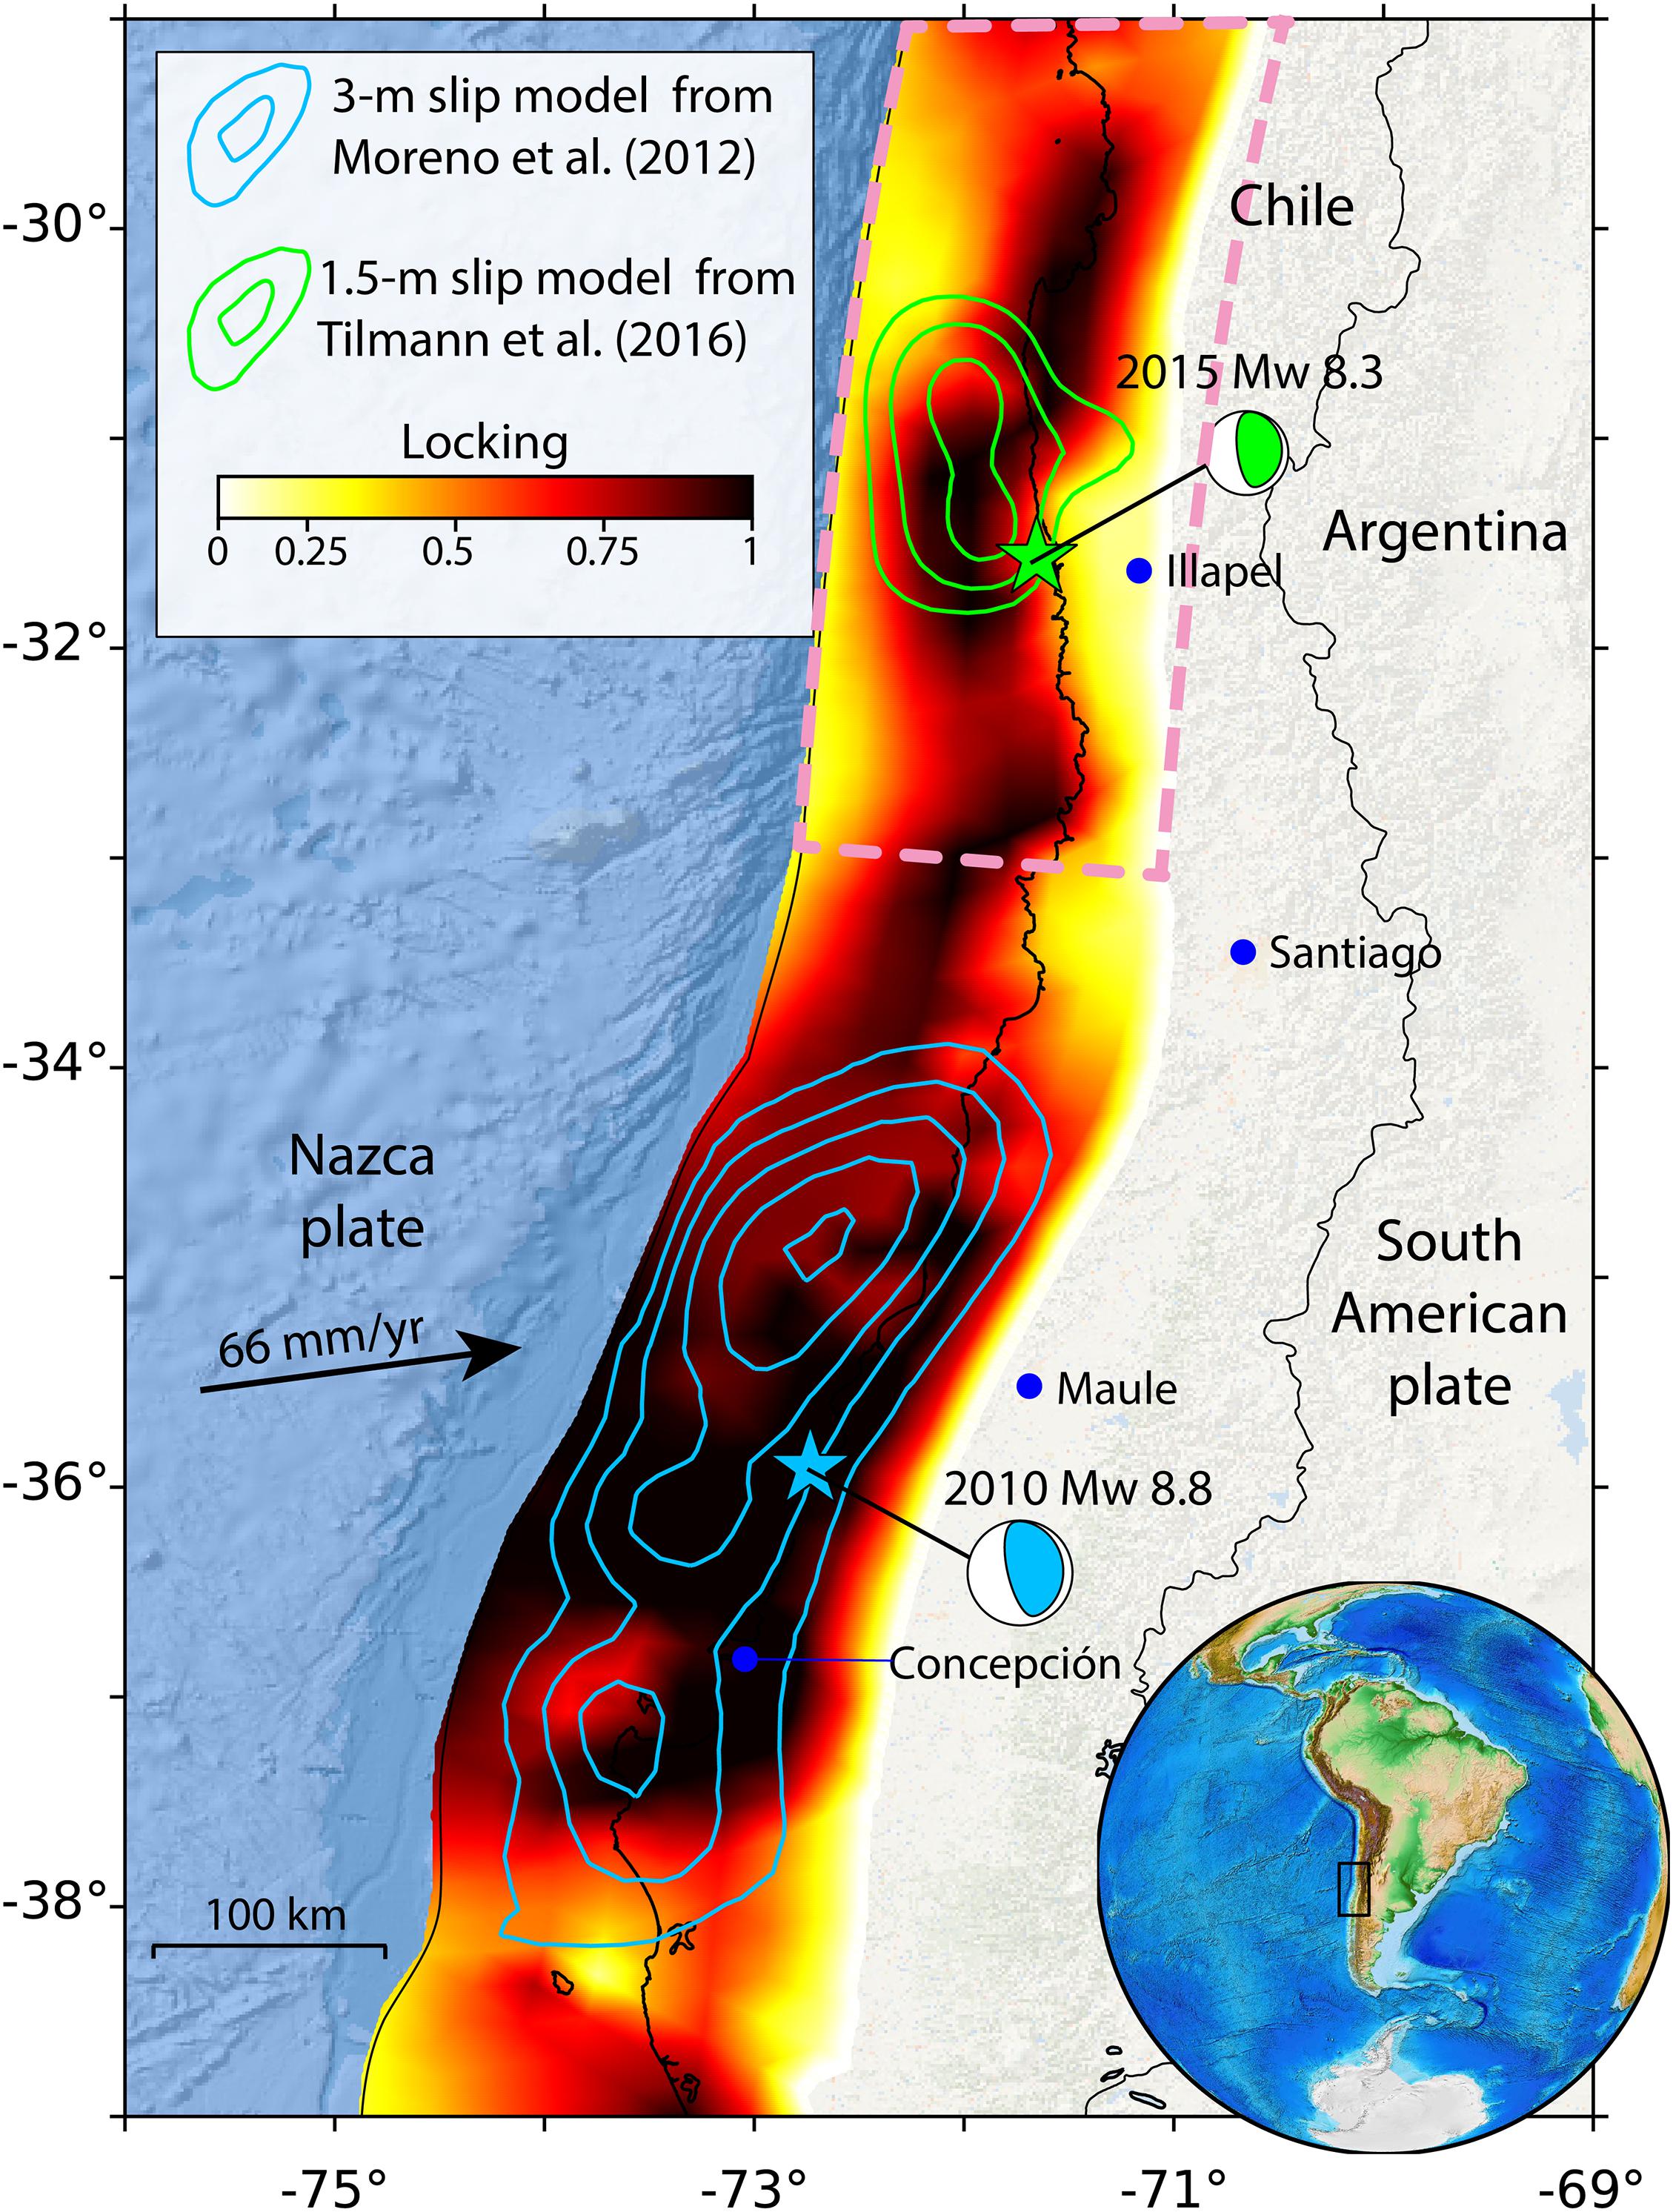
Figure 1. Study area with slip models for the Maule (Moreno et al., 2012) and Illapel (Tilmann et al., 2016) earthquakes, interseismic locking prior to the 2010 Maule events from Tilmann et al. (2016) and main cities are also shown in blue circles. Dashed-pink polygon represents the area of the receiver fault (projected on surface) used to calculate the CFS changes in Figures 3, 4.
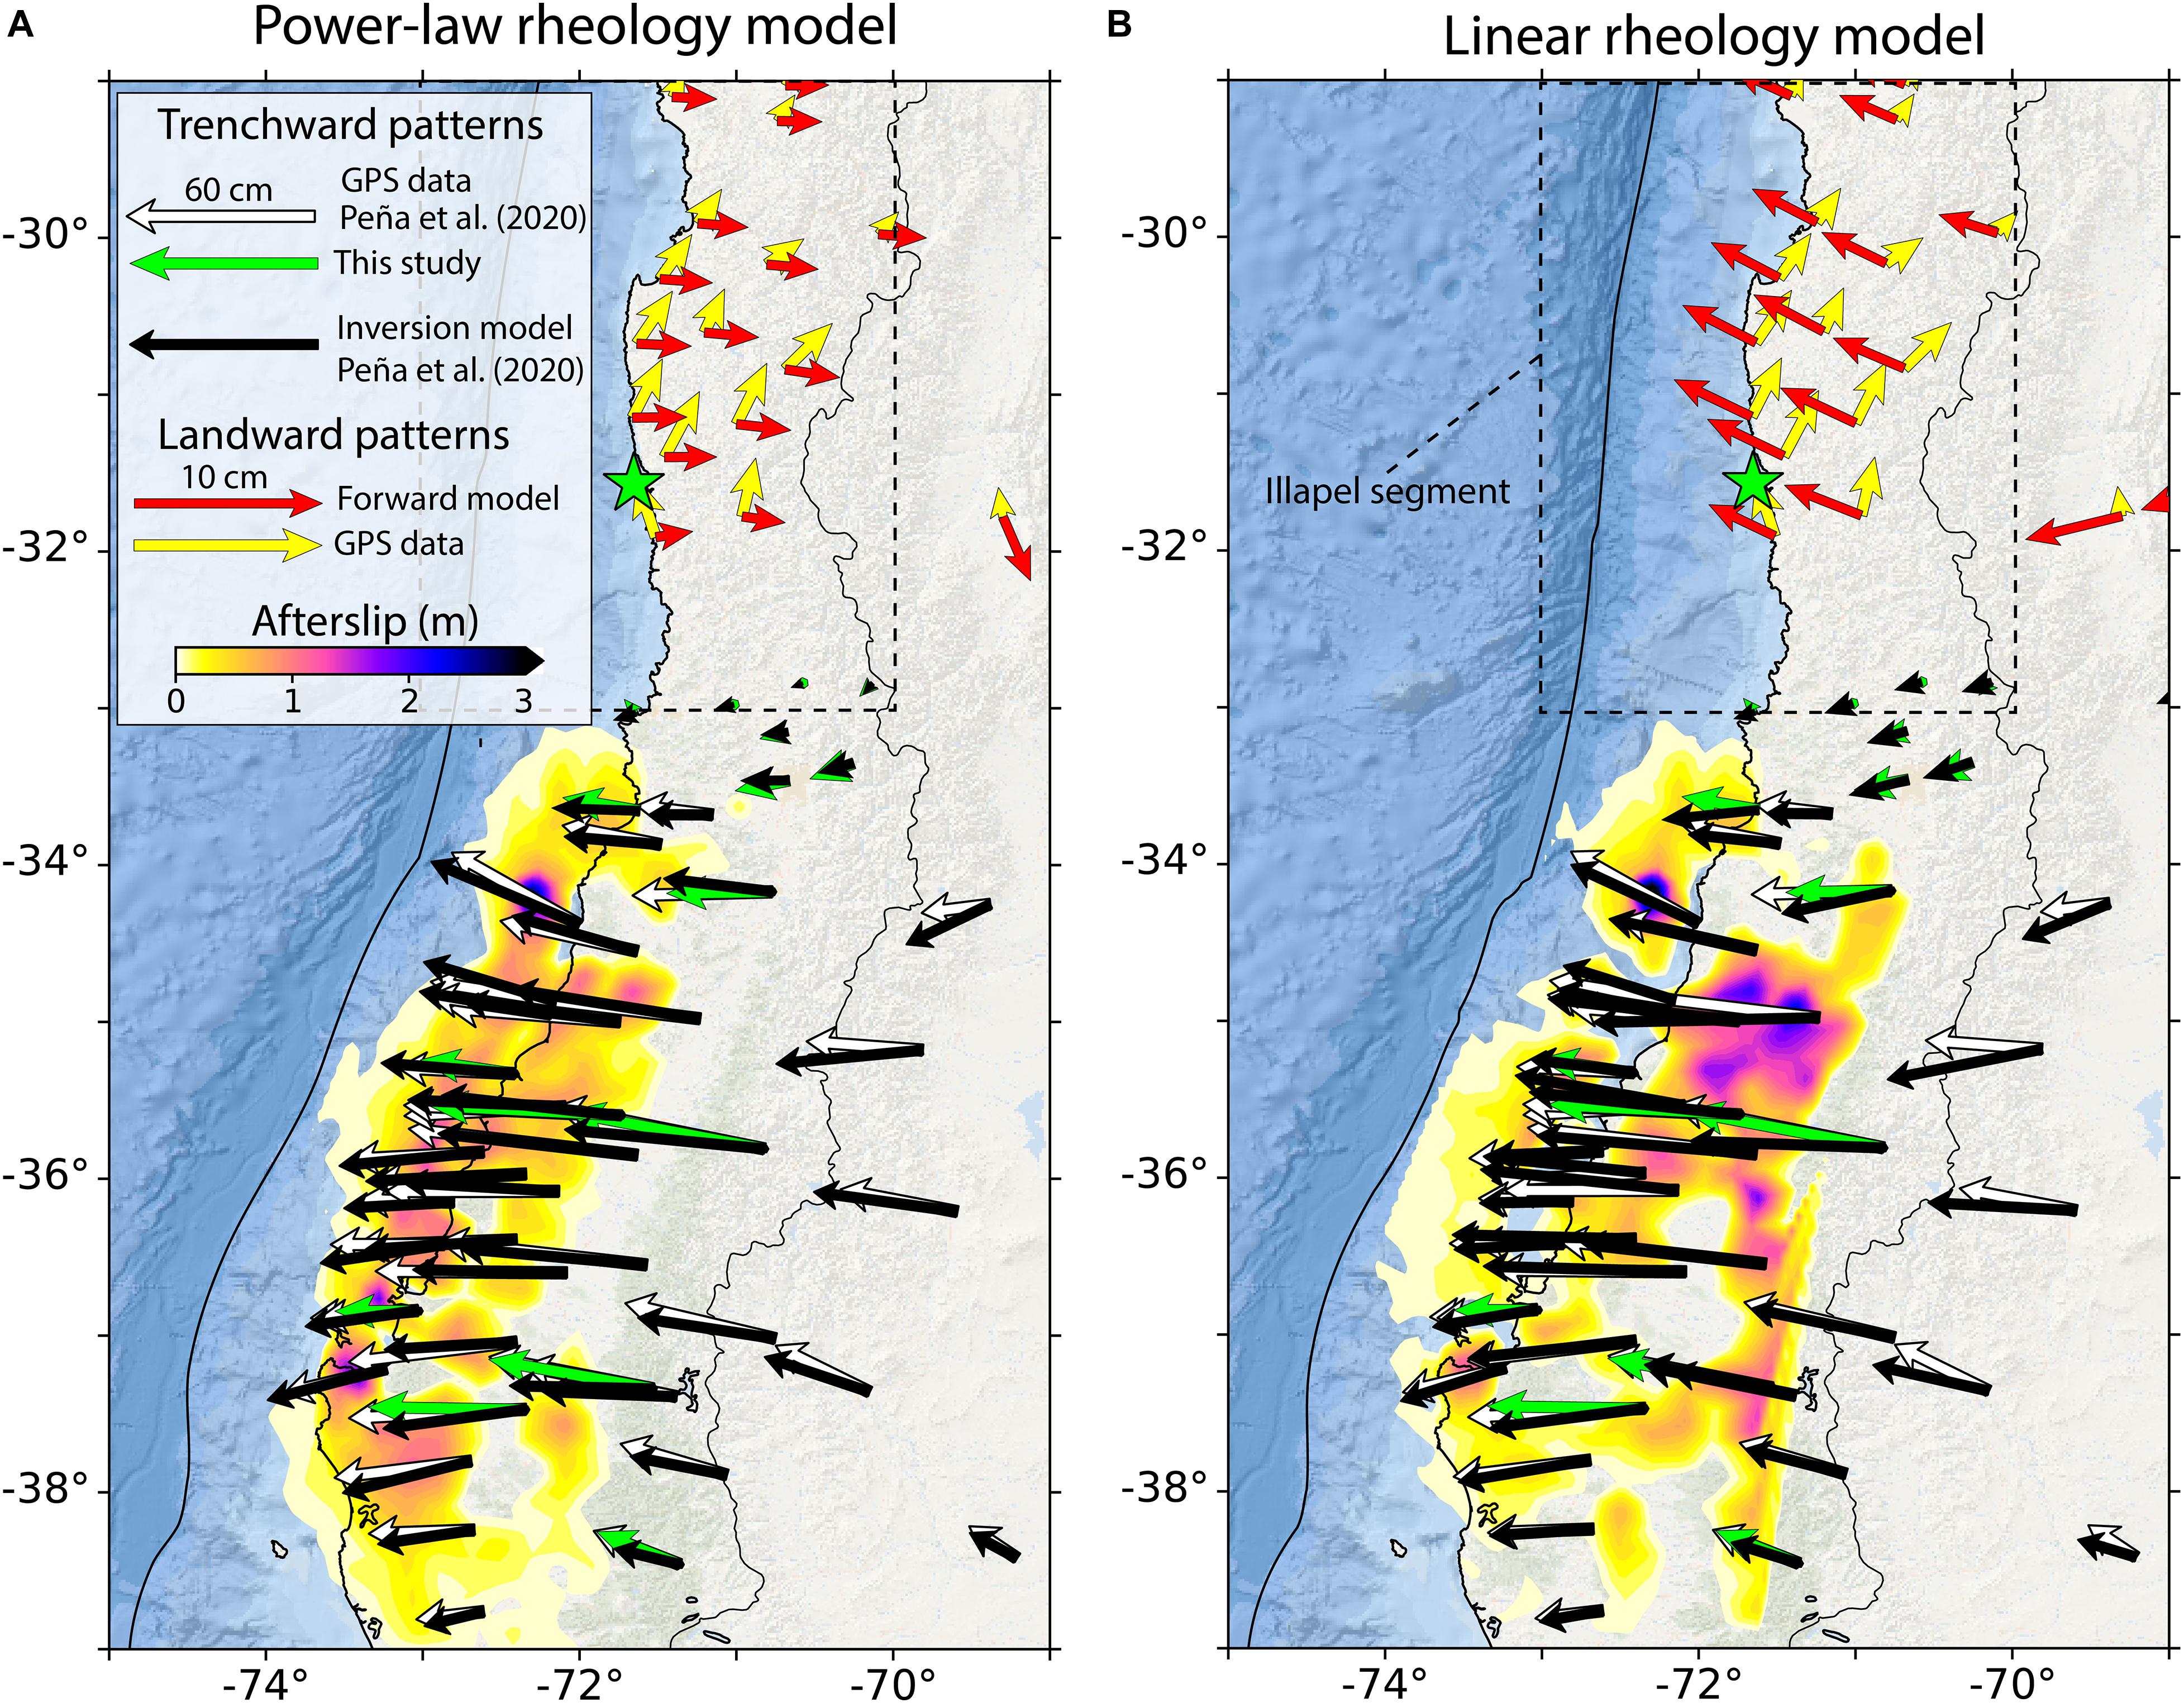
Figure 2. Horizontal cumulative displacements from the GPS data versus the modeled ones, and afterslip inversion on the fault interface (projected on surface) from the simulation considering power-law (A) and linear (B) rheology. The Illapel segment is enclosed by the black-dashed rectangle. The GPS observations used in the study of Peña et al. (2020) cover 6 years from the February 27, 2010 (white arrows). In this study, we investigate the period between the 2010 Maule (February 27, 2010) and the 2015 Illapel (September 16, 2015), which represents 5.5 years. Therefore, the resulting modeled surface displacements displayed in the Illapel segments account for this period, although the differences considering 6 years are negligible. Thus, green (trenchward) and yellow arrows (landward) represent the horizontal cumulative 5.5-years surface displacements from the GPS data used in this study, while the red arrows the ones from the model in the same period.
Here, we use the 3D geomechanical-numerical model of Peña et al. (2020) and cumulative GPS observations between the 2010 Maule and 2015 Illapel earthquakes to examine the transient deformation and stress changes in the Illapel segment induced by the coseismic and postseismic deformation of the 2010 Maule earthquake. We first investigate the differences in the resulting surface postseismic displacements due to the choice of model rheology and how this affects the calculation of the Coulomb Failure Stress (CFS) changes. Finally, we evaluate if the CFS changes induced by the co- and postseismic effects of the 2010 Maule earthquake could have triggered the 2015 Illapel event.
Model Setup and GPS Observations
We use the 3D geomechanical-numerical model of Peña et al. (2020) to investigate both the deformation and stress transient patterns induced in the Illapel segment due to the 2010 Maule event. The model described in Peña et al. (2020) considers the slab and Moho geometries obtained from Hayes et al. (2012) and Tassara et al. (2006), respectively. The model extends 4000 km in the WE direction, 2000 km in the NS direction, and 400 km in the vertical direction (see Peña et al. (2020) for further details). The postseismic deformation following the 2010 Maule event is simulated by combining afterslip and viscous relaxation jointly through a forward modeling approach. To do so, we employ the best-fit simulation of Peña et al. (2020), which considers afterslip on the fault interface, and power-law rheology with dislocation creep processes in the crust and upper mantle (see elastic and creep parameters in Supplementary Tables 1, 2). In this simulation, most of the afterslip occurs at depths <60 km (Figure 2A), while viscous relaxation occurs in the continental lower crust and upper mantle beneath the volcanic arc (see Figure 8A in Peña et al., 2020). As discussed by Peña et al. (2020), this model was favored not only because of the best fit to cumulative GPS observations and GPS time-series but also because of the correlation between the modeled afterslip and the aftershocks. For comparison, we also consider a simulation with linear rheology, which consists of a whole elastic crust and linear viscosity in the upper mantle. The afterslip distribution from the linear rheology case is displayed in Figure 2B.
In this study, we compute the CFS changes on the megathrust fault interface in the Illapel segment due to the coseismic and postseismic deformation of the 2010 main shock. We calculate the CFS changes employing the linear relationship between shear and normal stresses given by,
where Δτ is the change in shear stresses, μ′ the effective coefficient of friction and Δσ the change in normal stresses (e.g., King et al., 1994; Stein, 1999). Following the approach of Moreno et al. (2018), we also consider a heterogeneous effective coefficient of friction on the fault interface. The study of Moreno et al. (2018) showed that this approach could explain the occurrence of moderate-size earthquakes in southern Chile better. Moreno et al. (2018) estimated μ′ = 0.04 for regions where the locking degree is ≥ 0.8 and μ′ = 0.01 for regions with a locking degree < 0.8. We employ a similar approach, testing for three different locking degree threshold values (0.8, 0.5, and 0.2), where μ′ is set to 0.04 and 0.01 above and below the locking threshold, respectively. These low values of μ′ are supported by a recent study by Dielforder et al. (2020) and by the inversion of stress orientations of moment tensors from subduction earthquakes as well. This suggests a frictional zonation with a higher effective coefficient of friction in highly locked domains as compared to creeping ones (Hardebeck and Loveless, 2018). We tested end-member μ′ values as well (Supplementary Figure 1), but they do not result in any major CFS changes. This agrees with Pollitz et al. (2006), who found similar stress changes by considering a range of μ′ between 0 and 0.8 to investigate the stress changes in the Sumatra-Andaman region. The locking coefficient is taken from Tilmann et al. (2016) who use an inversion of the interseismic GPS observations using an inversion method based on FEM-generated Green’s functions. Their implemented fault geometry and elastic parameters follows the approach of Moreno et al. (2012), which are also consistent with those used in the 3D model of Peña et al. (2020). The resulting numerical problem is resolved with the commercial finite element code Abaqus, version 6.14 and the CFS changes are computed on the fault interface using GeoStress Add-on (Stromeyer et al., 2020) for Tecplot 360 EX, version 2019 R1.
To investigate the differences in deformation of the Illapel segment due to the choices of model rheology, we use the cumulative postseismic GPS displacements from Melnick et al. (2017) between the 2010 Maule and 2015 Illapel earthquakes. In this data set, the effect of aftershocks and seasonal components have been removed (further information can be found in supporting information in Melnick et al., 2017). Following the approach from previous studies (e.g., Klein et al., 2016; Weiss et al., 2019; Peña et al., 2020), we have also removed the interseismic trend measured prior to the 2010 Maule earthquake to thus account only for the postseismic effects following the 2010 Maule event (Figure 2).
Results
The surface displacements are presented in Figure 2 and the coseismic and postseismic CFS changes are presented in Figures 3, 4. Finally, we compare the cumulative CFS changes with the seismicity between the 2010 Maule and 2015 Illapel events, including the Illapel main shock.
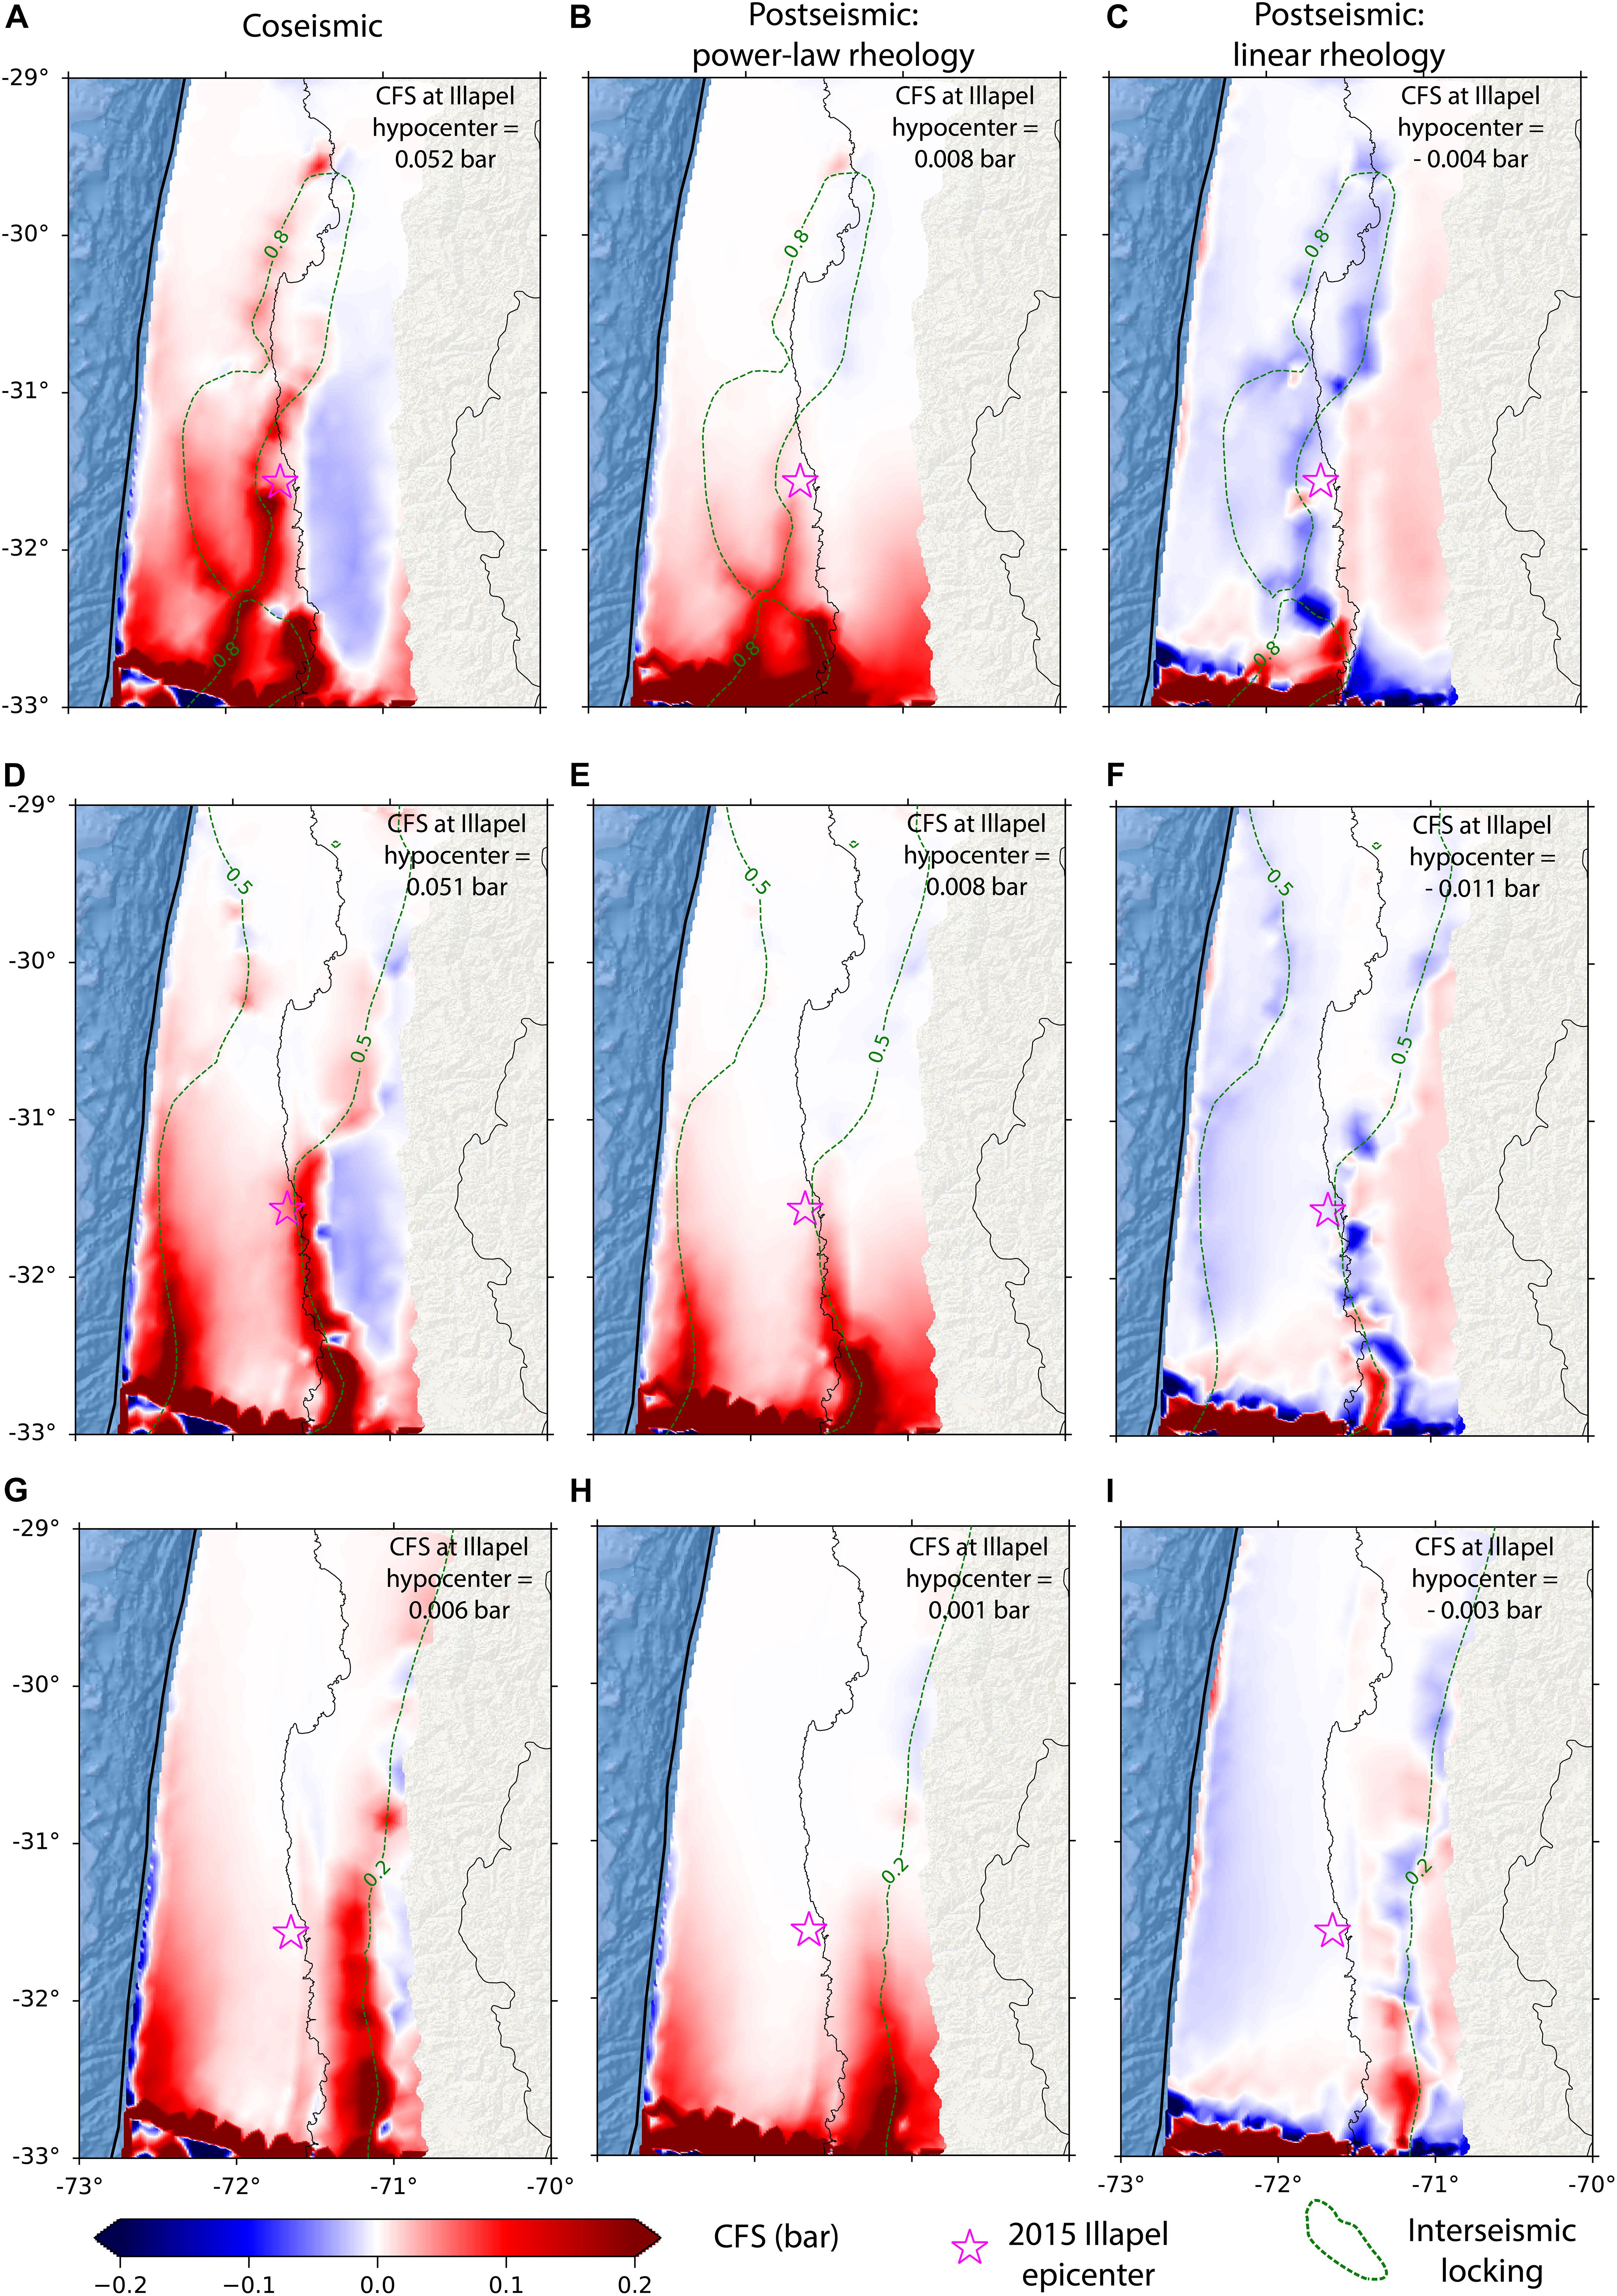
Figure 3. Coulomb Failure Stress (CFS) changes resolved onto the fault interface from the modeled coseismic (left column) and postseismic deformation using power-law (middle column) and linear rheology (right column) in the Illapel segment (location given as the black-dashed rectangle in Figure 2). CFS changes are calculated using focal mechanism parameters of the 2015 Illapel mainshock with a strike of 353°, a dip of 19°, and a rake of 83°. (A–C) (upper row) are from scenario I (μ′ = 0.04 in regions of locking ≥ 0.8 and μ′ = 0.01 in regions of locking < 0.8). (D–F) (middle row) are from scenario II (μ′ = 0.04 in regions of locking ≥ 0.5 and μ′ = 0.01 in regions of locking < 0.5); and (G–I) are from scenario III (μ′ = 0.04 in regions of locking ≥ 0.2 and μ′ = 0.01 in regions of locking < 0.2). The locking region ≥ 0.2 in (G–I) is the one between the dashed-green line and the trench (solid-black line).
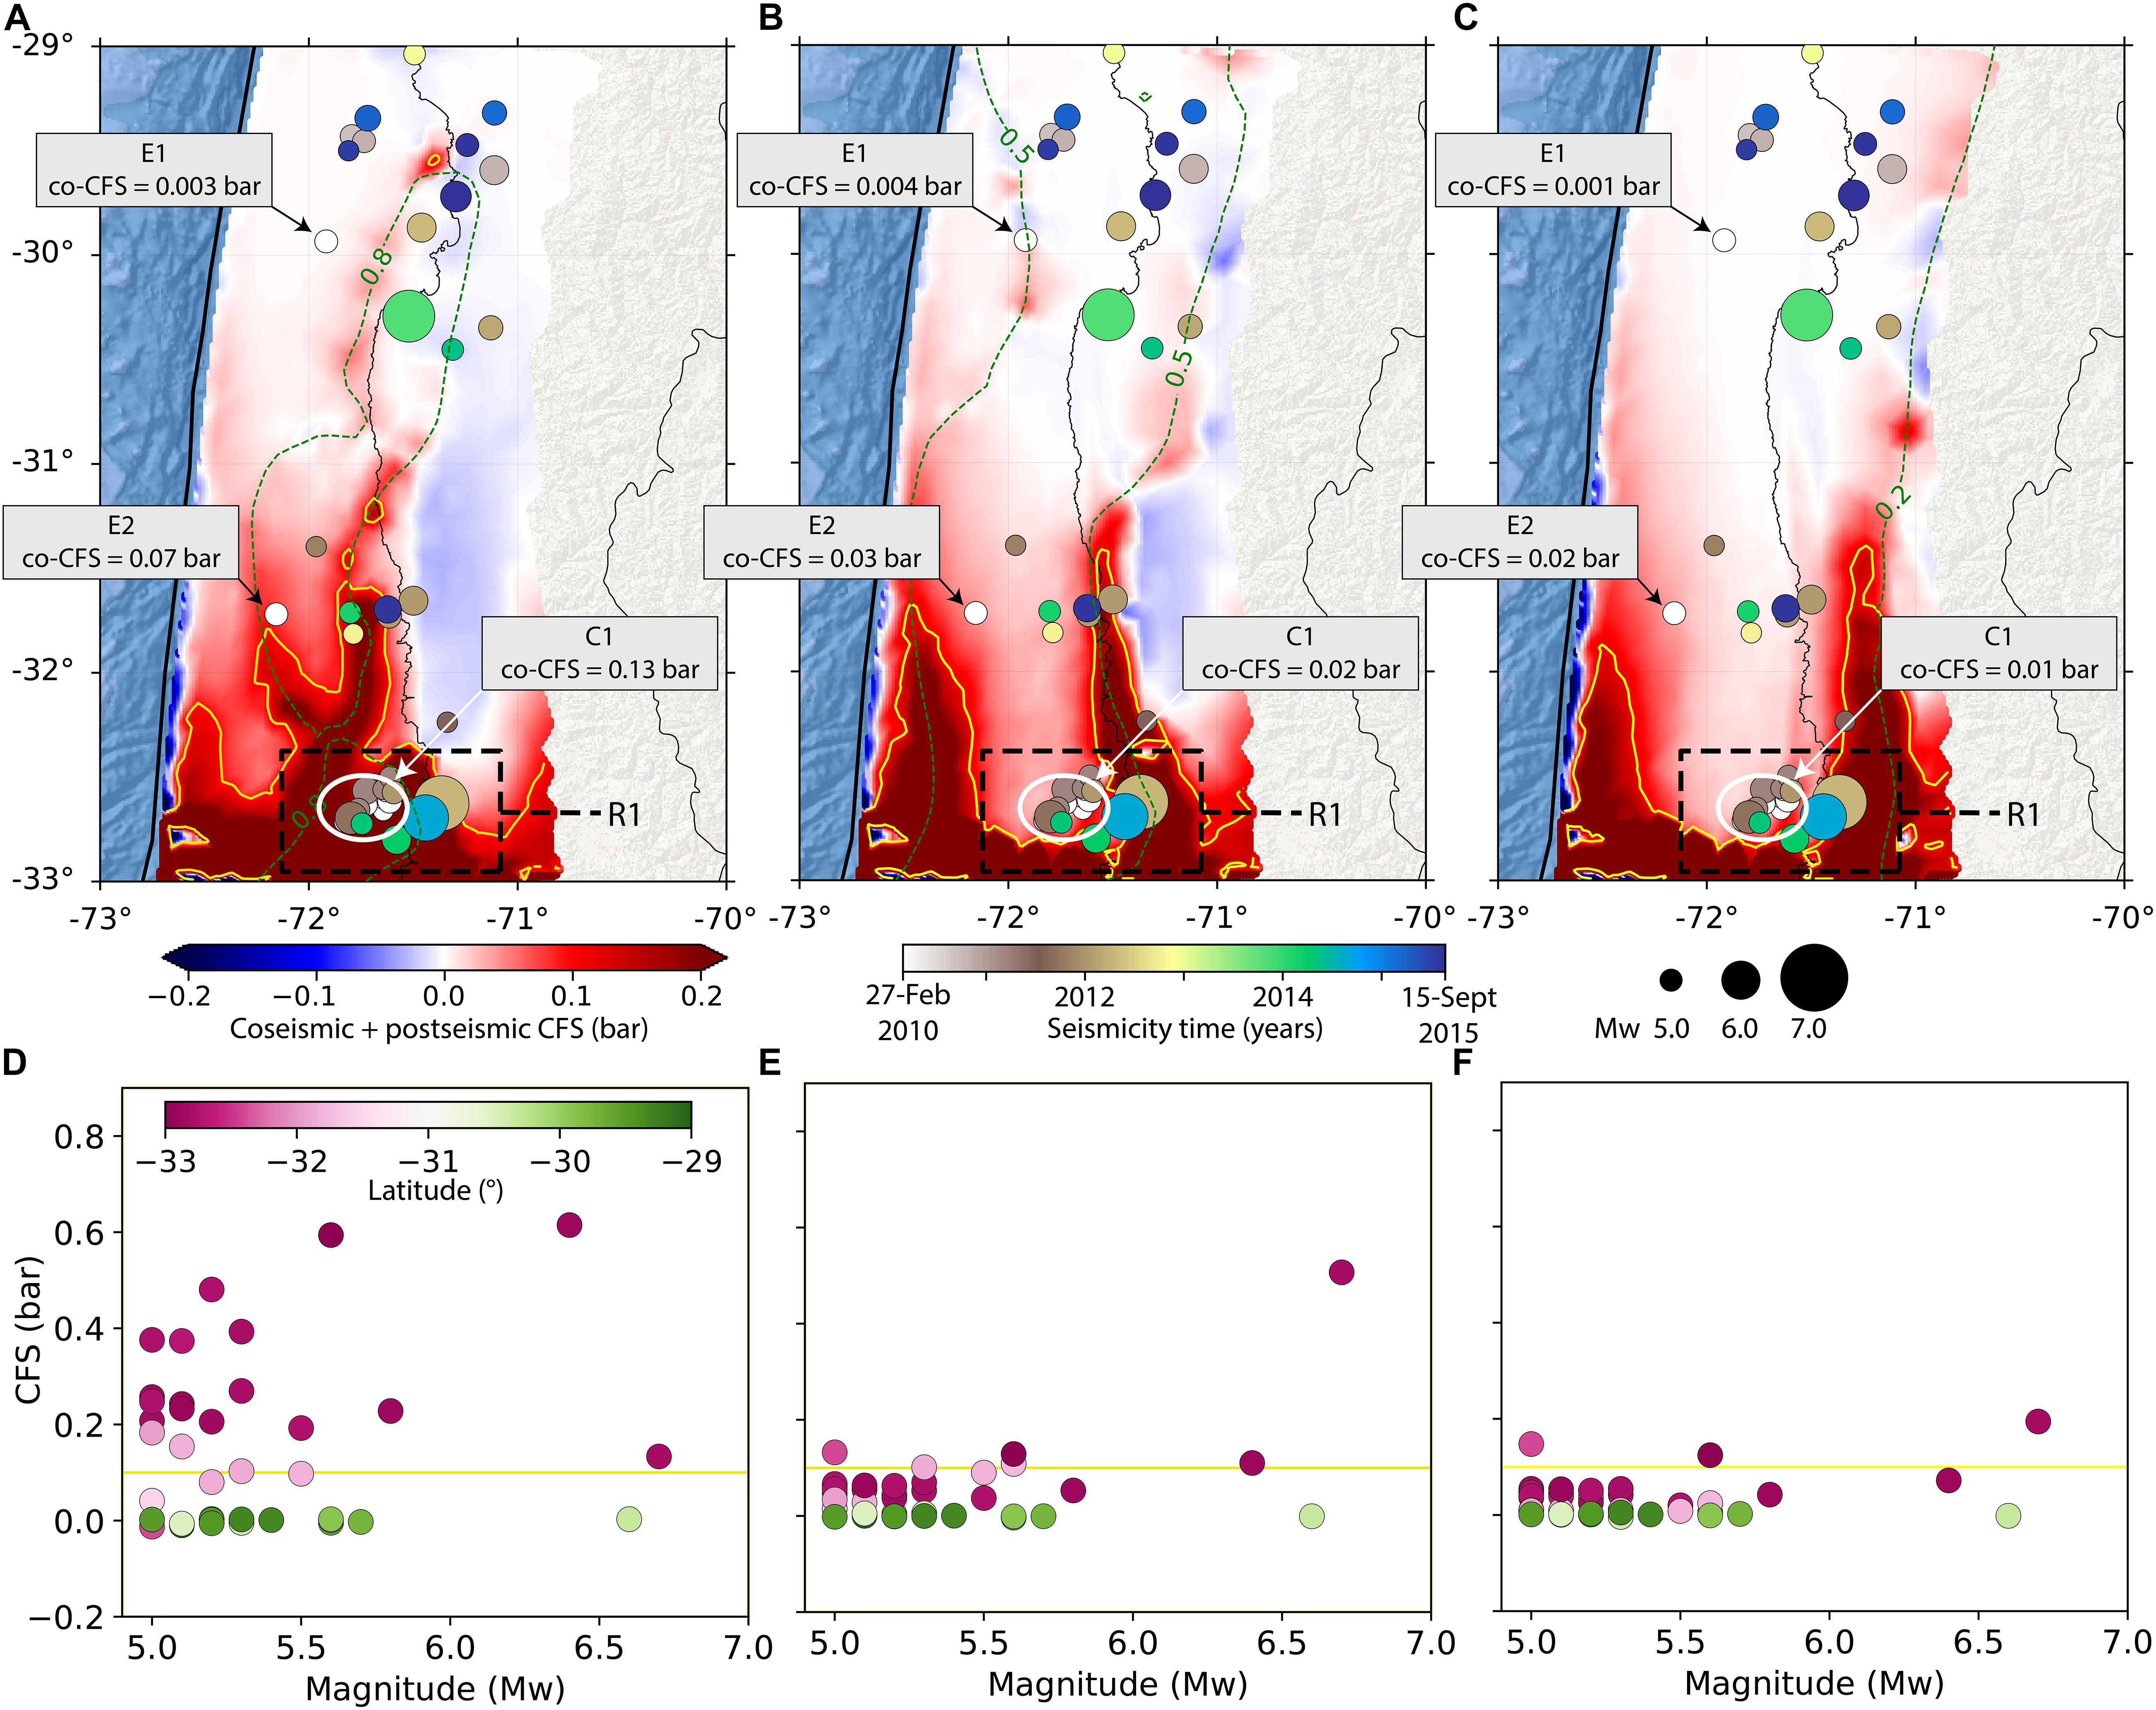
Figure 4. Total CFS (coseismic plus postseismic) changes extracted from the power-law rheology model results and seismicity Mw ≥ 5.0 (USGS-NEIC catalog) in the Illapel segment between the 2010 and 2015 events associated for scenarios I (A), II (B), and III (C). The receiver fault parameters are the same as Figure 3. Upper panel exhibit the sum of the CFS as shown in Figures 3A,B,D.E,G,H. The solid-yellow contours depict zones of CFS changes ≥ 0.1 bar. (D–F) in the lower panel display the total CFS calculated at each seismicity hypocenter versus seismicity magnitude for scenarios in (A–C), respectively. As in Figure 3, the locking region ≥ 0.2 in (C) is the one between the dashed-green line and the trench (solid-black line).
Surface Displacements Patterns
Figure 2 shows the cumulative GPS displacements between the 2010 Maule and 2015 Illapel earthquakes versus the modeled ones. In the Maule rupture zone, the predicted horizontal displacements from the modeled afterslip and viscoelastic relaxation do not exhibit large differences between the linear or power-law model rheology. However, this is not the case for the patterns in the Illapel segment. There, the observations display landward displacement patterns with a strong north component and a maximum cumulative displacement of 3.9 cm after ∼5.5 years. By comparing the GPS data with model predictions, we find that the model with power-law rheology can better explain those observed postseismic landward patterns than the linear rheology case. The power-law rheology simulation results in landward motion with a mostly eastwards azimuth and with a similar average magnitude compared to the observations (dashed-line rectangle in Figure 2A). This simulation also shows a maximum displacement at approximately 30.5° South, decreasing to the north and to the south from this latitude. This is also in agreement with the GPS data. Conversely, the linear rheology case results in trenchward motion, with a dominant northwest direction and slightly larger magnitude than the observed horizontal displacement (Figure 2B). Given that the afterslip distributions from both rheology model cases show similar magnitude and patterns in the closest region to the Illapel segment (Figure 2), the main deviations in their resulting horizontal displacement patterns are due to differences in location of viscous relaxation from the rheology model choice. In the power-law rheology case, most of the viscous relaxation occurs in the continental lower crust, beneath the volcanic arc. Conversely, in the linear rheology case in the continental mantle wedge, beneath the forearc, as well as in the oceanic mantle (see Figure 8 in Peña et al., 2020).
CFS Changes
We also estimate the CFS changes in the Illapel segment to evaluate to what extent the Maule earthquake may have triggered the seismicity in the Illapel segment and subsequently the 2015 Illapel main shock (Figures 3, 4). The CFS changes are calculated on the megathrust fault interface for regions shallower than 60 km depth (enclosed pink area in Figure 1). Additionally, since we are interested in evaluating the CFS changes on the fault interface, we use the focal mechanism parameter of the 2015 Illapel earthquake from the USGS National Earthquake Information Center (NEIC), which reported a strike of 353°, a dip of 19°, and a rake of 83°. We also use the same receiver fault parameters for inferring the CFS changes at the hypocenters of the seismicity between the 2010 Maule and 2015 Illapel events, since most of the events share the same focal mechanisms as the Illapel main shock, especially for events > Mw 5.7 (Supplementary Figure 2). We also investigated the potential role of variations of the receiver fault parameters by exploring plausible variations of the focal mechanisms of the seismic events, but we found only minor effects (Supplementary Figures 3–7). Thus, we first present the impact due to the choice of model rheology for the calculation of the CFS changes at the hypocenter of the 2015 Illapel main shock. Figure 4 shows the CFS changes from the preferred model alongside the seismicity recorded between the Maule and Illapel events. This seismicity catalog is also acquired from the NEIC.
Figure 3 shows the resulting CFS changes induced by coseismic and postseismic deformation of the Maule earthquake in the Illapel segment. As described in the model setup section, we consider three cases with friction zonation on the fault interface by assigning a higher effective coefficient of friction (μ′ = 0.04) to regions where the locking degree is ≥0.8, 0.5, and 0.2 than its surroundings (μ′ = 0.01). These we hereafter label as scenario I, II, and III, respectively. Although the choice of the friction zonation has an impact on the resulting CFS changes (Figure 3), it has a negligible effect on the resulting displacement patterns. The largest CFS changes are found in regions closest to the 2010 Maule rupture region, with a maximum magnitude close to 1 bar (0.1 MPa) that decreases northwards to values smaller than 0.001 bar. For the postseismic period, the model with power-law rheology results in positive CFS changes, while the one with linear rheology leads to negative values. We find that the coseismic stress transfer dominates the CFS changes in all three scenarios. It accounts for approximately 85% of the total CFS changes at the hypocenter of Illapel main shock (Figures 3A,D,G). At the Illapel main shock hypocenter, the coseismic CFS changes are 0.052, 0.051, and 0.006 bar for scenarios I, II, and III, respectively (Figures 3A,D,G). For the postseismic period using the power-law rheology model, the postseismic CFS changes are 0.008, 0.008, and 0.001 bar for scenarios I, II, and III, respectively (Figures 3B,E,H). On the contrary, negative CFS changes are found from the linear rheology model during the postseismic period. Here, we find CFS changes of −0.004, −0.011, and −0.003 bar for scenarios I, II, and III, respectively (Figures 3C,F,I).
Since the model with power-law rheology can better explain the landward GPS displacements, we continue our analysis using the CFS results from this model and compare to seismic events with Mw ≥ 5.0 between the 2010 Maule and Illapel events. The seismicity is mostly located in the surroundings of highly locked regions (≥0.8) as shown in Figure 4A. These events also fall well inside regions of higher CFS changes compared to scenarios II and III (Figures 4A–C). In particular, sixteen events in the southern part of the segment, as shown in region R1 (black dashed rectangle in Figure 4A), occurred in regions of CFS changes larger than 0.1 bar (Figures 4A,D). On the other hand, in the same region R1, we find five and four events for scenarios II and III, respectively, with CFS changes ≥ 0.1 bar (Figures 4B,C,E,F). Additionally, in all scenarios, the CFS changes at the hypocenter of the largest event with magnitude Mw 6.7 (April 17, 2012) is higher than 0.1 bar (Figures 4D,E,F). Moreover, Figures 4A–C and Supplementary Figure 1 show that soon after the 2010 Maule earthquake, two events with magnitude Mw 5.2 occurred 30 min (E2, ∼31.7°S) and 6 days after the Maule event (E1, ∼29.9°S), while a seismicity cluster C1 (∼32.6°S) composed of 6 events with magnitudes Mw 5.0—5.3 occurred 9 days after the Maule main shock. Our results indicate that the coseismically positive CFS changes calculated at E1, E2, and C1 prevail in scenario I with 0.003 bar, 0.06 bar, and 0.13 bar, respectively; however, the CFS for E1 in scenario II is slightly larger than in scenario I (with 0.004 bar).
Discussion
Landward deformation patterns following megathrust earthquakes have been observed by modern GPS data (e.g., Heki and Mitsui, 2013; Melnick et al., 2017), but their controlling mechanism is not fully understood. Our results show that the choice of rheology has a large effect on the azimuth of deformation at segments adjacent to the mainshock. Here, an upper mantle with homogenous and linear viscoelastic material properties cannot predict the observed landward pattern. In contrast, a model considering second-order, power-law rheology in the crust and upper mantle can better explain this pattern (Figure 2A). An alternative approach to explain this pattern is the one of Klein et al. (2016), who considered an upper mantle with Burgers rheology, as well as a deep subduction channel with low viscosities (∼1017 Pa s). On the other hand, Yuzariyadi and Heki (2020) showed that a generic 3D model with linear Maxwell rheology in the upper mantle exhibited trenchward patterns. Because of this discrepancy with the GPS data, Yuzariyadi and Heki (2020) hypothesized that deep slab acceleration may also play a key role, in agreement with the study of Heki and Mitsui (2013). Nevertheless, our findings indicate that the surface displacement patterns from the 3D forward model of Yuzariyadi and Heki (2020) are produced by the simplicity of the rheological structure of their model, which considers a linear viscoelastic mantle, whose viscosity is homogeneously distributed in the whole upper mantle, and a fully elastic crust.
Even though the fit of the postseismic displacement with the forward model that uses non-linear rheology is much better in comparison with linear viscoelastic implementation, it cannot perfectly predict the north component of the GPS signal. However, this has hardly any impact on the estimates of the CFS changes as the stress traction vector is resolved in the rake vector direction of 83° from the Illapel earthquake, which means that there is marginally any contribution from the north component of the displacement to the stress changes.
The CFS changes produced by the coseismic and postseismic deformation of the Maule event are relatively small. Nevertheless, these small values are sufficient to trigger seismicity, as statically shown in other subduction and strike-system settings with a threshold magnitude as small as 0.1 bar (e.g., Stein, 1999, and references therein; Ziv and Rubin, 2000). Moreover, laboratory-derived, rate-and-state friction laws predict that small CFS changes can promote the increase of seismicity (e.g., Stein, 1999, and references therein). Notably, in the southern region R1 (Figure 4A), five events Mw ≥ 5.5 occurred in regions with a change of CFS > 0.1 bar (Figure 4D). Our findings reveal that at the hypocenter of the two larger events (Mw 6.4 and 6.7) the CFS increased by ∼0.63 and 0.14 bar, respectively. Furthermore, our results indicate a potential triggering of the events in region R1 due to the joint contribution of coseismic and postseismic deformation (Figure 4A).
Yet, no strong increase in seismicity rate changes has been reported after the 2010 Maule event in the whole Illapel segment (Supplementary Figure 7 and Heidarzadeh et al., 2016; Poli et al., 2017; Ruiz et al., 2016), but so far only events ≥ Mw 4.0 have been considered. Huang and Meng (2018) used data provided by the Centro Sismológico Nacional de Chile (CSN) to extract repeating earthquakes (Mw ≥ 2.5), employing a matched-filter-enhanced method. They considered ∼4 years before the Illapel earthquake and found an increase of seismic activity in the Illapel segment 100 days before the Illapel main shock but it remains unclear how seismicity evolved in the first ∼2 years following the 2010 Maule event, a period in which the postseismic deformation associated to the Maule event prevails (e.g., Bedford et al., 2016; Klein et al., 2016; Peña et al., 2020). As shown by Toda et al. (2011) for the case of the enhanced seismicity rates following the 2011 Tohoku-Oki earthquake in Japan, an enhanced seismic catalog considering M ≤ 4.0 events may provide key information to ultimately evaluate the triggering of the events in the southern region under the CFS criteria.
On the other hand, at the hypocenter of the Illapel main shock and events further north, the calculated CFS changes (<0.06 bar) are below the assumed threshold CFS of 0.1 bar. Furthermore, if we use the shear stress drop of 30–60 bar of the Illapel earthquake estimated by Yin et al. (2016) with a 3D kinematic model and assuming that this shear stress has been accumulated since the previous Mw 7.9 event on the same segment in 1944 (Beck et al., 1998), the annual shear stress loading rate would be between 0.42-0.84 bar/yr. Changes in the normal stress due to overburden can be assumed to be very small. Consequently, the CFS changes of ∼0.06 bar that is transferred co- and postseismically to the Illapel hypocenter represent only 7-14% of the annual loading rate. Thus, given that the CFS changes are below the threshold of 0.1 bar and the small clock-advance of approximately a few months only, we have two options how to interpret the results. Either there is no triggering and earthquake occurrence is a Poisson process in subduction zones, or another mechanism is acting that is not represented in the model used for the stress transfer calculations.
Additional processes transferring CFS more efficiently may be related to dynamic triggering due to the passage of seismic waves (e.g., Gomberg et al., 2001; Freed, 2005; van der Elst and Brodsky, 2010), or changes in pore pressure due to changes in the permeability in the fault interface (e.g., Brodsky et al., 2003; Elkhoury et al., 2006; Manga et al., 2012). The first one may change the state of the stresses of the medium due to the passage of the seismic waves, both at near and remote distances, but is a very short-term mechanism (e.g., Freed, 2005; van der Elst and Brodsky, 2010). Given the small coseismically CFS values inferred at the hypocenter of very short-term events E1 (0.003 bar) and E2 (0.07 bar, Figure 4A), 9 days and 30 min after the Maule event, respectively (Supplementary Figure 1), dynamic wave processes are likely candidates for the occurrence of these events. On the other hand, pore-fluid processes last longer and produce surface deformation patterns confined close to the rupture zone, i.e., mostly offshore at subduction zones, rather than at further distance (e.g., Masterlark, 2003; Hu et al., 2014; McCormack et al., 2020). Particularly, pore pressure changes would significantly affect the effective normal stresses (e.g., Brodsky et al., 2003; Elkhoury et al., 2006; Hughes et al., 2010; Manga et al., 2012), and would also explain the delay in response due to the slow diffusion of the fluids. In addition, its resulting surface displacement field is generally smaller than that from viscous relaxation, although the CFS changes are larger than those from viscous relaxation only (Masterlark et al., 2001; Hughes et al., 2010). Therefore, our CFS calculations in the Illapel segment during the postseismic period may be underestimated by not considering pore-pressure processes. Its integration into the 3D model would require further constraints from geodetic observations, potentially from InSAR data using its high spatial resolution.
Conclusion
We examine the co- and postseismic deformation and stress change pattern on the Illapel segment induced by the 2010 Maule earthquake using a 3D geomechanical-numerical model with linear and power-law rheology. Our results show that the postseismic horizontal deformation patterns in the Illapel segment are particularly sensitive to the choice of the rheology model. Here, the power-law rheology model can better explain both the landward directions and magnitude of the cumulative GPS displacement vectors. The opposite surface displacement patterns from the choice of rheology also have a major impact on the resulting postseismic CFS changes, but compared to the co-seismic stress transfer, only 15% of the CFS changes are transferred postseismically to the hypocenter location of the 2015 Illapel earthquake. From magnitudes of CFS changes it seems quite unlikely that the Illapel earthquake was triggered by the Maule event - such a small CFS change of <0.06 bar at the hypocenter converts to a clock-advance of approximately 2 months. This finding would not change with a better fit of the modeled north component of the GPS observation. Hence, either no triggering occurred or a local secondary process such a pore-pressure changes, which is not considered here, potentially contributed to a remote triggering mechanism.
We also compared the cumulative CFS changes to the seismicity that occurred between the Maule and Illapel events, using the model with the power-law rheology. Here, particularly in the southern region of the Illapel segment, sixteen seismic events occurred in regions of positive CFS changes above the triggering threshold of 0.1 bar, indicating a potential triggering because of the Maule event. Therefore, our study emphasizes the importance of using power-law rheology models to also investigate surface landward patterns and stress changes induced by megathrust earthquakes in neighboring segments. Future investigation should especially focus on assessing the transfer of stresses from the 2014 Iquique in its southern segment (Loa segment) and from the 2015 Illapel earthquake in its northern segment (Atacama segment), gaps remaining with potential magnitudes exceeding M 8.0.
Data Availability Statement
Publicly available datasets were analyzed in this study. This data can be found here: Melnick D. et al. (2017). “The super-interseismic phase of the megathrust earthquake cycle in Chile.” Geophysical Research Letters 44 (2): 784–791. https://doi.org/10.1002/2016GL071845.
Author Contributions
CP: conceptualization, methodology, software, validation, formal analysis, investigation, writing – original draft, writing – review & editing, visualization, supervision, project administration, and funding acquisition. OH: conceptualization, methodology, formal analysis, investigation, resources, writing – original draft, writing – review & editing, supervision, project administration, and funding acquisition. MM: conceptualization, writing – review & editing. DM: conceptualization, formal analysis, investigation, writing – review & editing. OO: conceptualization, writing – review & editing. All authors contributed to the article and approved the submitted version.
Funding
This work was supported by Initiative and Networking Fund of the Helmholtz Association through the project “Advanced Earth System Modeling Capacity (ESM).” DM and MM acknowledge financial support from the Millennium Nucleus CYCLO (The Seismic Cycle Along Subduction Zones) funded by the Millennium Scientific Initiative (ICM) of the Chilean Government grant NC160025, Chilean National Fund for Development of Science and Technology (FONDECYT) grants 1181479 and 1190258, and the ANID PIA Anillo ACT192169. MM acknowledges support from CONICYT/FONDAP 15110017.
Conflict of Interest
The authors declare that the research was conducted in the absence of any commercial or financial relationships that could be construed as a potential conflict of interest.
Acknowledgments
CP would like to thank the Initiative and Networking Fund of the Helmholtz Association through the project “Advanced Earth System Modelling Capacity (ESM).” The authors would also thank Jonathan Bedford for his helpful comments on the manuscript. The authors are grateful to the editor, QQ, and the three reviewers, QZ, C-HC, and LG, for their constructive comments. All data used are properly cited in the reference list, figures, and tables.
Supplementary Material
The Supplementary Material for this article can be found online at: https://www.frontiersin.org/articles/10.3389/feart.2021.644834/full#supplementary-material
References
Beck, S., Barrientos, S., Kausel, E., and Reyes, M. (1998). Source characteristics of historic earthquakes along the central Chile subduction zone. J. South Am. Earth Sci. 11, 115–129.
Bedford, J., Moreno, M., Li, S., Oncken, O., Baez, J. C., Bevis, M., et al. (2016). Separating rapid relocking, afterslip, and viscoelastic relaxation: an application of the postseismic straightening method to the Maule 2010 cGPS. J. Geophys. Res. Solid Earth 121, 7618–7638. doi: 10.1002/2016JB013093
Brodsky, E. E., Roeloffs, E., Woodcock, D., Gall, I., and Manga, M. (2003). A mechanism for sustained groundwater pressure changes induced by distant earthquakes. J. Geophys. Res. 108:2390. doi: 10.1029/2002JB002321
Christensen, N. (1996). Poissoñs ratio and crustal seismology. J. Geophys. Res. 101, 3139–3156. doi: 10.1029/95JB03446
Dielforder, A., Hetzel, R., and Oncken, O. (2020). Megathrust shear force controls mountain height at convergent plate margins. Nature 582, 225–229. doi: 10.1038/s41586-020-2340-7
Elkhoury, J., Brodsky, E., and Agnew, D. (2006). Seismic waves increase permeability. Nature 441, 1135–1138. doi: 10.1038/nature04798
Freed, A. (2005). Earthquake triggering by static, dynamic, and postseismic stress transfer. Annu. Rev. Earth Planet. Sci. 33, 335–367. doi: 10.1146/annurev.earth.33.092203.122505
Freed, A. M., and Lin, J. (2001). Delayed triggering of the 1999 Hector Mine earthquake by viscoelastic stress transfer. Nature 411, 180–183. doi: 10.1038/35075548
Gomberg, J., Reasenberg, P., Bodin, P., and Harris, R. A. (2001). Earthquake triggering by seismic waves following the landers and hector mine earthquakes. Nature 411, 462–466. doi: 10.1038/35078053
Hardebeck, J. L., and Loveless, J. P. (2018). Creeping subduction zones are weaker than locked subduction zones. Nature Geosci. 11, 60–64. doi: 10.1038/s41561-017-0032-1
Hayes, G., Wald, D., and Johnson, R. (2012). Slab1.0: a three-dimensional model of global subduction zone geometries. J. Geophys. Res. Solid Earth 117:B01302. doi: 10.1029/2011JB008524
Heidarzadeh, M., Murotani, S., Satake, K., Ishibe, T., and Gusman, A. R. (2016). Source model of the 16 September 2015 Illapel, Chile, Mw 8.4 earthquake based on teleseismic and tsunami data. Geophys. Res. Lett. 43, 643–650. doi: 10.1002/2015GL067297
Heki, K., and Mitsui, Y. (2013). Accelerated pacific plate subduction following interplate thrust earthquakes at the Japan trench. Earth Planet. Sci. Lett. 363, 44–49. doi: 10.1016/j.epsl.2012.12.031
Hergert, T., and Heidbach, O. (2006). New insights in the mechanism of postseismic stress relaxation exemplified by the June 23rd 2001 Mw =8.4 earthquake in southern Peru. Geophys. Res. Lett. 33:L02307. doi: 10.1029/2005GL024585
Hirth, G., and Kohlstedt, D. (2003). Rheology of the Upper Mantle and the Mantle Wedge: A View From the Experimentalists. Hoboken, NJ: Blackwell Publishing Ltd, 83–105. doi: 10.1029/138GM06 Inside the subduction Factory.
Hu, Y., Bürgmann, R., Freymueller, J., Banerjee, P., and Wang, K. (2016). Contributions of poroelastic rebound and a weak volcanic arc to the postseismic deformation of the 2011 Tohoku earthquake. Earth Planets Space 66:106. doi: 10.1186/1880-5981-66-106
Hu, Y., Bürgmann, R., Uchida, N., Banerjee, P., and Freymueller, J. T. (2016), Stress-driven relaxation of heterogeneous upper mantle and time-dependent afterslip following the 2011 Tohoku earthquake. J. Geophys. Res. Solid Earth 121, 385–411. doi: 10.1002/2015JB012508
Hu, Y., Wang, K., He, J., Klotz, J., and Khazaradze, G. (2004). Three-dimensional viscoelastic finite element model for postseismic deformation of the great 1960 Chile earthquake J. Geophys. Res. 109:B12403. doi: 10.1029/2004JB003163
Huang, H., and Meng, L. (2018). Slow unlocking processes preceding the 2015 Mw 8.4 Illapel. Chile, earthquake. Geophys. Res. Lett. 45, 3914–3922. doi: 10.1029/2018GL077060
Hughes, K. L., Masterlark, T., and Mooney, W. (2010). Poroelastic stress-triggering of the 2005 M8. 7 Nias earthquake by the 2004 M9. 2 Sumatra–Andaman earthquake. Earth Planet. Sci. Lett. 293, 289–299. doi: 10.1016/j.epsl.2010.02.043
Khazaradze, G., Wang, K., Klotz, J., Hu, Y., and He, J. (2002). Prolonged post-seismic deformation of the 1960 great Chile earthquake and implications for mantle rheology. Geophys. Res. Lett. 29, 7–1. doi: 10.1029/2002GL015986
King, G. C. P., Stein, R. S., and Lin, J. (1994). Static stress changes and the triggering of earthquakes. Bull. seism. Soc. Am. 4, 935–953.
Klein, E., Fleitout, L., Vigny, C., and Garaud, J. D. (2016). Afterslip and viscoelastic relaxation model inferred from the large-scale postseismic deformation following the 2010 Mw 8.8 Maule earthquake (Chile). Geophys. J. Int. 205, 1455–1472. doi: 10.1093/gji/ggw086
Loveless, J. P. (2017). Super-interseismic periods: redefining earthquake recurrence. Geophys. Res. Lett. 44, 1329–1332. doi: 10.1002/2017GL072525
Manga, M., Beresnev, I., Brodsky, E. E., Elkhoury, J. E., Elsworth, D., Ingebritsen, S. E., et al. (2012). Changes in permeability caused by transient stresses: field observations, experiments, and mechanisms. Rev. Geophys. 50:RG2004. doi: 10.1029/2011RG000382
Masterlark, T., DeMets, C., Wang, H. F., Sánchez, O., and Stock, J. (2001). Homogeneous vs. realistic heterogeneous subduction zone models: coseismic and postseismic deformation. Geophys. Res. Lett. 28, 4047–4050.
Masterlark, T. (2003). Finite element model predictions of static deformation from dislocation sources in a subduction zone: sensitivities to homogeneous, isotropic, Poisson-solid, and half-space assumptions. Geophys. Res. Solid Earth 108, ETG 7-1–ETG 7-17. doi: 10.1029/2002JB002296
McCloskey, J., Nalbant, S. S., and Steacy, S. (2005). Earthquake risk from co-seismic stress. Nature 434, 291–291.
McCormack, K., Hesse, M. A., Dixon, T. H., and Malservisi, R. (2020). Modeling the contribution of poroelastic deformation to postseismic geodetic signals. Geophys. Res. Lett. 47:e2020GL086945. doi: 10.1029/2020GL086945
Melnick, D., Moreno, M., Quinteros, J., Baez, J. C., Deng, Z., Li, S., et al. (2017). The super-interseismic phase of the megathrust earthquake cycle in Chile. Geophys. Res. Lett. 44, 784–791. doi: 10.1002/2016GL071845
Moreno, M., Li, S., Melnick, D., Bedford, J. R., Baez, J. C., and Motagh, M. (2018). Chilean megathrust earthquake recurrence linked to frictional contrast at depth. Nat. Geosci. 11, 285–290. doi: 10.1038/s41561-018-0089-5
Moreno, M., Melnick, D., Rosenau, M., Baez, J., Klotz, J., Oncken, O., et al. (2012). Toward understanding tectonic control on the Mw 8.8 2010 Maule Chile earthquake. Earth Planet. Sci. Lett. 321–322, 152–165. doi: 10.1016/j.epsl.2012.01.006
Peña, C., Heidbach, O., Moreno, M., Bedford, J., Ziegler, M., Tassara, A., et al. (2019). Role of lower crust in the postseismic deformation of the 2010 maule earthquake: insights from a model with power-law rheology. Pure Appl. Geophys. 176, 3913–3928. doi: 10.1007/s00024-018-02090-3
Peña, C., Heidbach, O., Moreno, M., Bedford, J., Ziegler, M., Tassara, A., et al. (2020). Impact of power-law rheology on the viscoelastic relaxation pattern and afterslip distribution following the 2010 Mw 8.8 Maule earthquake. Earth Planet. Sci. Lett. 542:116292. doi: 10.1016/j.epsl.2020.116292
Poli, P., Maksymowicz, A., and Ruiz, S. (2017). The Mw 8.3 Illapel earthquake (Chile): preseismic and postseismic activity associated with hydrated slab structures. Geology 45, 247–250.
Pollitz, F. F., Banerjee, P., Bürgmann, R., Hashimoto, M., and Choosakul, N. (2006). Stress changes along the Sunda trench following the 26 December 2004 Sumatra-Andaman and 28 March 2005 Nias earthquakes. Geophys. Res. Lett. 33:L06309. doi: 10.1029/2005GL024558
Qiu, Q., and Chan, C.-H. (2019). Coulomb stress perturbation after great earthquakes in the Sumatran subduction zone: potential impacts in the surrounding region. J. Asian Earth Sci. 180:103869. doi: 10.1016/j.jseaes.2019.103869
Ranalli, G. (1997). Rheology and deep tectonics. Annali di Geofisica X, 671–780. doi: 10.4401/ag-3893
Ruiz, S., Klein, E., del Campo, F., Rivera, E., Poli, P., Metois, M., et al. (2016). The seismic sequence of the 16 September 2015 Mw 8.3 Illapel, Chile, Earthquake. Seismol. Res. Lett. 87, 789–799. doi: 10.1785/0220150281
Stromeyer, D., Heidbach, O., and Ziegler, M. (2020). Tecplot 360 Add-on GeoStress v2.0. GFZ Data Service, Potsdam.
Tassara, A., Götze, H. J., Schmidt, S., and Hackney, R. (2006). Three-dimensional density model of the Nazca plate and the Andean continental margin. J. Geophys. Res. Solid Earth 111:B09404. doi: 10.1029/2005JB003976
Tilmann, F., Zhang, Y., Moreno, M., Saul, J., Eckelmann, F., Palo, M., et al. (2016). The 2015 Illapel earthquake, central Chile: A type case for a characteristic earthquake? Geophys. Res. Lett. 43, 574–583. doi: 10.1002/2015GL066963
Toda, S., Stein, R. S., and Lin, J. (2011). Widespread seismicity excitation throughout central Japan following the 2011 M= 9.0 Tohoku earthquake and its interpretation by Coulomb stress transfer. Geophys. Res. Lett. 38:L00G03. doi: 10.1029/2011GL047834
Tomita, F., Kido, M., Osada, Y., Hino, R., Ohta, Y., and Iinuma, T. (2015). First measurement of the displacement rate of the Pacific Plate near the Japan Trench after the 2011 Tohoku-Oki earthquake using GPS/acoustic technique. Geophys. Res. Lett. 42, 8391–8397. doi: 10.1002/2015GL065746
Tung, S., and Masterlark, T. (2018). Delayed poroelastic triggering of the 2016 October Visso earthquake by the August Amatrice earthquake. Italy. Geophys. Res. Lett. 45, 2221–2229.
van der Elst, N. J., and Brodsky, E. E. (2010). Connecting near-field and far-field earthquake triggering to dynamic strain. J. Geophys. Res. 115:B07311. doi: 10.1029/2009JB006681
Vigny, C., Socquet, A., Peyrat, S., Ruegg, J.-C., Métois, M., Madariaga, R., et al. (2011). The Mw 8.8 Maule megathrust earthquake of central Chile, monitored by GPS. Science 332, 1417–1421. doi: 10.1126/science.1204132
Wang, K., Hu, Y., and He, J. (2012). Deformation cycles of subduction earthquakes in a viscoelastic Earth. Nature 484, 327–332. doi: 10.1038/nature11032
Weiss, J. R., Qiu, Q., Barbot, S., Wright, T. J., Foster, J. H., Saunders, A., et al. (2019). Illuminating subduction zone rheological properties in the wake of a giant earthquake. Sci. Adv. 5:eaax6720. doi: 10.1126/sciadv.aax6720
Yin, J., Yang, H., Yao, H., and Weng, H. (2016). Coseismic radiation and stress drop during the 2015 Mw 8.3 Illapel, Chile megathrust earthquake. Geophys. Res. Lett. 43, 1520–1528. doi: 10.1002/2015GL067381
Yuzariyadi, M., and Heki, K. (2020). “Enhancement of Interplate Coupling after Recent Megathrust Earthquakes,” in EGU General Assembly 2020, Vienna. doi: 10.5194/egusphere-egu2020-2550 Online, 4–8 May 2020, EGU2020-2550.
Keywords: Maule earthquake, Illapel segment, subduction, postseismic deformation, power-law rheology model, earthquake triggering
Citation: Peña C, Heidbach O, Moreno M, Melnick D and Oncken O (2021) Transient Deformation and Stress Patterns Induced by the 2010 Maule Earthquake in the Illapel Segment. Front. Earth Sci. 9:644834. doi: 10.3389/feart.2021.644834
Received: 22 December 2020; Accepted: 22 February 2021;
Published: 22 March 2021.
Edited by:
Qiang Qiu, South China Sea Institute of Oceanology, Chinese Academy of Sciences, ChinaReviewed by:
Qiu Zhong, South China Sea Institute of Oceanology, Chinese Academy of Sciences, ChinaChung-Han Chan, National Central University, Taiwan
Laiyin Guo, Southern University of Science and Technology, China
Copyright © 2021 Peña, Heidbach, Moreno, Melnick and Oncken. This is an open-access article distributed under the terms of the Creative Commons Attribution License (CC BY). The use, distribution or reproduction in other forums is permitted, provided the original author(s) and the copyright owner(s) are credited and that the original publication in this journal is cited, in accordance with accepted academic practice. No use, distribution or reproduction is permitted which does not comply with these terms.
*Correspondence: Carlos Peña, Y2FybG9zcEBnZnotcG90c2RhbS5kZQ==