 Behailu Birhanu
 Seifu Kebede
 Katrina Charles4
 Meron Taye
- 1College of Applied Sciences, Department of Geology, Addis Ababa Science and Technology University, Addis Ababa, Ethiopia
- 2Water and Land Resource Centre, Addis Ababa University, Addis Ababa, Ethiopia
- 3Center for Water Resources Research, School of Agricultural Earth and Environmental Sciences, University of KwaZulu-Natal, Pietermaritzburg, South Africa
- 4School of Geography and the Environment, University of Oxford, Oxford, United Kingdom
- 5International Water Management Institute, Addis Ababa, Ethiopia
- 6Basin Development Authority, Ministry of Water, Irrigation and Electricity, Addis Ababa, Ethiopia
Improving water security is critical to delivering the best outcomes for development. In Ethiopia, the upper Awash sub-basin supports expanding urban and industrial areas, with increasing water demands. Studies have preferentially focused either on surface water hydrology or on groundwater characterization. However, novel tools are required to support the conjunctive use of surface and groundwater for competing users under potential climate change impacts. In this paper, we present research based on a WEAP-MODFLOW link configured for four catchments in the upper Awash sub-basin (Akaki, Melka Kunture, Mojo, and Koka). The Akaki catchment supplies water for Addis Ababa city. Unlike most surface water hydrological models, both supply (surface water and groundwater) and demand (domestic, industrial, and livestock) are modeled. The tool was used to evaluate the impacts of population growth, leakage, expansion of surface and groundwater supply schemes, and climate change scenarios up to the year 2030. Considering the high population growth rate scenario for Addis Ababa city, the unmet domestic water demand may increase to 760 MCM in 2030. Water leakage through poor water supply distribution networks contributed about 23% of the unmet water demand. Though not significant compared with population and water loss stresses, climate change also affect the supply demand condition in the basin. Planning for more groundwater abstraction without considering additional surface water reservoir schemes will noticeably impact the groundwater resource, with groundwater levels projected to decline by more than 20 m. Even more groundwater level decline is observed In the Akaki catchment, where Addis Ababa city is located. Conjunctive use of surface and groundwater not only boosts the supply demand situation in the basin but will lift off some of the stresses from the groundwater resources. Even under the likely increase in temperature and low precipitation climate scenarios, the conjunctive use resulted in a significant increase in domestic water demand coverage from 26% for the reference condition to 90% in 2030, with minimum effect on the groundwater resources. To improve water security conditions through sustainable utilization of both surface and groundwater resources, policy responses need to consider surface and groundwater conjunctive use. Minimizing water leakage should also be given the highest priority.
Introduction
Groundwater is recognized as “the largest and most widely distributed store of freshwater in Africa” (Macdonald et al., 2012), with recent research highlighting its likely resilience to climate variability (Cuthbert et al., 2019). Until recently, the large potential role and contribution of groundwater in water-centered development had not been recognized in Ethiopia. Following a series of regional groundwater assessments, the scope for groundwater use is larger than assumed previously and the knowledge is evolving. According to Mengistu et al. (2019), the years between 2005 and 2015 experienced high groundwater development, mainly concerning improving drinking water supply with coverage increasing from 23 to 56% countrywide. However, this accelerating development of groundwater resources potentially threatens sustainability, unless the resource is understood and integrated with water resources management.
Together with the groundwater resource, surface water is a vital water supply source in the Awash River basin. To better manage the limited water resources in such areas, a systematic understanding of the integrated surface and groundwater system is highly preferred. Conjunctive use of Surface Water and Groundwater (SW-GW) has been widely studied, such as aspects including irrigation water planning (Vedula et al., 2005) soil salinization control (Li et al., 2018), economical evaluation (Rogers and Smith, 1970), surface water-aquifer interaction (Bittinger, 1967), and environmental analyses (Bredehoeft and Young, 1983; Willis et al., 1989; Latif and James, 1991; Yeh, 1992). The studies on conjunctive use have been done by using different tools and on different spatial scales (Marino, 2001) including implementation of linear optimization water allocation algorithm (Condon and Maxwell, 2013), the use of numerical modeling code (Li et al., 2018), application of comprehensive simulation model (POTYLDR-MODFLOW) (Ramireddygari et al., 2000) and development of the integrated regional model (Gaiser et al., 2008).
One tool commonly used as water resources management decision support system (DSS) in North Africa and the Middle East is an integration of the water evaluation and planning (WEAP) tool with the three-dimensional groundwater flow modeling code (MODFLOW) (Almomani and Hamdan, 2009; Maßmann et al., 2012; Hadded et al., 2013; Paper and Georg-august-universit, 2016; Ahmadi et al., 2018; Dehghanipour et al., 2019). In these regions, the methodology has been demonstrated to be feasible for planning and managing SW-GW resources (Fotovat et al., 2019).
However, in Ethiopia, studies focused either on surface water hydrology, without proper consideration of the groundwater resources or on groundwater, with minimum attention to the surface water bodies. This study aims to make use of the WEAP-MODFLOW new generation configuration as an integrated water resource management DSS for the upper Awash sub-basin, Ethiopia. This methodological approach not only supports SW-GW integrated management approach but also considers both supply and demand-side water management perspectives under the changing natural and anthropogenic stresses.
The upper Awash sub-basin is of strategic importance in Ethiopia. An estimated 6 million people are living in the sub-basin, including in the national capital of Addis Ababa (Central Statistical Agency [CSA], 2013). It hosts more than 60% of national industries, and significant agricultural investments, including an estimated 8 million livestock (camel, cattle, sheep, horses, and donkeys) (Authority and Werer, 2017). Previous and current exploitation of surface and groundwater for domestic, industrial, and livestock uses makes the upper Awash sub-basin one of the most important water supply sources in Ethiopia. Given its strategic importance, there is a need to understand the behavior of this water source system and its interaction with the climate conditions and anthropogenic stresses (Taye et al., 2018; Bekele et al., 2019). Therefore, the WEAP-MODFLOW dynamic linkage is configured for water demand-supply conditions of the four catchments that make up the upper Awash sub-basin: Melka Kunture, Akaki, Mojo, and Koka.
Monitoring of groundwater levels is not systematically done in Ethiopia–not even near vital assets such as the Akaki well field which is the main water supply source of Addis Ababa city. Consequently, groundwater levels and storage depletion are the major groundwater-related risks in the country (Harar, Gondar, Mekelle, and Axum) (Kebede, 2016). The lookout for the future is risky for cities such as Addis Ababa given the increasing population, the expansion of the city, and the industries, which use the same water resource. In this study, we will try to measure the potential impact of groundwater abstraction under the changing climate conditions and anthropogenic pressure in the upper Awash sub-basin where Addis Ababa city is located.
Besides, there are considerable estimated water losses from the water supply distribution networks in the order of 30–40% in Addis Ababa (Ministry of Water Resources, 2011). Based on the survey conducted, a significant amount of water leakage has been recorded in the other major settlements in the upper Awash sub-basin (18–22%). Such a loss should have been controlled. Because leaks are not only water losses but also major reasons for the contamination of the water supply systems–with sewage entering into the pipe network. To account contribution of supply side management, implications of minimizing water leakage through old water supply distribution networks are investigated in this study.
Previously, the three surface water reservoirs (Gefersa, Legedadi, and Dire) were the main water supply sources to satisfy the needs of Addis city water demand. However, the increasing water demand forced increased use of groundwater. The contribution of groundwater to the city’s water supply increased from 20 to 67% in the last 15 years creating more stress on the groundwater resource. This study will therefore further explore the importance of planned surface water reservoirs (Gerbi and Sibilu) by Addis Ababa Water and Sewerage Authority (AAWSA) in terms of lifting some of the stresses on the groundwater resource. As suggested by Kebede (2016), in some of the urban centers located in water-stressed areas there is no luxury of turning to alternative remote sources. Gerbi and Sibilu surface water supply reservoirs (Figure 1) are planned to be built by AAWSA outside the upper Awash sub-basin, but very close to the northern boundary.
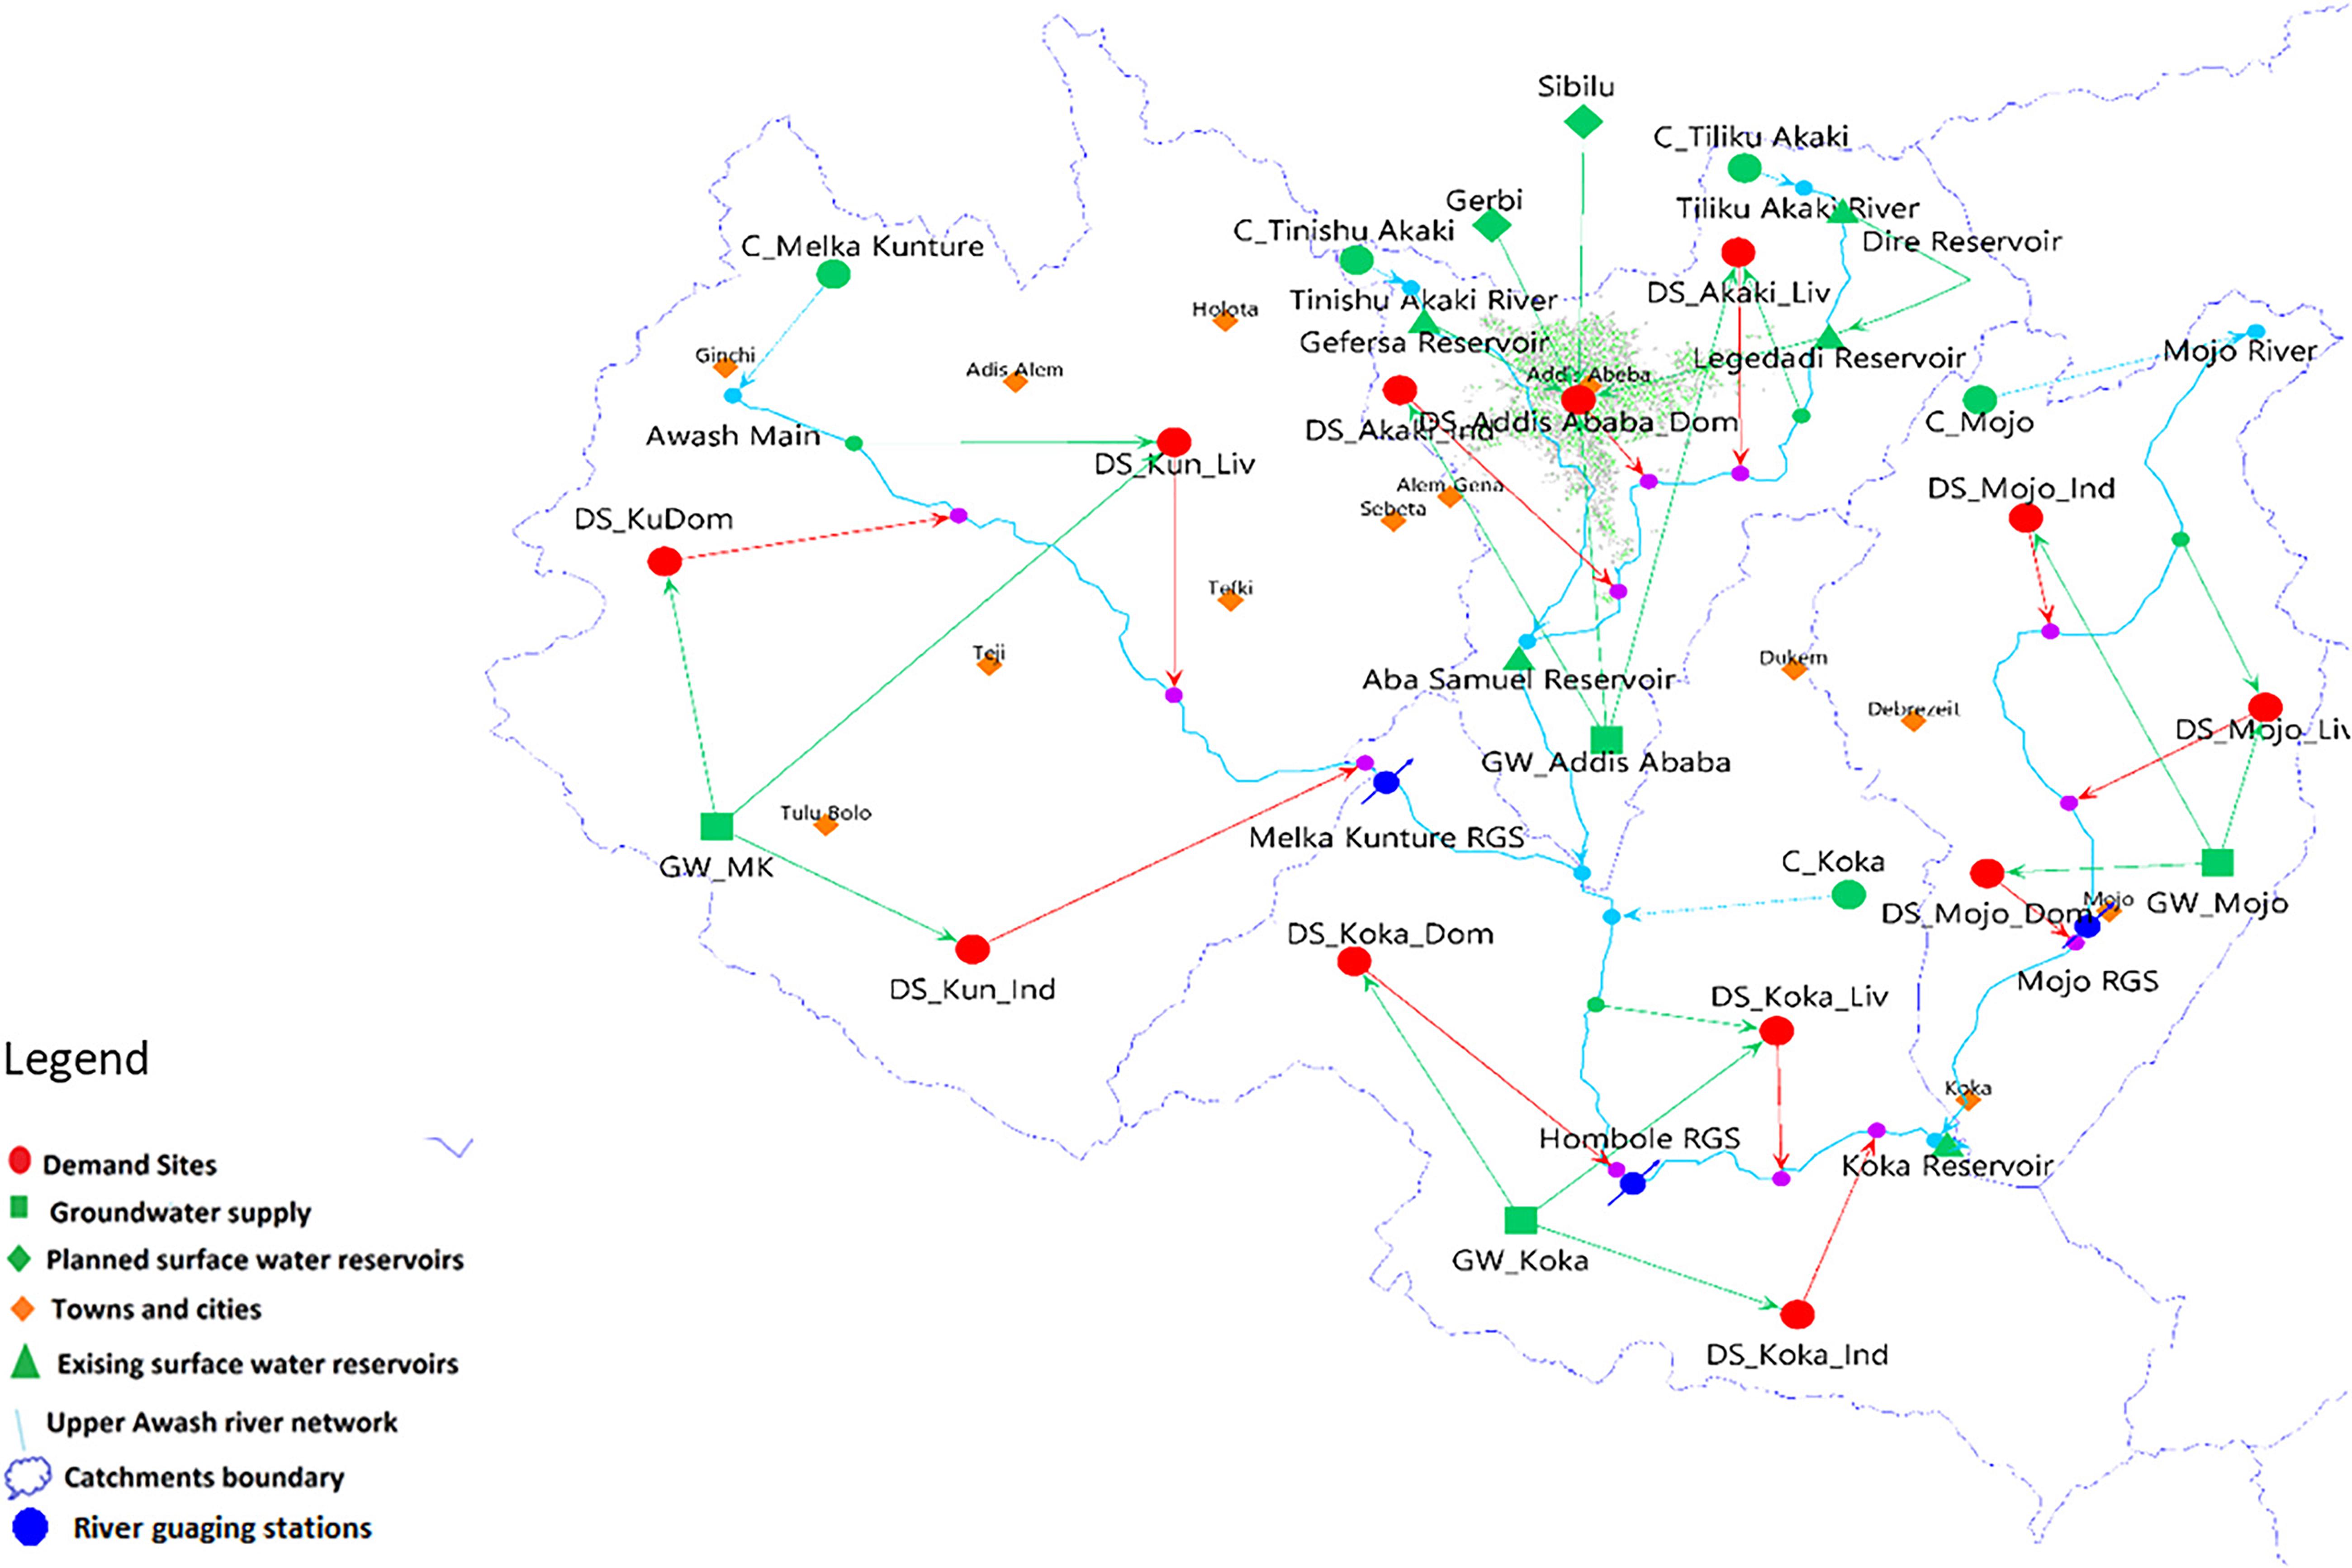
Figure 1. WEAP schematic with demands, supply nodes, transmission links, and return flows.
In this paper, we aim to demonstrate the utility of a coupled SW-GW model to support integrated water resource management in Ethiopia. Firstly, we present a characterization of the basin in terms of water demand and climate projections and characterize the surface water hydrology using WEAP tool (Sieber, 2015). Secondly, the upper Awash groundwater system is simulated and calibrated by the three-dimensional groundwater flow code (MODFLOW) (Harbaugh et al., 2000). Then, the surface water represented by WEAP is linked with the MODFLOW-2000, a three-dimensional groundwater flow model using a linkage file. Finally, we report the results of the modeled scenarios on the impact of increasing water demand, water loss, climate change, and continuous water abstraction in the upper Awash sub-basin up to 2030, demonstrating the effect on groundwater and the general water demand and supply condition in the Upper Awash sub-basin.
Materials and Methods
Study Area
The upper Awash sub-basin is located in central Ethiopia at the western margin of the Main Ethiopian Rift (MER). There are thirteen major settlements including the capital city, located at the northern end of the basin, by order of largest to smallest: Addis Ababa, Bishoftu, Mojo, Dukem, Koka, Ginchi, Addis Alem, Sebeta, Holeta, Teji, Asgori, Tulubolo, and Wolenkomi. Addis Ababa city is located in Akaki catchment; Mojo, Dukem, and Bishoftu are located in Mojo catchment; Holeta, Teji, Asgori, Tulubolo, Addis Alem, Ginchi, Wolenkomi are located in Melka Kunture catchment and Koka in Koka catchment. The study area is confined within the limits of 37° 57′ 40.77″ E–39° 18′ 20.74″ E latitude and 8° 09′ 24.67″ N–9° 19′ 29.61″ N longitude (Figure 2). The total area of the upper Awash sub-basin is about 10,700 km2.

Figure 2. Location map of the study area.
The main rainfall in the upper Awash sub-basin is between June to September when moist winds from the Atlantic and Indian oceans converge over the Ethiopian Highlands (Gamachu, 1977). Thus, the year is characterized by a major rainy season (Kiremt) from June to September, during which about 66–75% of the annual rainfalls in the study area, followed by a dry season until the end of January and the small rainy season (Belg) from February to the end of April. The average annual rainfall in the basin ranges from 1190 mm in the highlands to 950 mm in the rift valley parts of the study area (Yitbarek et al., 2012). The mean annual temperature ranges from 13 to 20°C. The annual evapotranspiration was estimated at 871 mm.
The volcanic rocks of the upper awash sub-basin are hydrogeologically heterogeneous. Studies on the hydrogeological framework in the area revealed the occurrence of two basaltic systems (upper and lower) separated by thick impermeable acidic volcanics (trachytic and rhyolitic volcanic centers and ridges) (Yitbarek et al., 2012). The lower basaltic rock is characterized by highly weathered and fractured scoriaceous lava flows; while the upper is fine to coarse-grained, porphyritic, and in places vesicular in nature. There are patches of Quaternary alluvial and lacustrine deposits not included in the aquifer modeled in this study. Upper Awash is situated at the intersection of the two major regional structures namely the NE-SW trending MER and the E-W trending Addis Ababa-Nekemte (Yerer-Tuluwelel) volcanic lineament. As a result, the upper and lower volcanic rocks are connected in different areas depending on the density of faults and lineaments.
Data Collection
Supply Side Data Input
Different datasets were used to develop both the surface water (WEAP) and the groundwater (MODFLOW) models. The catchments were generated by using the Global Mapper version 13 watershed generation tool using the 30 m × 30 m Shuttle Radar Terrain Model (SRTM)1. The Climate Hazards Group Infrared Precipitation with Stations v2.0 (CHIRPS) was used to represent the historical climatology and trends. Since CHIRPS uses a relatively large collection of rain gauge data in East Africa and the accuracy was tested with rain gauges, it was found to be good for Ethiopia (Taye et al., 2018). For historical temperature, the European Centre for Medium-Range Weather Forecasts (ECMWF) ERA-Interim reanalysis was used. ERA-Interim reanalysis shows a fairly good agreement with the ground-based datasets such as the Climate Research Unit (CRU) and therefore taken as a good representation of the temperature of the region (Taye et al., 2018). The Water and Land Resource Center (WLRC) land use land cover dataset was used to determine the type and percentage of land cover in the four sub-catchment of the upper Awash sub-basin2. River discharge data were collected from the Ministry of Water, Irrigation and Energy (MoWIE). The discharge data was used for the calibration and validation of the WEAP model.
Demand-Side Data Input
The upper Awash sub-basin is the main water supply source of the cities/towns in the basin. Addis Ababa city, located in the Akaki catchment abstracts water from both surface water reservoirs (Geferesa, Legedadi-Dire) and groundwater. Groundwater accounts for about 60% of the total Addis Ababa city water supply (Kidanewold et al., 2014). All the other settlements abstract water entirely from groundwater. There is also significant number of livestock, especially in the rural parts of the basin (Melka Kunture and Koka catchments), which use both surface and groundwater. There are no irrigation schemes in the basin that abstract a considerable amount of water. A survey was conducted for this study to collect water consumption data for the different users. Where available, estimates were sourced from published literature and reports. Stakeholder consultation (Basin Development Authority) was used to estimate demand where no published sources were available. Besides, data on water leakage from water supply distribution networks and major water supply conditions in the upper Awash sub-basin are presented. In this section, we report the methods by which water demand was calculated, for domestic, industrial, and livestock demands. These pieces of information are very important to set up the supply demand relationships of the basin under the WEAP-MODFLOW dynamic modeling environment.
Domestic Water Demand
For domestic water demand, we first aggregated the population census data of each wereda (lower administrative unit) within the selected catchment in the upper Awash sub-basin based on Central Statistical Agency (CSA) population projection data from 2013 to 2017 (Central Statistical Agency [CSA], 2013). A linear projection was used to estimate population growth from 2000 to 2009 for the reference simulation.
Industrial Water Demand
There are a significant number of industries abstracting groundwater from the upper Awash sub-basin contributing to the total water demand. To realistically represent groundwater abstraction trends, we conducted a field survey of selected industries in the upper Awash sub-basin. The surveyed industries abstract as much water as needed from boreholes drilled in their compounds. The amount of water used at different sites is compiled from the billed data on the water permit record sourced from the Basin development Office database. The Basin Development Office industries’ groundwater abstraction record was then crosschecked by collecting water abstraction data from 14 out of 26 licensed industries in the upper Awash sub-basin.
Livestock Water Demand
Data on the number of each type of livestock [cattle, sheep, camel, equines (horse and mule), and poultry] and annual consumption rate per type of livestock were compiled from the Basin Development Office database. Livestock water demand for each catchment is estimated by multiplying the annual consumption rate per type of livestock with the total number of each type of livestock in the catchments (cattle = 9.13 cm, sheep = 1.46 cm, camel = 18.25 cm, equines = 7.3 cm, Goat = 1.46 cm, poultry = 0.05 cm).
Water Leakage Data
Across the upper Awash sub-basin, water is pumped and distributed from the sources to different water demand sites. Consultation with water supply offices of major cities and towns in the upper Awash sub-basin was used to estimate water leakage. The average water loss due to leakage is estimated to be 30% in the Akaki catchment, 22% each in the Melka Kunture, and Koka, and 18% in the Mojo catchment. These losses from the transmission lines linking the domestic water demands and supply sources are included in the WEAP-MODFLOW reference period simulation to compute the actual water supply requirements (supply requirement = water demand + leakage).
Constraints on Water Demand-Supply Condition
The abstraction of water from surface and groundwater resources is limited by several factors. Lack of uninterrupted electric power to pump and distribute groundwater and limited infrastructural development (treatment plant capacity and water supply distribution system) to use surface water supply seems to play a significant limiting role. To address their role in the upper Awash sub-basin, we collected actual water abstraction data and consulted experts from AAWSA and water supply bureaus of the other major settlements in the upper Awash sub-basin. Our consultation identified that most of the utilities serving urban areas in the upper Awash sub-basin pump only for 4–8 h a day due to limitations in the availability of electricity. These restrictions primarily affect domestic water demand coverage due to a lack of different energy options and limited economic capacity. Based on real-time water abstraction data records, the actual amount of water from surface water reservoirs and groundwater supply sources to the upper Awash domestic demand sites was represented by setting maximum flow volume by applying transmission linking rules (Sieber, 2015). Industries and other private investors are not usually forced to limit water abstraction for their demands.
Methodology
In this study, the WEAP model interfaced with MODFLOW (Sieber, 2015) was used to assess various stressors in the upper Awash sub-basin. The link between WEAP and MODFLOW is a new generation configuration to integrate surface and groundwater resources. Integrated with MODFLOW, WEAP is a water allocation model designed to support the analysis of both surface and groundwater allocation problems involving complicated hydrological, environmental, and socioeconomic constraints, and conflicting management objectives.
Water evaluation and planning is first configured to characterize the surface water hydrology of the upper Awash sub-basin (streamflow, groundwater, reservoirs, and water transfers). Using its unique capability to represent the effects of demand management on water supply systems (Sieber, 2015), WEAP was also used to represent demand-side inputs (water use rate and allocation). Secondly, the upper Awash aquifer was described using the MODFLOW-2000 model (Harbaugh et al., 2000). Third, a dynamic link is made between the WEAP and MODFLOW models through an interface created by using specially designed software for the purpose called LinkKitchen (Huber, 2013). Finally, by applying demand and supply side management scenarios on SW-GW dynamic linkage, this study evaluated the likely impacts of natural and anthropogenic demand and supply side stressors on both SW-GW resources. Six sets of future scenarios were systematically selected to evaluate the potential impacts of supply and demand-side stressors on water supply sources of the upper Awash sub-basin up to the year 2030. The projected scenarios represent a coherent and consistent description of a possible state of the future water demand and supply conditions in the Upper Awash sub-basin.
To represent the reference condition, a baseline scenario was first developed for the period 2000–2009. On the reference scenario, the water scarcity condition in the upper Awash sub-basin was evaluated. Under the demand-side management scenario, the likely impact of population pressure was assessed. The supply side management scenarios evaluated implications of additional surface and groundwater supply schemes with implications of minimizing and avoiding water leakage. Climate change scenarios were developed to predict the water supply demand situations under the changing climatic conditions. Finally, integrated scenarios were developed to assess the combined effect of simultaneously occurring stressors that would improve or worsen domestic water supply in the basin. Based on the scenarios, water management aspects that need immediate interventions are suggested. Table 1 summarizes the background reasons why the different scenarios were developed.

Table 1. Summary of reference and future scenarios applied on WEAP-MODFLOW linked model.
Model Setup
A General Framework of the WEAP Model
The water supply demand conditions (catchment areas, cities, river reaches, surface water reservoirs, and groundwater sources) of the four catchments in the upper Awash sub-basin were characterized by defining physical elements (nodes). Nodes in the schematic model of WEAP were dynamically related to each other and other components of the combined model. Based on their spatial relationships, transmission links, return flow associated with leakage from water supply distribution networks, runoff/infiltration were used to represent the flow from demand to supply sources and vice versa (Figure 1).
The WEAP model for the upper Awash main river and the major tributaries from the four catchments were configured using four catchment nodes (Melka Kunture, Akaki, Mojo, and Koka), four domestic demands, four industrial demands, and four livestock demand sites within each catchment. Five runoff infiltration lines and twenty-one transmission links were used. The groundwater supply sources for the catchments were represented by four groundwater nodes. Three River Gauging Stations (RGS) at Melka Kunture_RGS, Hombole_RGS, and Mojo_RGS were sued to calibrate and validate the model.
The WEAP model uses five methods to represent catchment processes on a daily or monthly basis. In this study, the Soil Moisture Method was applied to realistically represent hydrological processes with a semi-physical representation of the four catchments. Soil Moisture Method is a one-dimensional, 2-compartment (or “bucket”) soil moisture accounting scheme based on empirical functions that describe evapotranspiration, surface runoff, sub-surface runoff, and deep percolation for a watershed unit. This method allows for the characterization of land use and/or soil type impacts to these processes (Sieber, 2015).
MODFLOW MODEL: Design, Parametrization, and Sensitivity Analysis
Due to its capability, the most widely used numerical groundwater flow model, MODFLOW, which is a modular three-dimensional finite-difference groundwater flow model (Harbaugh et al., 2000) is used to model the groundwater flow system of the Upper Awash sub-basin for the steady-state condition. The conceptual basis of the model design, the methods used to estimate the major model inputs, and the sensitivity analysis are described in the following sections.
Model Design
Based on the nature of the hydrogeologic framework, the groundwater was modeled with confined/unconfined type-3 hydraulic properties (Cauchy) (Franke and Reilly, 1987). The model area corresponds to the total study area of 7590 km2. The extent of the modeled area is 148 km easting by 129 km northing. The model uses a uniform grid size of 500 m by 500 m and, 296 columns, and 258 rows (Supplementary File 1). The model has a variable thickness where the upper boundary of the model is the ground surface, whereas the bottom corresponds to the top of the bedrock. The model top was extracted from 30 m spatial resolutions SRTM.
No-flow, specified flux, head-dependent, and constant head boundary conditions were used to constrain the groundwater flow system (Supplementary File 1). Geologic or hydrologic barriers to groundwater flow were simulated using no-flow boundaries. Estimated hydrologic fluxes, such as recharge and well discharge are represented using specified flux boundaries. A head-dependent flux (general head boundary) is one across which groundwater moves at a rate proportional to the hydraulic head gradient between the boundary and the groundwater system. Streams are represented as head-dependent flux boundaries because the movement of groundwater to or from a stream is proportional to the difference between the head in the aquifer and the stage of the stream. Groundwater flow across catchment boundary is similar in concept to streams.
Major Model Input Parameters
Horizontal hydraulic conductivity zones were identified based on Kriging using a linear variogram from pumping test data. The interpolated head suggests the existence of transmissivity contrast as reflected by a variable hydraulic gradient (non-uniform flow pattern). This is due to strong variability in lithology and partly due to variation in density and behavior of fractures. Thus, variations of lithology and fracture conditions have resulted in considerable variation in hydraulic characteristics hydraulic conductivity. Based on (Yitbarek et al., 2012; Azagegn et al., 2015), the aquifer systems in the upper Awash sub-basin contain some degree of heterogeneity, high spatial variability in hydraulic conductivity, and hence groundwater flow rate and pattern. Both primary and secondary porosities of rocks play a significant role in groundwater occurrence and localization.
The groundwater recharge in the study area has been estimated by different researchers (Demlie et al., 2007; Yitbarek et al., 2012) using different approaches (Water Balance Method, Chloride Mass Balance, Groundwater Fluctuation, and Baseflow Separation). The previous studies estimated average annual recharge ranging from 90 to 123 mm.
For this study, HYDRUS 1D (Šimůnek and van Genuchten, 2008) numerical model based on a finite element scheme for simulating the movement of water, heat, and multiple solutes in variably saturated media was used to estimate recharge for the model input. When only considering water flow, the program numerically solves the Richards’ equation for saturated-unsaturated flow as indicated in Equation (1).
Where z is the vertical coordinate positive upward [L], t is time [T], h is the pressure head [L], θ is the water content [L3 L–3], S is a sink term representing root water uptake or some other source or sink [T–1], and K(h) is the unsaturated hydraulic conductivity function.
Years of daily precipitation, minimum and maximum temperature, and relative humidity for 22 simulation points (Supplementary File 2) were extracted from CHIRPS and ERA-Interim climate data sources. Characteristics of the soil (sand, silt, and clay content) up to the depth of 2 m were extracted for each simulation point3.
Sensitivity Analysis
To test the response of the calibrated model to a range of values, sensitivity was determined for variations in hydraulic conductivity, pumping, and recharge. Figure 3 shows the comparison of the sum of the square deviation of measured and simulated heads for the calibrated model and the resulted deviations with the percentage changes in the selected parameters. Simulated water levels are highly sensitive to both a decrease and increase in hydraulic conductivity values. Though not as it reacts to the change in hydraulic conductivity, the model was also sensitive to recharge (especially for a decrease in recharge) and pumping.
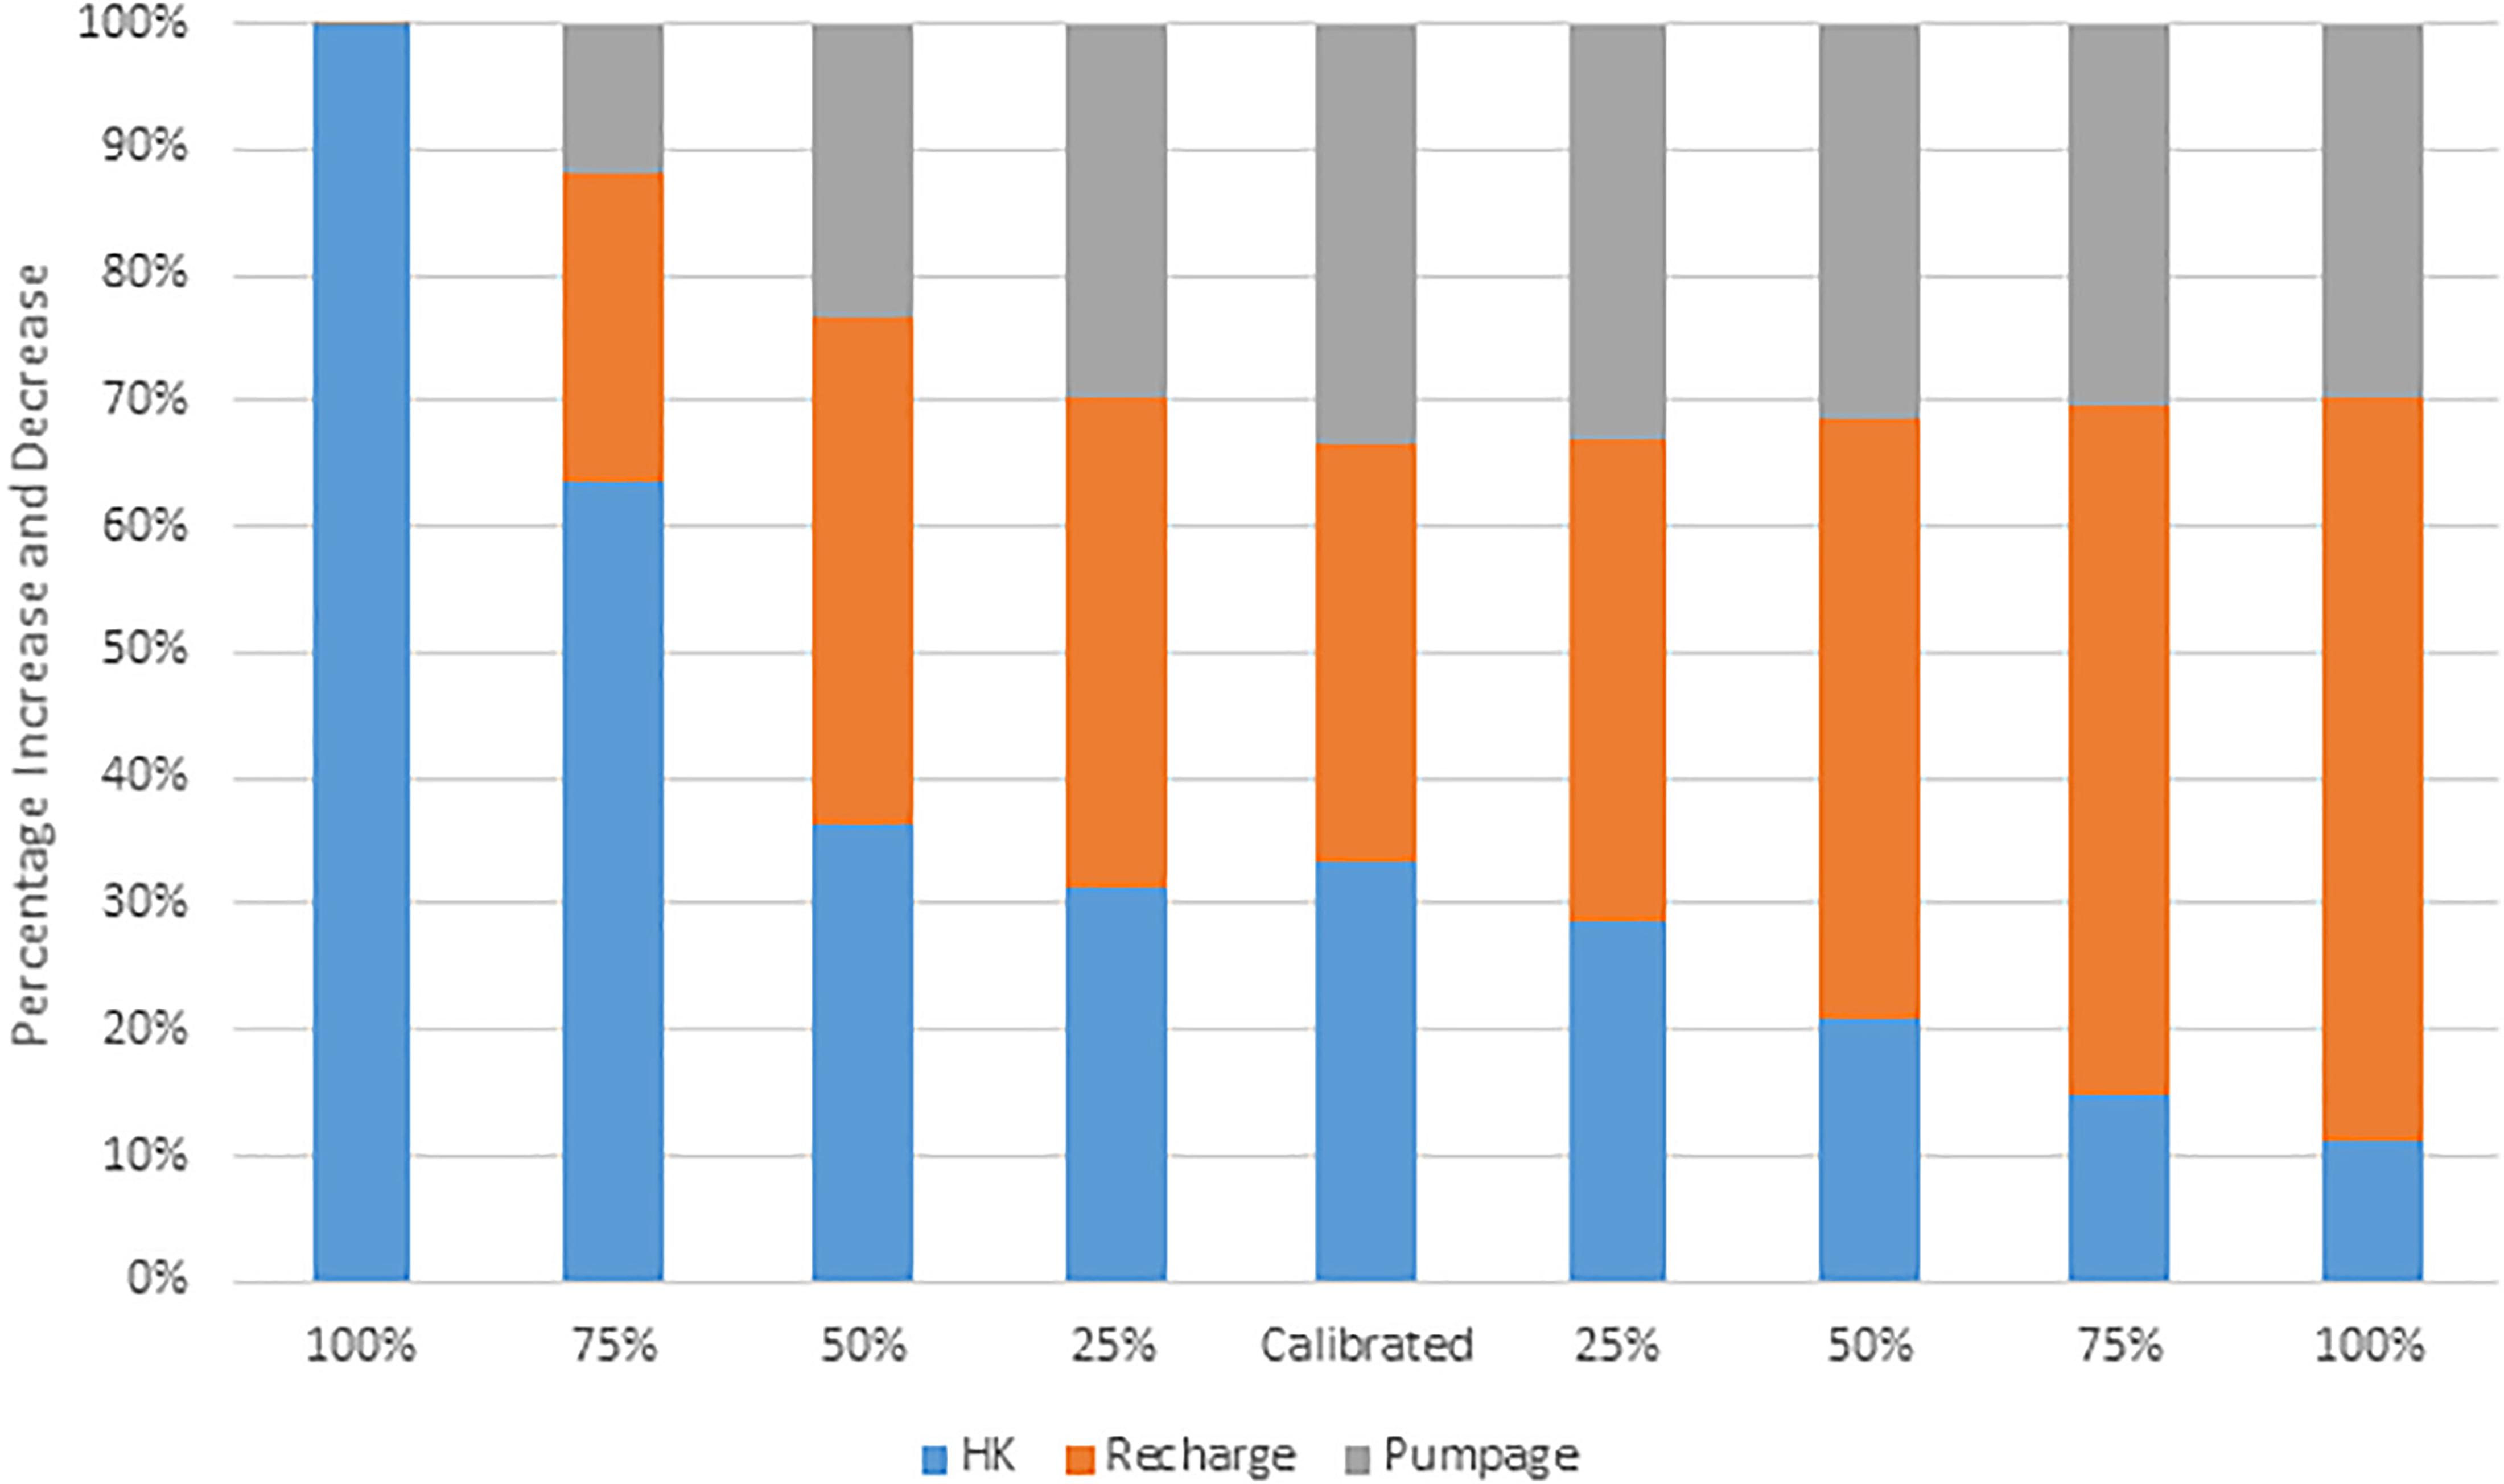
Figure 3. Groundwater model parameters sensitivity.
Linking WEAP With MODFLOW
In the WEAP model, groundwater is represented as one large “bucket” with no parameters to describe internal flows (Sieber, 2015). The built-in WEAP groundwater model is, therefore, not sufficiently complex to simulate groundwater to the level of detail required for this study. Most importantly, the impact of continuous water abstraction on the groundwater cannot easily be evaluated, which is possible under the new WEAP-MODFLOW configuration. Hence, MODFLOW-2000 was used to describe a groundwater flow model for the upper Awash aquifer outside the WEAP environment.
In any surface-groundwater coupling procedure, linking models requires spatial integrity between them. However, unlike MODFLOW, WEAP does not have geographic coordinates but only considers the spatial relationship between its interior model objects (Sieber, 2015). Therefore, to ensure alignment between the models, a linkage file with geographic information was created for the four catchments, the river reaches, demand sites, and supply sources. LinkKitchen is a tool designed by the Federal Institute for Geosciences and Natural Resources to assist the setup of the linkage file (shapefile) based on a lookup table that acts as a dictionary between elements in both WEAP and MODFLOW modeling software (Huber, 2013). The linkage files were used to dynamically integrate the surface water hydrology characterized by the WEAP model and the groundwater system simulated using the three-dimensional groundwater flow model.
Once WEAP and MODFLOW models are linked, WEAP values for groundwater recharge, and surface water runoff (river stages) are provided to MODFLOW as inputs for groundwater flow calculations, and MODFLOW outputs (groundwater level, lateral flow between aquifers, and surface water-groundwater flows) are returned to WEAP as inputs for surface water calculations (Sieber, 2015).
Results and Discussion
Model Calibration and Validation
To produce realistic streamflow for each catchment, the WEAP model parameters are calibrated using the measured streamflow at three hydrometric stations (Melka Kunture, Hombole, and Mojo) for the period from 2000 to 2009 (Figure 4). The WEAP parameters (runoff resistance factor, soil water capacity, and root zone conductivity) that play a key role in determining the soil water holding capacity and the amount of runoff that can be generated from the top and bottom buckets were calibrated using observed streamflow.
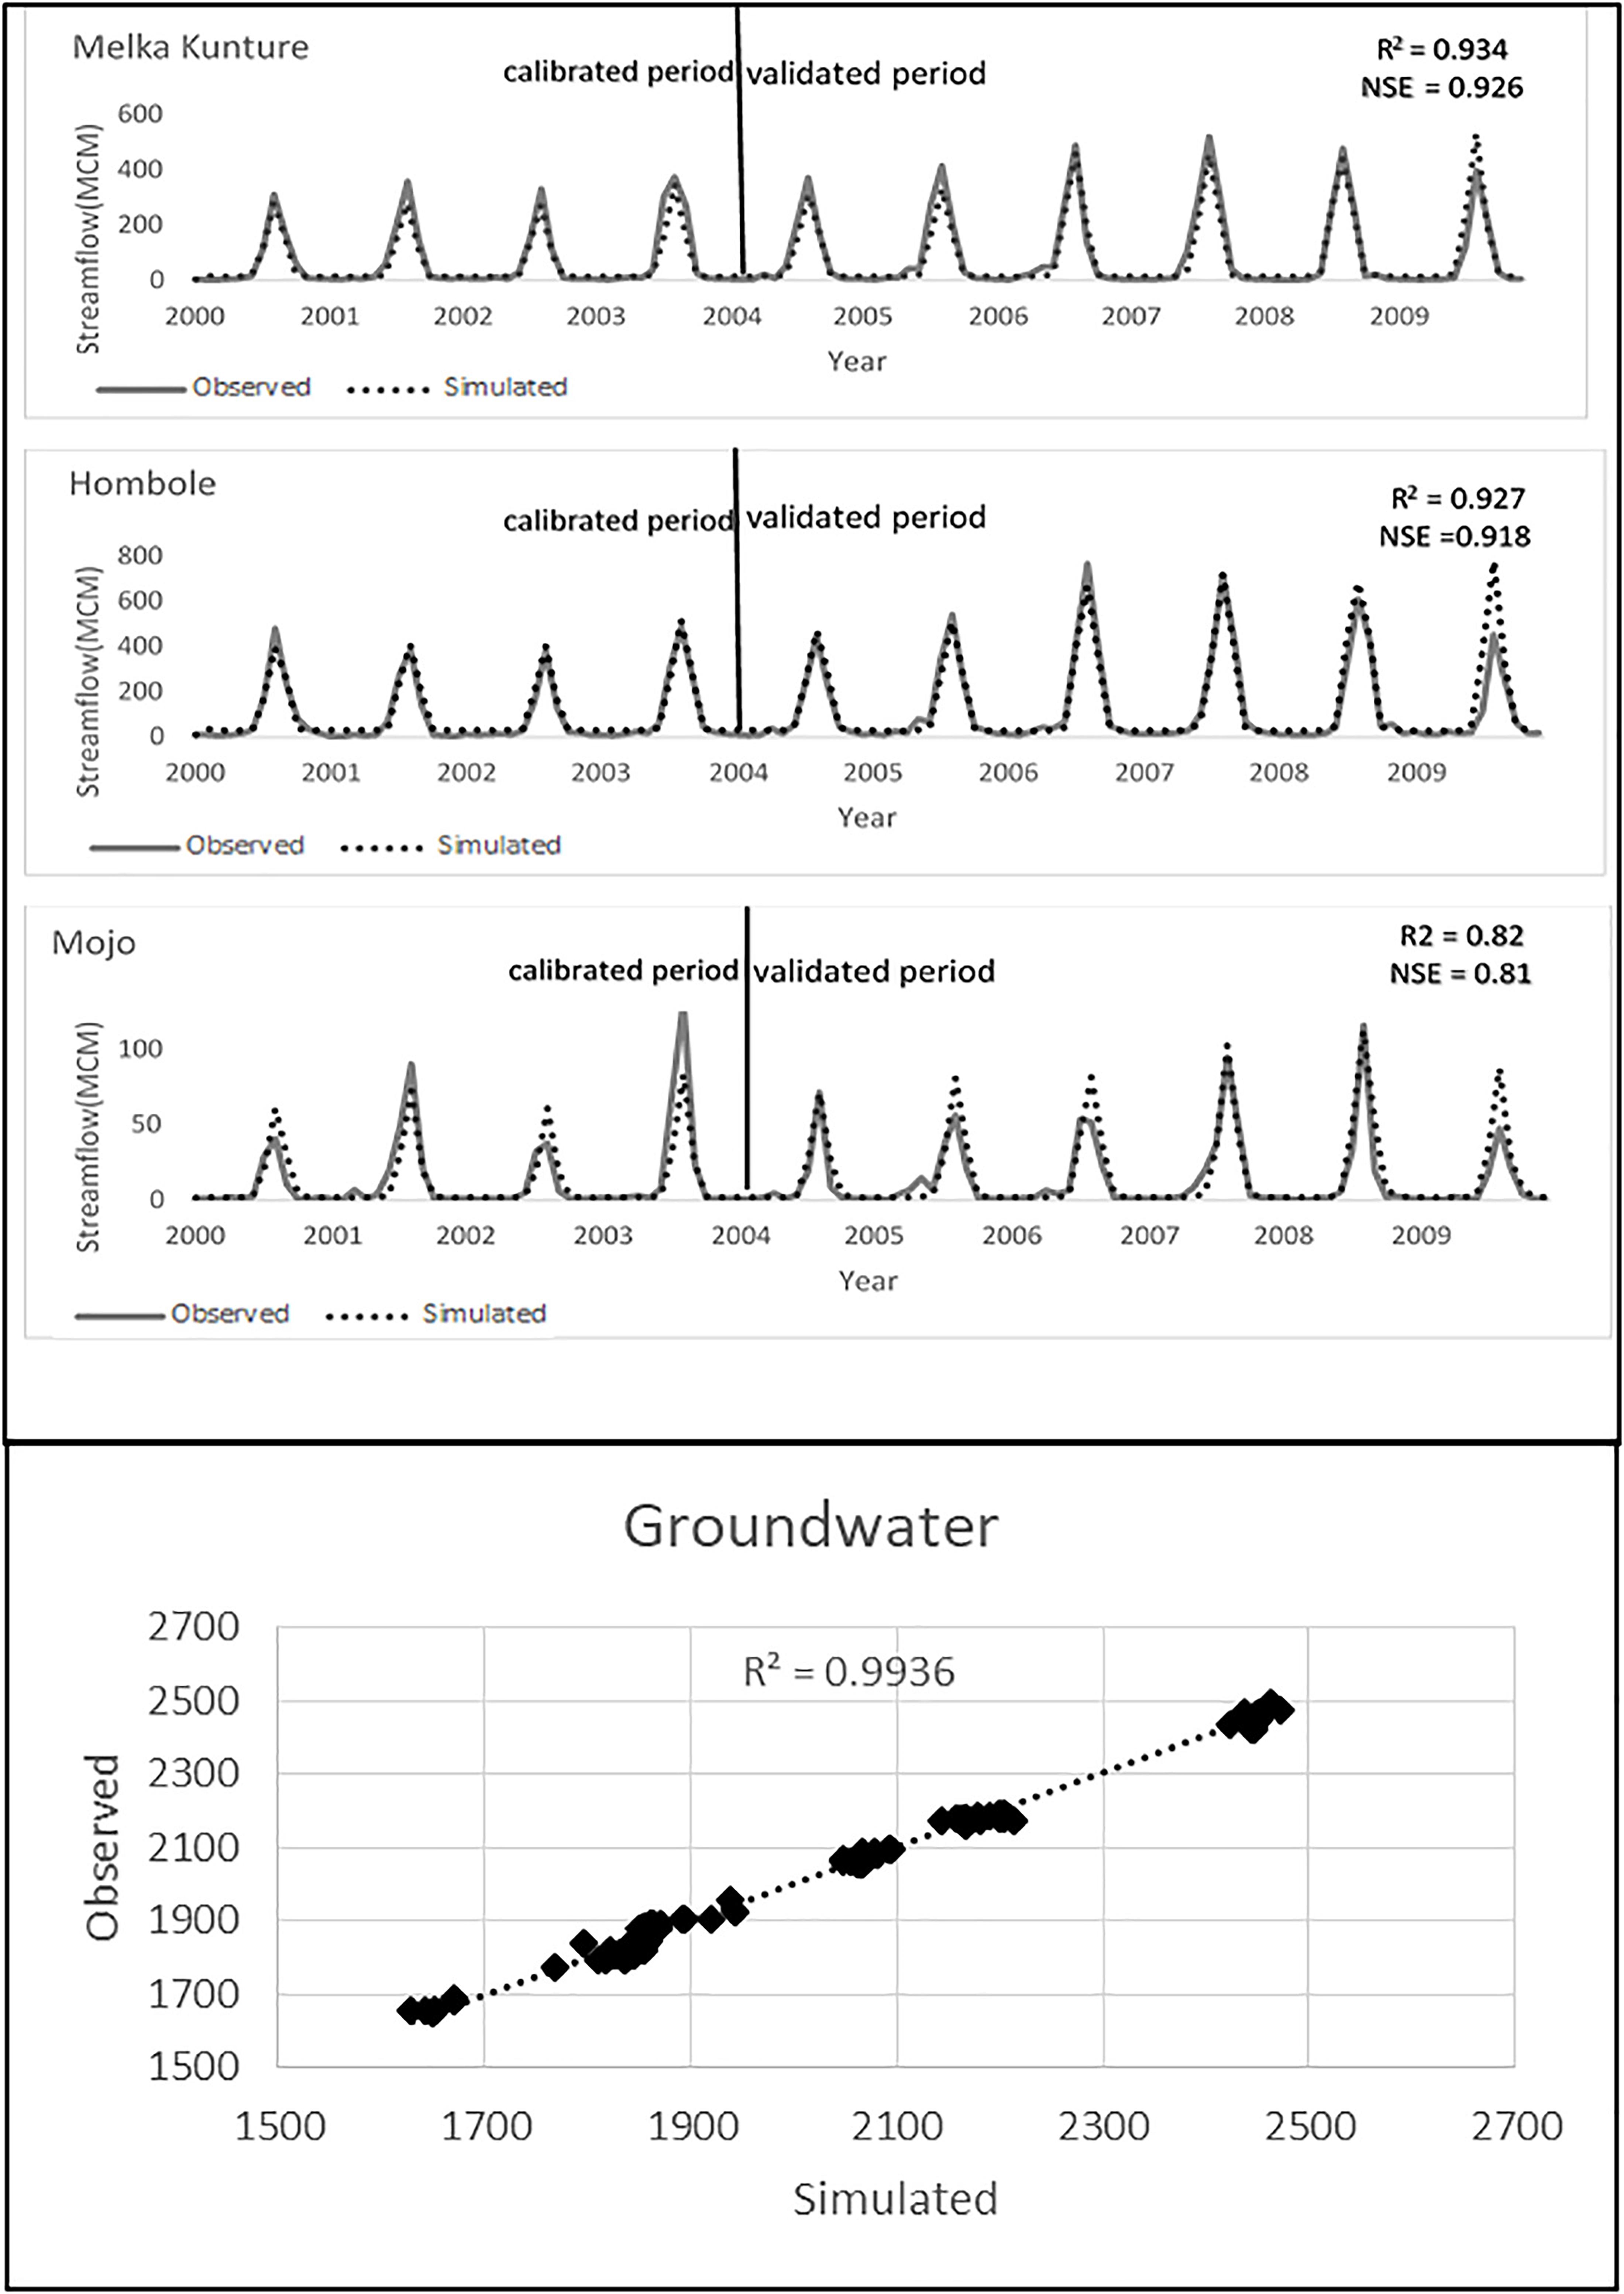
Figure 4. The validation and calibration of the WEAP model at three hydrometric stations and calibration of the groundwater model.
The values of the coefficient of determination range from 0.82 to 0.93 with an average of 0.89, while the Nash–Sutcliffe parameter varied from 0.82 to 0.93 with an average of 0.88. The coefficient of determination and the Nash–Sutcliffe values show that WEAP reasonably simulated the hydrology of the upper Awash sub-basin. Hence, future scenarios were developed based on accurate streamflow prediction.
The groundwater flow model was calibrated independently with 130 head observations in the basin (Supplementary File 3). The trial and error method provided satisfactory results for the steady-state calibration and met the overall goals of the study. Hydraulic conductivity values were mainly used to calibrate the groundwater flow model. The quality of the calibration is evaluated by calculating summary statistics on the difference between simulated and measured water levels. The Root Mean Square Error (RMSE) for all wells is 0.16 percent. The Mean Average Error (MAE) is 0.14 percent. A linear regression analysis of simulated and observed hydraulic heads for all wells yields a coefficient of correlation equals 0.99 (Figure 4).
Using the calibrated model, the water budget was calculated with a percent discrepancy of 0.51 for the whole model domain. The following table (Table 2) contains the inflow and outflow components to and from the groundwater flow systems. Based on the calibrated model result of this study, hydraulic conductivity varies between 2.3e-5 to 5.4e-4 ms-1 (Supplementary File 4). The average spatial distribution of recharge ranges from 68 mm for zones of local recharge areas to 86 mm for zones of high direct recharge over the highlands (Supplementary File 3). With noticeable spatial variability, the recharge is about 7 percent of the average annual rainfall in the basin. The average annual abstraction from the Upper Awash sub-basin aquifer is about 360 Mm3.
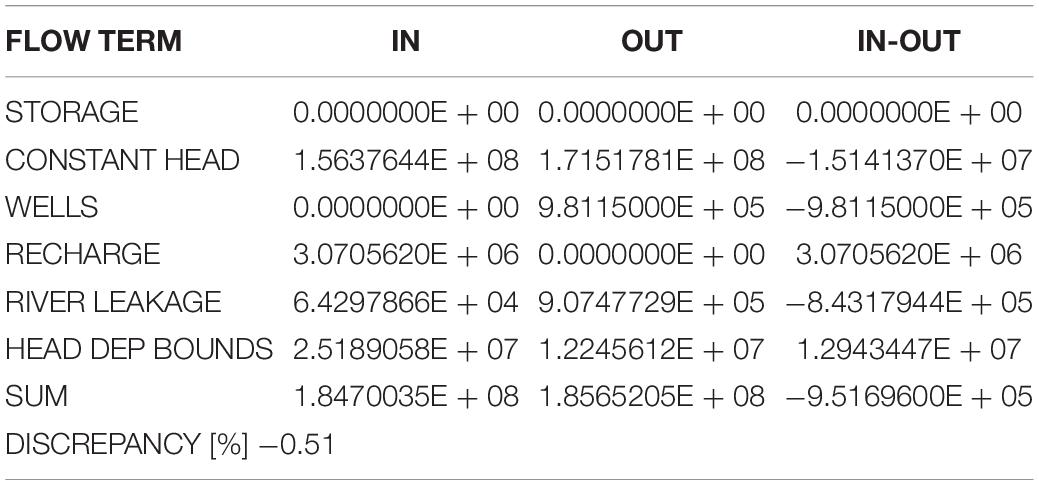
Table 2. Simulation result of the long-term annual water balance of Upper Awash sub-basin.
Baseline or Reference Condition
The water demand for each user type (domestic, industrial, and livestock) was calculated for each catchment together with the actual amount of water required including water leakage (Supplementary File 5). The water demands were calculated based on the per capita water consumption rate, which includes the population growth, industrial water use, and the livestock water requirement in the catchments for the reference condition.
The reference scenario draws on the historic abstraction from surface and groundwater supply sources with the constraints detailed in section “Constraints on Water Demand-Supply Condition.” As a result, there was about 99 MCM of unmet domestic water demand in 2009 with about 50% domestic water demand coverage (Figure 5). Assuming that the existing water supply systems continue without any additional water supply schemes up to the year 2030, the unmet domestic water demand increased to 360 MCM with about 26% domestic water demand coverage. Based on the reference condition, there will be water scarcity in the upper Awash sub-basin if no immediate improvements will be made to the water supply schemes.
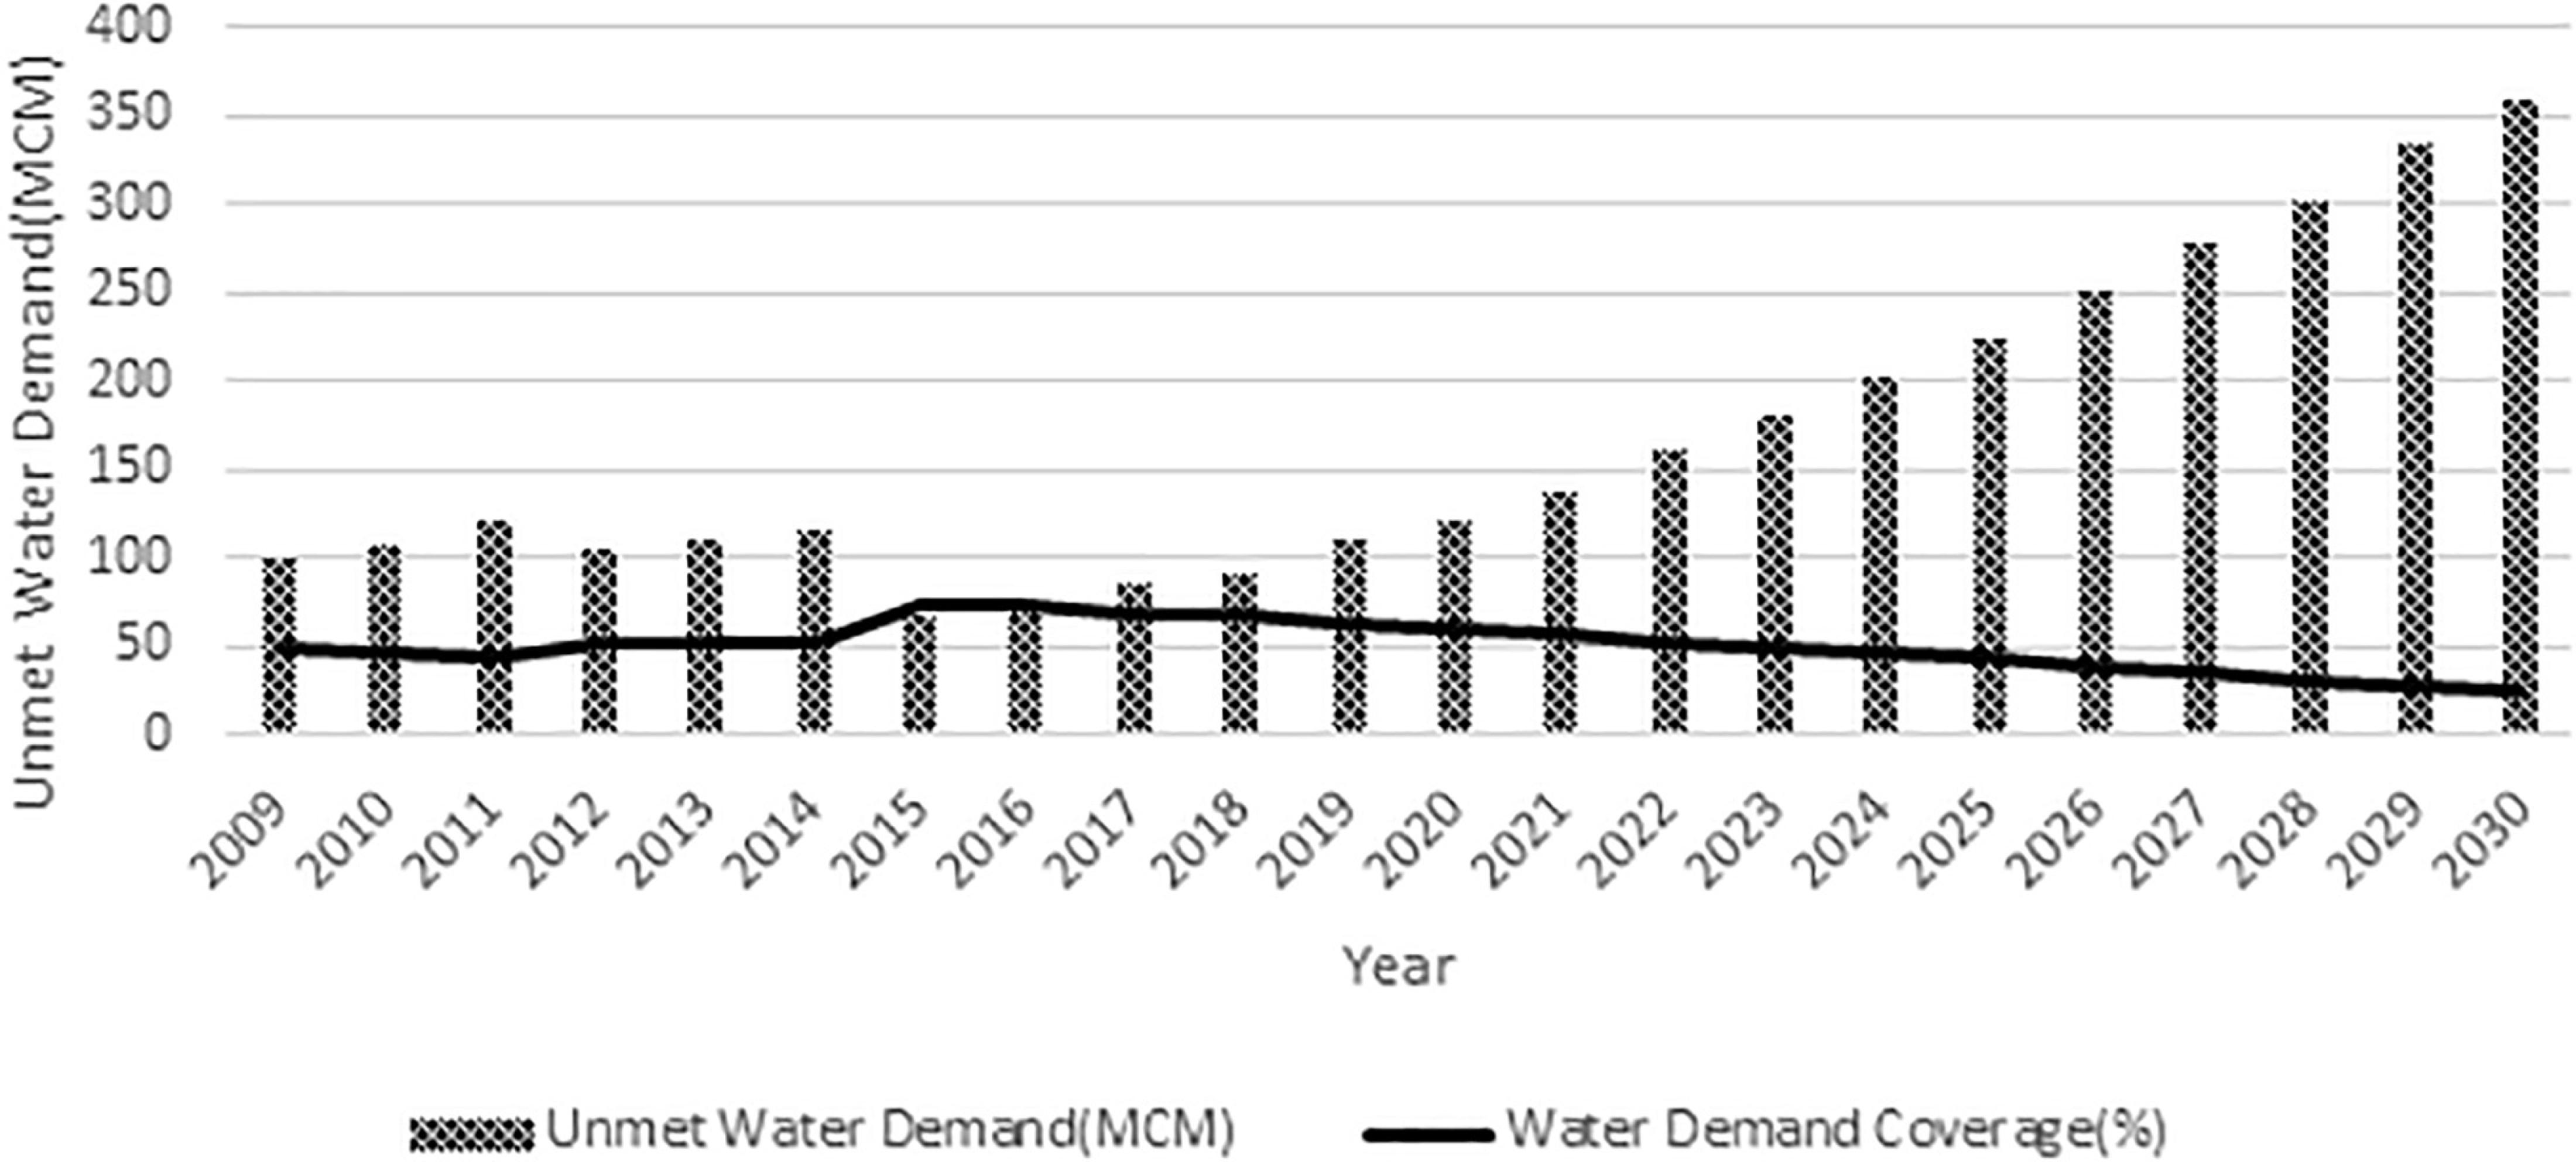
Figure 5. The unmet water demand and water demand coverage for the reference condition (2009–2030) in the upper Awash sub-basin.
Results of Near-Future Scenarios
Population Scenarios
According to the CSA data record, the aggregated wereda level population projections of the four catchments in the Awash sub-basin in 2009 were 2,930,608 for Akaki catchment, 761, 564 for Melka Kunture, 391, 001 for Mojo and, 372, 215 for Koka. Since it is the official population dataset for the country, the population projection adopted from CSA for the four catchments was considered for the reference scenarios. However, there are several population projections for Addis Ababa city suggested by sources other than CSA, such as the works by Venture (1993), TAHAL Consulting Engineers Ltd (2005). Most of the population projections done considered a significantly higher annual population growth rate than the growth rate considered for the reference condition by the CSA annual population growth rate (∼2.8%). To accommodate all the uncertainty or to avoid errors due to inappropriate or unintended assumptions, two population projection scenarios were considered for the case of Addis Ababa city. For populations in Melka Kunture, Mojo, and Koka catchments, the population growth projections suggested by CSA are considered for both scenarios.
The first population scenario (Medium Population Growth Rate (MPGR)-3.7%) has considered the lowest annual population growth rate suggested by sources other than CSA. The second population scenario (High Population Growth Rate (HPGR)-4.6%) considered the average annual population growth rate suggested by all sources including the CSA.
Based on the two possible population projections for Addis Ababa city, we estimated the domestic unmet water demand for the upper Awash sub-basin up to the year 2030. Accordingly, if Addis Ababa population growth takes the MPGR population growth trajectory (3.7%), the upper Awash sub-basin unmet domestic water demand will increase by 60% in 2030, compared with the unmet domestic water demand for the reference condition (360 MCM). The highest population growth rate scenario (4.6%) increased the unmet domestic water demand by more than twofold (760 MCM) in 2030 (Figure 6).

Figure 6. The upper Awash sub-basin unmet domestic water demand for the reference, MPGR, and HPGR population scenarios.
Considering immigrants continuously flooding the capital Addis Ababa city from different parts of the country, the two population scenarios are likely population growth scenarios. The water demand coverage even for the reference condition already indicated that water demand in the upper Awash sub-basin will not be satisfied with the existing water supply sources (Figure 7). Based on the MPGR and HPGR scenarios, the upper Awash water demand-supply condition may get worse due to population pressure.
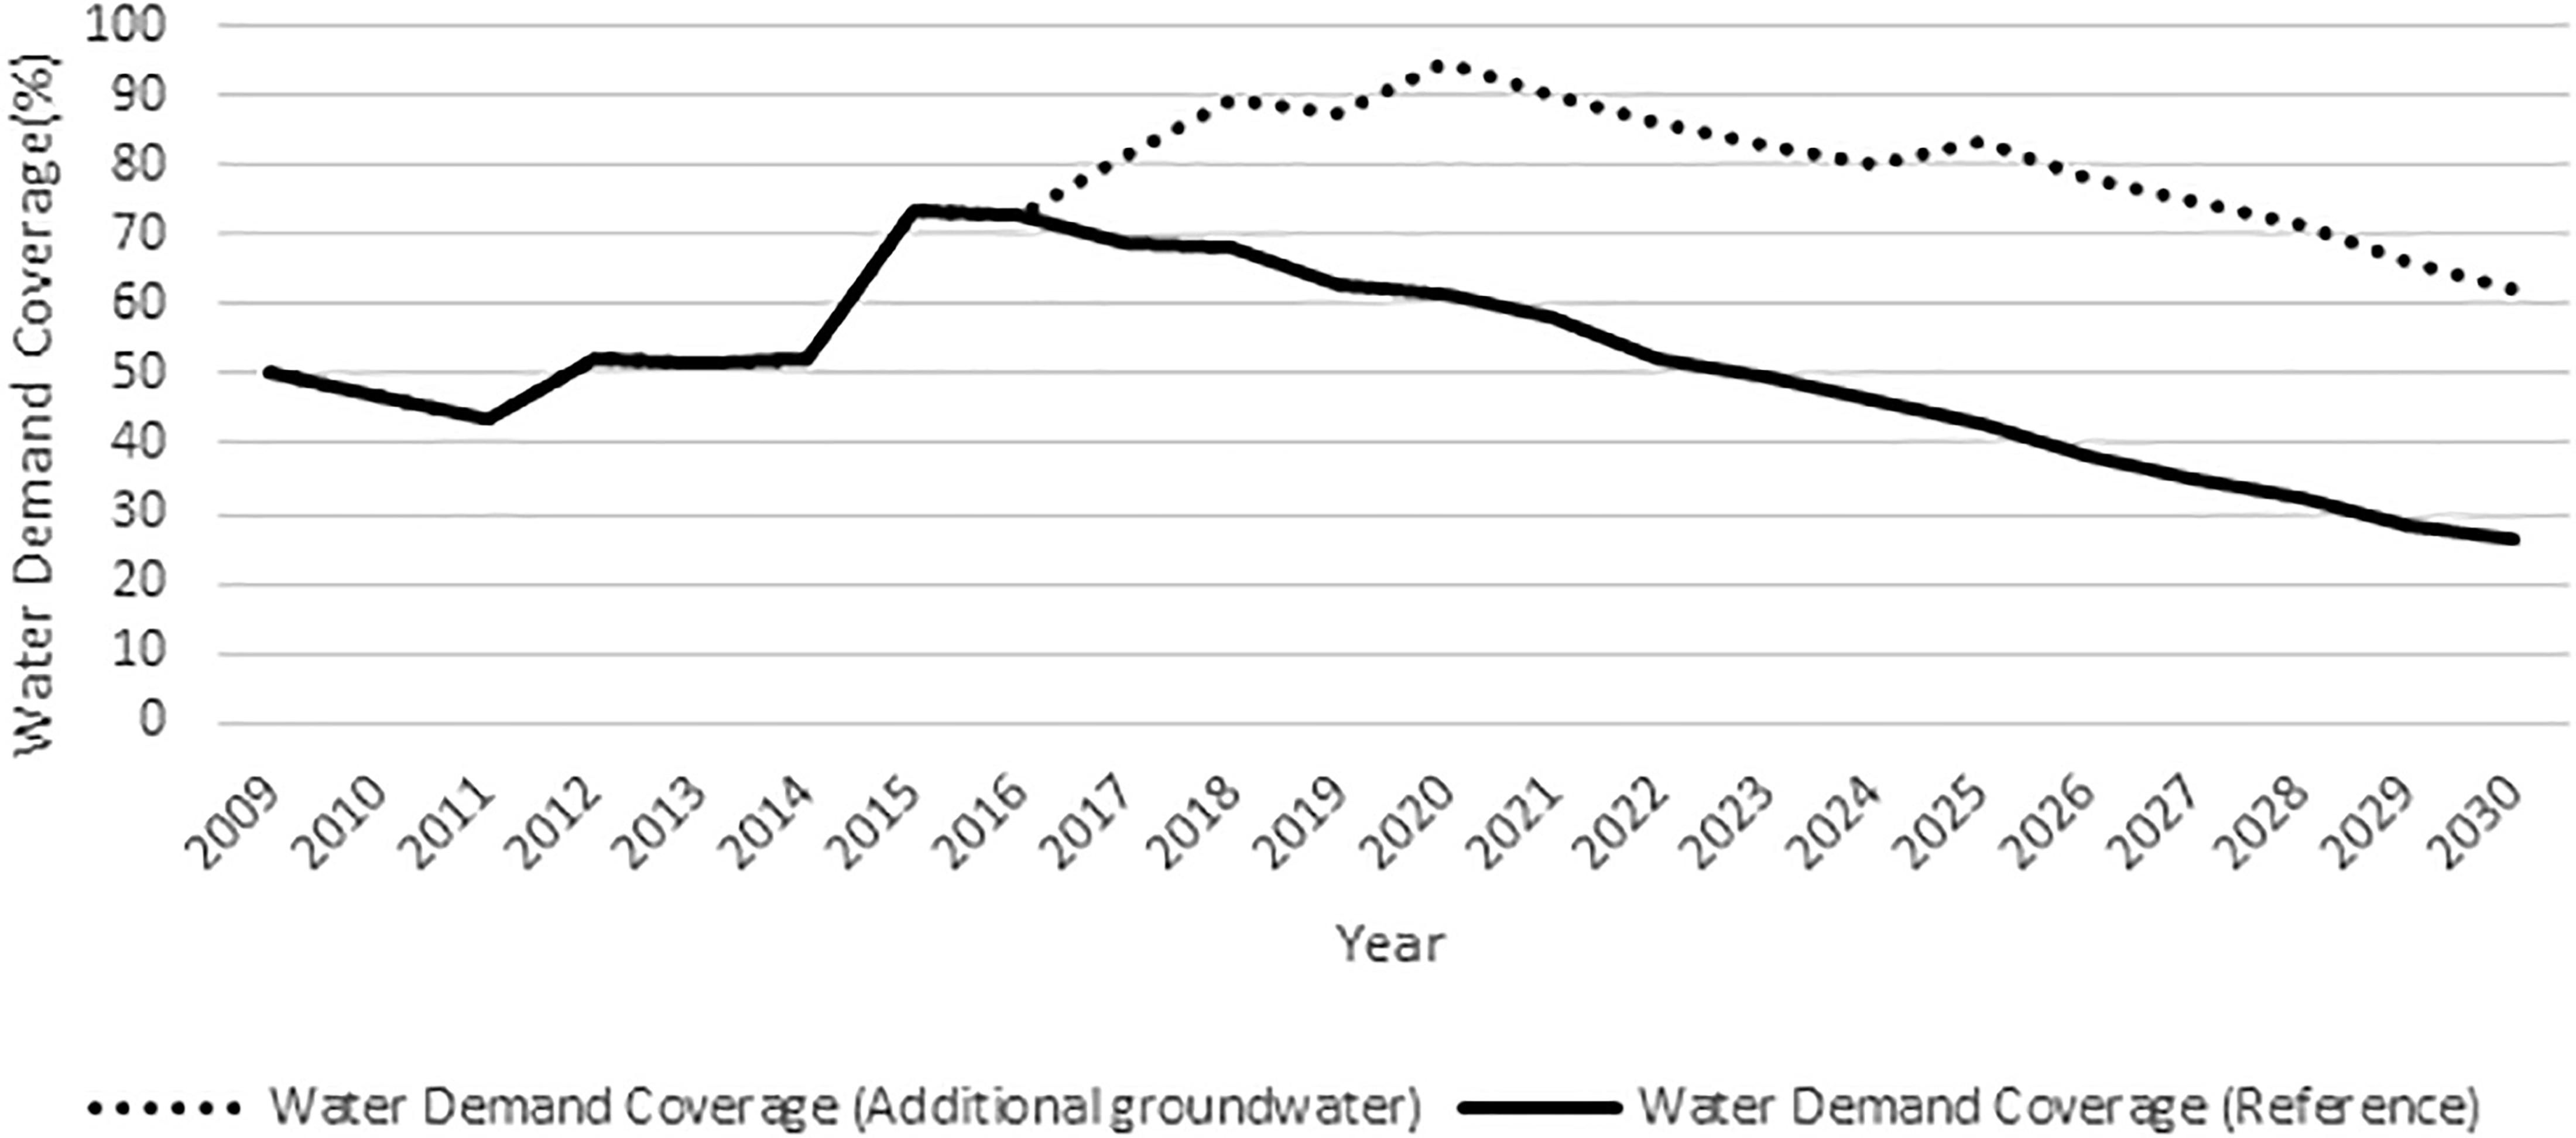
Figure 7. Comparison of water demand coverage for additional groundwater and the reference condition scenarios.
Climate Change Scenarios
Climate change scenarios were incorporated in the WEAP-MODFLOW dynamic linkage using change factors for temperature and precipitation suggested by Taye et al. (2018). In the study, a comparison has been made between Awash basin precipitation observation from CHIRPS (Climate Hazards Group Infrared Precipitation with Stations v2.0) with 24 global climates models historical simulations and their ensemble for the period 1981–2005. Based on the comparison, three global climate models (Geophysical Fluid Dynamics Lab-Climate Model version 3 (GFDL-CM3), Max Planck Institute for Meteorology-Earth System Model-Mixed Resolution (MPI-ESM-MR), and Hadley Centre Global Environment Model version 2—Atmosphere and Ocean (HadGEM2-AO) from Coupled Models Inter-comparison Project phase 5 (CMIP5) were selected to represent the Awash basin for the reference period (1981–2005) and three future periods (2006–2030, 2031–2055, and 2056–2080). The near future scenario analysis done from 2006 to 2030 was used for our purpose. For the future climate data from the Intergovernmental Panel on Climate Change (IPCC) defined Representative Concentration Pathways (R) (Hadded et al., 2013), RCP 8.5 scenario, which represents the highest greenhouse emission level with rising radiative forcing pathway leading to 8.5 W/m2 in 2100 was selected.
Accordingly, the average monthly change factor for temperature and precipitation projections representing high, medium, and low precipitation scenarios were suggested for the three climate models based on the 75th, 50th, and 25th percentile from climate model outputs (Supplementary File 6). As stated in the study, it is hard to trust the extremely high increase projections. Hence, projections higher than 25% change factors were excluded from our analysis. Besides, though temperature change factors were estimated for maximum and minimum temperature variables, only the average temperature change values were considered for this study.
Figure 8 shows the difference between the unmet domestic water demand due to climate change scenarios and the reference condition. As it may be expected, the low precipitation and temperature scenarios predicted increased unmet domestic demand and so decreased the domestic water demand coverage in the upper Awash sub-basin. Compared with the reference condition, within the model prediction period from 2020 to 2030, up to 3.4 MCM and 1.6 MCM higher annual unmet domestic water demand was predicted as a result of low precipitation and temperature scenarios, respectively (Supplementary File 7). Subsequently, the monthly domestic water demand coverage in the basin was lowered up to 6% due to the low precipitation scenario and lowered up to 1.5%, resulted from the temperature scenario.
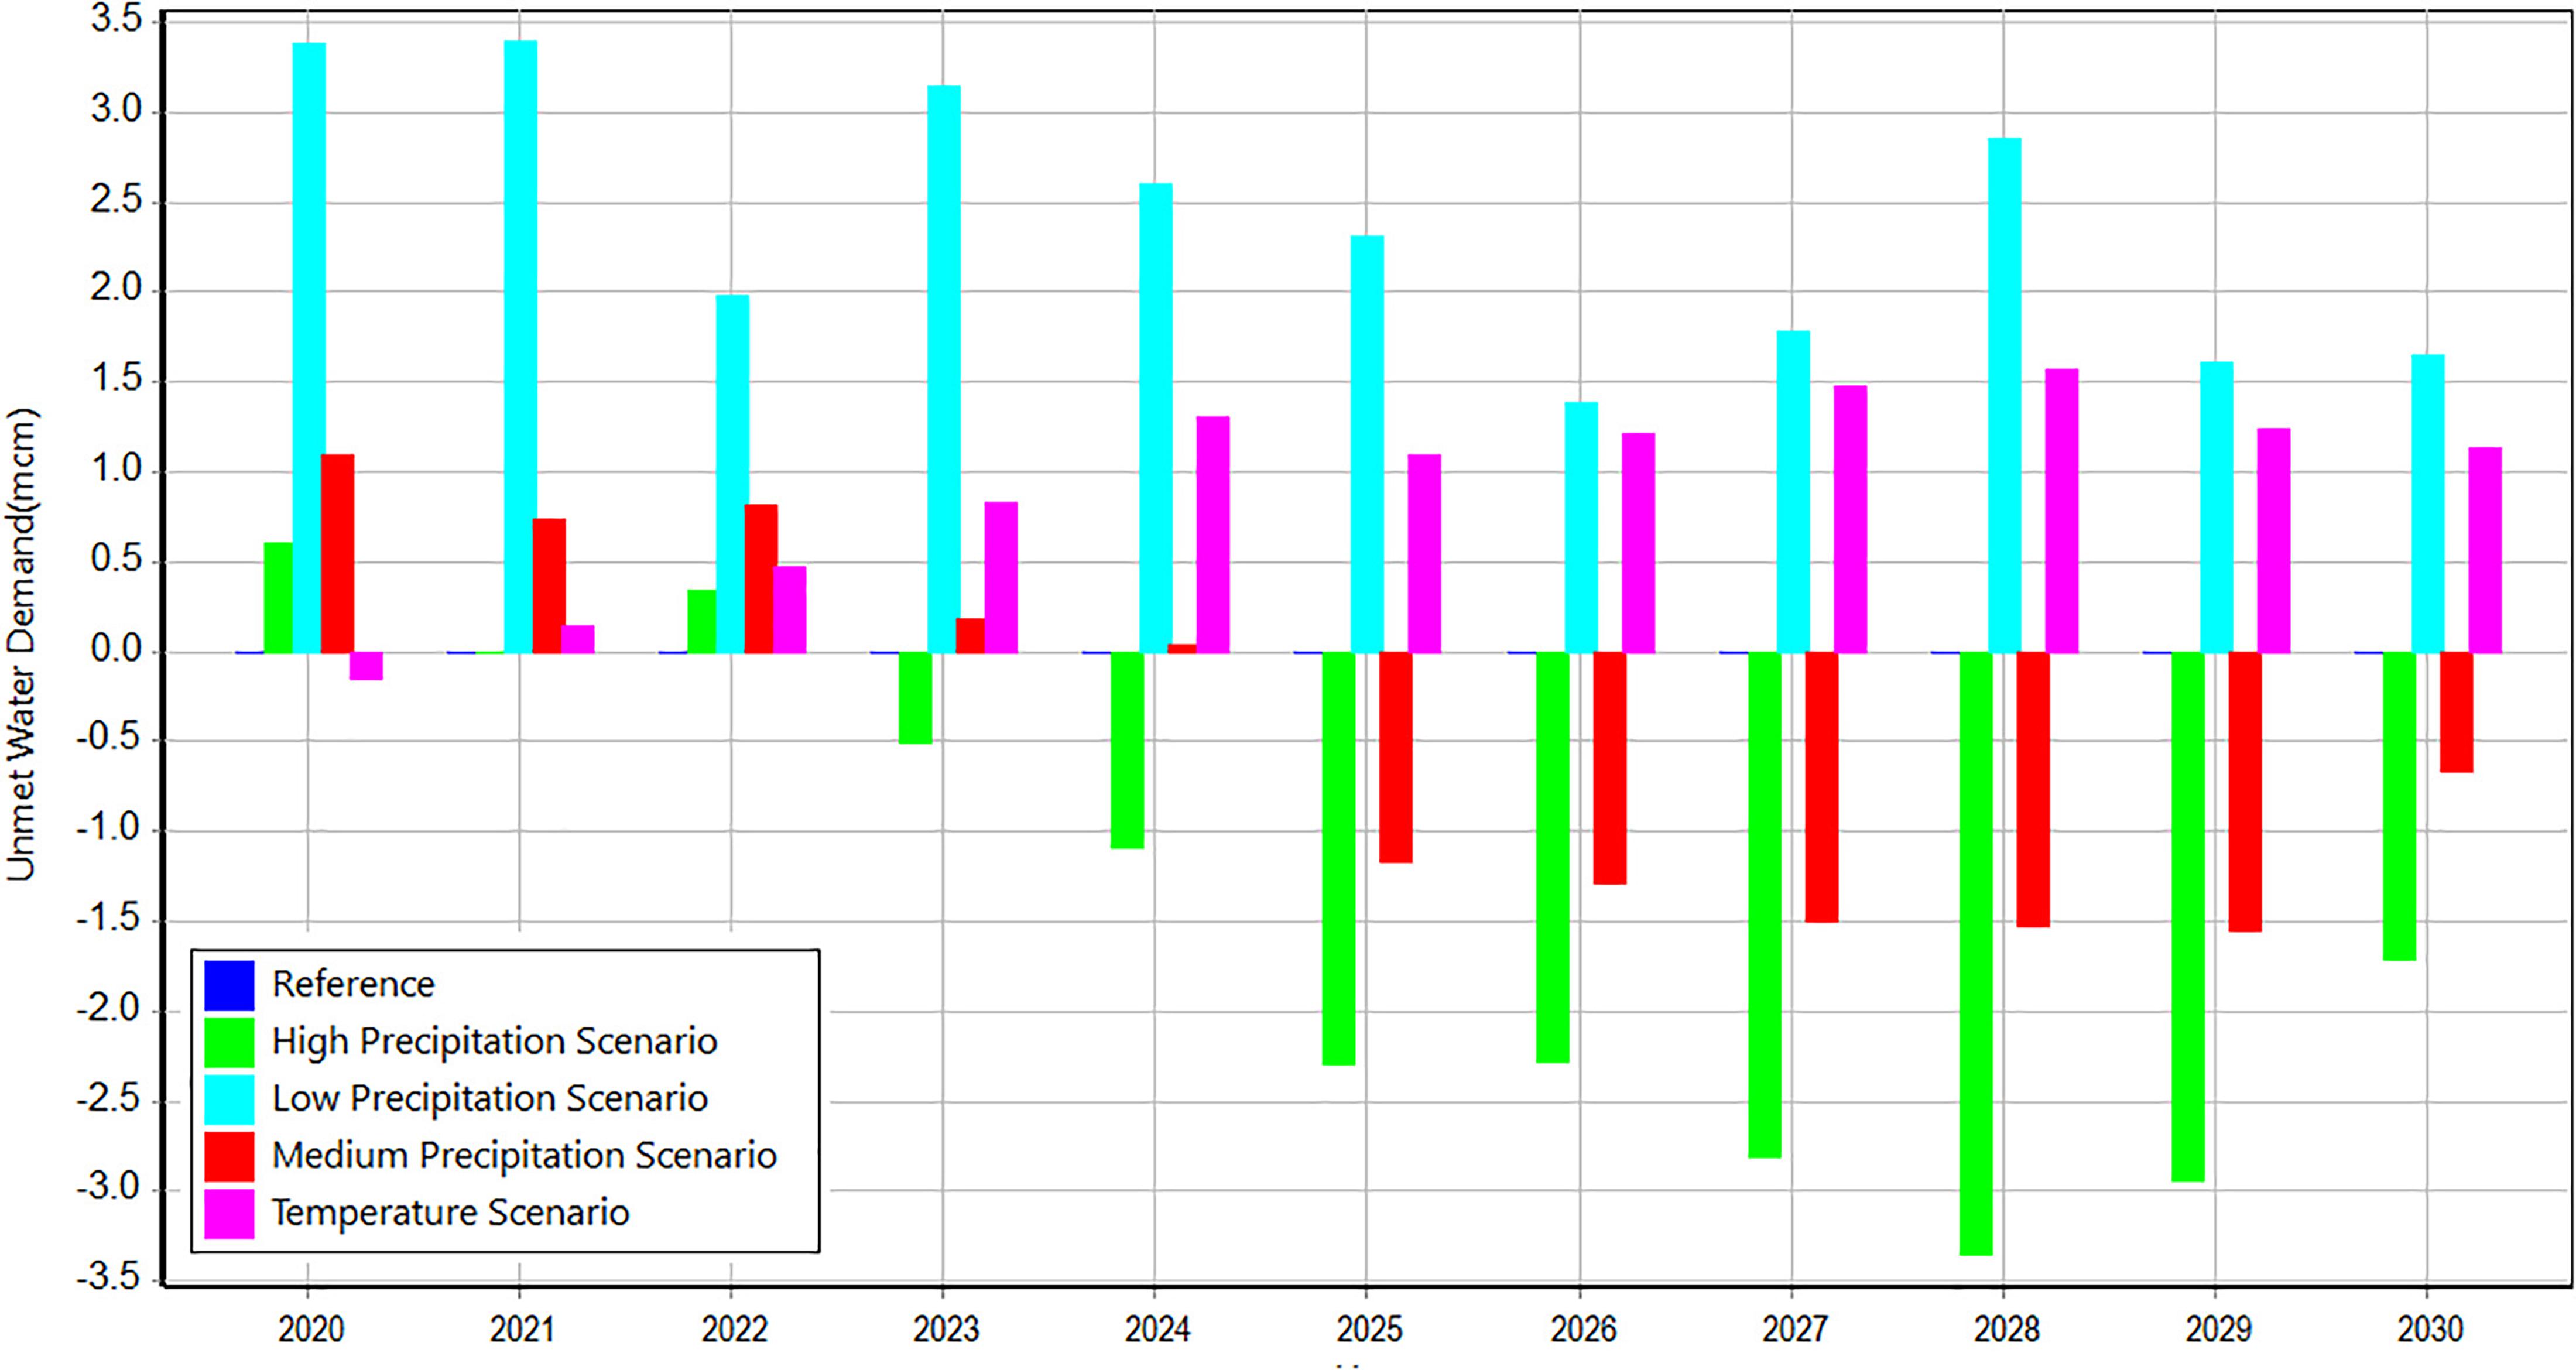
Figure 8. Unmet water demand variation due to low precipitation and temperature scenarios.
On the contrary, compared to the reference condition, the high precipitation scenario resulted in an increased water demand coverage. From 2020 to 2030, a maximum of 4% increase in monthly domestic water demand coverage was recorded due to the high precipitation scenario (Supplementary File 7). The medium precipitation scenario showed no pattern of changes in the water demand coverage. Though the medium precipitation scenario dominantly resulted in an increased domestic water demand coverage, there are years when the domestic demand coverage is lower than the reference condition. The climate change scenarios showed, though not significant compared with the population, climate change may affect the supply demand condition of the upper Awash sub-basin. The uncertainty on the severity of the climate change impact depends on the associated uncertainty on the degree of changes that may occur on the climate parameters.
Management Scenarios: Minimize or Avoid Water Loss
As indicated in section “Water Leakage Data,” a considerable amount of water gets lost before it reaches demand sites because of leakage from poor water supply distribution systems. To estimate the amount of water that could be saved by avoiding or at least minimizing unaccounted water, two scenarios were tested. Firstly, to halve water loss, which included reducing the average water loss considered for the reference scenario by half to 15% for Akaki, 9% for Mojo, 11% each for Melka Kunture and Koka catchments, and secondly, the “avoid water loss” scenario assumes zero water loss.
By minimizing water loss by half of the average reported, up to 103 MCM of unmet domestic water demand can be recovered in 2030 for the upper Awash sub-basin. If possible to avoid the entire water loss, up to 176 MCM water can be saved the same year.
Avoiding or minimizing water loss will not only decrease the unmet water demand but also minimize water supply requirements (demand + leakage), as a result, reduce the extent of stress which could have been exerted if more water had been required. The total water required to satisfy the upper Awash sub-basin was estimated to reduce by 26% in 2030, if the loss was managed to be completely avoided, compared with the reference condition (Supplementary File 8).
Management Scenarios: Additional Surface Water Supply Schemes
There are planned surface and groundwater supply sources being and to be introduced to the already existing surface and groundwater sources for the upper Awash sub-basin demands. The supply sources are assumed to be completed up to the last year of model simulation, 2030. The existing surface and groundwater supply schemes were considered for the reference scenario.
The planned surface water supply reservoirs (Gerbi and Sibilu) are expected to be built outside of the Awash River basin boundary. With the capability of WEAP to account for any water supply sources even outside of the model domain, the two planned surface water reservoirs to supply Addis Ababa city were represented in the WEAP-MODFLOW model. Based on the designed water supply capacity from the two reservoirs, maximum water flow is applied to start from 2025 (4.95 m3/s from Sibilu and 0.84 m3/s from Gerbi).
Based on the additional surface water supply schemes scenario, If the two surface water supply reservoir projects start operation according to the implementation schedule, Akaki catchment (Addis Ababa city) domestic water demand coverage will reach 100% in wet months of most of the year from 2025 to 2030 (Supplementary File 9). However, the additional water supply schemes scenario indicated that there are still months with unmet domestic water demand, even after completion of the planned surface water reservoirs. Hence, sustainable water supply alternative plans to improve supply or manage Addis Ababa city water demand are needed.
Management Scenarios: Additional Groundwater Abstraction
In addition to the planned surface water reservoirs (Gerbi and Sibilu), there are planned groundwater projects to drill more boreholes to supply Addis Ababa city (AAWSA, 2015). Though the additional groundwater abstraction increased Addis Ababa city water demand coverage in 2030 from about 26% for reference condition to 62% (Figure 7), more than a 20-meter groundwater level decline was predicted in some of the wells within the Akaki catchment (Figure 9). This scenario analysis clearly showed Addis Ababa city future water demand cannot be met with the available water resources without causing substantial depletion of the groundwater resources.
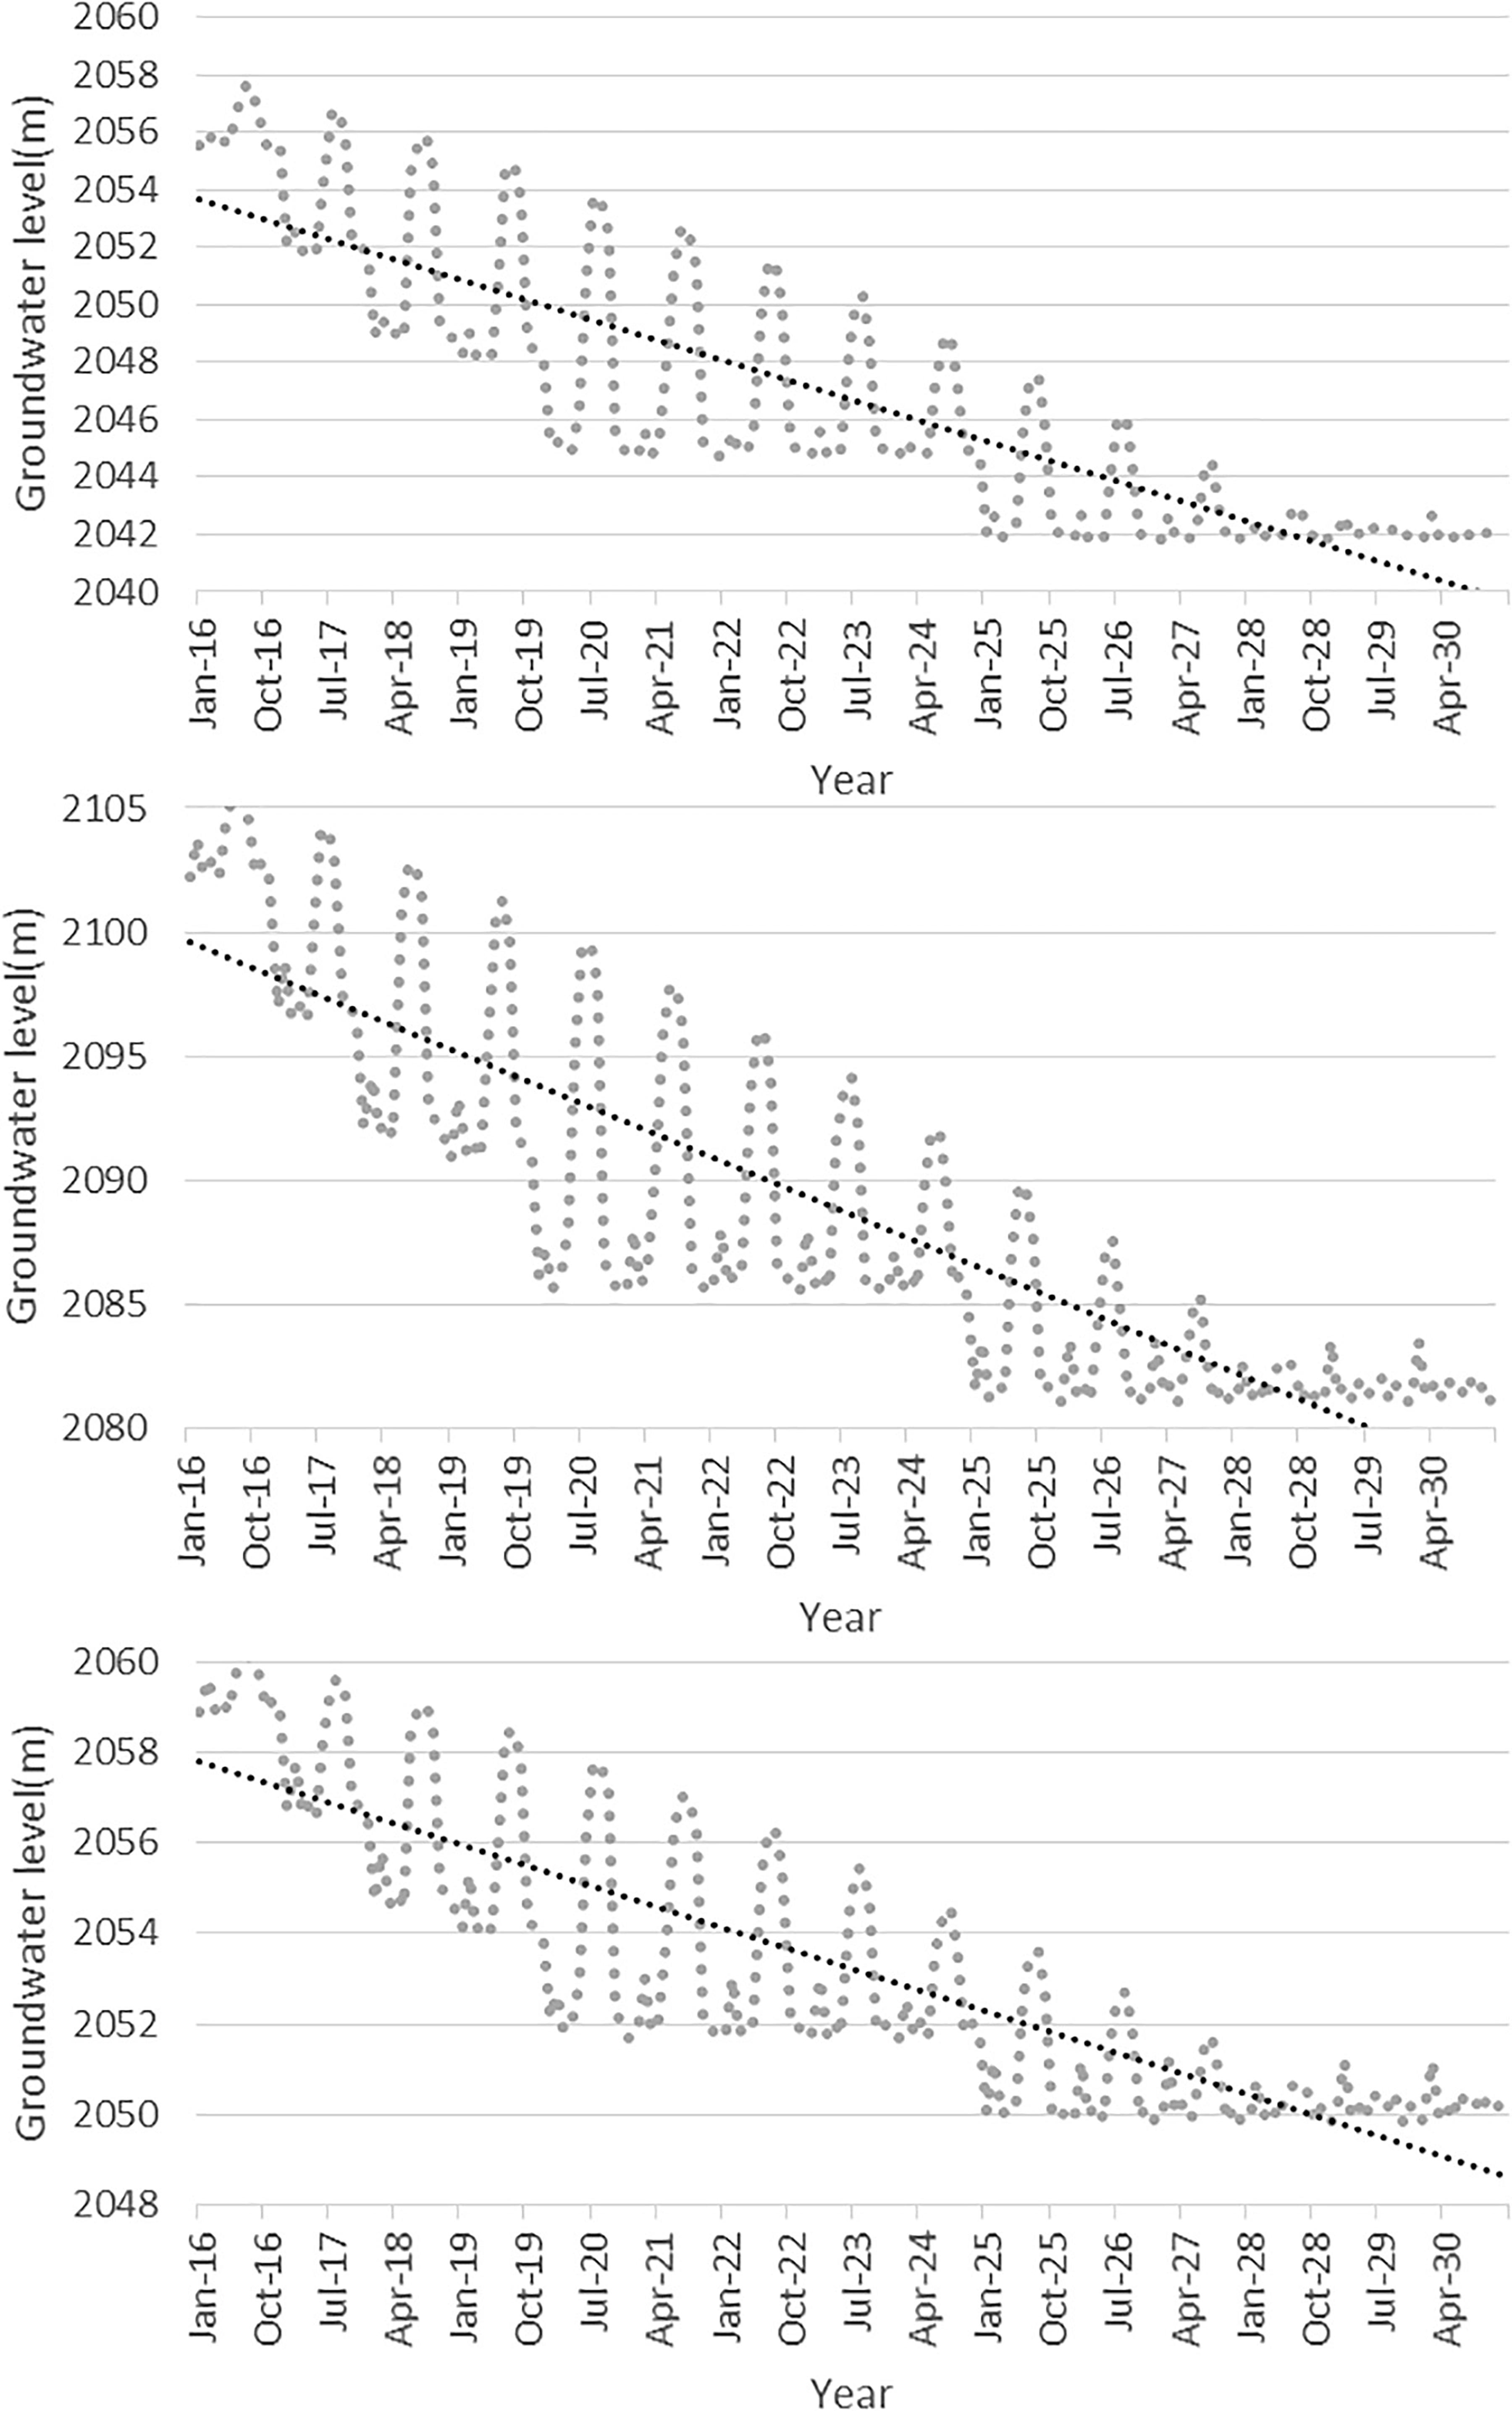
Figure 9. Akaki catchment groundwater level decline predicated in some of the wells due to additional groundwater abstraction scenario.
SW-GW Conjunctive Use Scenario
In this study, the current supply demand condition of the upper Awash sub-basin was established using the WEAP-MODFLOW model configuration. The reference condition predicted that the water demand in the upper Awash sub-basin will not be satisfied with the existing water supply conditions. Based on the population scenarios, the likely increase in population made the supply demand condition in the basin worse. Though the additional surface water supply schemes scenario increased the water demand coverage in the area by reducing the unmet Addis Ababa city water demand, there were dry period months when demand was not satisfied. The water loss management scenarios measurably contributed to reducing unmet water demand in the upper Awash sub-basin, but more was required to improve water scarcity conditions. The additional groundwater abstraction scenario has indicated, enhanced water supply condition was achieved with a potential impact on the groundwater resource.
One of the main reasons why this research was done was to show the importance of SW-GW conjunctive use to enhance water supply demand conditions without significant impact on the resources. In this scenario, both planned surface water supply reservoirs (Gerbi and Sibilu) and planned groundwater supply sources are dedicated to simultaneously supply Addis Ababa city domestic water demand.
When both the planned surface water reservoirs and the planned groundwater schemes were used to supply the upper Awash sub-basin, the unmet domestic water demand significantly decreased from 360 MCM in 2030 for the reference condition to 183 MCM (Figure 10). The decrease in the unmet domestic water demand in the basin is due to the major decline of Addis Ababa city domestic unmet water demand, a decrease of about 50% was estimated because of additional surface and groundwater supply schemes together.
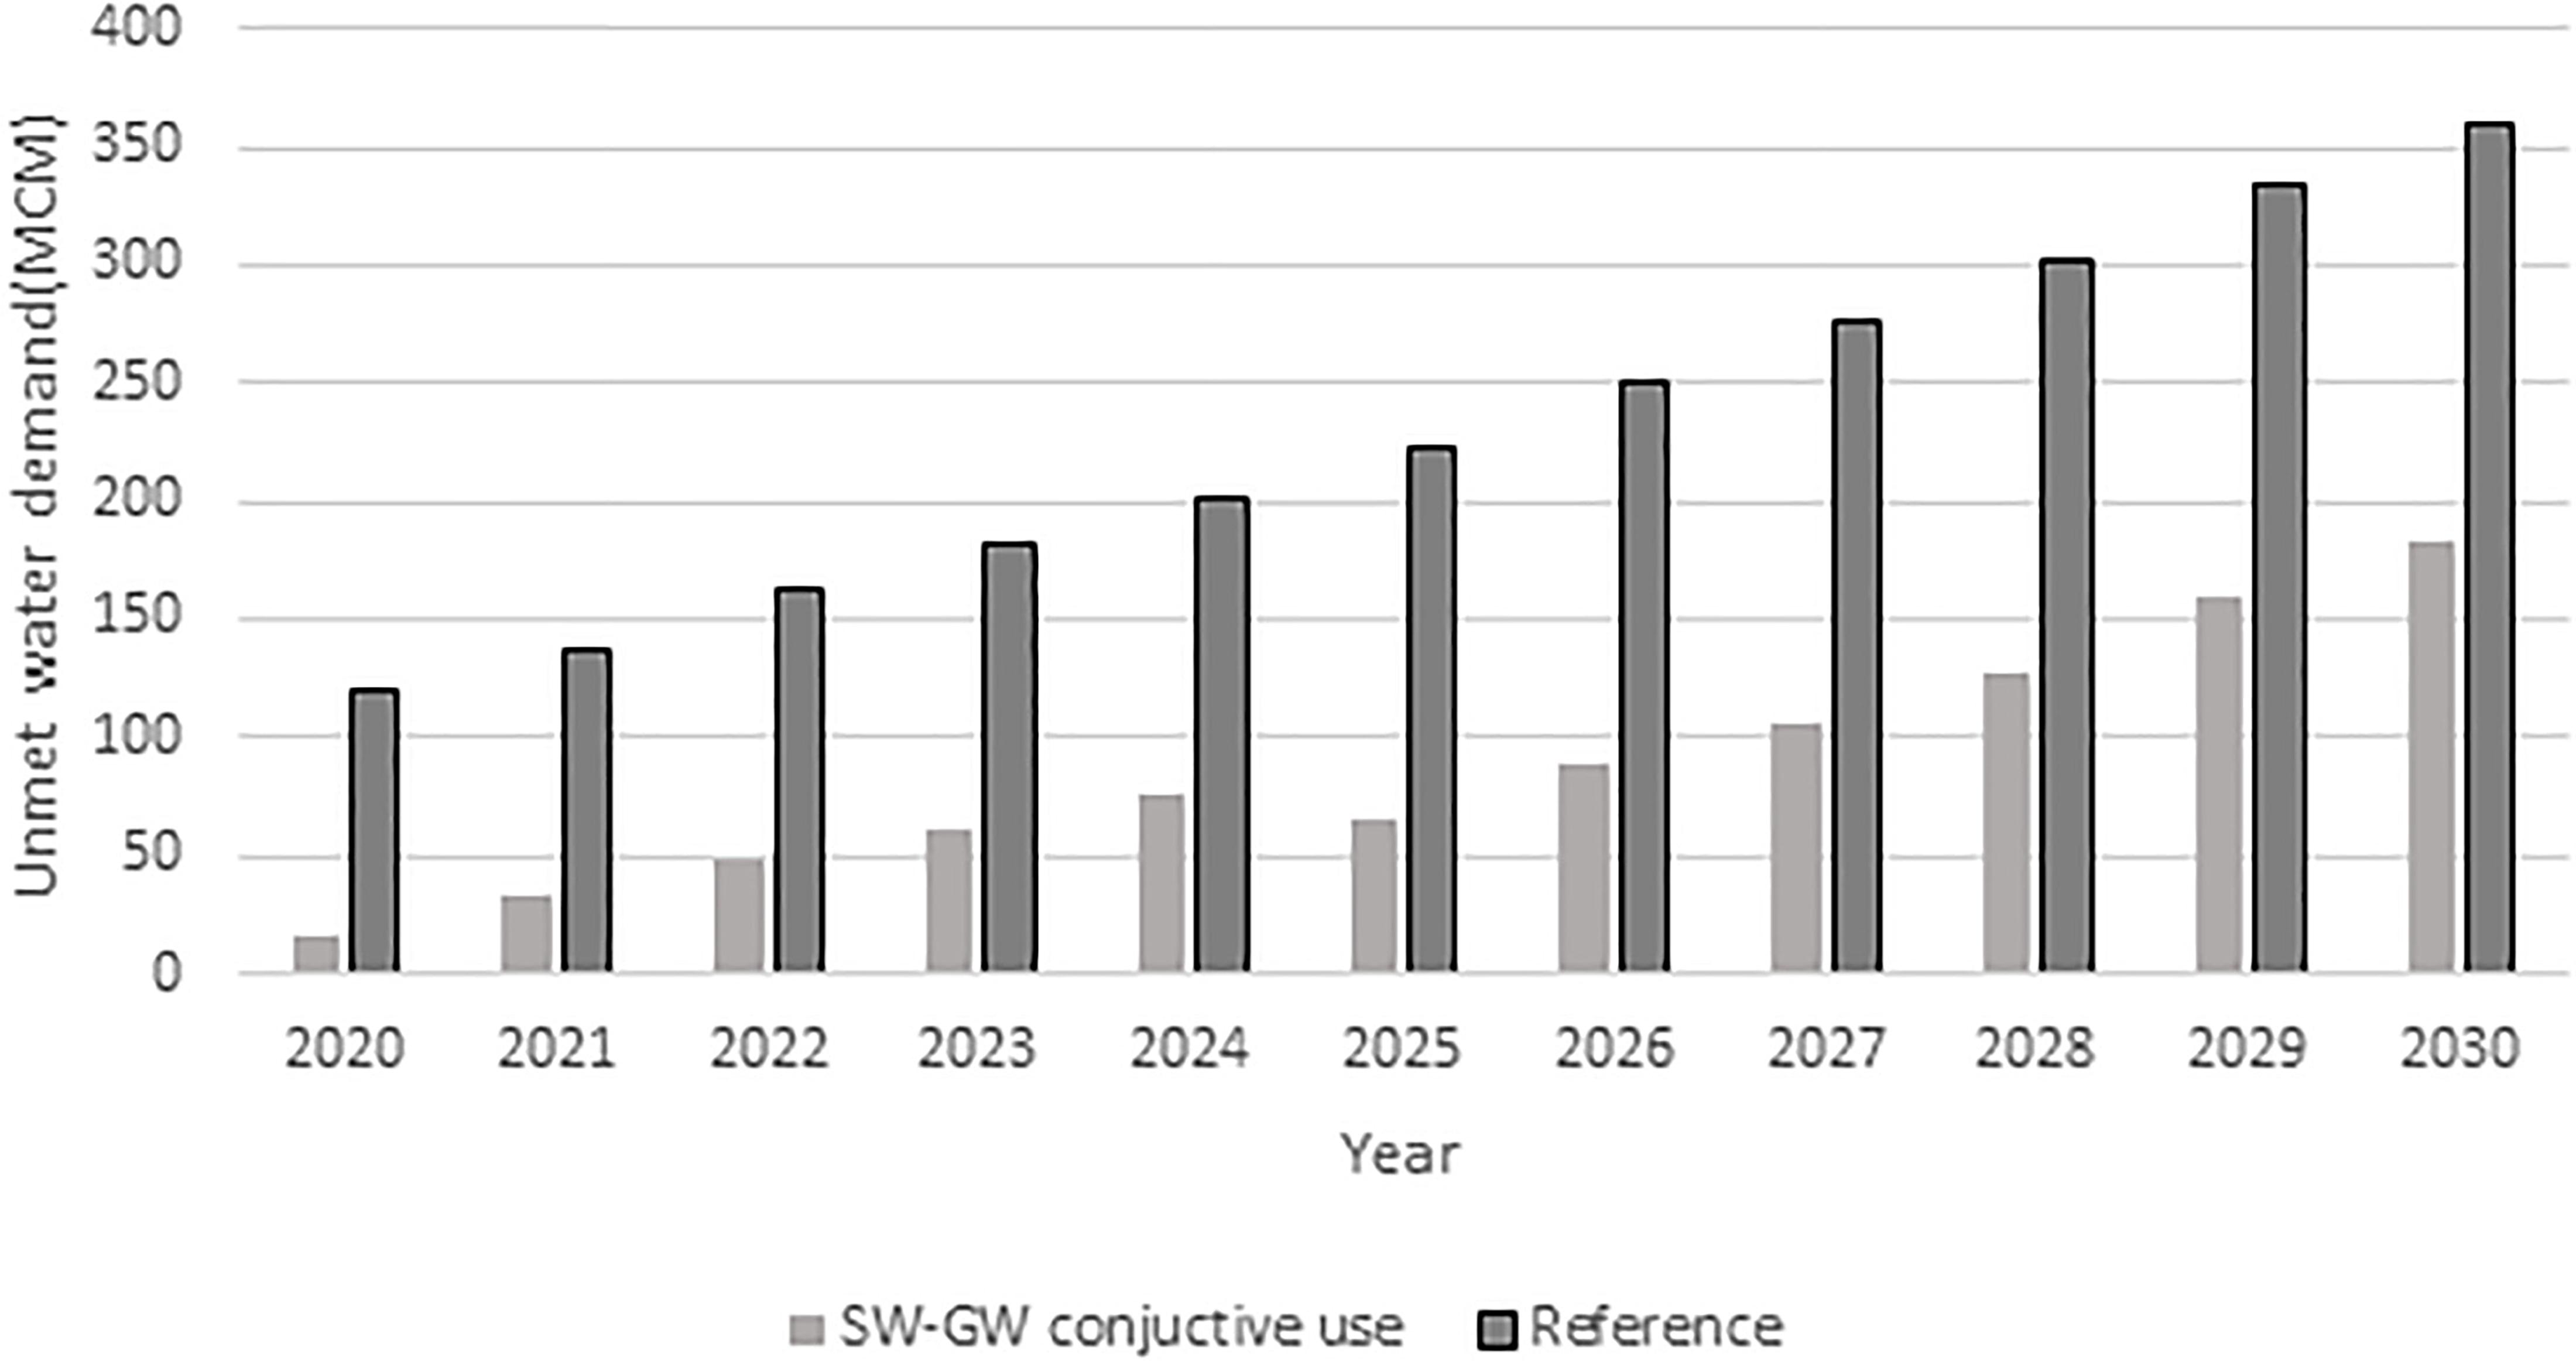
Figure 10. A decrease in domestic unmet demand in the upper Awash sub-basin as a result of conjunctive water use.
But still, though appreciably declined due to additional surface and groundwater supply schemes, there will be significant unmet water demand in the upper Awash sub-basin. To achieve 100% demand coverage, not only that there should be additional water supply schemes, the water loss due to old water supply distribution networks should be avoided. Figure 11 shows the result of a scenario developed integrating additional water supply schemes with avoiding water loss (conjunctive use + avoid water loss) scenarios. This scenario concluded that the unmet water demand decreased from 360 MCM for the reference condition in 2030 to 40 MCM, taking the water demand coverage from about 40% to more than 95% in most months of the year.
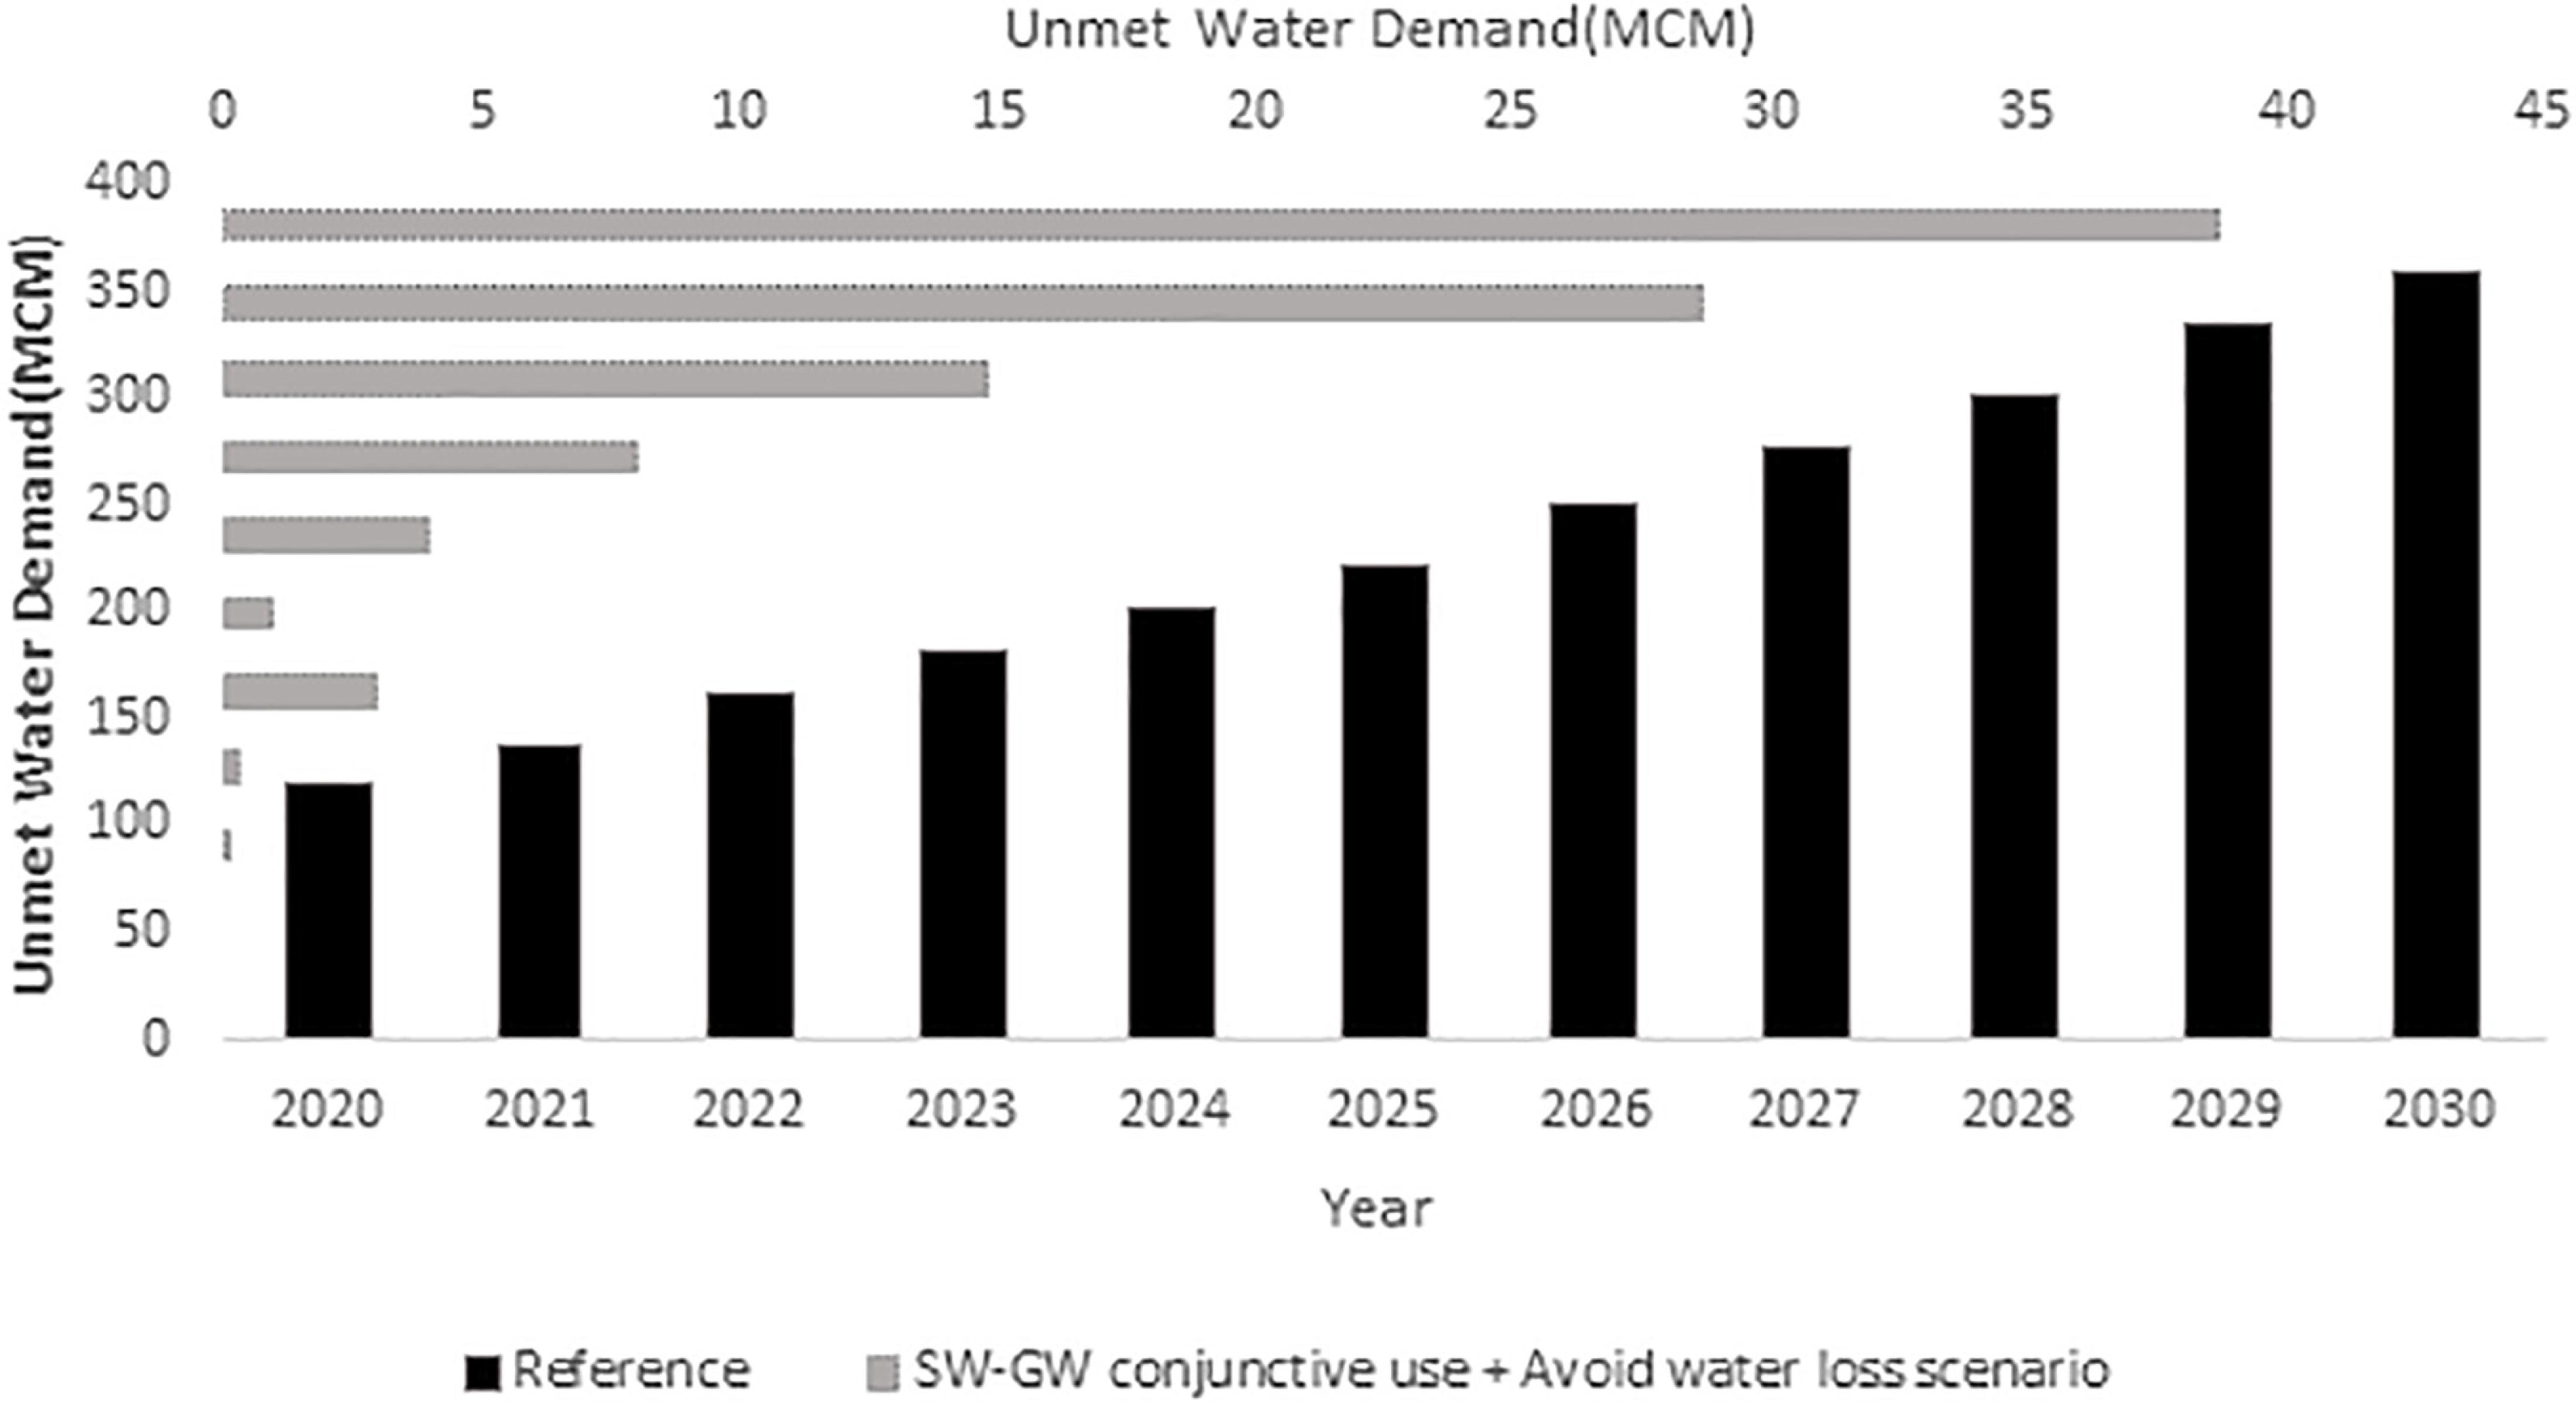
Figure 11. Unmet domestic water demand for conjunctive use and avoid water loss integrated scenario.
Because of the WEAP-MOFLOW new generation configuration, it was possible to evaluate both the demand and supply side perspectives. Figure 12 shows, water demand coverage can be boosted by the conjunctive use of surface and groundwater supply sources. But, even most importantly, this scenario underlined the conjunctive use of resources optimized the impact on the groundwater resource compared to measurable groundwater decline registered because of more groundwater abstraction scenario, which did not take the additional surface water supply schemes into account (Figure 12).
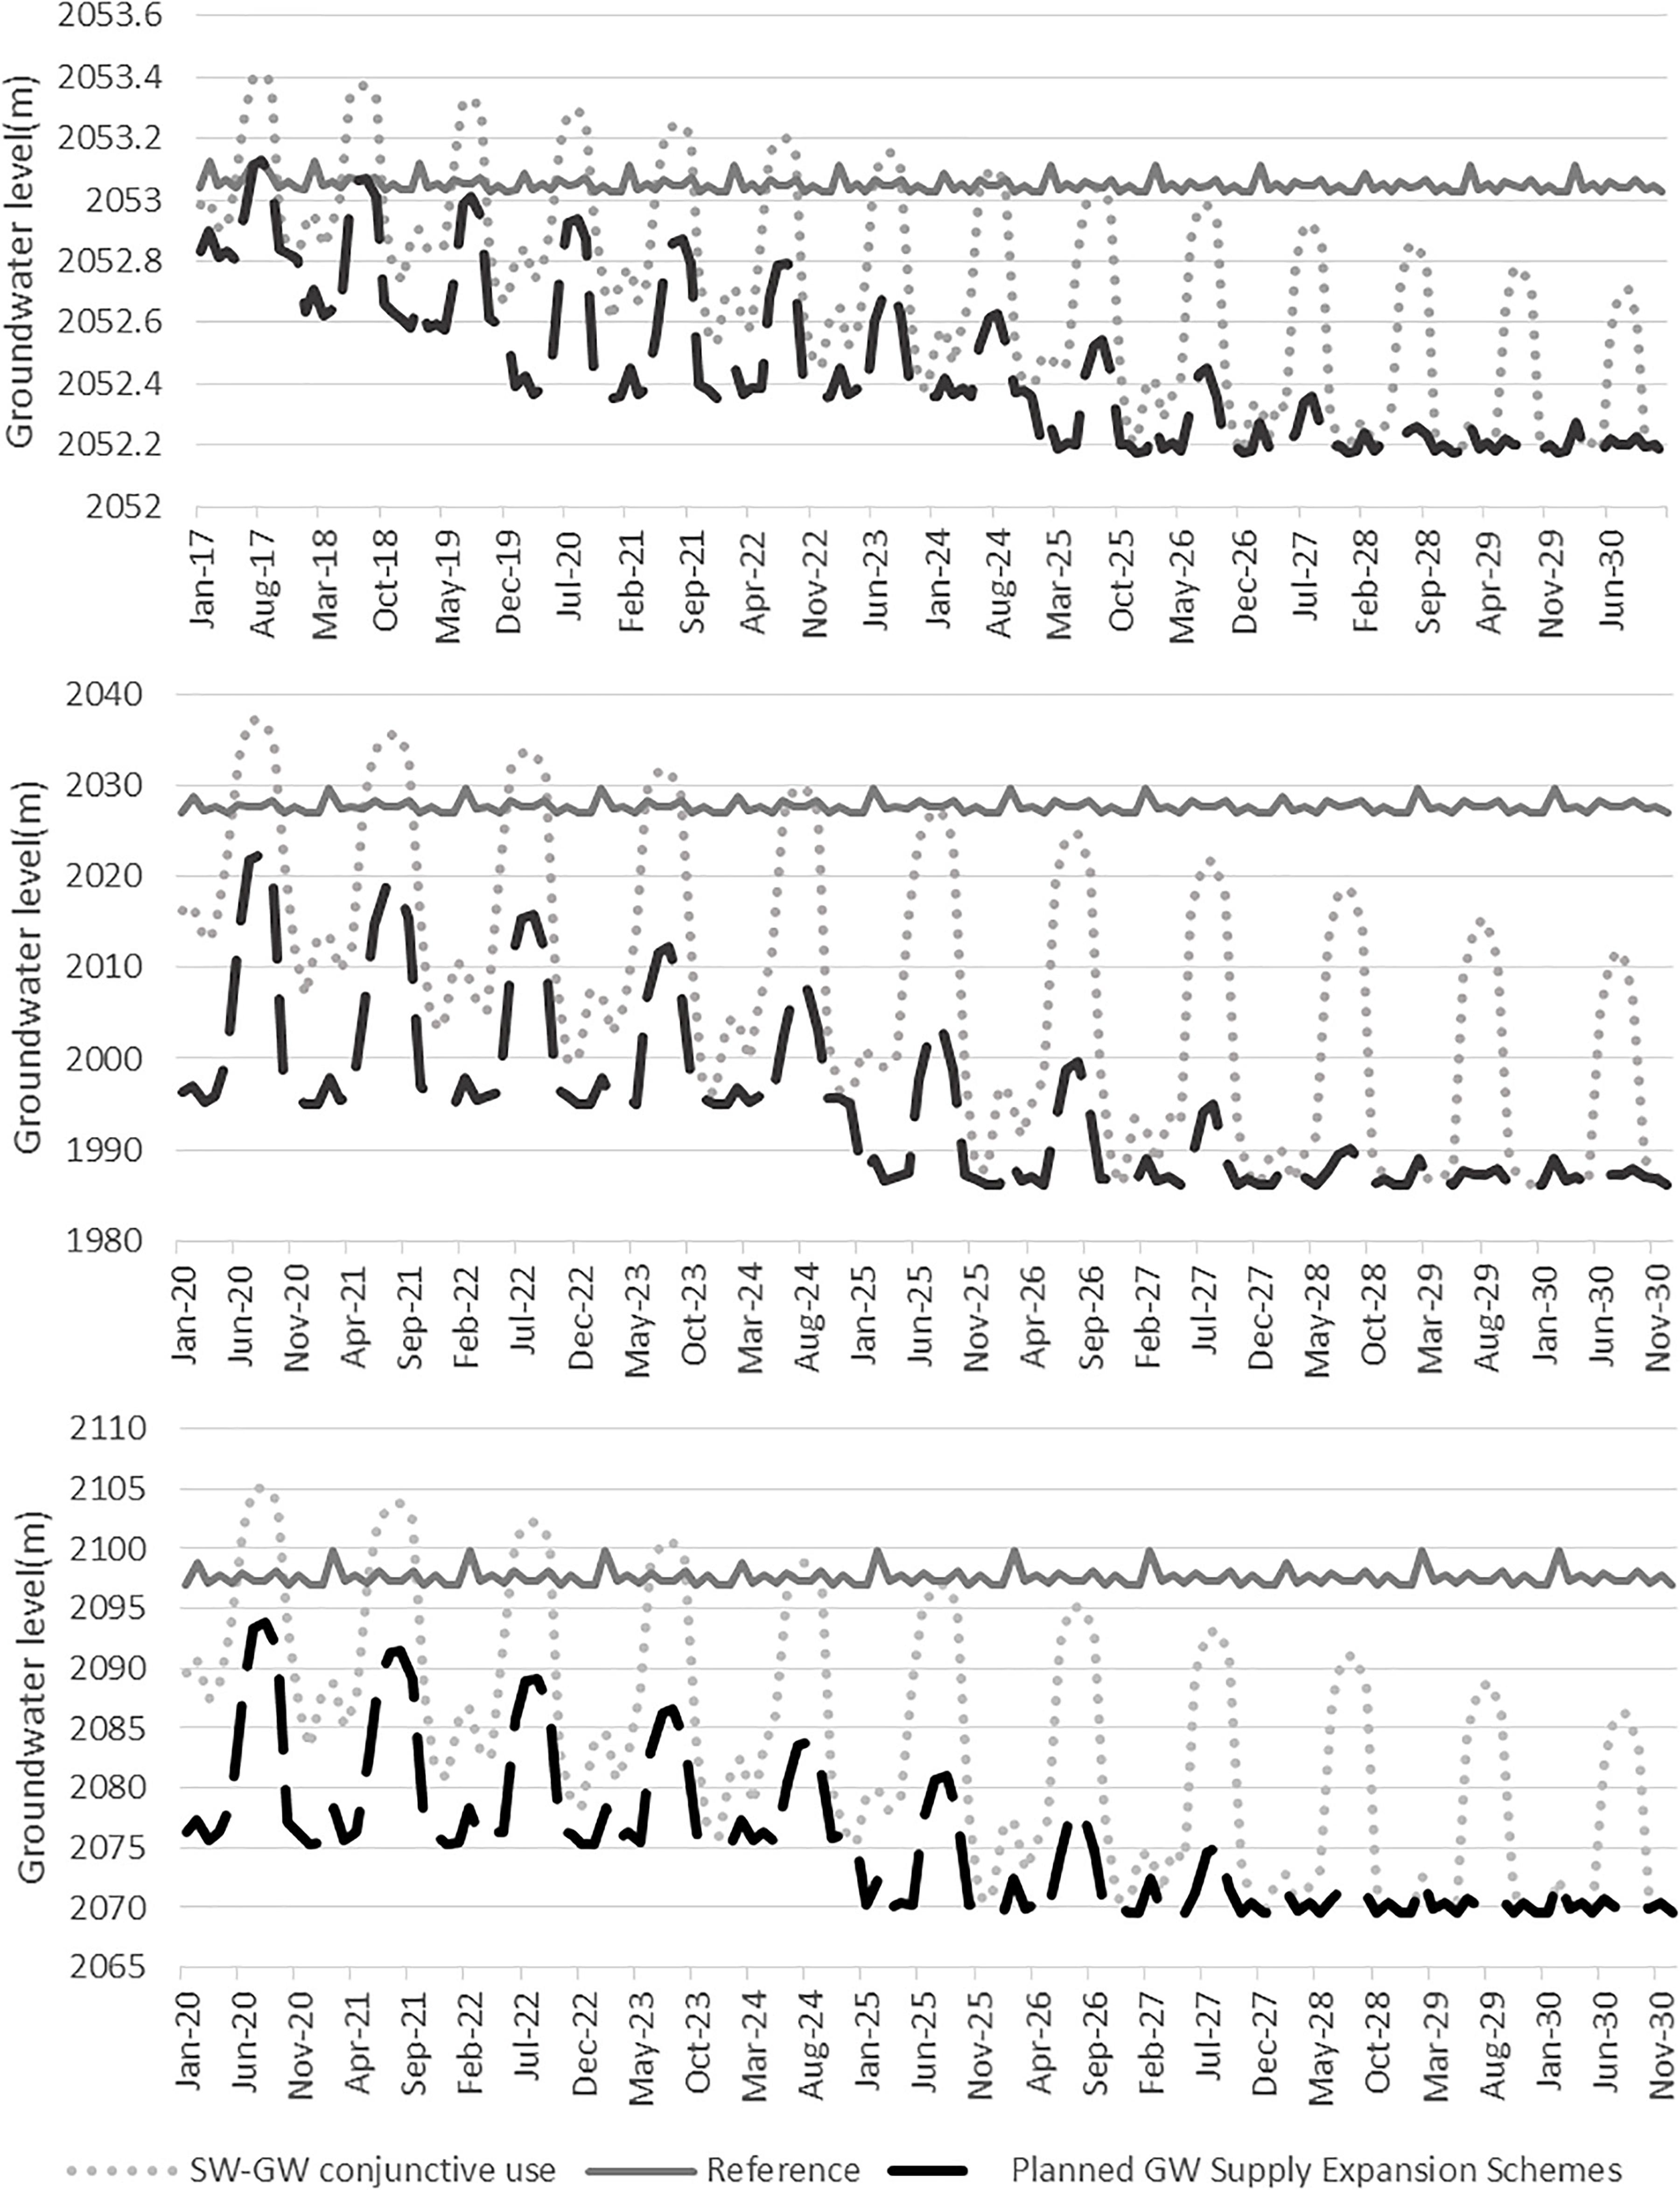
Figure 12. Akaki catchment groundwater level decline predicated in some of the wells due to additional groundwater abstraction scenario.
Limitations
The WEAP-MODFLOW dynamic linkage is a very powerful tool that helps to understand the surface and groundwater hydrology of a region. The linkage not only tries to realistically configure both surface and groundwater systems (supply side modeling) but also represents the population, livestock, industries, and irrigation schemes (demand-side modeling). Therefore, the WEAP-MODFLOW linkage is a data-intensive modeling procedure. In this regard, the WEAP-MODFLOW model configured for the upper Awash sub-basin is a reasonable simplification of the supply demand condition in the basin which has corresponding limitations in model precision and how the model can be used.
For example, due to a lack of time-series data to calibrate the model for the more robust transient condition, the groundwater model was simulated for a steady-state condition. In this study, the potential stress on the water supply sources due to the likely changes to livestock and industrial water demands were not considered. Since domestic water demand is the highest compared to the rest, changes were evaluated only for population projections. Supply demand situations of future groundwater abstraction for irrigation, together with changes in living standards are left to be the future areas of research.
Conclusion
To implement a comprehensive water management program based on the conjunctive use of surface and groundwater resources, the WEAP-MODFLOW link is configured for four catchments (Akak, Melka Kunture, Mojo, and Koka) in the upper Awash sub-basin, central Ethiopia. Likely impacts of different scenarios on water demand and supply conditions were analyzed.
The amount of water demand in the upper Awash sub-basin (domestic, livestock, and industrial) in 2009 was 197 MCM. It has increased by 35% in 2020 (315 MCM) and will increase by more than twofold in 2030 (488 MCM). The water leakage from old water supply distribution networks will increase the water supply requirements even more by 2030 (663 MCM). Though not as severe as population and water loss, climate change may affect the supply demand condition in the basin.
The continuous abstraction of the groundwater resource will appreciably boost domestic demand coverage in the upper Awash sub-basin. But, it will markedly affect the groundwater resources. Especially in the Akaki catchment where Addis Ababa is located, more than 20 m groundwater level decline is predicted. The impact predicted in the groundwater storage is not only because of groundwater abstraction for domestic water demand but the sum effect of abstraction for industrial uses and livestock.
The dynamically integrated model configured for the upper Awash sub-basin showed that if the planned surface water supply reservoir schemes are completed and used together with the groundwater resources, they will have a positive impact not only in terms of improving the water security concern but also by lifting some of the stresses from the groundwater resources.
To address heterogeneous water management issues, more vigorous planning and development of surface-groundwater conjunctive use and management approaches and policy interventions are recommended. Priority should also be given to noticeably minimize the considerable amount of water loss and improving water use efficiency.
Generally, the selection of an effective water management strategy option lies in the understanding of the delicate interplay among water supply demand situations, water use efficiency, and likely impact on the resources under the unpredictably changing environment. In the upper Awash sub-basin, the conventional water management intervention (to abstract more of the resource to satisfy increasing demand) seems the dominant water management strategy. Such water management trends likely end up to unwise utilization of the groundwater which puts stress on the resource (Figure 13). Impact on the water supply sources due to abstraction to satisfy demand should be optimized with a consideration of controlling the water supply (setting the priority of the demand sites, from which source? what amount? and when?), minimizing water loss through efficient utilization and managing the water demand with appropriate use of technology. In this study, both supply and demand-side perspectives of effective water management options were addressed. The importance of minimizing water loss, measuring impact, and controlling water supply through surface-groundwater conjunctive use strategy was recommended.
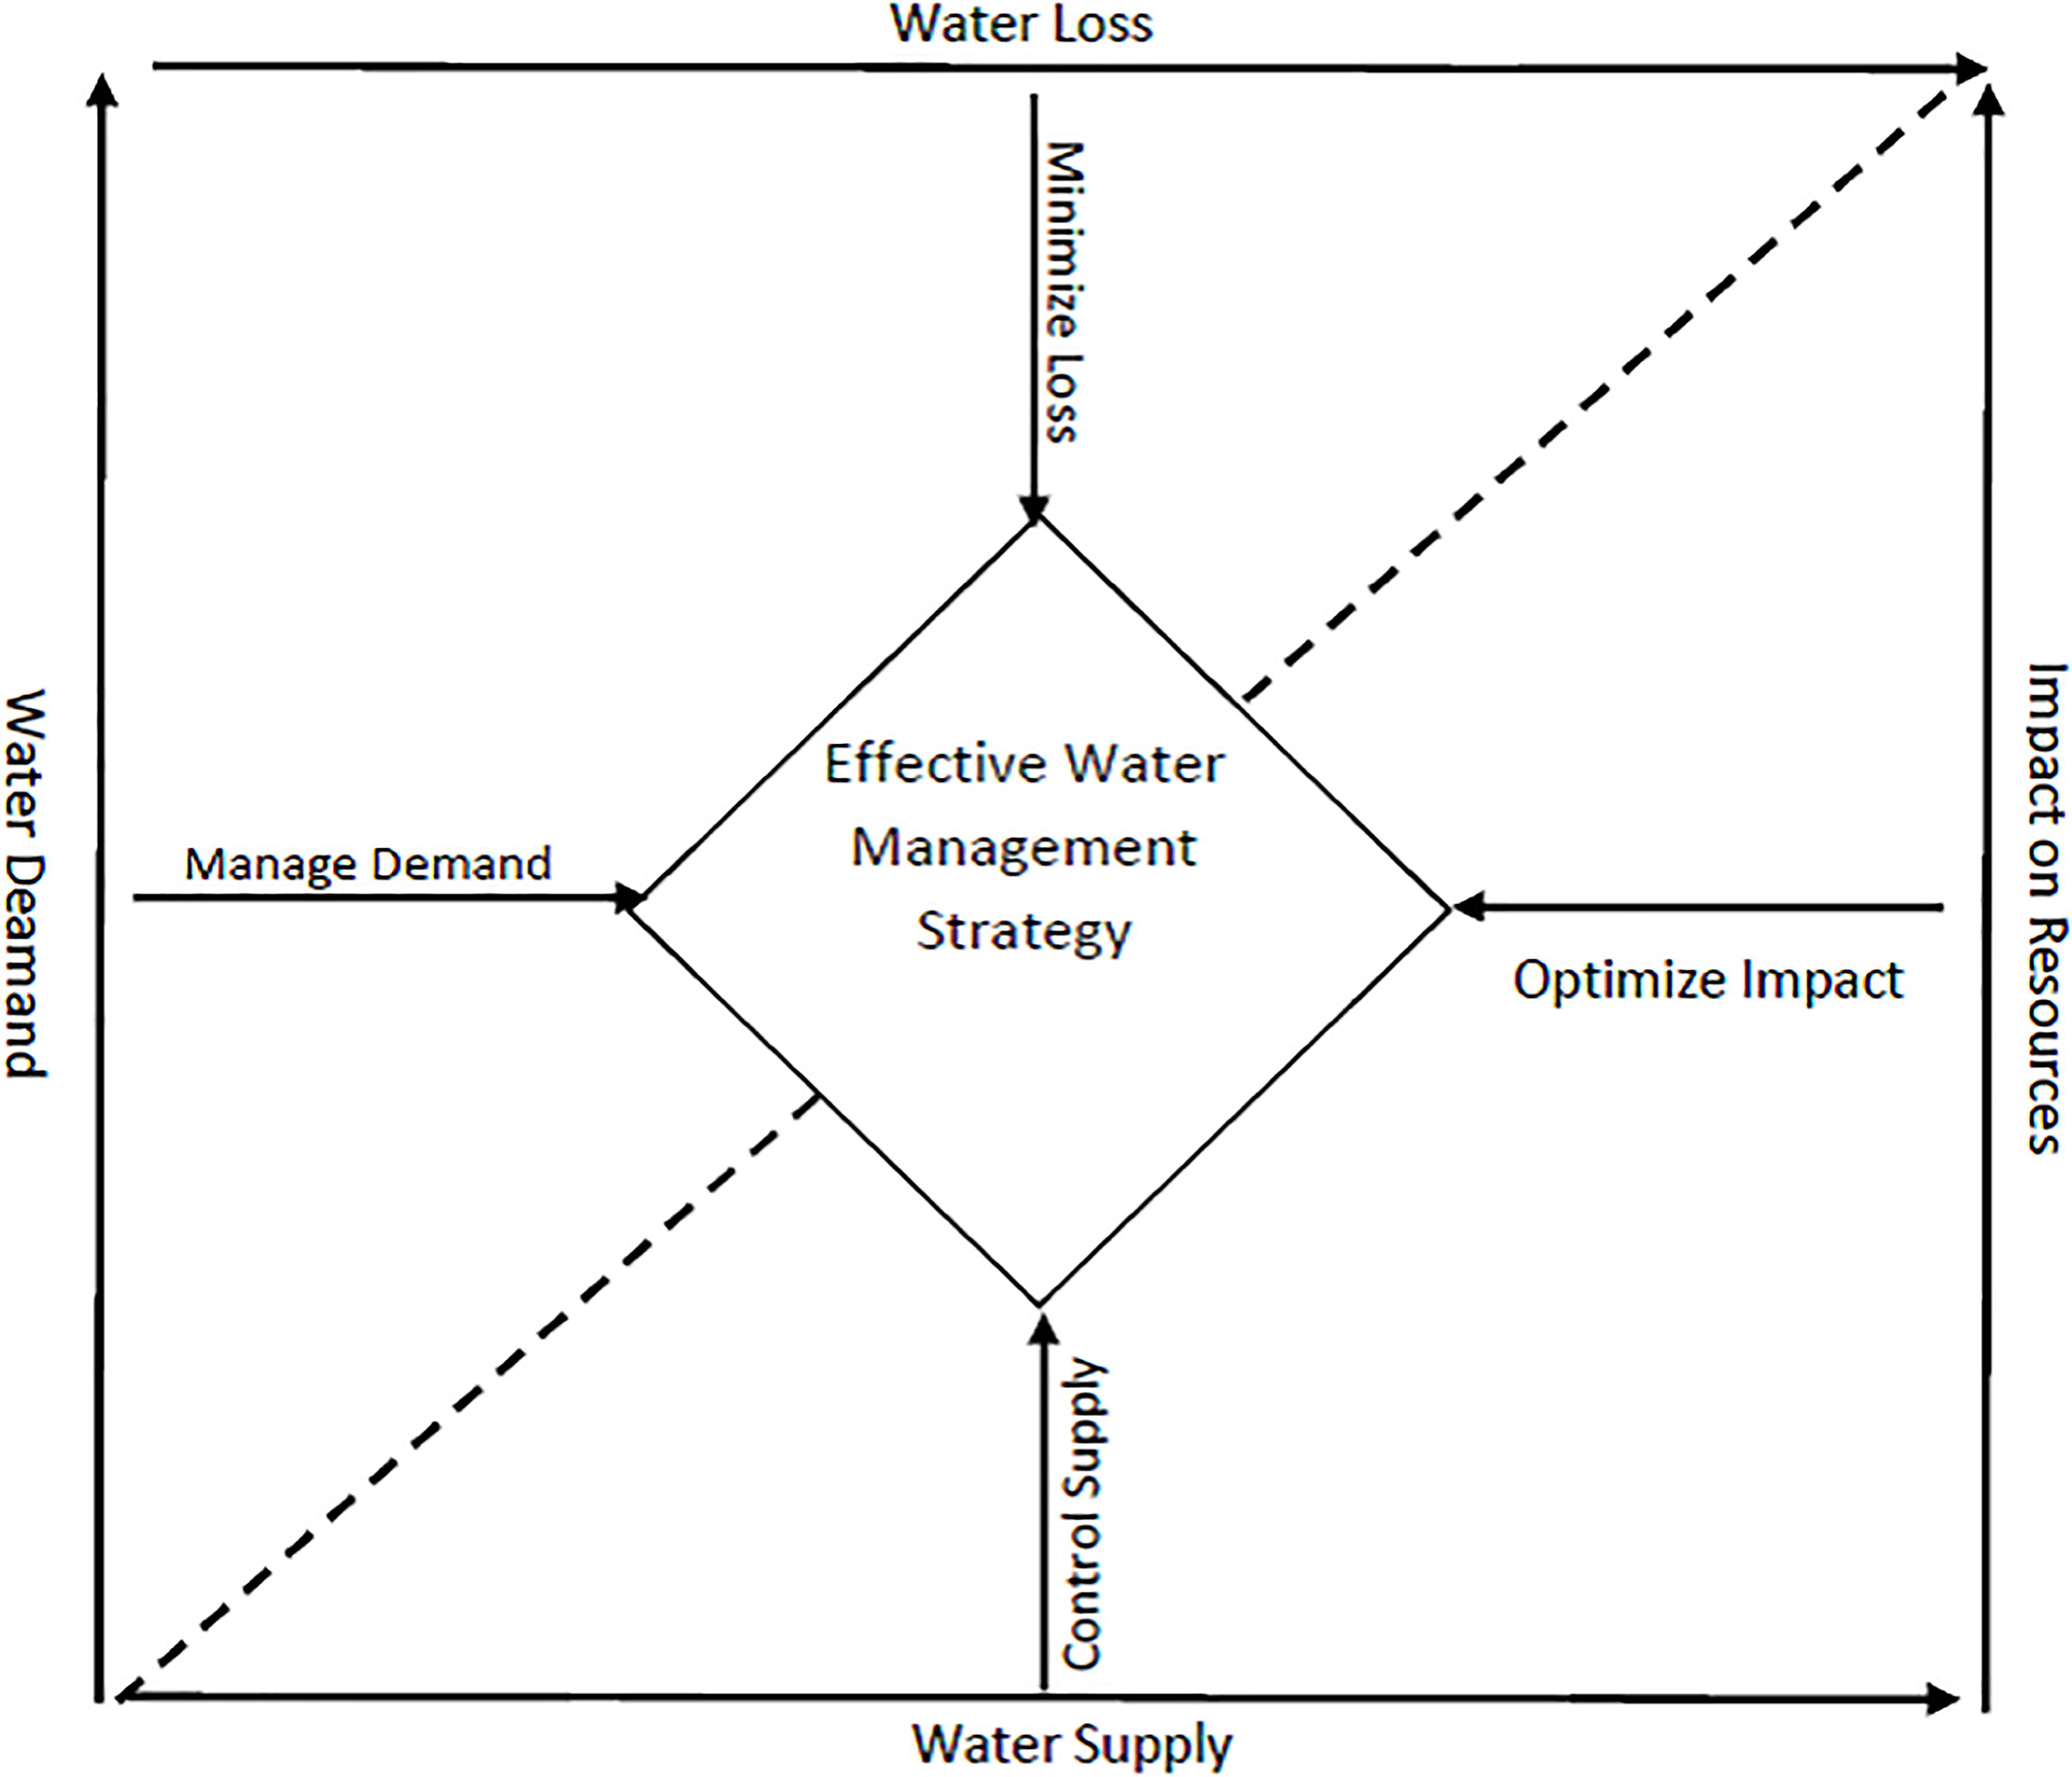
Figure 13. The interplay among supply and, demand-side factors affecting effective water management strategy.
Data Availability Statement
The original contributions presented in the study are included in the article/Supplementary Material, further inquiries can be directed to the corresponding author/s.
Author Contributions
BB, SK, KC, and MT: conceptualization and writing. AA and MB: field data collection and data compilation. All authors contributed to the article and approved the submitted version.
Funding
This document is an output from the REACH program funded by UK Aid from the UK Foreign, Commonwealth, and Development Office (FCDO) for the benefit of developing countries (Programme Code 201880).
Disclaimer
The views expressed, and information contained in this article are not necessarily those of, or endorsed by FCDO, which can accept no responsibility for such views or information or any reliance placed on them.
Conflict of Interest
The authors declare that the research was conducted in the absence of any commercial or financial relationships that could be construed as a potential conflict of interest.
Acknowledgments
The authors acknowledge the logistics support by Addis Ababa University, Water and Land Resource Centre, School of Earth Sciences, Addis Ababa Water and Sewerage Authority, and the Ministry of Water, Irrigation and Electricity-Ethiopia.
Supplementary Material
The Supplementary Material for this article can be found online at: https://www.frontiersin.org/articles/10.3389/feart.2021.656726/full#supplementary-material
Footnotes
References
AAWSA (2015). Addis Ababa Water and Sewerage Authority Growth and Transformation Plan II from 2015-2020. Addis Ababa: AAWSA.
Ahmadi, A., Ohab-Yazdi, S. A., Zadehvakili, N., and Safavi, H. R. (2018). A dynamic model of water resources management using the scenario analysis technique in downstream of the Zayandehroud basin. Int. J. River Basin Manag. 17, 451–463. doi: 10.1080/15715124.2018.1505734
Almomani, T., and Hamdan, I. (2009). WEAP-Modflow Coupling as a DSS Tool for the Corridor Well Field (North East WEAP-Modflow Coupling as a DSS Tool for the Corridor Well Field (North East of JORDAN). New York, NY: IWRM.
Authority, A. B., and Werer, M. (2017). Awash River Basin Water Allocation Modeling and Conflict Resolution Study Project WP-1?: Surface Water Resources Study Final Report. New York, NY: IWRM.
Azagegn, T., Asrat, A., Ayenew, T., and Kebede, S. (2015). Litho-structural control on interbasin groundwater transfer in central Ethiopia. J. Afr. Earth Sci. 101, 383–395. doi: 10.1016/j.jafrearsci.2014.10.008
Bekele, D., Alamirew, T., Kebede, A., Zeleke, G., and Melesse, A. M. (2019). Modeling climate change impact on the hydrology of keleta watershed in the Awash River Basin, Ethiopia. Environ. Model. Assess. 24, 95–107. doi: 10.1007/s10666-018-9619-1
Bittinger, M. (1967). Simulation and Analysis of Stream-Aquifer Systems. All Graduate Theses and Dissertations. Logan: Utah State University.
Bredehoeft, J. D., and Young, R. A. (1983). Conjunctive use of groundwater and surface water for irrigated agriculture: risk aversion. Water Resour. Res. 19, 1111–1121. doi: 10.1029/wr019i005p01111
Central Statistical Agency [CSA] (2013). Population Projection of Ethiopia for All Regions At Wereda Level from 2014 – 2017. Seattle: CSA.
Condon, L. E., and Maxwell, R. M. (2013). Implementation of a linear optimization water allocation algorithm into a fully integrated physical hydrology model. Adv. Water Resour. 60, 135–147. doi: 10.1016/j.advwatres.2013.07.012
Cuthbert, M. O., Taylor, R. G., Favreau, G., Todd, M. C., Shamsudduha, M., Villholth, K. G., et al. (2019). Observed controls on resilience of groundwater to climate variability in sub-Saharan Africa. Nature 572, 230–234.
Dehghanipour, A. H., Zahabiyoun, B., Schoups, G., and Babazadeh, H. (2019). A WEAP-MODFLOW surface water-groundwater model for the irrigated Miyandoab plain, Urmia lake basin, Iran: multi-objective calibration and quantification of historical drought impacts. Agric. Water Manag. 223:105704. doi: 10.1016/j.agwat.2019.105704
Demlie, M., Wohnlich, S., Gizaw, B., and Stichler, W. (2007). Groundwater recharge in the Akaki catchment, central Ethiopia?: evidence from environmental isotopes (d 18 O, d 2 H and 3 H) and chloride mass balance. Hydrol. Process. 21, 807–818. doi: 10.1002/hyp.6273
Fotovat, M., Sedghi, H., and Babazadeh (2019). Evaluation of WEAP-MODFLOW Model as an Integrated Water Resources Management Model for Sustainable Development (A Case Study: Gharesoo at Doab-Merek, Kermanshah, Iran). Civil Eng. Infrastruct. J. 52, 167–183.
Franke, T. E., and Reilly, O. L. (1987). The Effects of Boundary Conditions on the Steady-State Response of Three Hypothetical Ground-Water Systems- Results and Implications of Numerical Experiments. Rome: FAO.
Gaiser, T., Printz, A., Schwarz von Raumer, H. G., Stahr, K., and Barthel, R. (2008). Development of a regional model for integrated management of water resources at the basin scale. Phys. Chem. Earth 33, 175–182.
Gamachu, D. (1977). Aspects of Climate and Water Budget in Ethiopia. Addis Ababa: Addis Ababa University Press.
Hadded, R., Alshihabi, O., Maßmann, J., Huber, M., Laghouane, A., Yahiaoui, H., et al. (2013). A decision support system to manage the groundwater of the zeuss koutine aquifer using the WEAP-MODFLOW framework. Water Resour. Manag. 27, 1981–2000. doi: 10.1007/s11269-013-0266-7
Harbaugh, M. G., Banta, A. W., Hill, E. R., and McDonald, M. C. (2000). MODFLOW-2000, the U.S. Geological Survey Modular Ground-Water Model—User Guide to Modularization Concepts and the Ground-Water Flow Process. Reston: USGS.
Huber, M. (2013). The German Federal Institute for Geosciences and Natural Resources (BGR) LinkKitchen User Manual Software Version: 2.0.
Kebede, S. (2016). Groundwater in Ethiopia?: Features, Numbers and Opportunities. Berline: Springer-Verlag.
Kidanewold, B. B., Seleshi, Y., and Melesse, A. M. (2014). Surface Water and Groundwater Resources of Ethiopia?: Potentials and Challenges of Water Resources Development Chapter 6 Surface Water and Groundwater Resources of Ethiopia?: Potentials and Challenges of Water Resources Development. Reston: USGS.
Latif, M., and James, L. D. (1991). Conjunctive water use to control waterlogging and salinization. J. Water Resour. Plann. Manag. 117, 611–628. doi: 10.1061/(asce)0733-9496(1991)117:6(611)
Li, P., Qian, H., and Wu, J. (2018). Conjunctive use of groundwater and surface water to reduce soil salinization in the Yinchuan Plain, North-West China. Int. J. Water Resour. Dev. 34, 337–353. doi: 10.1080/07900627.2018.1443059
Macdonald, A. M., Bonsor, H. C., and Dochartaigh, B. ÉÓ, and Taylor, R. G. (2012). Quantitative maps of groundwater resources in Africa. Environ. Res. Lett. 7:024009. doi: 10.1088/1748-9326/7/2/024009
Marino, M. A. (2001). Conjunctive management of surface water and groundwater. IAHS AISH Publ. 268, 165–173.
Maßmann, J., Wolfer, J., Huber, M., Schelkes, K., Hennings, V., Droubi, A., et al. (2012). “topic: 1 Groundwater quality sustainability 1.10 Decision support tools for sustainable groundwater management title: WEAP-MODFLOW as a Decision Support System (DSS) for integrated water resources management: design of the coupled model and results from a,” in Groundwater Quality Sustainability. International Association of Hydrogeologists Selected Papers, eds P. Maloszewski, S. Witczak, and G. Malina (Boca Raton, FL: CRC Press).
Mengistu, H. A., Demlie, M. B., and Abiye, T. A. (2019). Review: groundwater resource potential and status of groundwater resource development in Ethiopia. Hydrogeol. J. 27, 1051–1065. doi: 10.1007/s10040-019-01928-x
Ministry of Water Resources (2011). Ethiopia?: Strategic Framework for Managed Groundwater Development. New Delhi: Ministry of Water Resources.
Paper, C., and Georg-august-universit, I. H. (2016). WEAP-Modflow coupling as a DSS tool for the Corridor Well Field (North East of JORDAN) WEAP-Modflow coupling as a DSS tool for the Corridor Well Field (North East of JORDAN). Reston: USGS.
Ramireddygari, S. R., Sophocleous, M. A., Koelliker, J. K., Perkins, S. P., and Govindaraju, R. S. (2000). Development and application of a comprehensive simulation model to evaluate impacts of watershed structures and irrigation water use on streamflow and groundwater: the case of Wet Walnut Creek Watershed, Kansas, USA. J. Hydrol. 236, 223–246. doi: 10.1016/s0022-1694(00)00295-x
Rogers, P., and Smith, D. V. (1970). The integrated use of ground and surface water in irrigation project planning. Am. J. Agric. Econ. 52:13. doi: 10.2307/1238158
Sieber, J. (2015). Stockholm Environmental Inistitute (SEI) Water Evaluation And Planning (WEAP) System User Guide. Reston: USGS.
Šimůnek, J., and van Genuchten, M. T. (2008). Modeling Nonequilibrium Flow and Transport Processes Using HYDRUS. Vadose Zone J. 7, 782–797. doi: 10.2136/vzj2007.0074
TAHAL Consulting Engineers Ltd (2005). Preparation of detail designs and tender document preparation for the Addis Ababa Water Supply Project – Stage IIIA. Addis Ababa: AAWSA.
Taye, M. T., Dyer, E., Hirpa, F. A., and Charles, K. (2018). Climate change impact on water resources in the Awash basin, Ethiopia. Water 10:1560. doi: 10.3390/w10111560
Vedula, S., Mujumdar, P. P., and Chandra Sekhar, G. (2005). Conjunctive use modeling for multicrop irrigation. Agric. Water Manag. 73, 193–221. doi: 10.1016/j.agwat.2004.10.014
Venture, A. H. A. J. (1993). Review of Feasibility Study and Preliminary Design Report, Water Supply Project. Executive Summary. Addis Ababa: AAWSA.
Willis, R., Finney, B. A., and Zhang, D. (1989). Water resources management in North China plain. J. Water Resour. Plann. Manag. 115, 598–615. doi: 10.1061/(asce)0733-9496(1989)115:5(598)
Yeh, W. W. G. (1992). Systems analysis in ground-water planning and management. J. Water Resour. Plann. Manag. 118, 224–237. doi: 10.1061/(asce)0733-9496(1992)118:3(224)
Yitbarek, A., Razack, M., Ayenew, T., Zemedagegnehu, E., and Azagegn, T. (2012). Hydrogeological and hydrochemical framework of Upper Awash River basin, Ethiopia: with special emphasis on inter-basins groundwater transfer between Blue Nile and Awash Rivers. J. Afr. Earth Sci. 65, 46–60. doi: 10.1016/j.jafrearsci.2012.01.002
Keywords: water supply, conjunctive use, integrated use, water security, Awash River basin, WEAP, MODFLOW, Ethiopia
Citation: Birhanu B, Kebede S, Charles K, Taye M, Atlaw A and Birhane M (2021) Impact of Natural and Anthropogenic Stresses on Surface and Groundwater Supply Sources of the Upper Awash Sub-Basin, Central Ethiopia. Front. Earth Sci. 9:656726. doi: 10.3389/feart.2021.656726
Received: 21 January 2021; Accepted: 14 April 2021;
Published: 07 May 2021.
Edited by:
Frédéric Frappart, UMR 5566 Laboratoire d’études en géophysique et océanographie spatiales (LEGOS), FranceReviewed by:
Marc Leblanc, University of Avignon, FranceJulio Goncalves, Aix-Marseille Université, France
Copyright © 2021 Birhanu, Kebede, Charles, Taye, Atlaw and Birhane. This is an open-access article distributed under the terms of the Creative Commons Attribution License (CC BY). The use, distribution or reproduction in other forums is permitted, provided the original author(s) and the copyright owner(s) are credited and that the original publication in this journal is cited, in accordance with accepted academic practice. No use, distribution or reproduction is permitted which does not comply with these terms.
*Correspondence: Behailu Birhanu, YmVoYWlsdS5iZXJlaGFudUBhYXN0dS5lZHUuZXQ=