 Nikolitsa Alexandropoulou1*
 Monica Winsborrow1
 Karin Andreassen1
 Andreia Plaza-Faverola1
 Pierre-Antoine Dessandier1,2Rune Mattingsdal3Nicole Baeten4Jochen Knies1,4
- 1Centre for Arctic Gas Hydrate, Environment and Climate (CAGE), Department of Geosciences, UiT The Arctic University of Norway, Tromsø, Norway
- 2Laboratoire Environnement Profond, IFREMER—Centre de Bretagne, Plouzané, France
- 3Norwegian Petroleum Directorate, Harstad, Norway
- 4Geological Survey of Norway, Trondheim, Norway
Here we present a high-resolution, continuous seismostratigraphic framework that for the first time, connects the over 1,000 km long western Svalbard-Barents Sea margin and covers the last ∼2.7 million years (Ma). By exploiting recent improvements in chronology, we establish a set of reliable age fix-points from available boreholes along the margin. We then use a large 2-D seismic database to extend this consistent chronology from the Yermak Plateau and offshore western Svalbard, southwards to the Bear Island Trough-Mouth Fan. Based on this new stratigraphic framework we divide the seismic stratigraphy along the continental margin into three seismic units, and 12 regionally correlated seismic reflections, each with an estimated age assignment. We demonstrate one potential application of this framework by reconstructing the Svalbard-Barents Sea Ice Sheet evolution from the intensification of the northern hemisphere glaciation at ∼2.7 Ma to the Weichselian glaciations. Through seismic facies distribution and sedimentation rate fluctuations along the margin we distinguish three phases of glacial development. The higher temporal resolution provided by this new framework, allows us to document a clear two-step onset to glacial intensification in the region during phase 1, between ∼2.7 and 1.5 Ma. The initial step, between ∼2.7 and 2.58 Ma shows glacial expansion across Svalbard. The first indication of shelf-edge glaciation is on the Sjubrebanken Trough-Mouth Fan, northwestern Barents Sea after ∼2.58 Ma; whilst the second step, between ∼1.95 and 1.78 Ma shows glacial advances beyond Svalbard to the northwestern Barents Sea. Phase 2 is characterized by variations in sedimentation rates and the seismic facies are indicative for a regional glacial intensification for the whole Barents Sea-Svalbard region with widespread shelf-edge glaciations recorded at around ∼1.5 Ma. During Phase 3, the western Barents Sea margin is characterized by a dramatic increase in sedimentation rates, inferring once again a regional glacial intensification. Our new stratigraphic framework allows for the first time differentiation of the sediments deposited on the slope during Early Saalian (∼0.4 and 0.2 Ma), Late Saalian (∼0.2 and 0.13 Ma), and Weichselian (<∼0.123 Ma) periods, providing new insights into the Barents Sea glaciations over the last ∼0.42 Ma.
Introduction
The western Svalbard-Barents Sea continental margin (Figure 1) is over 1,000 km long and is characterized by thick glacigenic sediments that have been deposited over the last ∼2.7 Ma. These represent a valuable archive of Late Cenozoic environmental change, in particular, the waxing and waning of ice sheets across the adjacent continental shelf. However, the use of this archive to study and compare the sedimentological and glaciological evolution along the entire margin, and place this in a wider regional perspective, has been limited due to the lack of a unifying chronostratigraphic framework.
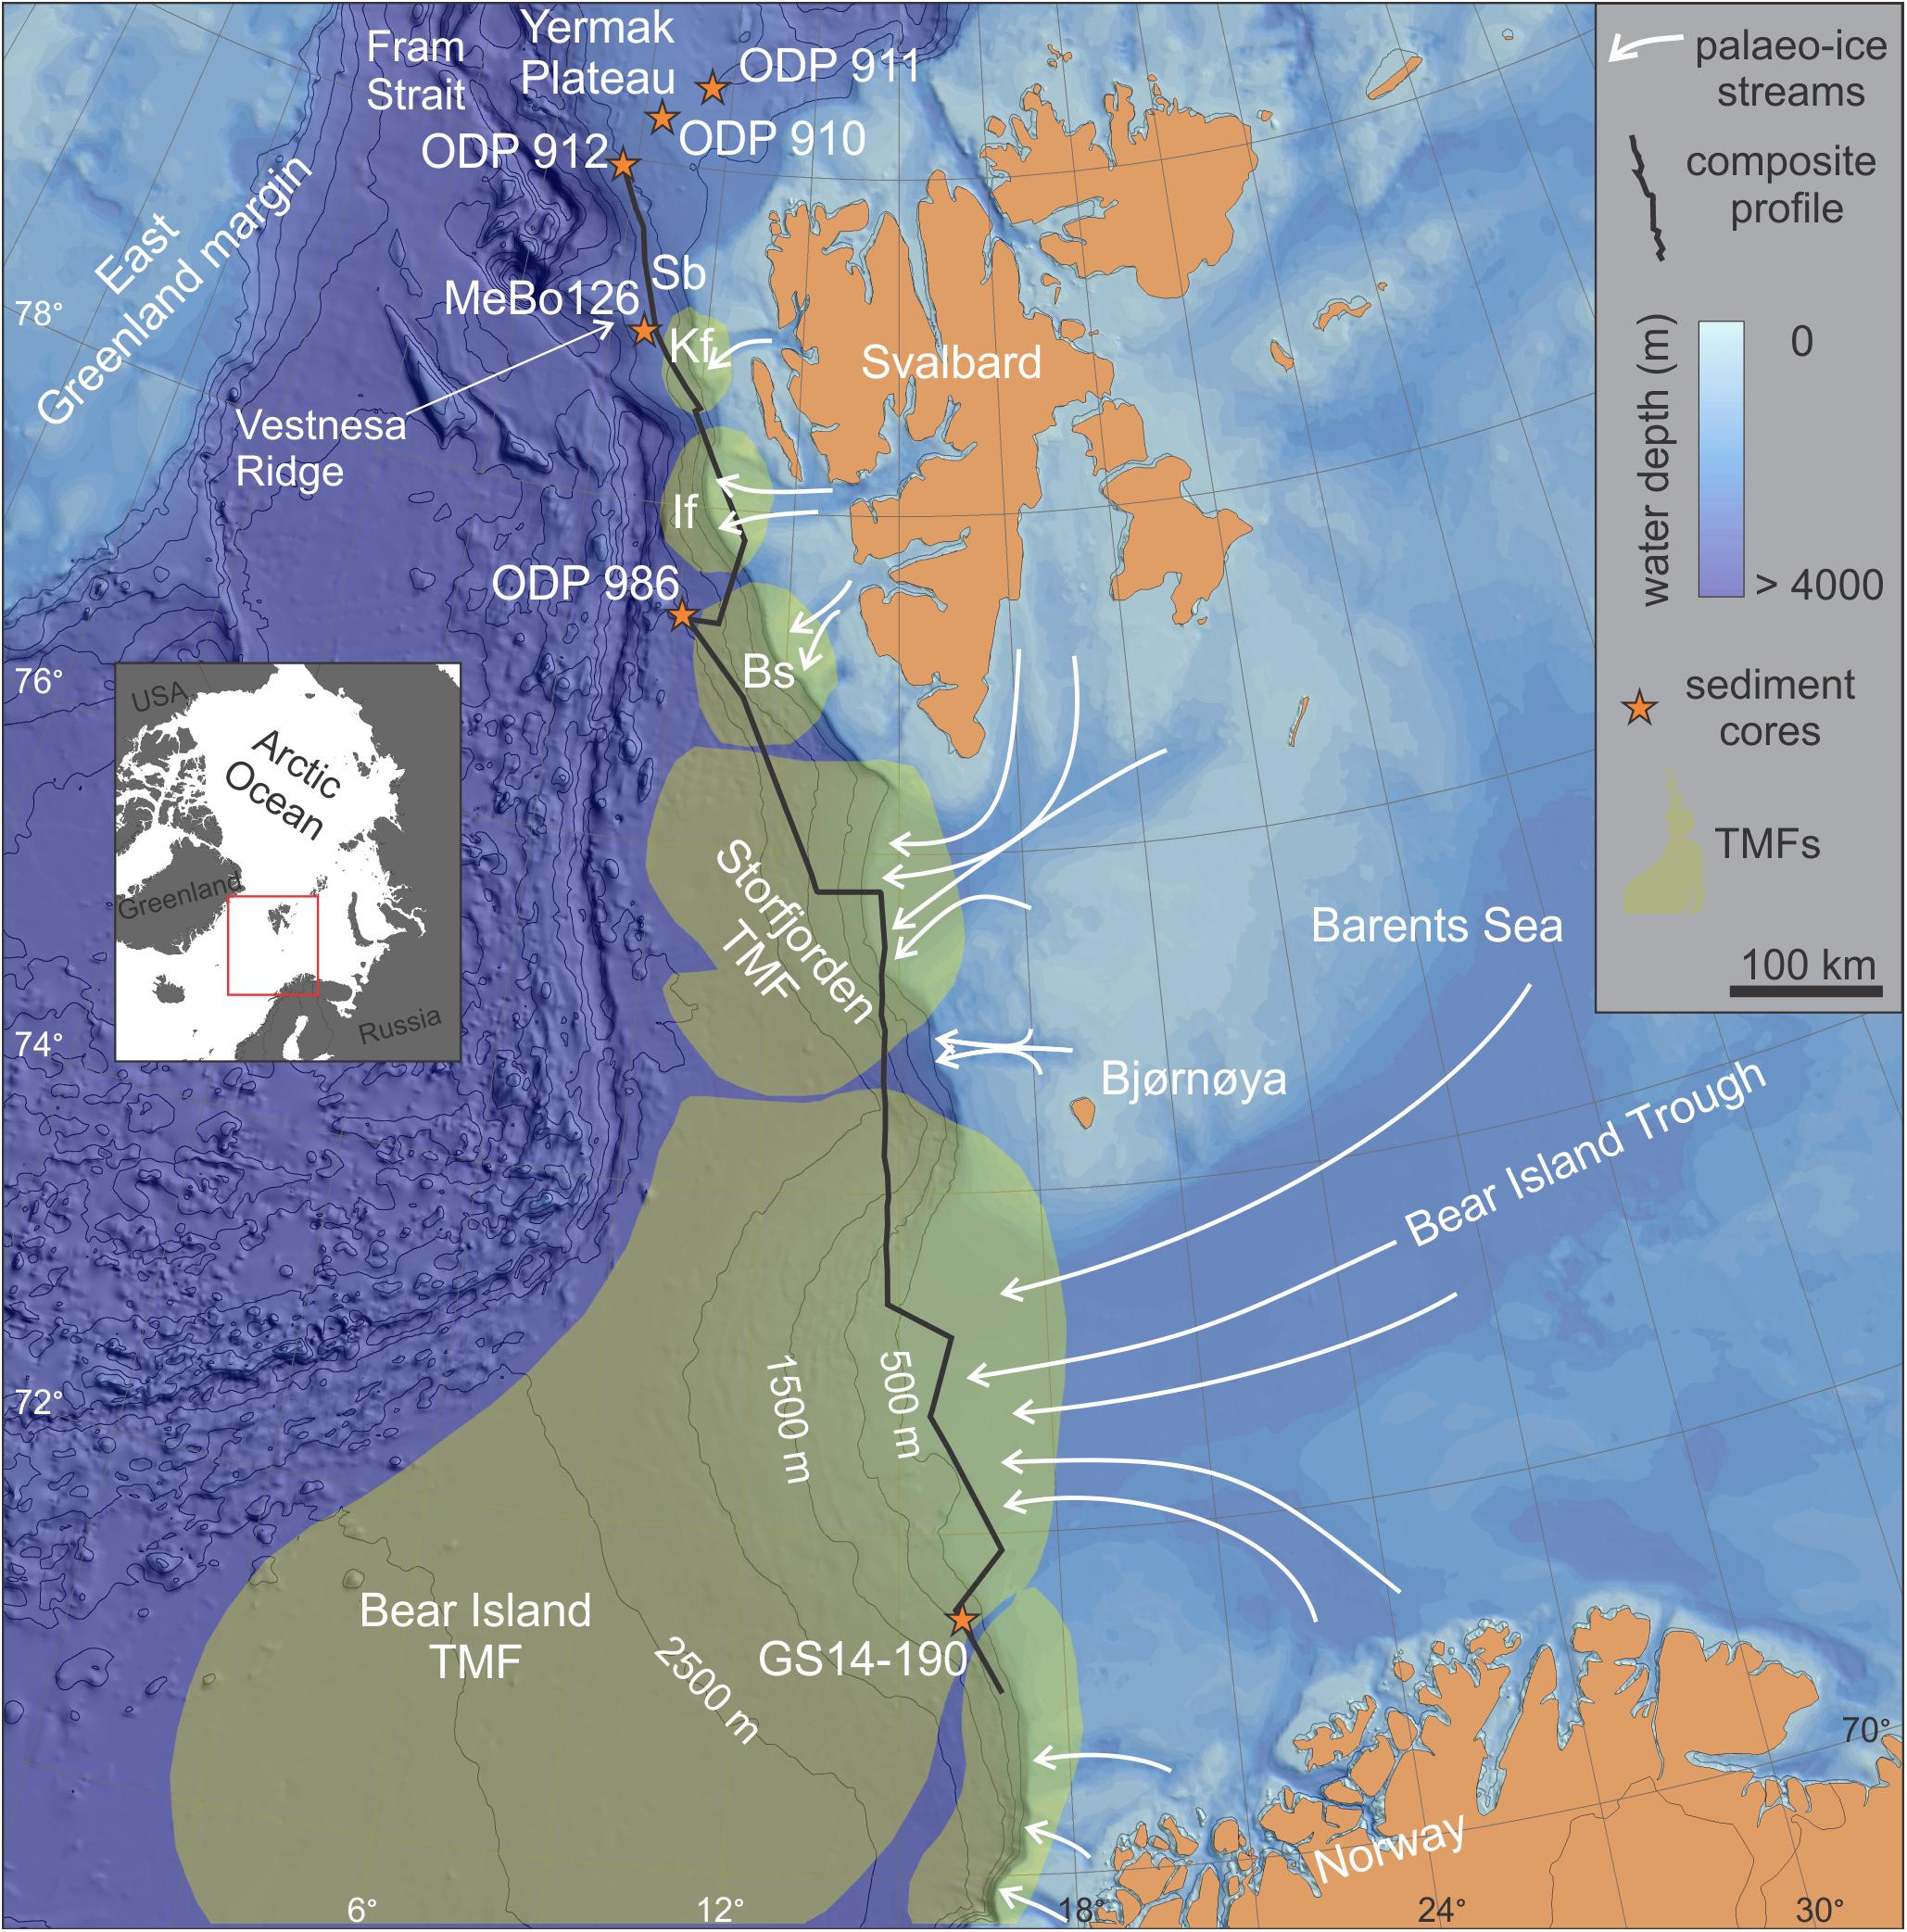
Figure 1. Basemap shows the composite profile along the western Svalbard-Barents Sea margin. Sb: Sjubrebanken TMF; Kf: Kongsfjorden TMF; If: Isfjorden TMF; Bs: Bellsund TMF. Background bathymetry from International Bathymetric Chart of the Arctic Ocean (IBCAO, version 3.0) (Jakobsson et al., 2012). TMFs: trough-mouth fans (Vorren and Laberg, 1997; Dahlgren et al., 2005).
In the past, there have been several attempts to establish chronostratigraphic frameworks for both the western (Vorren et al., 1991; Faleide et al., 1996; Fiedler and Faleide, 1996; Hjelstuen et al., 1996; Laberg and Vorren, 1996a, b; Ryseth et al., 2003; Rebesco et al., 2014) and northern (e.g., Geissler and Jokat, 2004). Barents Sea and Svalbard margins. These attempts have been hampered by inconsistent chronologies between the sparse boreholes along the margin and limited seismic surveys necessary to by-pass problematic areas and correlate between the available boreholes. This lack of a continuous chronostratigraphic framework has also hindered attempts to provide a coherent reconstruction of paleoenvironmental variations along the entire western Svalbard-Barents Sea margin based on paleontological studies from the ODP sites on Yermak Plateau (ODP Site 910, 911, 912) and offshore west Svalbard (ODP 986). The interpretation of these proxies form the basis for the individual stratigraphic frameworks for each site (e.g., Cronin and Whatley, 1996; Hull et al., 1996; Matthiessen and Brenner, 1996; Spiegler, 1996; Eidvin and Nagy, 1999; Smelror, 1999; Grøsfjeld et al., 2014).
New age assignments for the Ocean Drilling Program (ODP) Sites 910, 911, 912 on Yermak Plateau (e.g., Knies et al., 2009; Mattingsdal et al., 2014) and ODP Site 986 west of Svalbard (e.g., Channell et al., 1999; Knies et al., 2009; Figure 1) now provide a robust, consistent chronology for the north and western Svalbard margin. Additionally, a new seafloor drill rig MeBo (Meeresboden-Bohrgerät) site (MeBo Site 126) on Vestnesa Ridge (Dessandier et al., 2021), and a piston core site (GS14-190-01PC; hereafter referred to as GS14-190) on the Bear Island (Bjørnøya) Trough-Mouth Fan (TMF) (Supplementary Figure 1 and Figure 1), have yielded dates for the youngest (< ∼0.42 Ma) part of the sequence based on stable isotope data. These now offer the possibility to identify a consistent chronology along the entire margin and the potential to correlate between age fix-points, given a suitable seismic dataset.
In this paper, we exploit these recent improvements in chronology to establish a set of reliable age fix-points from available boreholes along the margin and then use a large dataset compiled of both conventional and high-resolution (e.g., Andreassen, 2017) 2D seismic data to extend this consistent chronology from the Yermak Plateau and offshore western Svalbard, southwards to the Bear Island TMF. This provides a continuous seismostratigraphic framework that extends along the entire 1,000 km long western Svalbard-Barents Sea margin (Figures 2, 3) and includes seismic reflections corresponding to the widely used R7-R1 seismic stratigraphy proposed by Faleide et al. (1996) and additional seismic reflections tied to the new age fix-points. This yields 12 regionally correlated seismic reflections (including R7-R1), each with an estimated age assignment (Figures 4, 5). Finally, we demonstrate one potential application of this new stratigraphic framework by reconstructing the Late Cenozoic glacial history of the Svalbard-Barents Sea Ice Sheet (SBIS), based on seismic facies distribution (Figures 6, 7) and sedimentation rate trends along the margin (Figure 8).
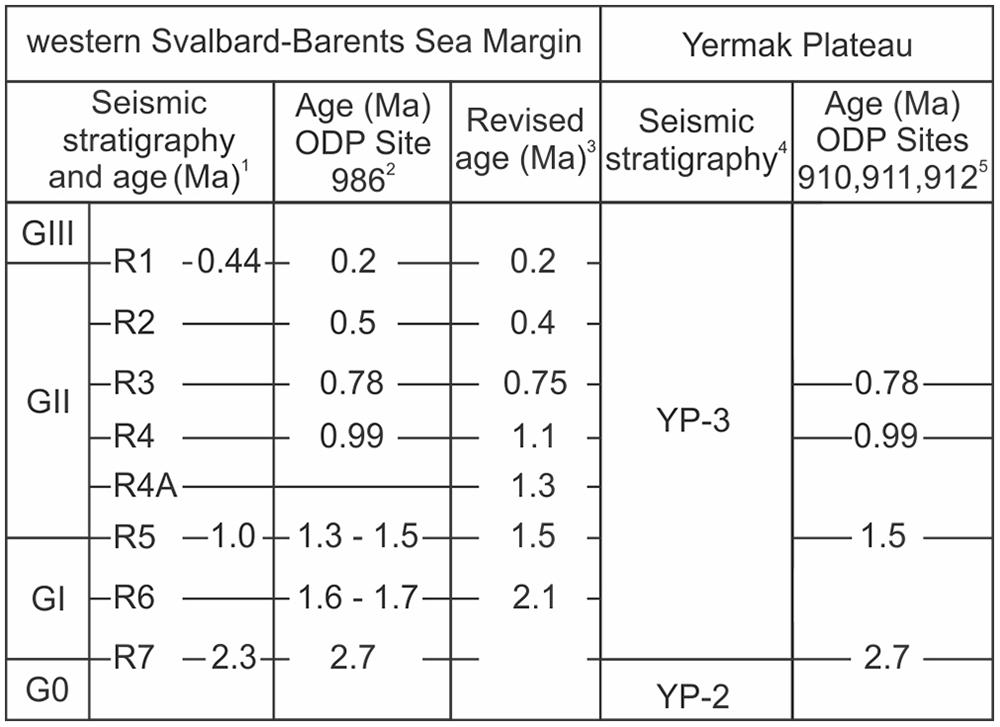
Figure 2. Previous correlation between the seismic stratigraphy of the western Barents Sea-Svalbard margin and Yermak Plateau together with the published age estimates for the seismic reflections. G0: preglacial strata. 1Faleide et al. (1996); 2Jansen et al. (1996); Channell et al. (1999); Eidvin and Nagy (1999); Forsberg et al. (1999); Butt et al. (2000); Knies et al. (2009); 3Rebesco et al. (2014); 4Geissler and Jokat (2004); 5Myhre et al. (1995); Knies et al. (2009); Mattingsdal et al. (2014).
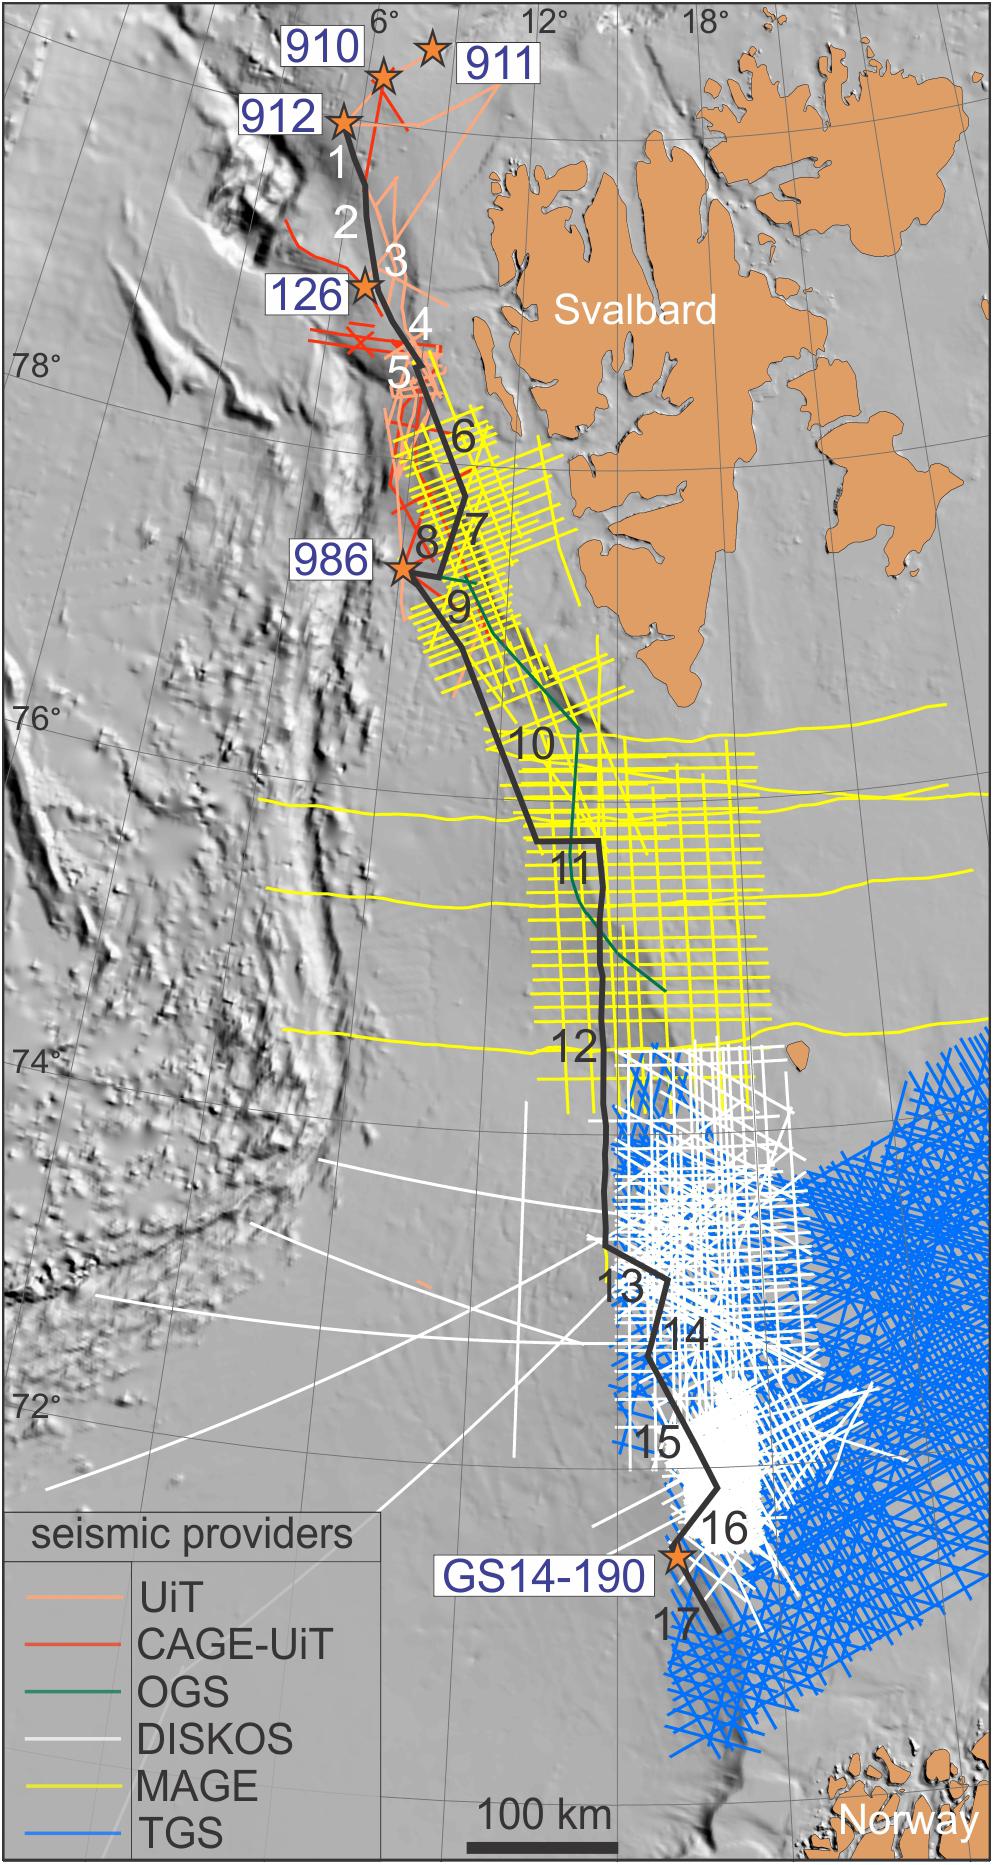
Figure 3. 2D seismic dataset and composite seismic profile used to derive the new seismic stratigraphic framework. Basemap presenting the 2D seismic datasets and the composite seismic profile. Orange stars: location of the core sites. ODP Sites: 910, 911, 912, 986. Piston core: GS14-190. CAGE-Centre for Arctic Gas Hydrate, Environment and Climate-UiT The Arctic University of Norway in Tromsø. EGLACOM provided by the National Institute of Oceanography and Applied Geophysics (OGS), Trieste, Italy. Diskos: Norwegian Diskos National Data Repository (NDR) database. MAGE: Russian Joint Stock Company ‘Marine Arctic Geological Expedition’. TGS: TGS-NOPEC Geophysical Company Pty Ltd.
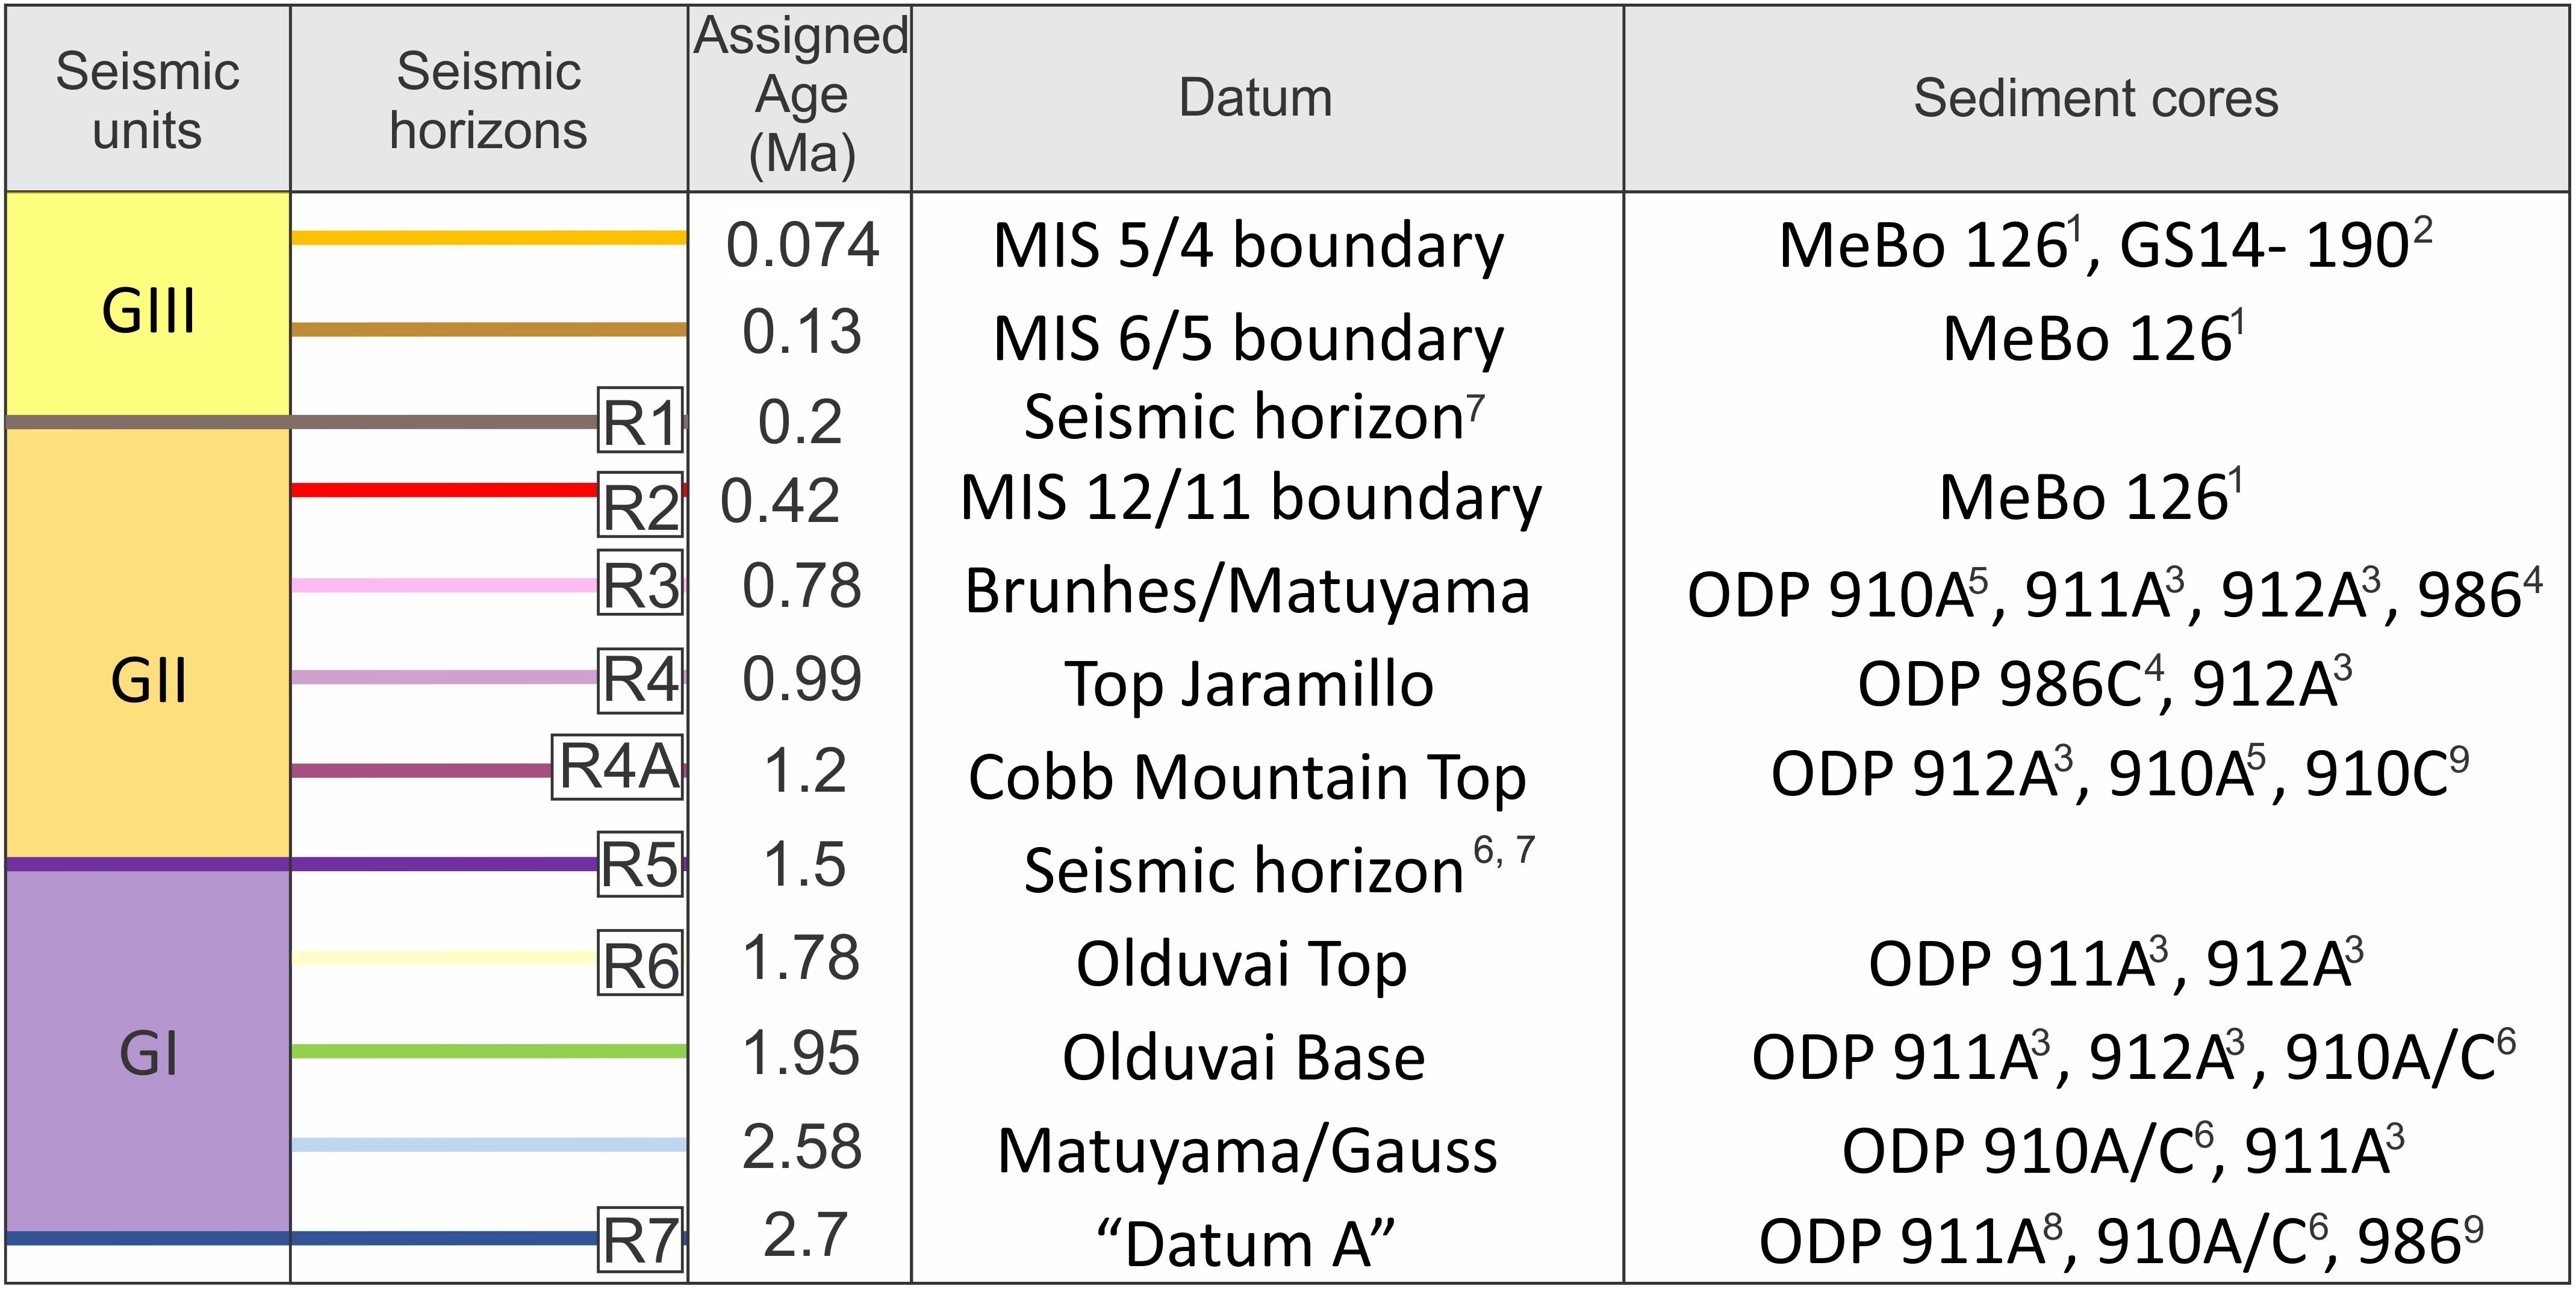
Figure 4. Age-fix points on which seismostratigraphic framework is based. Seismic units and seismic reflections along the western Svalbard-Barents Sea margin correlated with the seismic stratigraphy, R7-R1 (Faleide et al., 1996; Jansen et al., 1996), age fix-points and their datums, used to constrain the seismic stratigraphy from the available core sites along the margin. 1Dessandier et al., 2021 2This study 3Myhre et al. (1995) 4Channell et al. (1999) 5Knies et al. (2007) 6Mattingsdal et al. (2014); 7Faleide et al. (1996); Fiedler and Faleide (1996) 8Sato and Kameo (1996) 9Smelror (1999); Knies et al. (2009).
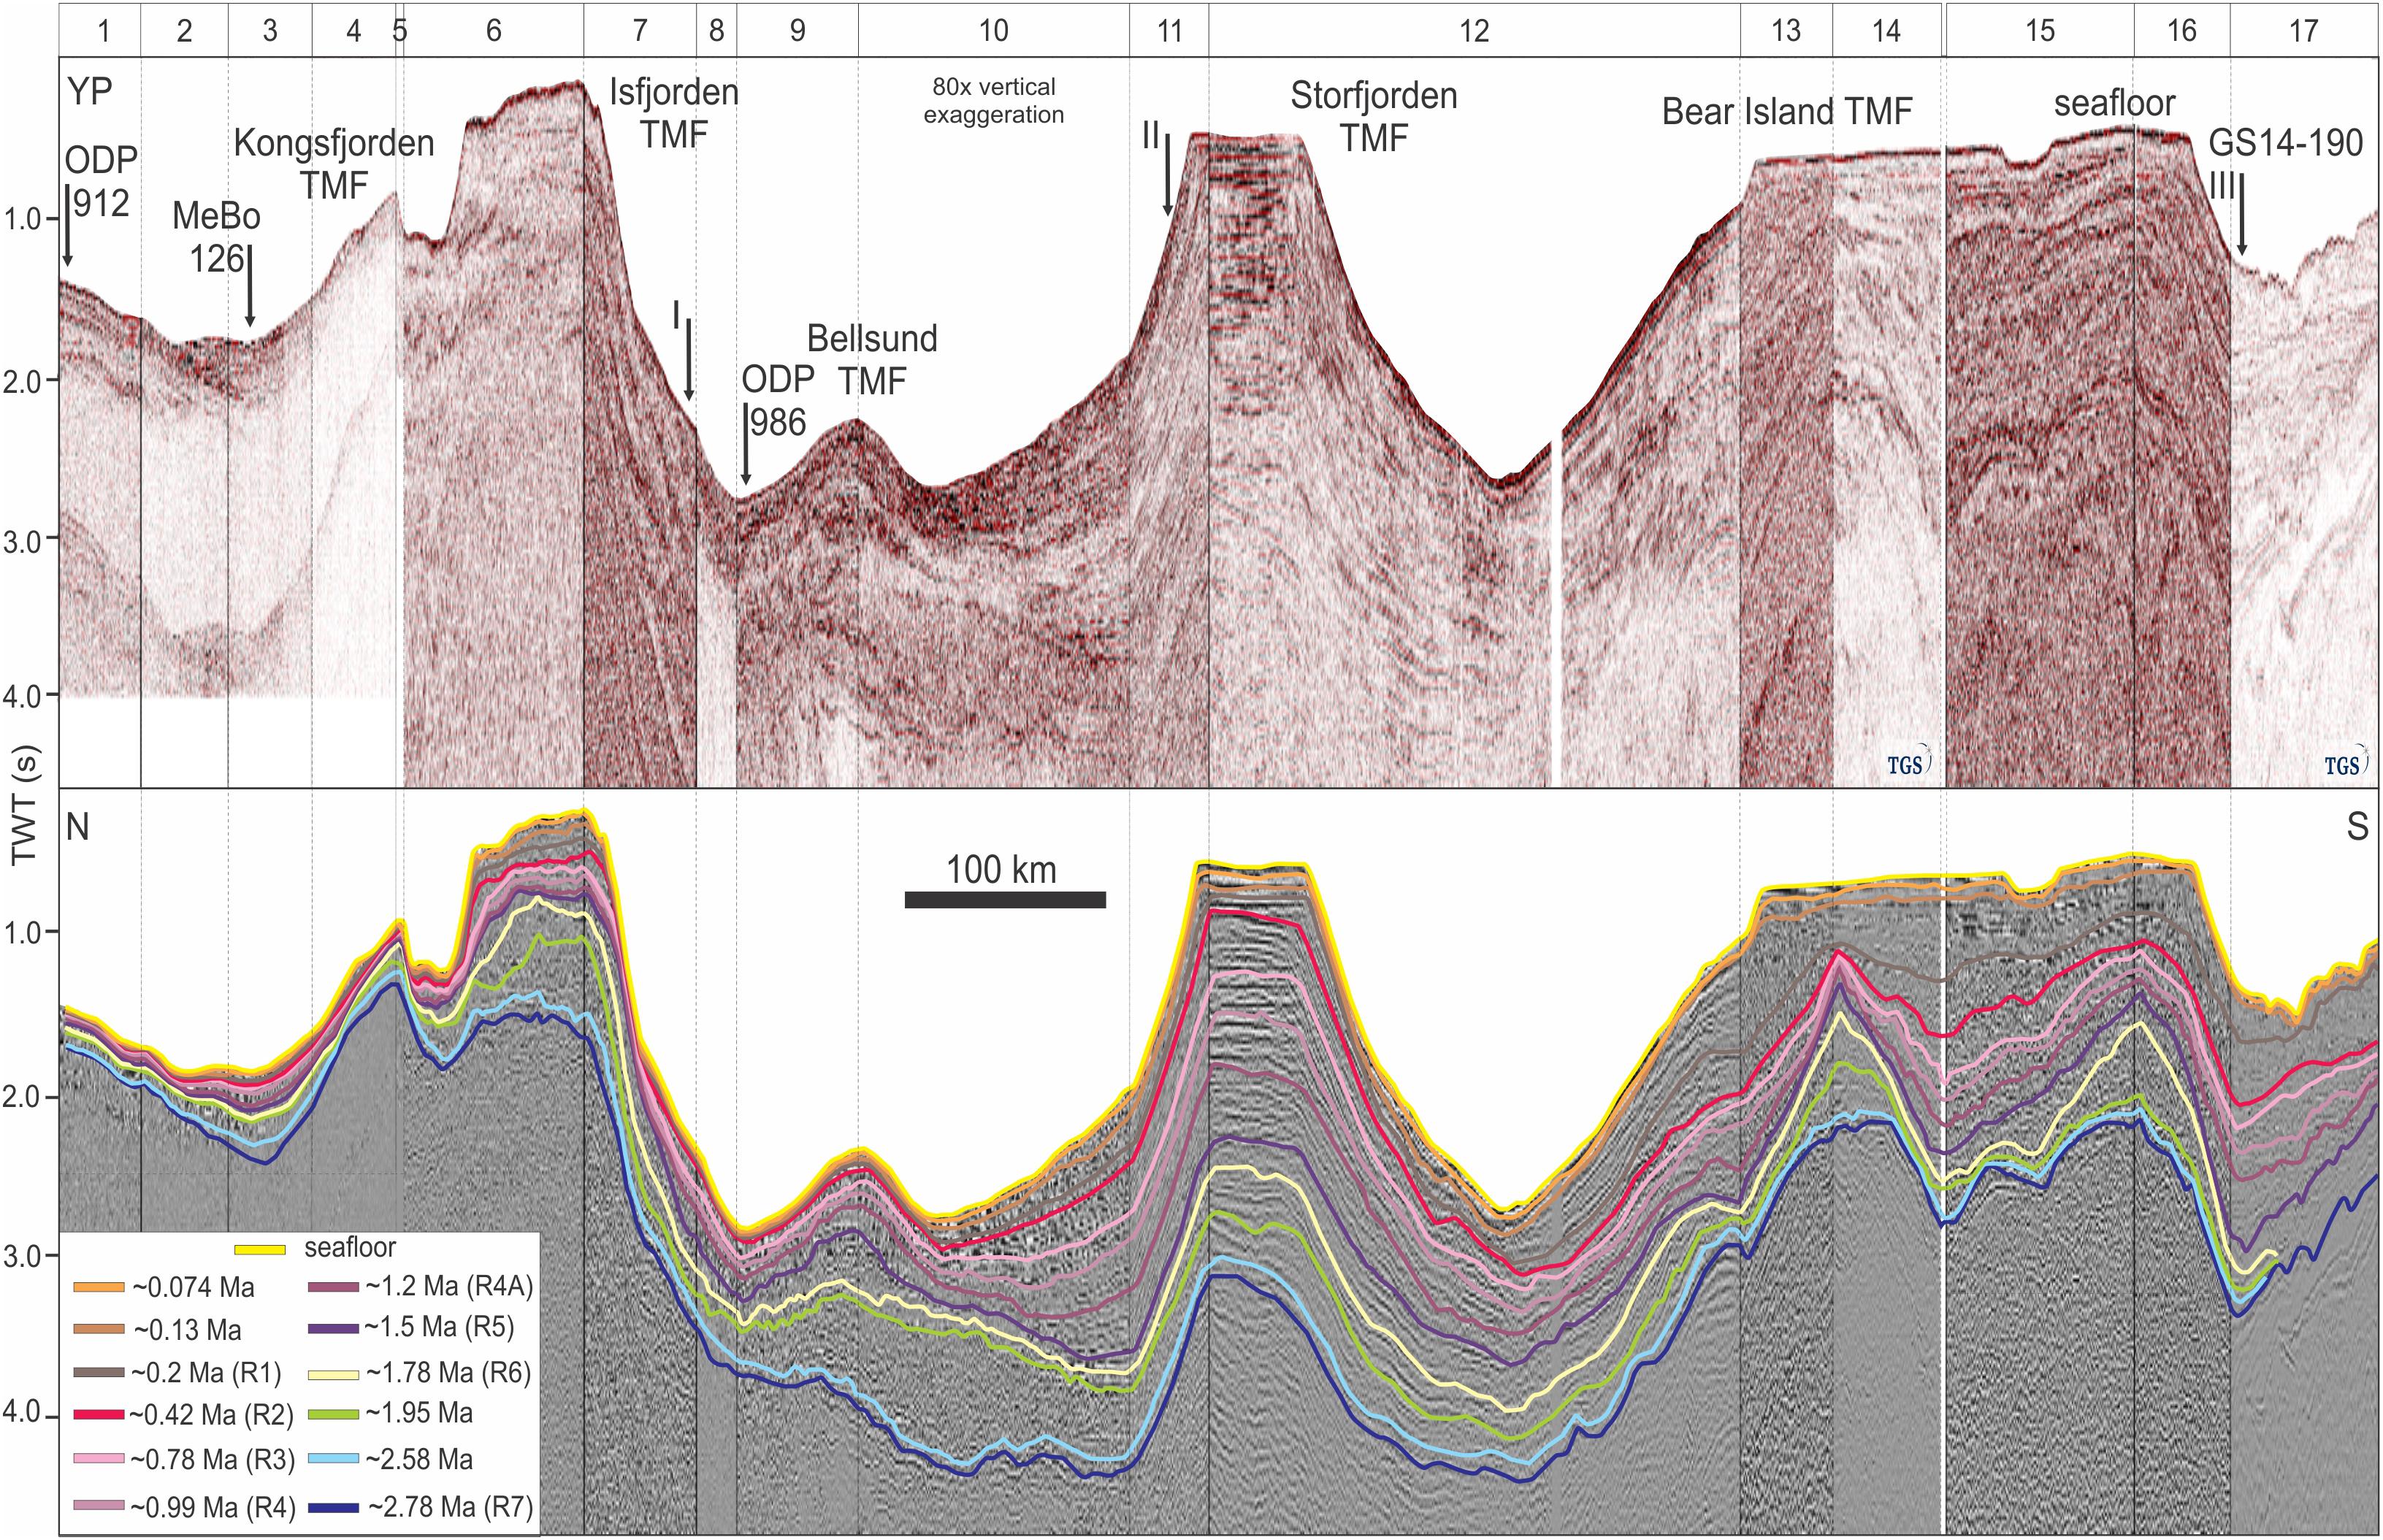
Figure 5. Composite profile along the western Svalbard-Barents Sea margin showing the new seismic stratigraphy (see Figures 1, 3 for location). R1-R7: seismic reflections corresponding to this study seismic stratigraphy. I–III: selected points along the composite profile for estimating the sedimentation rates. 1–17: seismic lines that comprise the composite profile (the names of the seismic lines are displayed in Supplementary Table 1). Sections 14 and 17 courtesy TGS.
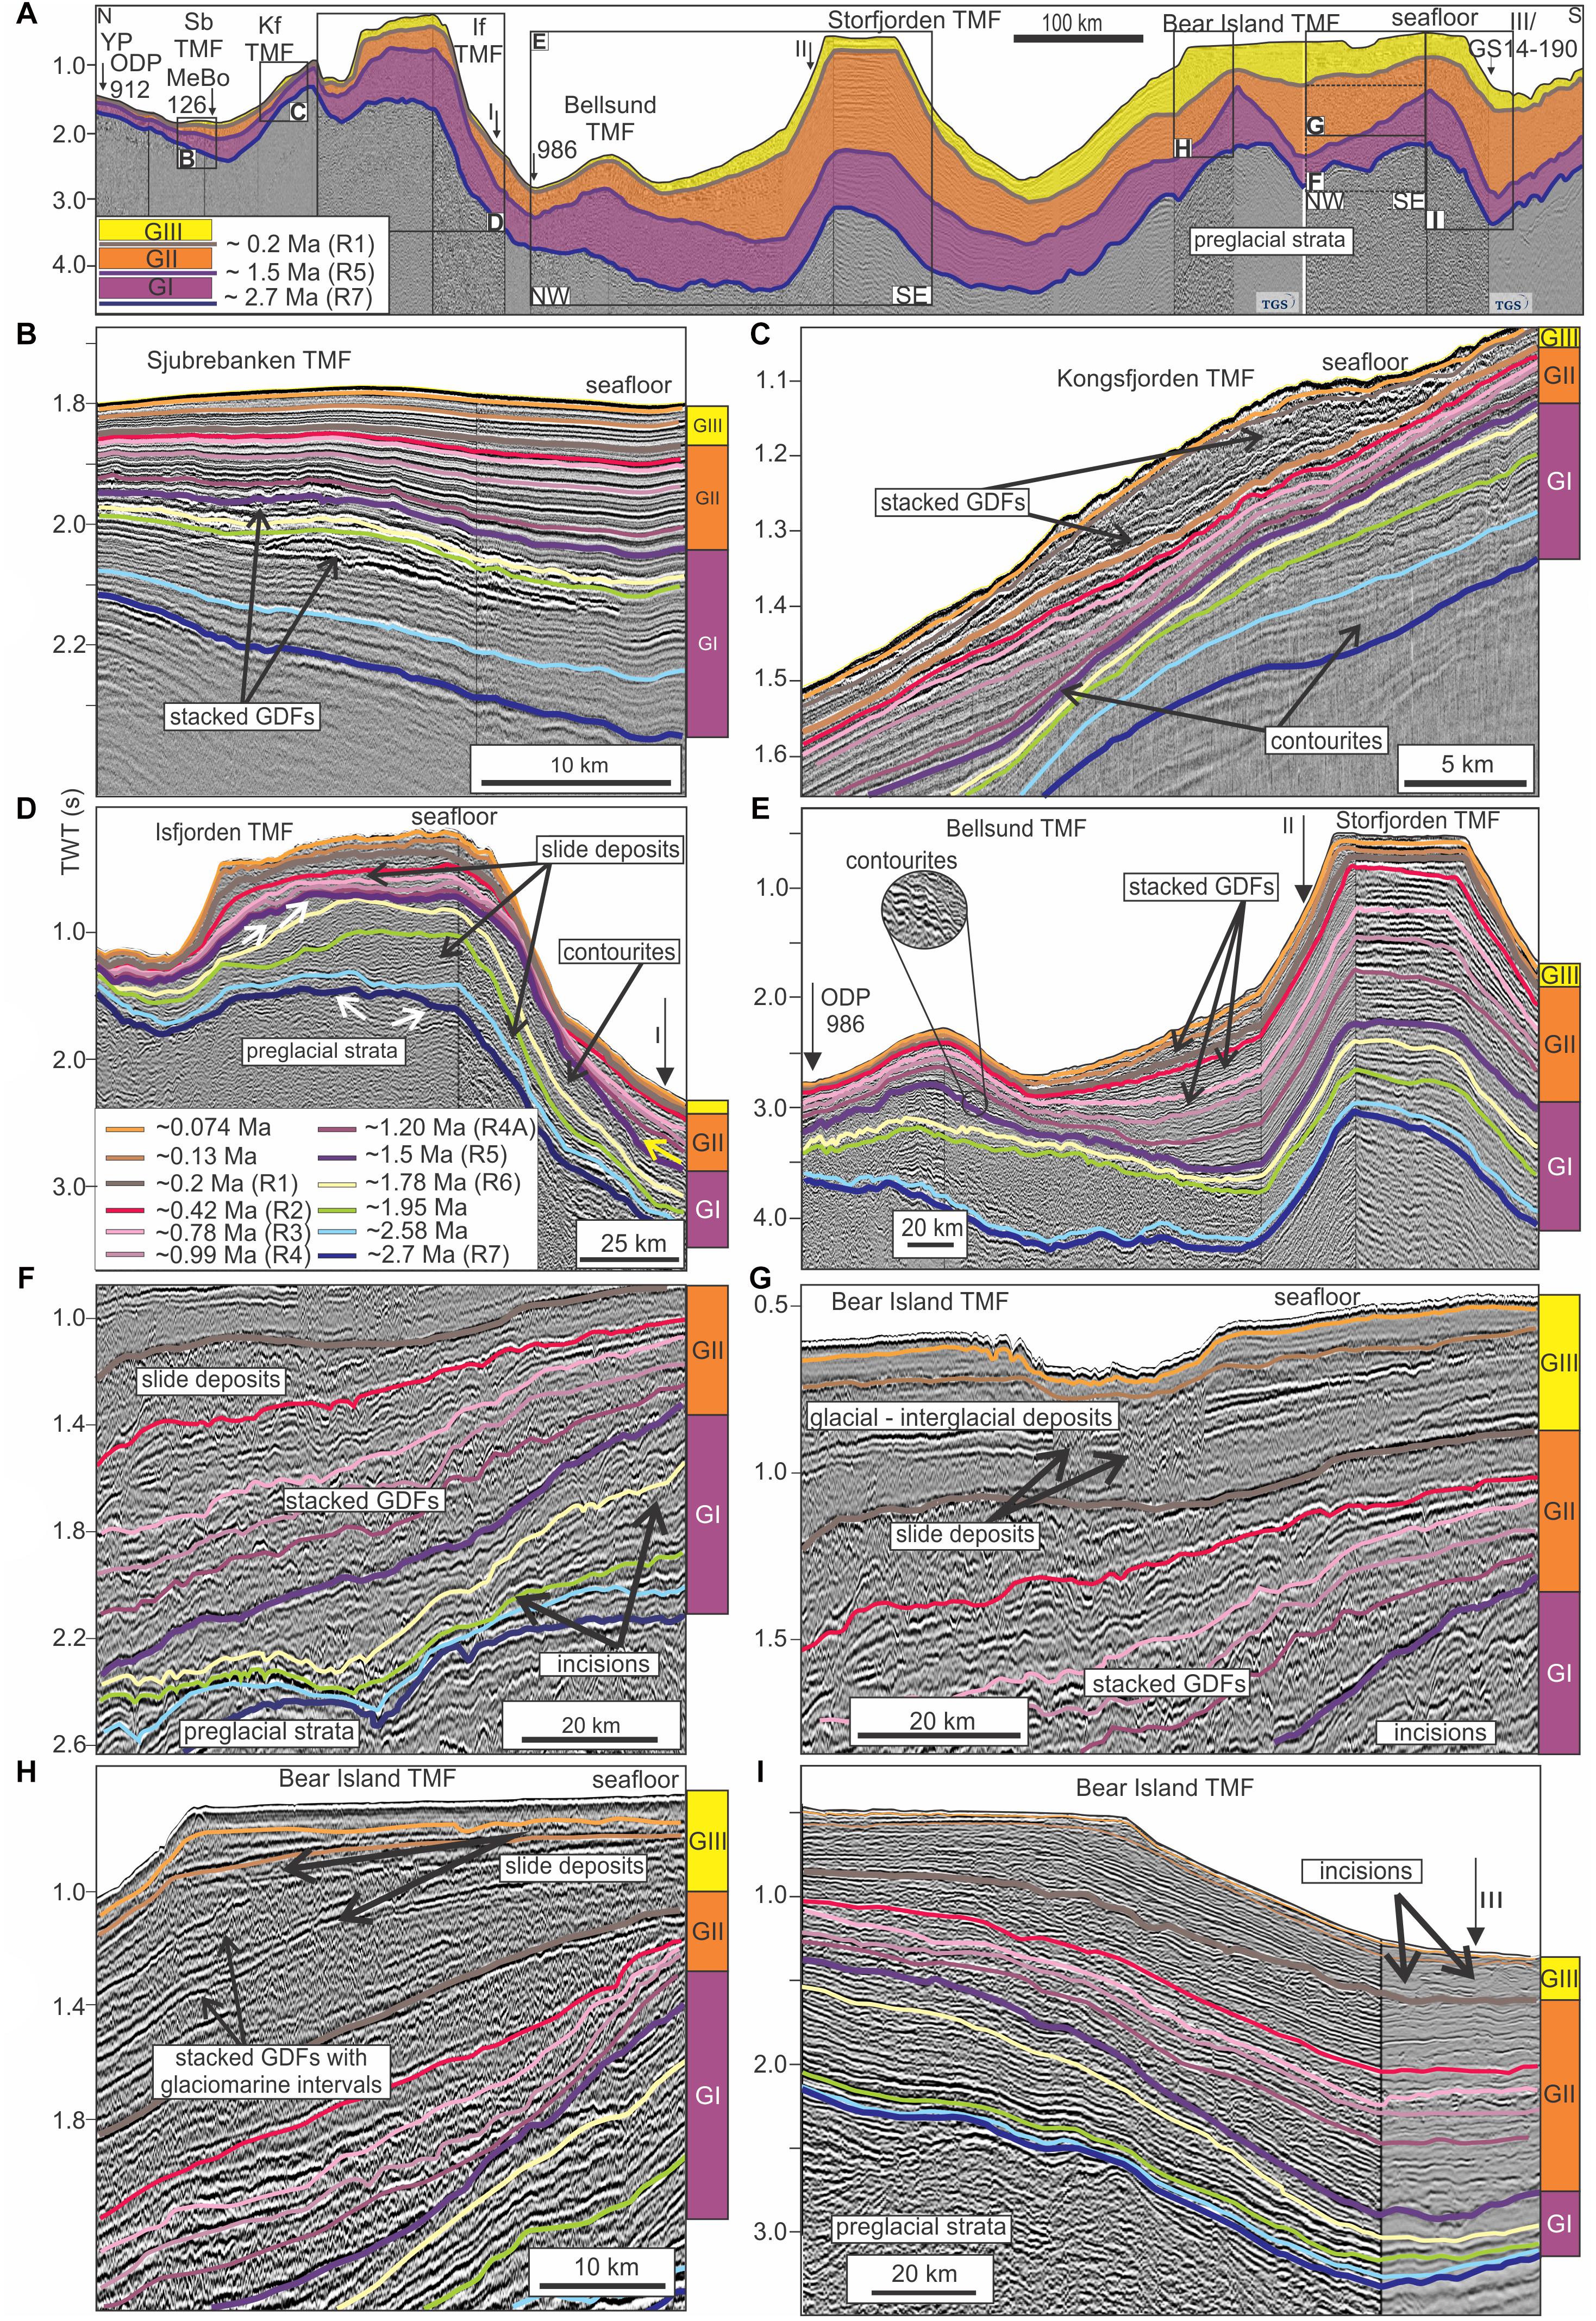
Figure 6. Variations in seismic facies and sediment thickness along the margin. (A) Seismic stratigraphy of the western Svalbard-Barents Sea margin divided into three main seismic units GI-GIII and 12 regionally correlatable seismic reflections. (B–I) Characteristic seismic facies along the margin are presented in selected closed-up views. (B) Sjubrebanken TMF (Sb). (C) Kongsfjorden TMF (Kf). (D) Isfjorden TMF (If). White arrows: truncated reflections; yellow arrows: onlapping reflections. (E) Bellsund and Storfjorden TMF. (F–I) Bear Island TMF, southwestern Barents Sea margin. GDFs: glacigenic debris flow deposits. I–III: selected points along the composite profile for estimating the sedimentation rates. Part of the seismic data including in (A,I) courtesy TGS. R1-R7: seismic reflections corresponding to this study seismic stratigraphy.
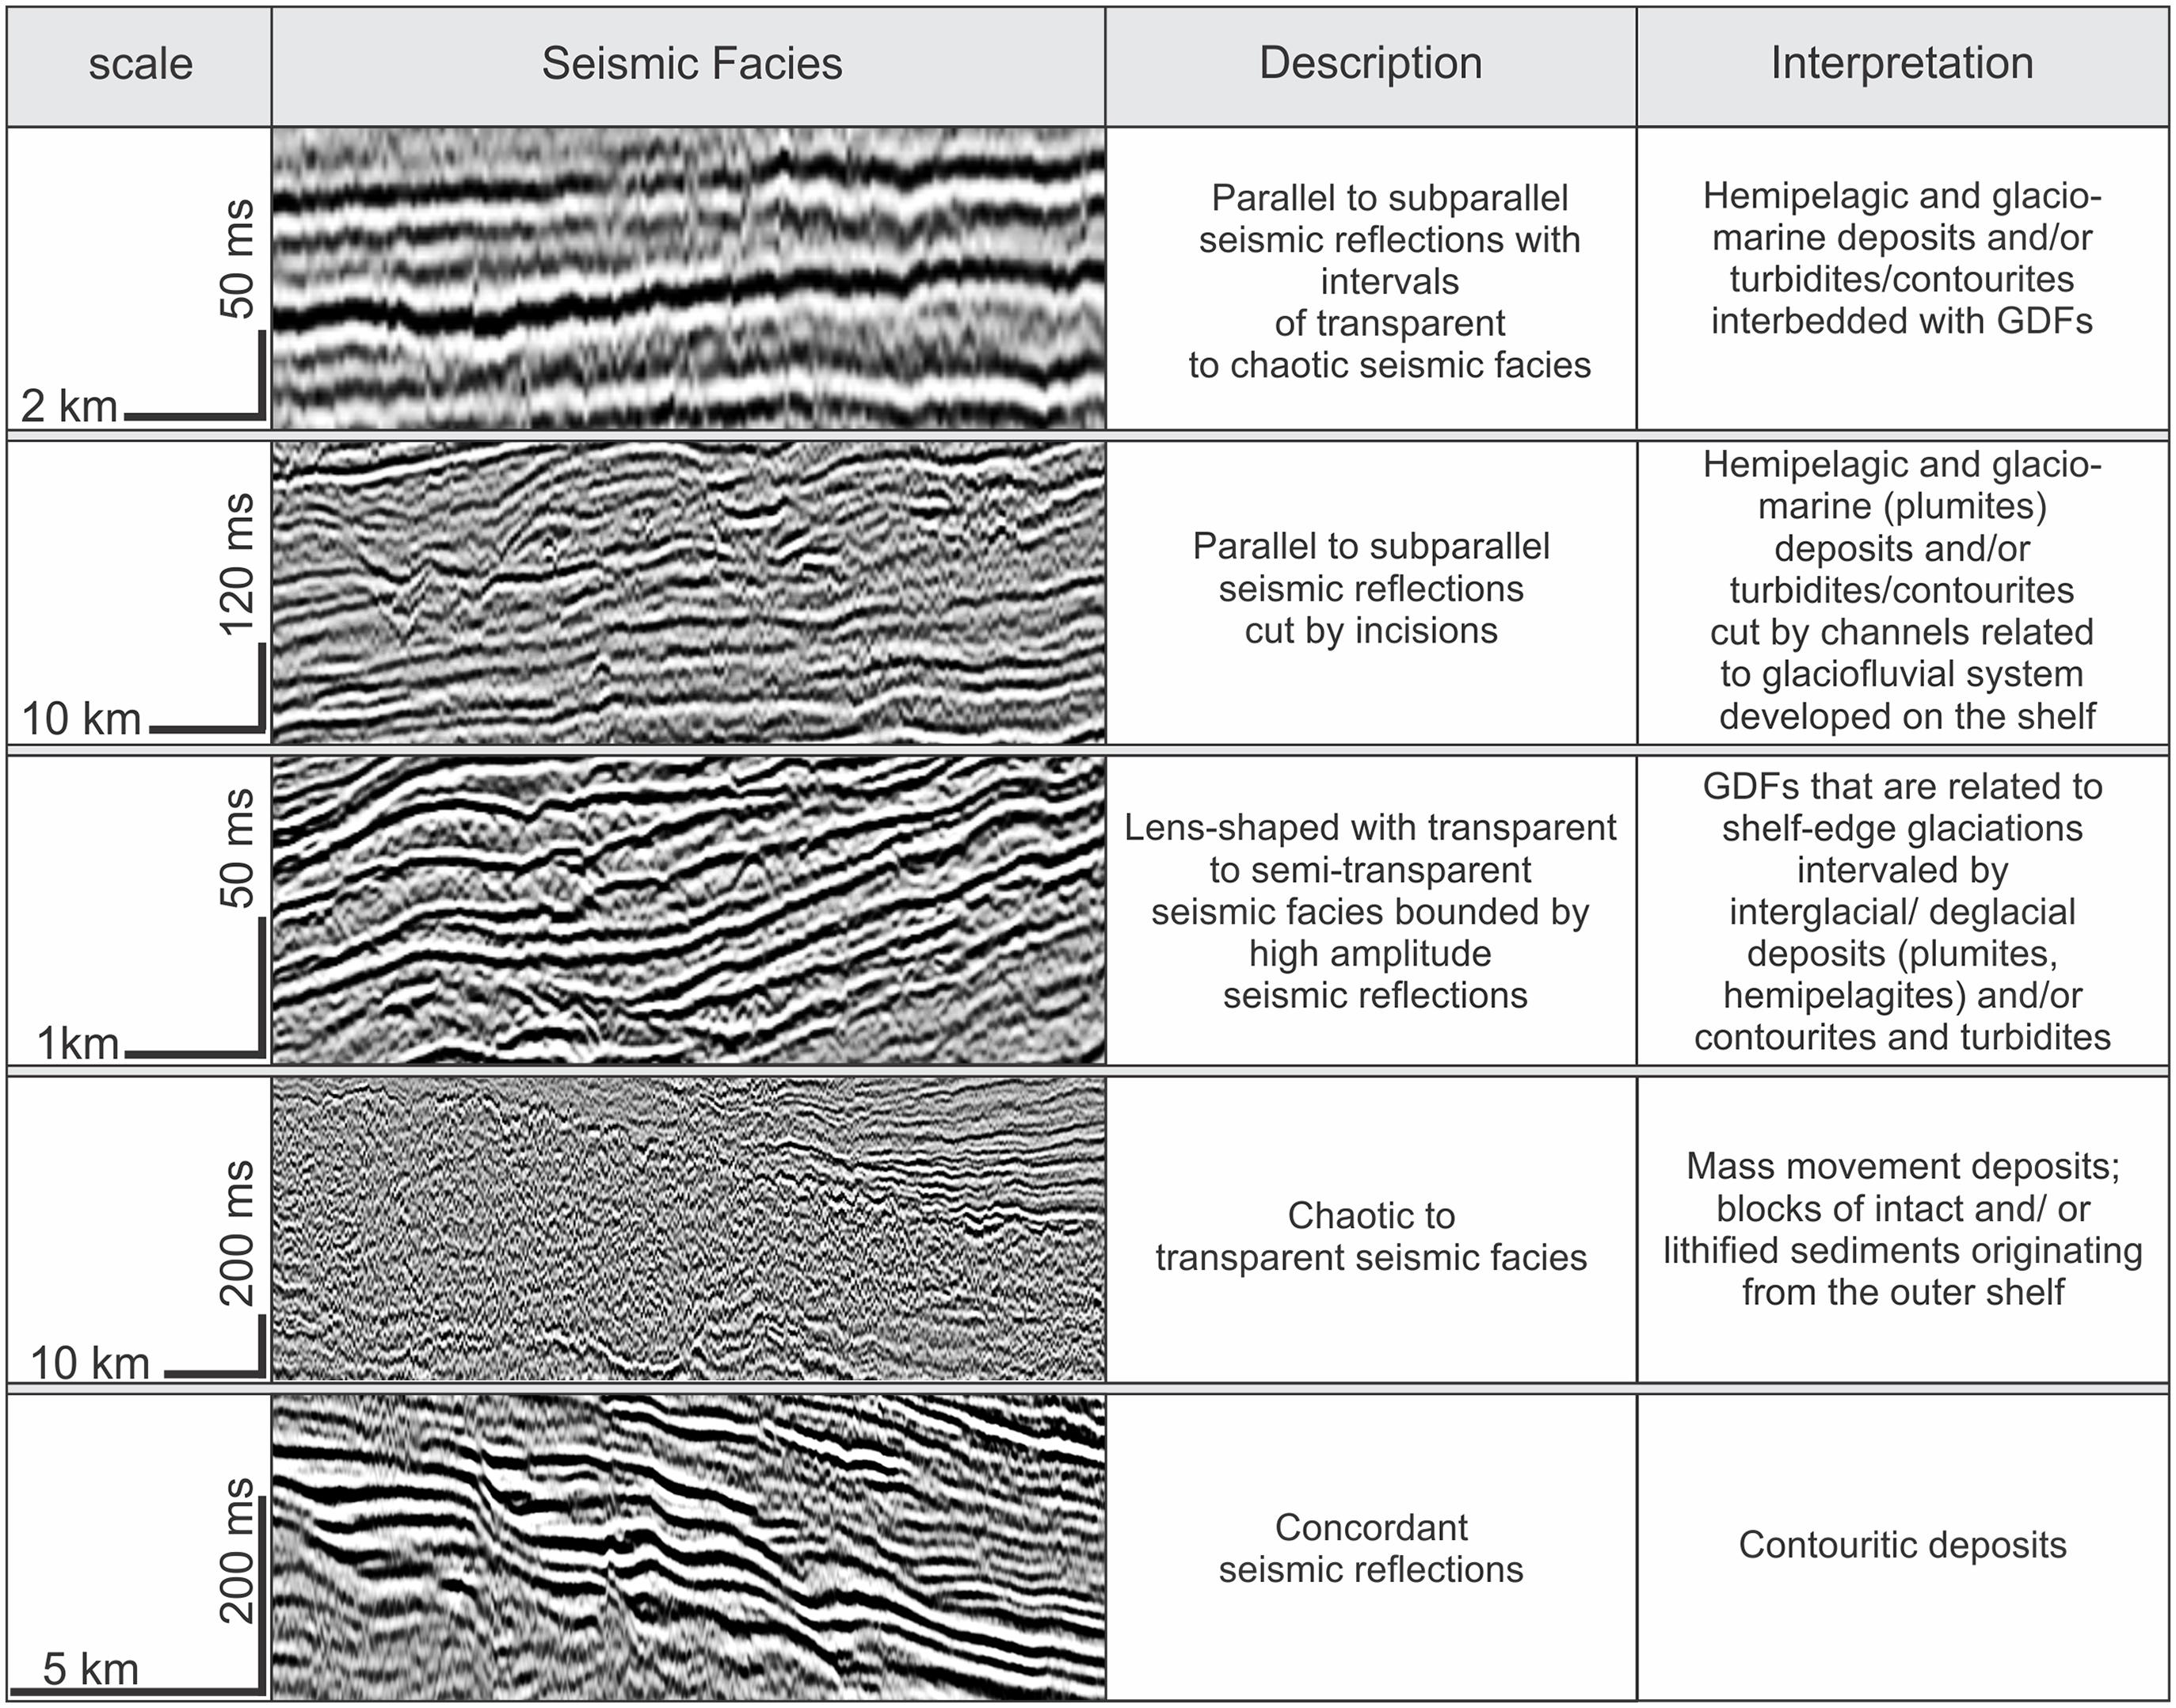
Figure 7. Characteristic seismic facies that are observed along the western Svalbard-Barents Sea margin over the last ∼2.7 Ma together with their interpretation. GDFs: glacigenic debris flow deposits.
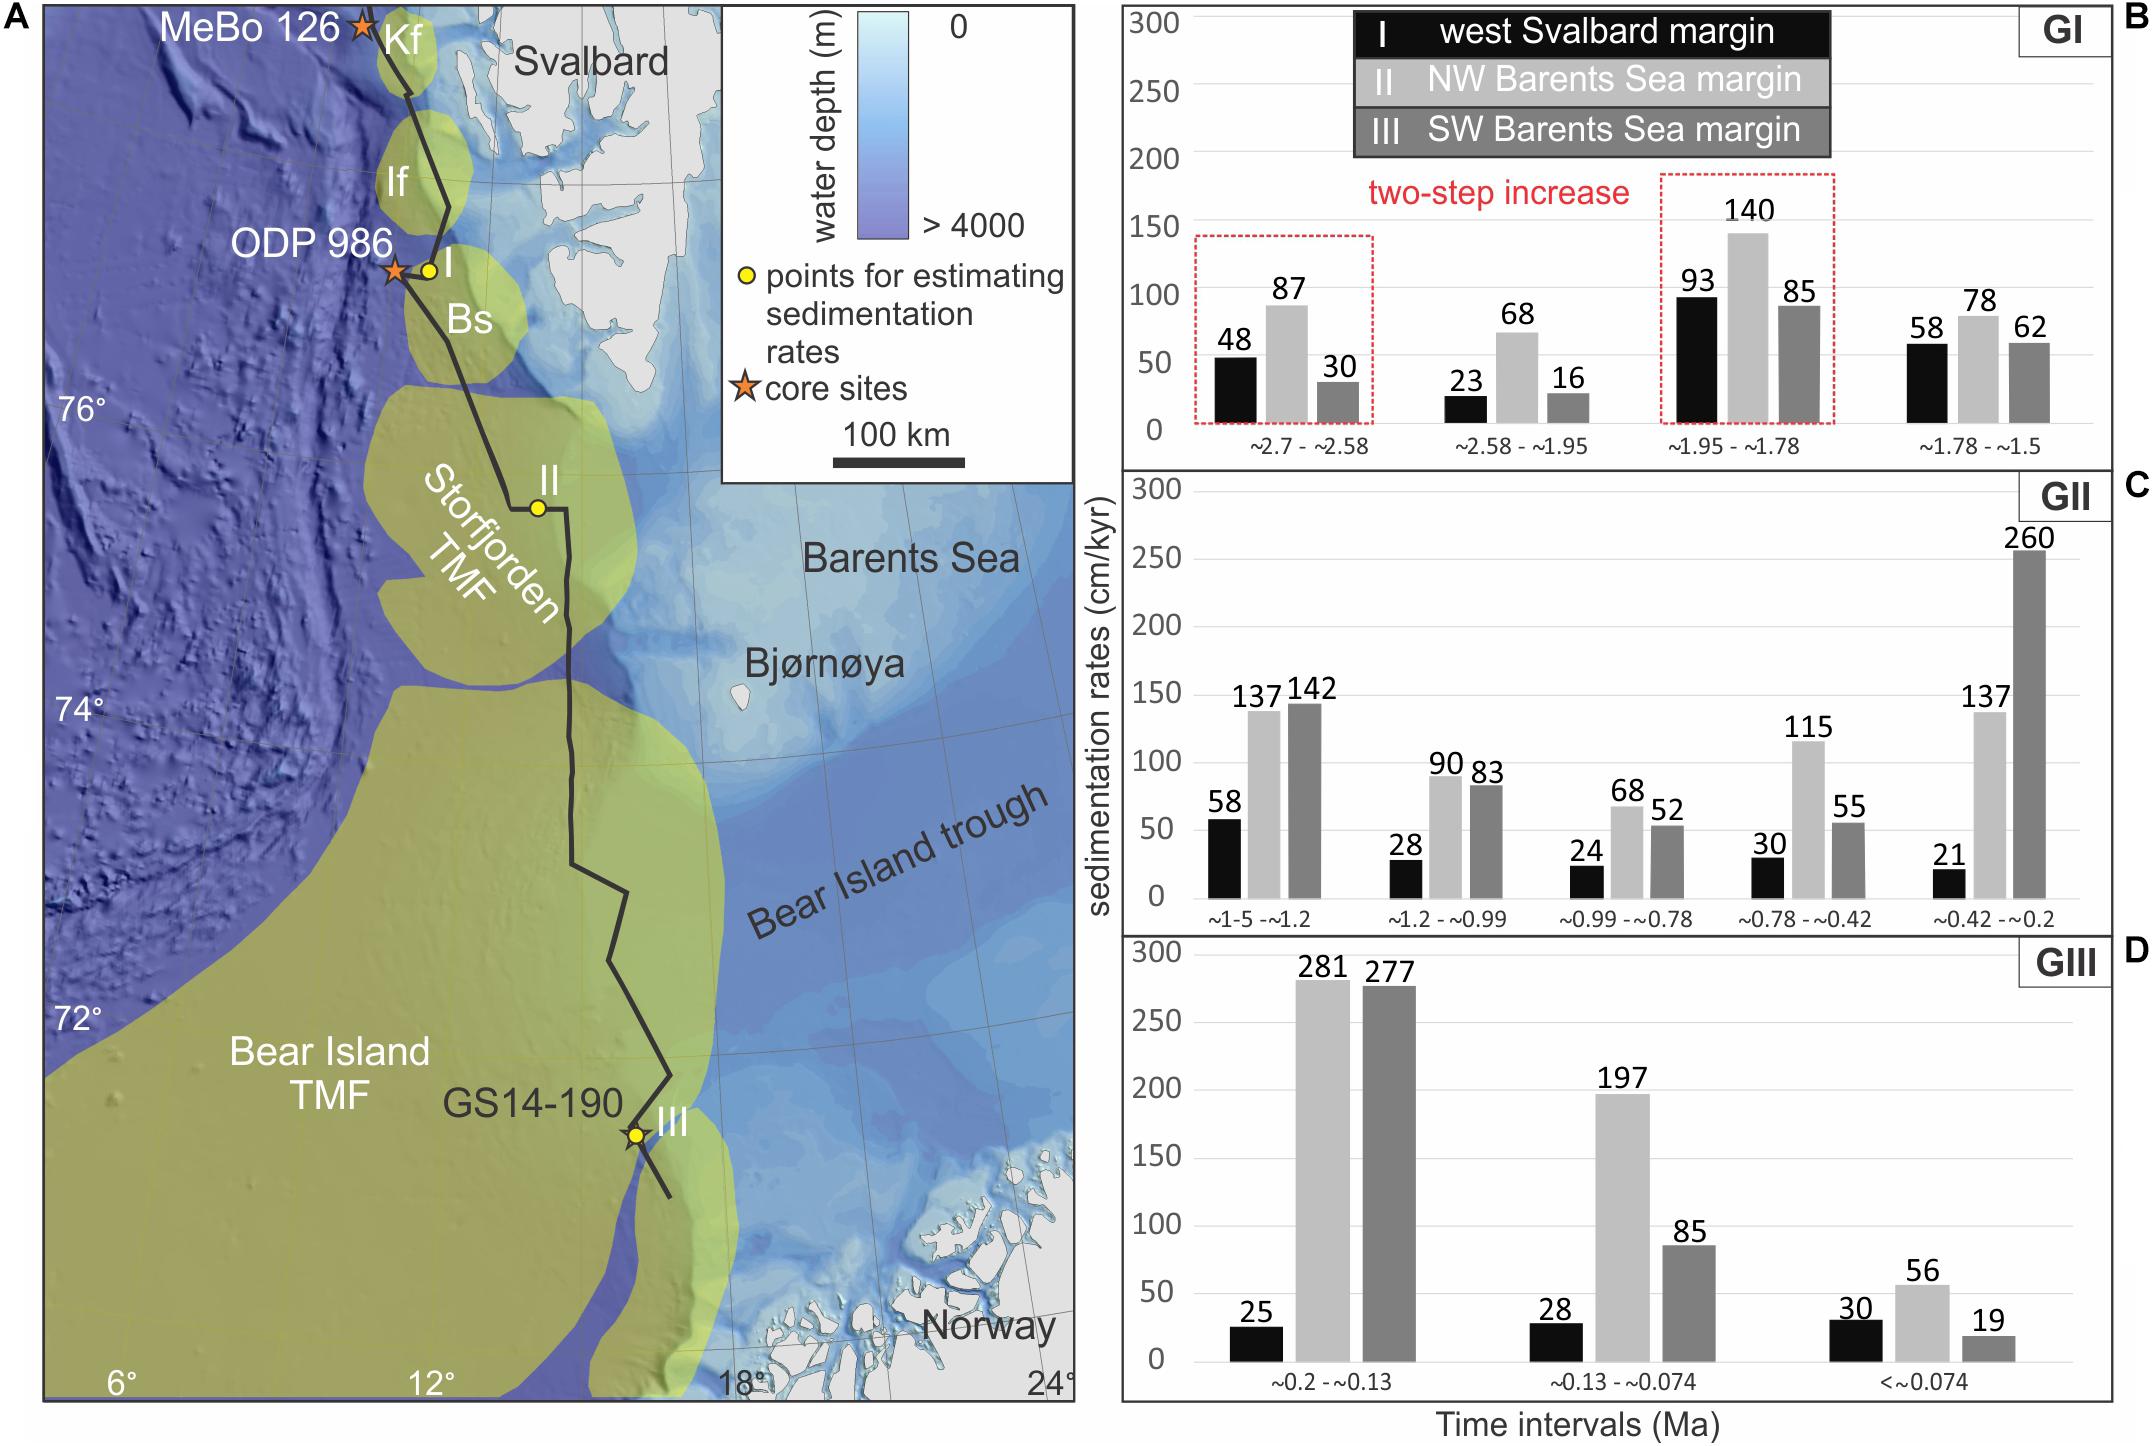
Figure 8. Sedimentation rate estimates along the margin. (A) Basemap shows the location of the selected points along the composite profile for estimating the sedimentation rates (I–III) and the available core sites along the western Svalbard-Barents Sea margin. (B–D) Sedimentation rate plot shows variations on selected points I–III. Kf: Kongsfjorden TMF; If: Isfjorden TMF; Bs: Bellsund TMF.
Regional Setting
The Barents Sea is today an epicontinental sea characterized by relatively shallow banks separated by deep troughs (Figure 1). With water depths ranging from 100 to 200 m in the banks to around 400 m in the troughs, the Barents Sea shelf extends from the Norwegian-Greenland Sea and the Svalbard Archipelago in the west to Novaya Zemlya in the east.
The evolution of the western Barents Sea margin is closely related to the gradual opening of the Norwegian-Greenland Sea (e.g., Faleide et al., 2008). The western Barents Sea and Svalbard continental margin extends about 1,000 km in a north-south direction. Yermak Plateau is located on the eastern flank of the Fram Strait in the marginal Arctic Ocean (Figure 1). It forms the northwestern part of the Barents Sea shelf and is bounded by the Arctic Ocean to the north and the Svalbard archipelago to the south. The southern Yermak Plateau has water depths of about 600–800 m, but shallows to less than 500 m in the southernmost part.
Rift flank uplift, inferred to have been most pronounced in the Svalbard area and caused by a thermal anomaly (Dimakis et al., 1998), was a consequence of the tectonic evolution of the area during early-middle Cenozoic. Farther south in the shear zone area of the southwestern Barents Sea, the uplift was less pronounced and was the result of thermomechanical coupling (e.g., Dimakis et al., 1998; Faleide et al., 2008). The uplifted northern Barents Sea shelf areas experienced severe erosion during Eocene to Miocene times, feeding sediment to the southern and eastern Barents Sea shelf, which were low-relief areas close to sea level at that time (e.g., Butt et al., 2002), contributing to the composition of the sedimentary bedrock across the Barents Sea shelf (Sættem et al., 1992, 1994; Sigmond, 1992). The uplifted Barents Sea region (Dimakis et al., 1998; Faleide et al., 2008) subsequently became the site of nucleation of very large ice masses during several glaciations (e.g., Eidvin et al., 1993).
Butt et al. (2002) and Zieba et al. (2017) based on numerical modeling, suggested that the Barents Sea was subaerial during the earliest Late Pliocene, becoming a submarine platform around ∼1 Ma ago. Both the preglacial and glacial history is reflected in the present-day topography of the Barents Sea region (e.g., Faleide et al., 1996; Ottesen et al., 2008; Andreassen and Winsborrow, 2009; Laberg et al., 2012). An upper regional unconformity (URU) defines the base of the glacigenic sediments across the continental shelf (Solheim and Kristoffersen, 1984; Vorren et al., 1986).
The Plio-Pleistocene sedimentary succession of the Svalbard-Barents Sea margin consists of successive glacial-interglacial sedimentary sequences, including several large submarine trough mouth fans, forming the morphological shelf edge along the passive continental margin of the European plate. The size of the individual TMFs reflects both the size of the troughs and their corresponding drainage area. The Bear Island TMF is by far the largest, and the TMFs along the Svalbard margin the smallest (e.g., Faleide et al., 1996; Vorren and Laberg, 1997; Pope et al., 2018). The TMFs are depocenters accumulated in front of ice streams draining the former large ice sheets, representing an excellent source of information on past glacial fluctuations (e.g., Faleide et al., 1996; Hjelstuen et al., 1996, 2007; Solheim et al., 1996; Vorren and Laberg, 1997; Taylor et al., 2002; Dowdeswell et al., 2008; Montelli et al., 2018; Ó Cofaigh et al., 2018; Pope et al., 2018). More specifically, during glacial maxima, sediments transported by the advancing ice sheet attain the shelf break and are delivered directly to the upper slope producing glacigenic debris flow deposits (e.g., Dowdeswell et al., 2008; Ottesen et al., 2016; Camerlenghi, 2018; Knies et al., 2018).
Previous Seismic Frameworks and Age Control Along the Northern and Western Svalbard-Barents Sea Continental Margin
The first attempt to combine the local seismic stratigraphies from different TMFs along the western Barents Sea margin into one, was made by Faleide et al. (1996). In their seismic framework, three main seismic units GI-GIII, and seven regional seismic reflections R7-R1 were identified along the western margin, of which the deepest, R7, was interpreted to mark the base of the glacial deposits (Figure 2). Chronological constraints on the proposed seismic stratigraphy were sparse, and a likely age of R7 was proposed by Faleide et al. (1996) to be 2.3 Ma, derived from the chronostratigraphic framework of shallow boreholes and exploration wells from the southwestern Barents Sea (e.g., Sættem et al., 1992, 1994; Eidvin et al., 1993; Mørk and Duncan, 1993). R1 was considered to be between 440 and 200 ka based on shallow boreholes in the outer Bear Island Trough (Sættem et al., 1992), amino acid analyses (Sættem et al., 1992) and extrapolation of calculated sedimentation rates in piston cores on the Svalbard margin (Elverhoi et al., 1995). The age of R5 was estimated to be ∼1.0 Ma by correlation with increased amounts of ice-rafted detritus (IRD) and oxygen-isotope measurements (Faleide et al., 1996).
In 1995 ODP Site 986 west of Svalbard was drilled (Jansen et al., 1996) and a key objective for this site was to improve the age control of the R7-R1 seismic stratigraphy. Initial age estimates for ODP Site 986 were made using paleomagnetic (Channell et al., 1999), biostratigraphic (Eidvin and Nagy, 1999) and Sr-isotope data (Forsberg et al., 1999), with much emphasis placed on the magnetic stratigraphy due to poor biostratigraphic constraints. This yielded the following age estimates (Figure 2): ∼0.5 Ma for R2 (interpolation, supported by biostratigraphic data; Butt et al., 2000). ∼0.78 Ma (Brunhes/Matuyama palaeomagnetic datum; Channell et al., 1999) for R3. ∼0.99 Ma for R4 (Top Jaramillo palaeomagnetic datum; Channell et al., 1999). 1.3–1.5 Ma was estimated for R5 (interpolated age, supported by biostratigraphic and Sr-data; Butt et al., 2000), ∼1.6–1.7 Ma for R6 (interpolated age, supported by biostratigraphic and Sr-data; Butt et al., 2000), and 2.3–2.5 Ma for R7 based on linear interpolation between the maximum age of 2.6 Ma at the base of ODP Site 986, supported by biostratigraphic and Sr data (Butt et al., 2000). The biostratigraphy of Site 986 was re-evaluated later by Knies et al. (2009) who suggested the additional biostratigraphic datums of ∼2.41 and 2.76 Ma. They further found that the age of the base of ODP Hole 986D dates to ∼3.2 Ma and together with the additional biostratigraphic datums they revised the age of R7 to ∼2.7 Ma (Figure 2).
Later Rebesco et al. (2014) revised the ages of reflections R6, R5, R4, R3, R2, and R1 and assigned for the first time an age for R4A reflection by linear interpolation between the palaeomagnetic datums, the Brunhes/Matuyama boundary and the top of the Jaramillo Subchron (Channell et al., 1999). The respectively, given ages of those reflections are about 2.1 Ma (R6), 1.5 Ma (R5), 1.3 Ma (R4A), 1.1 Ma (R4), 0.75 Ma (R3), 0.4 Ma (R2), and 0.2 Ma (R1) (Figure 2).
The northern Barents Sea margin stratigraphy (Geissler and Jokat, 2004) relies on the three ODP sites (910, 911, 912) on the Yermak Plateau (Figure 3) and is divided into three seismic units YP-1, YP-2, and YP-3 (Eiken and Hinz, 1993; Geissler and Jokat, 2004). The base of unit YP-3 represents the base of the glacial deposits and has been assigned an age of ∼2.7 Ma based on the chronostratigraphic framework of ODP Site 911 (Myhre et al., 1995: palaeomagnetic data; Sato and Kameo, 1996: biostratigraphic data). The ages of YP2-YP3 boundary on the Yermak Plateau and R7 seismic reflection on the western Barents Sea margin are similar, indicating a close correspondence of both seismic units GI-GIII (west) and YP-3 (north). Mattingsdal et al. (2014) further identified additional seismic horizons within YP-3 unit and assigned ages to these by ties to the three ODP sites on Yermak Plateau (910, 911, 912). Today, therefore two separated seismic stratigraphic frameworks have been established covering different parts of the continental margin, one for the northern Barents Sea margin (ODP Site 910, 911, 912), and one for the western Barents Sea margin (ODP Site 986).
Materials and Methods
Dataset
Our dataset consists of 2D seismic reflection profiles, acquired over the last 34 years, both from industry and academia, that extends along the entire western Barents Sea-Svalbard margin, covering the continental slope and outer shelf (Figure 3). The vertical resolution (∼1/4 of the dominant wavelength, λ) of the existing seismic datasets varies considerably. In the western Barents Sea, the vertical resolution varies from 10 to 15 m close to the seafloor and up to 25–30 m near the base of the glacigenic sediments. The high-resolution 2D seismic data acquired by CAGE-Centre for Arctic Gas Hydrate, Environment and Climate -UiT The Arctic University of Norway in Tromsø (e.g., Andreassen, 2017), are located along the western Svalbard margin, and have a vertical resolution of ∼3–5 m at the seafloor, and ∼11–15 m at the base of the glacigenic sediments.
Methodology
The following workflow was implemented:
1. Compile all available 2D seismic datasets (Figure 3).
2. Correlate selected age fix-points from the available boreholes along the margin (Figure 1 and Supplementary Figures 2, 3). The conversion of the age fix-points from depth to time at each core site was based on the velocity constraints from various studies (a) ODP 912: Mattingsdal et al. (2014), (b) MeBo Site 126: Plaza-Faverola et al. (2017), (c) ODP 986: Jansen et al. (1996), (d) GS14-190 piston core: Fiedler and Faleide (1996). Using the 2D seismic dataset we extend the chronostratigraphic framework from southern Yermak Plateau (ODP Sites 910, 911, 912) across a composite profile, toward Vestnesa Ridge, northern-western Svalbard margin (MeBo Site 126), Isfjorden TMF, west of Svalbard (ODP Site 986), and finally to the Bear Island TMF on the southwestern Barents Sea margin (piston core GS14-190) (Figures 1, 3 and Table 1). An overview of the 2D seismic profiles that comprise the composite profile are available in Supplementary Table 1. It is important to note that these seismic horizons extending along the margin are not necessarily timelines, as their character varies from depositional, continuous sedimentary reflections to erosional unconformities. We acknowledge the sparse availability of age fix-points and the fact that their uncertainty likely increases as these are extended along the margin, away from the core sites. However, the number and reliability of age fix-points, and the coverage and quality of the seismic database, represents a considerable improvement on previous frameworks used to calibrate the glacial seismic stratigraphy along the western Svalbard-Barents Sea margin. We anticipate that future scientific drillings in the study area, will test, modify, and further refine this framework.
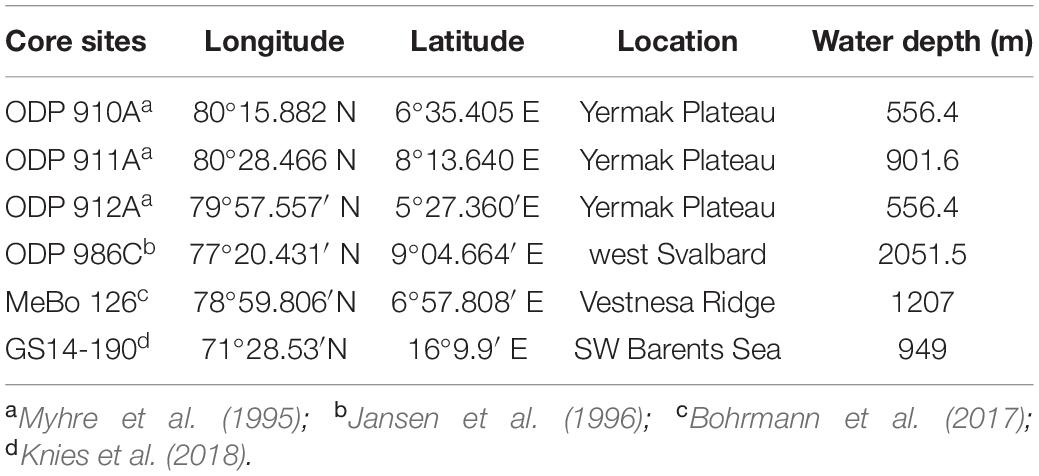
Table 1. Details of core sites displayed in Figure 1.
3. Identify the most pronounced seismic reflections along the margin and divide the seismic stratigraphy into three main seismic units, GI-GIII.
4. Estimate sedimentation rates at selected points along the margin. The margin was divided into three sections representing the broad changes in source area and depositional environments along the margin: western Svalbard, northwestern Barents Sea and southwestern Barents Sea. Within each sector, sedimentation rates were estimated at a point along the composite seismic line selected as representative for that section based on visual inspection of the seismic datasets. Particular attention was given to avoid areas of mass wasting deposits and sediment bypass, and we consider these estimates to be representative of broad, regional changes in sedimentation rate despite the complex and varied depositional settings along the margin. The conversion of the seismic reflections from time to depth where there were no available age fix-points was based on the velocity constraints from various studies: Jansen et al. (1996) was used for the western Svalbard section (I), Hjelstuen et al. (1996) for the northwestern Barents Sea section (II), and Fiedler and Faleide (1996) for the southwestern Barents Sea section (III). We assume constant sedimentation rates during the selected time intervals.
Results
Chronology
Figure 4 shows the age fix-points that we have used to constrain the seismic stratigraphic framework on the southern Yermak Plateau (ODP Sites 910, 911, 912), Vestnesa Ridge (MeBo Site 126), west of Svalbard (ODP Site 986) and southwestern Barents Sea (GS14-190PC).
On the Yermak Plateau, ODP Site 912 covers sediments that extend only over the last 1.95 Ma (Myhre et al., 1995), and the seismic horizons older than 1.95 Ma are constrained by the age model for ODP Holes 910C and 911A established by Mattingsdal et al. (2014). The seismic reflection that correspond to ∼0.78 Ma is constrained by the ODP Sites 910, 911, and 912 (Yermak Plateau) and 986 (west of Svalbard), ∼0.99 Ma is constrained by the ODP Site 912 (Yermak Plateau) and 986 (west of Svalbard) and the seismic reflection that corresponds to ∼2.7 Ma age is constrained by the ODP Sites 910 and 911 (Yermak Plateau) and 986 (west of Svalbard), corresponding to R3, R4, and R7 of Faleide et al. (1996) seismic stratigraphy, respectively. The seismic horizons ∼1.2, 1.78, 1.95, and ∼2.58 Ma are calibrated only by the ODP Sites on the Yermak Plateau, however, they are characterized by moderate- to high-amplitude seismic reflections, allowing them to be correlated along the whole margin. The seismic reflection that corresponds to ∼1.5 Ma is equivalent to the R5 reflection by Faleide et al. (1996) and is constrained by the ODP Site 912 (Yermak Plateau) and Site 986 (west of Svalbard). The younger age estimates, ∼0.074, 0.13, and 0.42 Ma, are based on the MeBo Site 126 borehole from the Vestnesa Ridge (Dessandier et al., 2021). Based on the depth at which the seismic horizons corresponding to ∼0.42, 1.2, and 1.78 Ma ages cross the ODP Site 986 we correlate them to the R7-R1 seismic stratigraphy (Faleide et al., 1996; Jansen et al., 1996; Figure 2 and Supplementary Figure 3). The respectively given ages of those reflections are about ∼0.42 Ma (R2), ∼1.2 Ma (R4A), and ∼1.78 Ma (R6). At the ODP Site 986, R1 reflection lies between the seismic reflections that correspond to ∼0.13 and 0.42 Ma ages (Figure 2). Based on the published ages for R1 reflection and its position at the ODP Site 986, we apply here ∼0.2 Ma as the age of R1.
On the southwestern Barents Sea margin, the GS14-190 Piston Core was used to provide additional confirmation of one age fix point. Specifically, the age of the core base (1,380 cm) in GS14-190 was estimated by linear interpolation to be ∼74 ka (Supplementary Figure 1) and correlates well with the seismic reflection that corresponds to ∼74 ka age fix-point on the MeBo Site 126 (Dessandier et al., 2021). Beyond this age fix-point, we rely on the R7-R1 seismic stratigraphy (Faleide et al., 1996; Fiedler and Faleide, 1996; Jansen et al., 1996; Hjelstuen et al., 2007) to constrain the stratigraphic framework in this area.
Seismostratigraphic Correlation
The continuous seismostratigraphic framework for the entire western Svalbard-Barents Sea margin developed in this study is presented in Figure 5. The framework comprises 12 seismic horizons, correlated along a composite seismic profile, between Yermak Plateau and the Bear Island TMF, with age assignments from ∼0.074 to 2.7 Ma, derived from selected age fix-points from available core sites (Figure 4 and Table 1). All the seismic reflections are pronounced and can be traced along the whole margin. The location of the composite seismic profile (Figure 1) was selected to avoid challenging areas for the interpretation, such as steep slopes and areas with abundant slides and glacigenic debris flows.
An overview of the depth in two-way travel time (ms) for all the seismic reflections is given for all the key core sites in Table 2 (see location of the sediment cores in Table 1), providing useful age estimates along the margin.
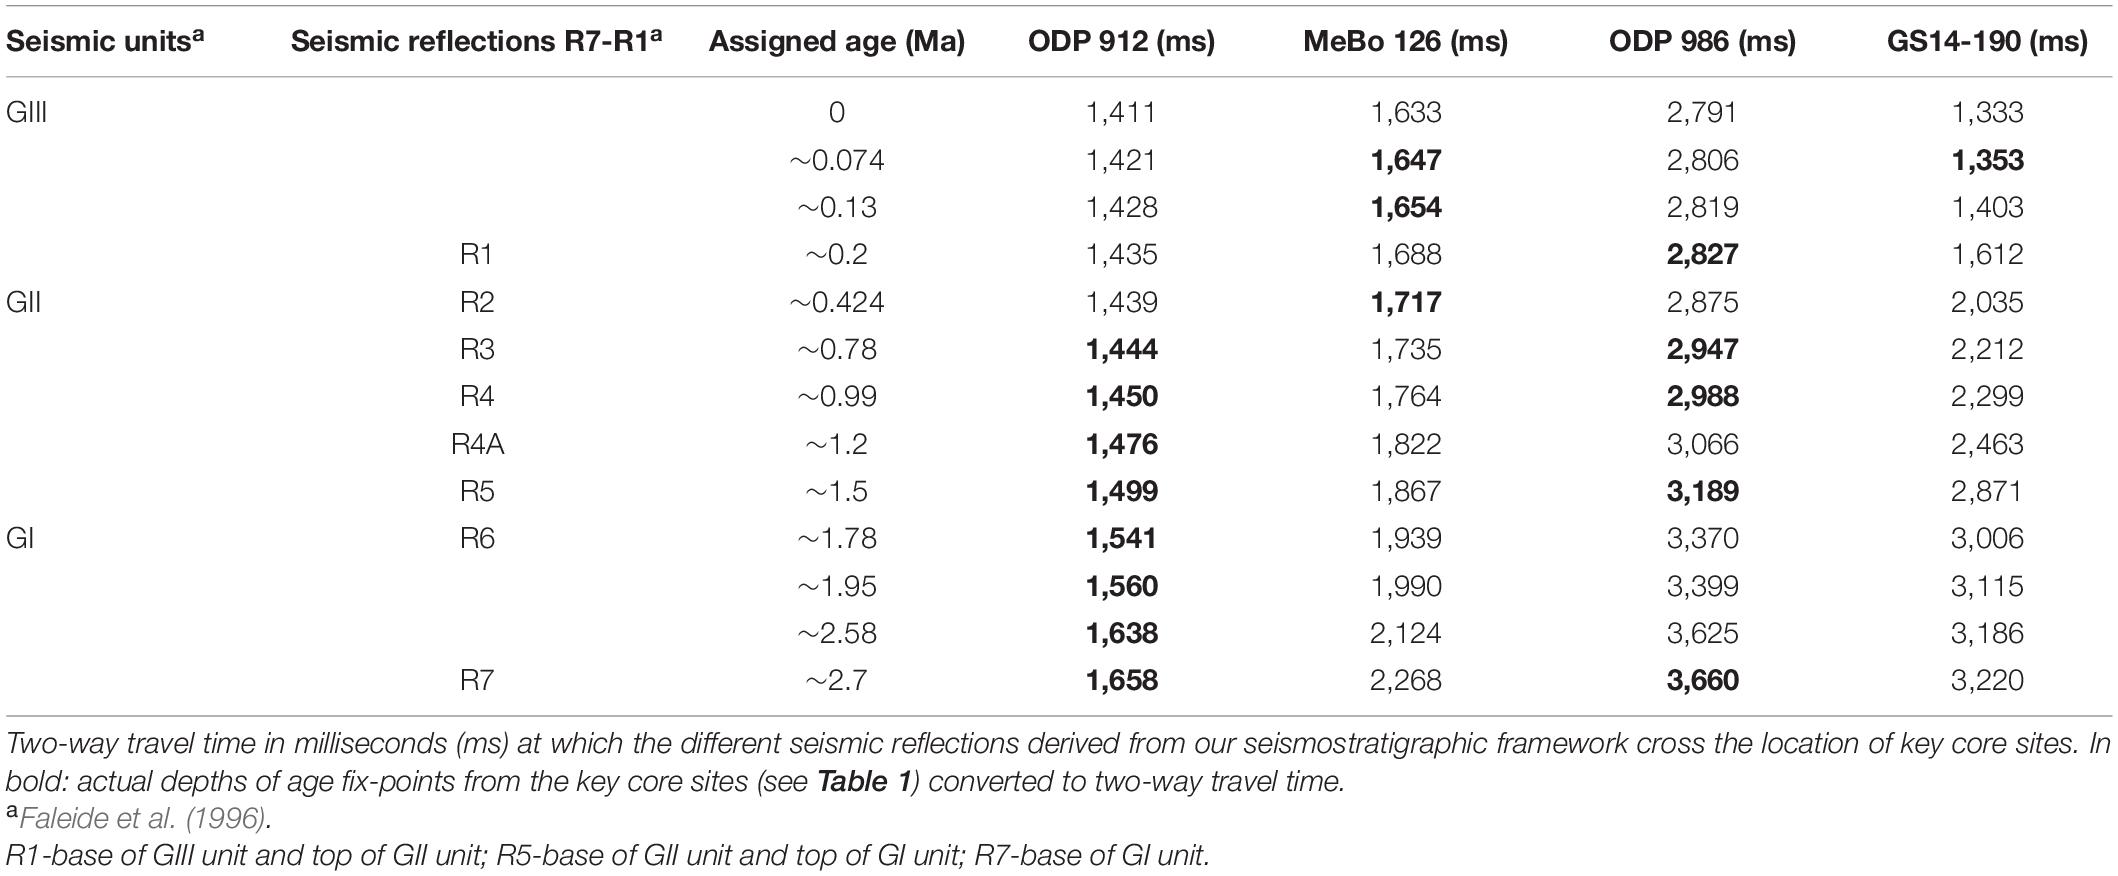
Table 2. Correlation of the seismic stratigraphic framework proposed in this study to the three main seismic units, GI-GIII and R7-R1 seismic stratigraphy (Faleide et al., 1996).
In line with the existing nomenclature, we separate the seismic stratigraphy of the last ∼2.7 Ma, into three seismic units, GI-GIII (Faleide et al., 1996). These units are bounded by the three most pronounced seismic reflections: R7 (∼2.7 Ma) (base of GI unit), R5 (∼1.5 Ma) (GI-GII boundary), and R1 (∼0. 2 Ma) (GII-GIII boundary) (Figure 6A), providing constraints on their age. These three seismic reflections represent important depositional sequence boundaries along the entire Barents Sea-Svalbard margin (e.g., Faleide et al., 1996; Butt et al., 2000; Hjelstuen et al., 2007; Mattingsdal et al., 2014; Rebesco et al., 2014).
Seismic Facies, Sedimentation Rates, and Interpretation
In the following sections, we describe the internal seismic facies distribution and variations in the sedimentation rates within each seismic unit (GI-GIII) and then interpret this with respect to palaeo-environmental conditions during the deposition of each unit. The thicknesses of the three seismic units vary along the continental margin and the internal seismic reflection patterns vary from stratified to chaotic. The characteristic seismic facies for the glacigenic sediments along the western Svalbard-Barents Sea margin are shown in Figure 7, together with their interpretation.
Along the composite profile we select three points (I–III) to calculate the sedimentation rates (Figures 6, 8A). These points are located on: (I) western Svalbard margin section with sedimentation rates assumed to reflect a source area covering western Svalbard; (II) northwestern Barents Sea margin section with sedimentation rates assumed to reflect a source area encompassing both southern and central Svalbard, and the northwestern Barents Sea draining out the Storfjorden Trough; and (III) southwestern Barents Sea margin section with sedimentation rates assumed to reflect a source area encompassing a broad extent of the central and southern Barents Sea and northern Fennoscandia.
Seismic Unit GI (∼2.7–1.5 Ma)
The base of GI, reflection R7, is characterized by moderate to high amplitude and it represents a clear erosional unconformity (Figure 6D). However, near ODP Site 986 west of Svalbard, that is located on the deeper part of the continental margin, it forms a group of low-amplitude discontinuous reflections (Figure 5).
Overall, along the western Svalbard and northwestern Barents Sea margins, unit GI is characterized by subparallel seismic reflections of high amplitude interbedded with transparent to semi-transparent seismic reflections, interrupted by chaotic seismic facies (Figures 6B–E). From ∼2.7 to 2.58 Ma the whole margin is characterized by subparallel seismic reflections. Between ∼2.58 and 1.95 Ma on the Bellsund and Storfjorden TMFs there are intervals of chaotic seismic facies (Figures 6D,E), while, the Sjubrebanken TMF is characterized by lens-shaped bodies with a homogeneous interval, bounded by high-amplitude seismic reflections from ∼2.58 Ma and above (Figure 6B). Concordant seismic reflections are seen within the entire GI unit of Kongsfjorden TMF (Figure 6C), and in intervals from ∼1.78 Ma and above on the Bellsund TMF (Figure 6E). These seismic facies contrast strongly with those observed on the southwestern Barents Sea margin where unit GI is characterized by subparallel seismic reflections, cut by multiple incisions (Figures 6F–H).
Sedimentation rates during GI show a prominent two-step increase (Figure 8B). The first step (∼2.7 and ∼2.58 Ma), is marked by increased sedimentation rates compared to preglacial period (G0: 2–3 cm kyr–1) (Faleide et al., 1996; Fiedler and Faleide, 1996; Hjelstuen et al., 1996, 2007; Mattingsdal et al., 2014; Lasabuda et al., 2018), in particular along the west Svalbard (48 cm kyr–1) and northwestern Barents Sea (87 cm kyr–1) margin (Figure 8B). This is followed by a significant drop in sedimentation rates, halved on both the western Svalbard and southwestern Barents Sea margin (down to 23 and 16 cm kyr–1, respectively) and reducing by nearly a third on the northwestern Barents Sea margin (68 cm kyr–1). Between ∼1.95 and 1.78 Ma a second period of peak sedimentation rates occurs, during which the sedimentation rates along the entire margin are characterized by a distinct increase reaching 93 cm kyr–1 on the western Svalbard, 85 cm kyr–1 on the southwestern Barents Sea margin and 140 cm kyr–1 on the northwestern Barents Sea margin (Figure 8B). This second increase is again followed by a reduction along the entire margin, with all three sections of the margin showing broadly uniform rates, varying from 58 to 78 cm kyr–1 (Figure 8B).
We interpret the variations in seismic facies distribution and sedimentation rates within GI to reflect a proximal ice margin on the western Svalbard and northwestern Barents Sea margin. The two-step increase in sedimentation rates suggests two periods of glacial expansion in these northern parts of the margin. During the first step meltwater discharges prevail inferred from the seismic facies and there is no indication of shelf-edge glaciations. The first indication of shelf-edge glaciation is on the Sjubrebanken TMF (northwestern Svalbard margin) where glacigenic debris flows are identified above ∼2.58 Ma. At the same time, mass wasting deposits become more widespread, especially on the Bellsund TMF (western Svalbard margin) and the Storfjorden TMF (northwestern Barents Sea margin), and parts of the western Svalbard margin are characterized also by contouritic/turbitidic deposits (Kongsfjorden and Bellsund TMF). The increase in mass wasting deposits related to megaslides/mass wasting may have been triggered by high sedimentation rates during the first step of glacial intensification (from ∼2.7 to 2.58 Ma), in combination with low eustatic sea-level and the presence of weak layers-contourites (Amundsen et al., 2011; Safronova et al., 2017). On the southwestern Barents Sea margin distal glaciomarine deposits prevail, interbedded with hemipelagic and/or turbiditic/contouritic deposits (e.g., Rydningen et al., 2020), cut by channels, which we relate to a glaciofluvial system developed on the shelf, in accordance with Laberg et al. (2010). Apart from the northwestern Svalbard margin, we see no evidence for shelf edge glaciation on the rest of the western Svalbard-Barents Sea margin during GI period.
Seismic Unit GII (∼1.5–0.2 Ma)
The base of GII, reflection R5, is one of the most pronounced seismic reflections along the margin. It clearly has an erosional character, truncating the underlying reflections (Figures 6D,F,G).
The internal seismic signature of unit GII on the western Svalbard-Barents Sea margin is lens-shaped bodies with a homogeneous internal structure bounded by high-amplitude seismic reflections and in places interrupted by chaotic seismic reflections (Figures 6C,E–G,I). Around ∼0.99 Ma we observe a change in seismic facies on the Sjubrebanken TMF from lens-shaped bodies with a homogeneous internal structure bounded by high-amplitude seismic reflections, to high-amplitude parallel to subparallel seismic reflections interbedded with layers of semi-transparent to transparent seismic facies. While at that time seismic facies of lens-shaped bodies with a homogeneous internal structure start to prevail on the Kongsfjorden TMF (Figure 6C) and these seismic facies increase in frequency on the Storfjorden TMF (Figure 6E). The Kongsfjorden and the Bellsund TMF are characterized by concordant seismic reflections up to ∼1.2 Ma (Figures 6C,E).
The transition from GI to GII is marked by an approximate doubling of sedimentation rates from 78 and 62 cm kyr–1 to 137 and 142 cm kyr–1 on the northwestern and southwestern Barents Sea margin, respectively, whilst they remain constant on the western Svalbard margin (58 cm kyr–1) (Figure 8C). Sedimentation rates then gradually decrease along the northwestern (68 cm kyr–1) and southwestern (52 cm kyr–1) Barents Sea margin from ∼1.2 until ∼0.78 Ma. At around ∼0.78 Ma, rates once again start to rise, first on the northwestern Barents Sea margin (115 cm kyr–1), followed by a dramatic increase, between ∼0.42 and ∼0.2 Ma, in the southwestern Barents Sea reaching up to 260 cm kyr–1, the largest increase seen in our dataset. The western Svalbard margin has an overall decrease in sedimentation rates from 58 to 21 cm kyr–1 over the entire period (Figure 8C).
The western Svalbard margin during GII, is characterized by stable sedimentation rates and the seismic facies indicate the dominance of shelf-edge glaciations [e.g., glacigenic debris flow deposits, on the Sjubrebanken TMF (Figure 6B), Kongsfjorden TMF (Figure 6C) and the Bellsund TMF (Figure 6E)]. On the northwestern Svalbard margin (Sjubrebanken and Kongsfjorden TMF), changes in the seismic facies indicate an initial period of deposition focused on the Sjubrebanken TMF (Figure 6B) between ∼1.5 and 0.99 Ma, followed by a switch in deposition to the adjacent Kongsfjorden TMF, at around ∼0.99 Ma (Figure 6C). This change in depocentres has been interpreted as the expression of a switch in the location of the ice stream flowing out Kongsfjorden (Sarkar et al., 2011; Mattingsdal et al., 2014).
Along the northwestern and southwestern Barents Sea margin high sedimentation rates between ∼1.5 and 1.2 Ma (Figure 8C), accompanied by glacigenic debris flow and mass wasting deposits (Figures 6E–G), are consistent with increasing glacial cover across the Barents Sea, and shelf-edge glaciations along the western Svalbard-Barents Sea margin. This is in agreement with the observation of megascale glacial lineations in the Bear Island Trough, indicating fast flowing ice streams reaching the shelf edge above R5 (∼1.5 Ma) (Andreassen et al., 2004).
Following this initial increase, sedimentation rates during GII generally decrease between ∼1.2 and 0.78 Ma, but the seismic facies (glacigenic debris flows and mass wasting deposits, Figures 6C–I) continue to indicate shelf-edge glaciations along the margin. At around ∼0.99 Ma an increase in glacigenic debris flow frequency is recorded in the western Svalbard and northwestern Barents Sea margins (Figures 6C,E) followed by an increase in sedimentation rates first on the northwestern Barents Sea margin around ∼0.78 Ma (Figure 8C) and then on the southwestern Barents Sea margin around ∼0.42 Ma (Figure 8C). This same time period is also associated with megaslides in the Bear Island TMF (Hjelstuen et al., 2007).
Seismic Unit GIII (< ∼0.2 Ma)
The base of GIII, reflection R1, is characterized by medium to strong amplitude and its character varies along the margin from depositional, continuous sedimentary reflection (Figure 6B) to erosional unconformity (Figures 6C–E,G–I). On the southwestern Barents Sea margin, the base of GIII corresponds to the Upper Regional Unconformity (URU) (Solheim and Kristoffersen, 1984; Vorren et al., 1986) on the shelf, that separates glacial sediments from the underlying preglacial strata (Fiedler and Faleide, 1996).
The western Svalbard and northwestern Barents Sea margins are characterized by an increase in frequency of the lens-shaped bodies with a homogeneous internal structure, bounded by high-amplitude parallel to subparallel seismic reflections compared to GII unit. This is well demonstrated on Kongsfjorden TMF (Figure 6C) and Storfjorden TMF (Figure 6E). The southwestern Barents Sea margin is characterized by lens-shaped bodies with a homogeneous internal structure bounded by high-amplitude parallel-subparallel seismic reflections (Figures 6G–I). Around ∼0.13 Ma a shift in seismic facies occurs along the whole margin from continued high amplitude parallel to subparallel seismic reflections to transparent to semi-transparent reflections (Figures 6B,D,G).
Overall, GIII is characterized by decreasing sedimentation rates, with higher and more variable sedimentation rates along the south- and north-western Barents Sea margin relative to those on the western Svalbard margin (Figure 8D). The first period of GIII (between ∼0.2 and 0.13 Ma) sees a maintenance of the low sedimentation rates on the western Svalbard margin, accompanied by increases on the northwestern and southwestern Barents Sea margins. The increase on the northwestern Barents Sea margin is particularly large, more than doubling from 137 to 281 cm kyr–1, the highest sedimentation rate observed in our dataset. This is followed by a gradual decrease over the last ∼0.13 Ma for the northwestern and southwestern Barents Sea margins, resulting in more uniform sedimentation rates along the entire margin during the final period of GIII (< ∼0.074 Ma). The western Svalbard margin is characterized by stable sedimentation rates within GIII, varying from 25 to 30 cm kyr–1 (Figure 8D).
The western Svalbard-Barents Sea margin is characterized by glacigenic debris flows, with intervals of glaciomarine/hemipelagic deposits, disturbed by mass wasting deposits on the southwestern Barents Sea margin. Based on seismic facies distribution and the sedimentation rates, we infer shelf-edge glaciations along the entire western Svalbard-Barents Sea margin during GIII.
Discussion
Reconstruction of the Svalbard – Barents Sea Ice Sheet Over the Last ∼2.7 Ma
Changes in sedimentation rates and seismic facies allow us to distinguish three phases of glacial development, each with specific characteristics in terms of ice extent and dynamics. Below we present a reconstruction of the evolution of glacial cover across the Svalbard-Barents Sea area over the past ∼2.7 Ma, and discuss these three phases in terms of palaeo-environmental and glacial dynamic changes.
Phase 1: 2-Step Glacial Intensification - (∼2.7 and 1.5 Ma)
The environmental change from G0 (preglacial period) to GI, associated with the first indications of large-scale glaciations in the northern Barents Sea around ∼2.7 Ma ago (e.g., Knies et al., 2009), is evidenced by a distinct increase in the mean sedimentation rate from 2 to 6 cm kyr–1 (preglacial strata; 55–2.7 Ma) (Faleide et al., 1996; Fiedler and Faleide, 1996; Hjelstuen et al., 1996, 2007; Mattingsdal et al., 2014; Lasabuda et al., 2018; Hjelstuen and Sejrup, 2020) to 38–82 cm kyr–1 (GI, ∼2.7–1.5 Ma). Within GI, the variations in sedimentation rate and seismic facies in our data are interpreted to indicate that across the Barents Sea-Svalbard shelf this initial glacial expansion occurred in two steps.
Intensification occurred first across Svalbard during phase 1, evidenced both by the high sedimentation rates (Figure 8B) and the prevalence of glacigenic debris flows (Figure 6B) and mass wasting deposits (Figures 6D,E) along the western Svalbard and northwestern Barents Sea margin. At this time on the southwestern Barents Sea margin, a more distal ice margin is inferred from the relatively lower sedimentation rates (Figure 8B) and the seismic facies implying channelized meltwater flows reaching the Bear Island TMF, sourced from the adjacent glaciated areas (Figure 6D). During the first step of intensification (from ∼2.7 to 2.58 Ma), the western Svalbard-Barents Sea margin is characterized by high sedimentation rates and glaciomarine deposits. In our data, we see no evidence for shelf-edge glaciation along the margin during the time period between ∼2.7 and ∼2.58 Ma. We therefore propose that during the first step of glacial build up, ice extent in the Barents Sea was restricted to the northernmost parts and did not reach the shelf break on the western Svalbard-Barents Sea margin (Figure 9A).
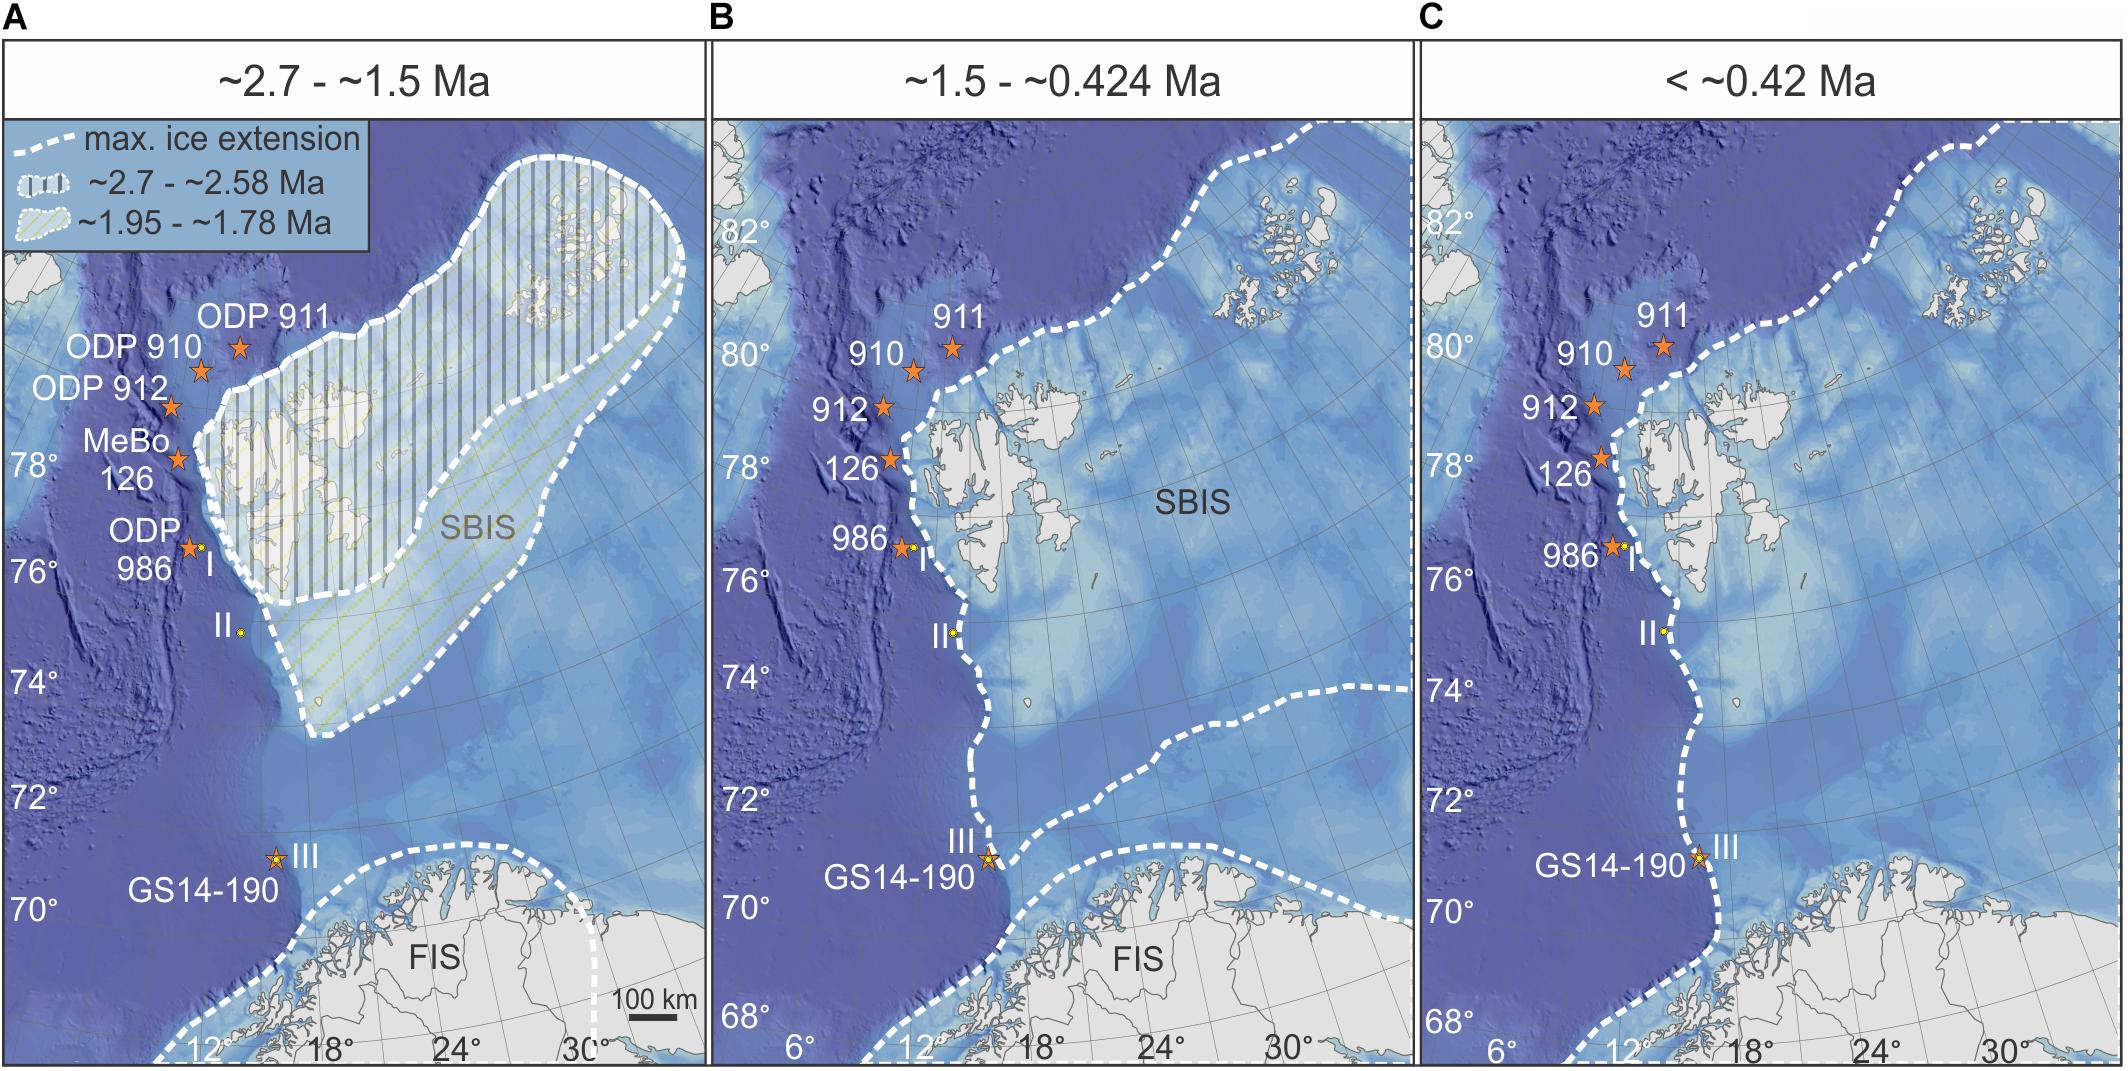
Figure 9. Schematic model of lateral ice extension in the Barents Sea region (modified from Knies et al., 2009) based on our interpretation and the existing literature. (A) Maximum extension of the SBIS during the two steps of intensification between ∼2.7 and 1.5 Ma. (B) Maximum extension of the SBIS and FIS between ∼1.5 and 0.42 Ma. (C) Maximum extension of the SBIS and FIS over the last ∼0.42 Ma. SBIS: Svalbard-Barents Sea Ice Sheet; FIS: Fennoscandian Ice Sheet.
The high mountainous terrain of Svalbard provides a preferable location for glacial build-up, and this would have been further enhanced by additional preglacial tectonic uplift in the northwestern Barents Sea, yielding higher relief terrain compared with the southwestern Barents Sea and promoting more intense glaciations (e.g., Vagnes et al., 1992; Fiedler and Faleide, 1996; Henriksen et al., 2011). This interpretation of a Svalbard-focused onset to glacial expansion in the Barents Sea around ∼2.7 Ma, is consistent with previous studies (e.g., Forsberg et al., 1999; Butt et al., 2000; Laberg et al., 2010; Mattingsdal et al., 2014). However, what these studies could not resolve was the subsequent pause in glacial build-up (between ∼2.58 and 1.95 Ma), followed by a second period of intensification (between ∼1.95 and 1.78 Ma), where ice began to extend beyond Svalbard, as indicated by the sedimentation rate and seismic facies data presented herein.
Between ∼2.58 and 1.95 Ma sedimentation rates dropped along the entire margin (Figure 8B), however, the first observed glacigenic debris flows on the Sjubrebanken TMF indicate the first shelf-edge glaciations on the northwestern Svalbard margin and the mass wasting deposits on the Bellsund TMF and Storfjorden TMF (Figures 6B,D,E) may be due to the increased sedimentation rates during the first step of intensification. Meanwhile the southwestern Barents Sea margin continued to be characterized by glaciomarine sediments cut by glaciofluvial channels (Figure 6G). These suggest continued glacial cover, centered on Svalbard, but a halt in its expansion/intensification. This also broadly consistent with paleontological data both on Yermak Plateau (ODP Site 910) and offshore west Svalbard (ODP 986) which indicate a relatively strong influence of the North Atlantic Current during this period, bringing warmer waters to the margin (Cronin and Whatley, 1996; Osterman, 1996; Spiegler, 1996; Smelror, 1999).
The second step of glacial intensification (between ∼1.95 and 1.78 Ma), is marked by simultaneously rising sedimentation rates along the entire margin (Figure 8B). These attest to more extensive glacial cover, extending beyond the Svalbard coastline to the wider northern and western Barents Sea, yet still not reaching the southern Barents Sea (Figure 9A). This is further supported by the seismic facies which shows an increase in the incisions on the southwestern Barents Sea margin (Figure 6F), consistent with other studies that have identified glaciofluvial drainage as the primary mode of sediment transport to the upper slope at this time (e.g., Butt et al., 2000). This is also in line with observations from ODP Site 986, where ice-rafted debris (IRD) first appears after R6 time (∼1.78 Ma), suggesting that glaciers first reached the shelf break west of Svalbard after that time (Butt et al., 2000); and paleontological data in the sediments deposited directly after R6 time which indicate polar to subpolar conditions (Smelror, 1999).
The inception of large-scale North Hemisphere glaciations occurred in a stepwise fashion, with IRD records indicating initial expansion of the Greenland ice sheet at ∼3.3 Ma, followed by expansion of North American and European ice sheets at ∼2.72–2.75 Ma (e.g., Jansen et al., 2000; Flesche Kleiven et al., 2002). Our findings are consistent with this, showing initial Svalbard-focused glacial intensification along the western Svalbard-Barents Sea margin at the onset of the GI period (∼2.7 Ma), and further show that the expansion of the Barents Sea Ice Sheet during this second period, also occurred in stepwise fashion.
A similar two-step pattern of glacial intensification is recorded in the IRD record from the circum-Atlantic region. Reduced IRD fluxes recorded between ∼2.5 and 1.55 Ma (Fronval and Jansen, 1996) indicate that glacial intensification at ∼2.7 Ma in Greenland and Scandinavia was followed by an interval characterized by less severe glaciations (Fronval and Jansen, 1996) and/or stabilized ice margins (Knies et al., 2009). This is in accordance with moderate IRD supply in the Svalbard-Barents Sea region between ∼2.4 and 1.7 Ma indicating less glacial activity during that period (Knies et al., 2009). It has also been suggested that at ca. 2.4 Ma huge ice masses were probably absent from northern Greenland (Funder et al., 2001) and the western Canadian Arctic from ∼<2.0 to 1.8 Ma (Barendregt and Irving, 1998), implying a more regional climatic control of the Northern Hemisphere glaciations.
Phase 2: Glacial Expansion Across the Barents Sea and Shelf-Edge Glaciations (∼1.5 and ∼0.42 Ma)
The onset of phase 2, is marked by a clear increase in sedimentation rates along the northwestern and southwestern Barents Sea margin (Figure 8C), accompanied by glacigenic debris flows and mass wasting deposits (Figure 6). This attests to glacial expansion across the wider Barents Sea leading to shelf-edge glaciations along at least part of the western Svalbard-Barents Sea margin (Figure 9B), and implies a glacial intensification at around ∼1.5 Ma for the whole Barents Sea-Svalbard region (Knies et al., 2009; Mattingsdal et al., 2014; Rebesco et al., 2014). This is supported by the first signs of extensive glacial erosion on the Yermak Plateau (Mattingsdal et al., 2014) and observations of streamlined subglacial landforms and extensive glaciotectonism (deformation of rocks or sediment due to the overriding or pushing of ice) formed by ice streams reaching the shelf-edge in the southwestern Barents Sea at this time (e.g., Andreassen et al., 2004, 2007; Laberg et al., 2010). During the Middle Pleistocene Transition (MPT ∼1.3–0.7 Ma) ice sheet expansions have also been documented, both from seismic and sedimentological data, on the east Greenland margin (Laberg et al., 2018; Pérez et al., 2018), the northwestern Greenland margin (Newton et al., 2020), the mid-Norwegian margin (Montelli et al., 2017; Newton and Huuse, 2017), the North Sea (Rea et al., 2018), and North America (Balco and Rovey, 2010), implying a regional expansion of all major Northern Hemisphere ice sheets (Newton et al., 2020).
The high sedimentation rates during the initial period of glacial expansion at the onset of phase 2, and the observations of continued glacial expansion coupled with reducing sedimentation rates between ∼1.2 and 0.78 Ma along the margin, may relate to changes in the availability of erodible material for the advancing ice sheet (e.g., Clark and Pollard, 1998). Prior to the Neogene uplift and erosion, most of the Barents Sea was covered by a relatively thick succession of lower Cretaceous to Paleogene fine-grained sediments (Sigmond, 1992). This readily erodible unlithified material (regolith) would have been easily removed by the first glacial advances across the Barents Sea shelf during phase 2, depositing large volumes of fine-grained sediments to the continental slope (e.g., Hjelstuen et al., 2007) and yielding high sedimentation rates. As these preglacial unlithified sediments were eroded and not replenished, we could expect a gradual reduction in the availability of erodible material for subsequent glacial advances during phase 2, yielding diminishing sedimentation rates. As well as influencing subglacial erosion and therefore sedimentation rates, this process has also been suggested to influence ice sheet dynamics. Clark and Pollard (1998) proposed that for the Laurentide Ice Sheet, continued erosion of preglacial regolith, that was not replenished, over multiple glaciations caused a gradual change in ice sheet subglacial thermal conditions from soft-bedded (the presence of a deforming layer of basal sediment) to a mixed hard-soft bedded. Under such a scenario thin, dynamic ice sheets develop when sufficient regolith remains to provide soft-bed conditions, whilst thicker, more persistent ice sheets develop when a threshold level of regolith erosion is crossed, and the ice sheet bed is no longer predominantly soft. The refined seismic stratigraphy presented herein, reveals for the first time a decrease in average sedimentation rates within the GII seismic unit. Based on these decreasing sedimentation rates we therefore hypothesize that glacial expansion across the Barents Sea during phase 2 was characterized by a gradual progression toward thicker, less dynamic ice sheets.
Another factor that may have influenced glacial evolution during phase 2 is the topographic/bathymetric evolution of the Barents Sea at this time. Interestingly, the transition of the Barents Sea from a subaerial landmass to a submarine shelf sea is suggested to have occurred around ∼0.99 Ma (e.g., Butt et al., 2002; Zieba et al., 2017). This would have been a very gradual process, however, over time changes, such as the deepening of the Bear Island Trough, would have provided increasing topographic constraint on the ice streams operating within it. This would have led to more focused glacial erosion and more focused sediment delivery to the margin, consistent with the increase in sedimentation rates during the final period of phase 2.
A critical control on the accumulation of glacigenic sediments across the western Svalbard–Barents Sea margin is the available accommodation space, which is primarily controlled by fluctuations in relative sea level, reflecting the relative contributions of eustasy, isostasy and tectonic movement (Jervey, 1988). On the western Barents Sea margin, regional tectonics and overall shelf-slope morphology determine the accommodation space, in addition to localized controls of differential subsidence (tectonic, compaction), erosion (glacial), or mass wasting processes (landslides, etc.) (e.g., Dimakis et al., 1998; Ó Cofaigh et al., 2003; Hjelstuen et al., 2007; Faleide et al., 2008). Based on the existing literature there is evidence for large-scale intensification of Svalbard-Barents Sea glaciation at ∼1.0 Ma (Hjelstuen et al., 2007; Knies et al., 2007, 2009; Mattingsdal et al., 2014) which is consistent with the onset of a significant increase in global ice volume at ∼0.94 Ma (Mudelsee and Stattegger, 1997) associated with a distinct sea level drop of 20–30 m (Kitamura and Kawagoe, 2006). Consequently, changes in sea level could also be correlated to fluctuations in available accommodation space and therefore in sedimentation rates.
Phase 3:Saalian and Weichselian Glaciations (< ∼0.42 Ma)
The transition from phase 2 to phase 3 marks a major change in sedimentation rates along the continental margin, switching from a trend of generally declining sedimentation rates to rapidly increasing rates (Figure 8D). The timing of this transition is broadly consistent with the Mid-Brunhes Event, a major climate transition starting at around ∼0.4 Ma. This event was characterized by atmospheric CO2 concentrations exceeding 300 ppm (Tzedakis et al., 2009), and sea-level highstands, sometimes above present-day global mean sea level (e.g., Dutton et al., 2015), that marked the transition from cooler to warmer interglacials (Tzedakis et al., 2009; Cronin et al., 2017). This is also supported by paleontological data that indicate a period of inflow of warmer North Atlantic surface-water masses suggesting an episode with increased influence of the North Atlantic Current and West Spitsbergen Current at around ∼0.5 Ma (Smelror, 1999). Around this time increased sedimentation rates accompanied by an increase in glacigenic debris flow deposit frequency on the western Svalbard margin (Kongsfjorden TMF, Figure 6C) and the northwestern Barents Sea (Figure 6E) are recorded in our data along the Svalbard-Barents Sea margin. Given the exceptional high increase in sedimentation rates on the western Barents Sea margin at this time, we suggest a possible interplay between this climatic event and a glacial intensification across the entire Barents Sea, resulting in coalescence of the SBIS and Fennoscandian Ice Sheet (FIS) at around ∼0.42 Ma ago (Figure 9C). Such a configuration would greatly enlarge the catchment area of ice masses in the southwestern Barents Sea, and specifically the source area for sediments deposited on the Bear Island TMF.
The sedimentary package deposited over the last ∼0.4 Ma corresponds to the Early Saalian (between ∼0.4 and 0.2 Ma), Late Saalian (between ∼0.2 and 0.13 Ma), and Weichselian (< ∼0.123 Ma) glaciations. This high-resolution stratigraphic framework allows for the first time the differentiation of the sediments deposited on the slope during Early Saalian, Late Saalian and Weichselian periods, representing a valuable dataset, for example for testing models of glacial erosion (e.g., Patton et al., 2015, 2016). The Saalian glaciations are characterized by the highest sedimentation rates estimated from our data on both the northwestern and southwestern Barents Sea margins, suggesting extensive, dynamic glaciations across the Barents Sea shelf. The Weichselian glaciations show a gradual decrease in rates, implying a decrease in the erosion capacity of the SBIS in comparison to Saalian SBIS. This change is also recorded in the seismic configuration where the seismic reflection corresponding to ∼0.13 Ma truncates underlying reflections and represents the base of the upper aggradational seismic facies (Figure 6H). In general, the presence of aggradational seismic facies is closely linked to the availability of accommodation space, resulting either from differential tectonic movements, subsidence related to topset loading with glacier-derived sediments, or eustatic changes in sea level (e.g., Dahlgren et al., 2005; Dowdeswell et al., 2007; Hofmann et al., 2016). The changes in the seismic configuration patterns between the Saalian and the Weischelian glaciations infer changes either in glacial dynamics, or/and in grounding line positions, or/and in accommodation space. For example, after several successive glaciations, and as the shelf progradation increases, the travel distance for ice-advance will be successively longer to reach the shelf break, resulting potentially in increases dominance of vertical aggradation (Solheim et al., 1998). This is in accordance with the existing literature suggesting that the dynamics and extents of the Saalian and the Weichselian SBIS were very different (e.g., Solheim et al., 1998; Pope et al., 2016) and in line with Svendsen et al. (2004) reconstructions, suggesting much more extensive late Saalian glaciations over the Kara Sea than the subsequent Weichselian glaciations. Both during Saalian and Weischelian glaciations the northwestern Barents Sea margin is characterized by relatively higher sedimentation rates compared to the southwestern Barents Sea margin implying higher erosion capacity of the SBIS on the northwestern section of the Barents Sea during the Weichselian glaciations.
Conclusion
A continuous high-resolution seismostratigraphic framework that connects the entire western Svalbard-Barents Sea margin and covers the last ∼2.7 Ma is presented here. We utilize recent improvements in chronology to establish a set of reliable age fix-points from available boreholes along the margin, and with the use of a large dataset composed of both, conventional and recently acquired high-resolution 2D seismic data, we extend this consistent chronology from the Yermak Plateau (north of Svalbard) and offshore western Svalbard, southwards to the Bear Island TMF. We have identified, in line with the classic nomenclature, three main seismic units, GI-GIII, along this continental margin and dated 12 regionally correlated seismic reflections, including providing age estimates for the widely used R7-R1 seismic reflections. In this study we show one potential application of this framework by reconstructing the SBIS evolution over the last ∼2.7 Ma since the intensification of northern hemisphere glaciations. The high temporal resolution provided by the proposed seismostratigraphic framework, provides new insights into the nature of the onset of Barents Sea glaciations and allows us to separate the sedimentary record deposited during the Early Saalian, Late Saalian and Weichselian glaciations on the continental slope. We identify three phases of glacial development over the last ∼2.7 Ma based on seismic facies distribution and sedimentation rate fluctuations along the margin:
Phase 1. The framework reveals a clear two-step onset to glacial intensification in the region. The initial step, between ∼2.7 and 2.58 Ma shows glacial expansion across Svalbard; whilst the second step, between ∼1.95 and 1.78 Ma indicates glacial advances beyond Svalbard to the northwestern Barents Sea. Between the two steps, the first shelf-edge glaciation is recorded on the northwestern Svalbard margin with the Sjubrebanken TMF receiving sediments from an ice stream in form of glacigenic debris flows.
Phase 2. The onset of phase 2 marks a regional glacial intensification for the whole Barents Sea-Svalbard region, with southward glacial expansion across the wider Barents Sea and the onset of shelf-edge glaciations along the western Svalbard-Barents Sea margin taking place around ∼1.5 Ma ago. This initial increase, is followed by evidence for shelf-edge glaciation but decreased sedimentation rates (∼1.2 and 0.78 Ma) indicate that as the ice masses expanded, they had diminishing erosional capacity and/or there was a gradual reduction in the availability of readily erodible unlithified material. Around ∼0.78 Ma the sedimentation rates start to increase once again along the margin, which may reflect deepening of the Bear Island Trough and increasing topographic constraint on the ice streams.
Phase 3. Around ∼0.42 Ma, the southwestern Barents Sea margin is characterized by a dramatic increase in sedimentation rates reflecting glacial expansion and enlargement of the catchment area for the sediments deposited along the margin possible related to the Svalbard-Barents Sea Ice Sheet and Fennoscandian Ice Sheet coalescence. For the first time our new stratigraphic framework allows differentiation of the sediments deposited on the slope during the Early Saalian, Late Saalian, and Weichselian periods. The Saalian glaciations are characterized by the highest sedimentation rates estimated from our dataset, suggesting extensive, dynamic glaciations across the Barents Sea. The Weichselian glaciations show a gradual decrease in rates, with the northwestern Barents Sea margin still characterized by relatively higher rates compared to the rest of the margin indicating higher erosion capacity of the SBIS in the northern Barents Sea during that period.
Data Availability Statement
The original contributions presented in the study are included in the article/Supplementary Material, further inquiries can be directed to the corresponding author/s.
Author Contributions
NA, KA, and MW developed the study. NA interpreted the seismic dataset and wrote the original manuscript. P-AD provided the age fix-points for the MeBo 126 core and JK the age fix-point for the GS14-190 core. NB provided the description of the logs and facies of the GS14-190 core. NA, KA, AP-F, and RM compiled the 2D seismic dataset. All authors contributed to editing of the text and figures and advised on its scope.
Funding
This work was supported by the Research Council of Norway (RCN) through its Centres of Excellence funding scheme, project no. 223259. P-AD contribution was supported by the IS blue program ANR-17-EURE-0015.
Conflict of Interest
The authors declare that the research was conducted in the absence of any commercial or financial relationships that could be construed as a potential conflict of interest.
Acknowledgments
We thank Sunil Vadakkepuliyambatta for his help with estimation of sedimentation rates, Stefan Bünz for updating the 2D seismic dataset, Jan Sverre Laberg for constructive discussions about the Svalbard-Barents Sea glacial history, and Rolf Mjelde for providing permission to publish the seismic line SVALEX2001_P11_A. We are grateful to the two reviewers BR and GV, and the editor IM for their helpful comments which improved this paper. We also appreciate the assistance provided by the Chief editor David Mark Hodgson. Norwegian Petroleum Directorate is acknowledged for providing 2D seismic data through the Diskos National Data Repository (NDR). The seismic data are available for academic purposes through NDR (http://www.diskos.no/). We thank National Institute of Oceanography and Applied Geophysics (OGS) for providing seismic data from the EGLACOM (Evolution of a GLacial Arctic COntinental Margin, July–August 2008) project. The EGLACOM seismic data are available on “Istituto Nazionale di Oceanografia e di Geofisica Sperimentale—SNAP data management system–http://snap.ogs.trieste.it.” doi: 10.6092/SNAP.ea3ea207-a9ac-f9f5-cafb-2cb29deb0eaa. Information about the availability of the 2D seismic profiles acquired by CAGE-UiT are available by contacting the corresponding author. We thank TGS-NOPEC geophysical company and Russian Joint Stock Company “Russian Marine Arctic Geological Expedition” (MAGE) for providing some of the 2D seismic data. Schlumberger is acknowledged for the Petrel software under an educational license agreement to Department of Geosciences, UiT-The Arctic University of Norway.
Supplementary Material
The Supplementary Material for this article can be found online at: https://www.frontiersin.org/articles/10.3389/feart.2021.656732/full#supplementary-material
References
Amundsen, I. M. H., Blinova, M., Hjelstuen, B. O., Mjelde, R., and Haflidason, H. (2011). The Cenozoic western Svalbard margin: sediment geometry and sedimentary processes in an area of ultraslow oceanic spreading. Mar. Geophys. Res. 32, 441–453. doi: 10.1007/s11001-011-9127-z
Andreassen, K. (2017). Cruise report CAGE 17-5. Marine geophysical cruise to the Yermak Plateau and western Svalbard continental margin. Norway: CAGE, 28.
Andreassen, K., Nilssen, L. C., Rafaelsen, L., and Kuilman, L. (2004). Three-dimensional seismic data from the Barents Sea margin reveal evidence of past ice streams and their dynamics. Geology 32, 729–732. doi: 10.1130/g20497.1
Andreassen, K., Odegaard, C. M., and Rafaelsen, B. (2007). “Imprints of former ice streams, imaged and interpreted using industry three-dimensional seismic data from the south-western Barents Sea,” in Seismic Geomorphology: Applications to Hydrocarbon Exploration and Production, eds R. J. Davies, H. W. Posamentier, L. J. Wood, and J. A. Cartwright (London: Geological Society), 151–169.
Andreassen, K., and Winsborrow, M. (2009). Signature of ice streaming in Bjornoyrenna, Polar North Atlantic, through the Pleistocene and implications for ice-stream dynamics. Annal. Glaciol. 50, 17–26.
Balco, G., and Rovey, C. W. II (2010). Absolute chronology for major Pleistocene advances of the Laurentide Ice Sheet. Geology 38, 795–798. doi: 10.1130/g30946.1
Barendregt, R. W., and Irving, E. (1998). Changes in the extent of North American ice sheets during the late Cenozoic. Can. J. Earth Sci. 35, 504–509. doi: 10.1139/e97-126
Bohrmann, G., Ahrlich, F., Bergenthal, M., Bünz, S., Düßmann, R., Ferreira, C., et al. (2017). R/V MARIA S. MERIAN Cruise Report MSM57, Gas Hydrate Dynamics at the Continental Margin of Svalbard, Reykjavik – Longyearbyen – Reykjavik, 29 July – 07 September 2016. Universität Bremen: Berichte, MARUM – Zentrum für Marine Umweltwissenschaften, Fachbereich Geowissenschaften, 314.
Butt, F. A., Drange, H., Elverhøi, A., Otterå, O. H., and Solheim, A. (2002). Modelling Late Cenozoic isostatic elevation changes in the Barents Sea and their implications for oceanic and climatic regimes: preliminary results. Quaternary Sci. Rev. 21, 1643–1660. doi: 10.1016/S0277-3791(02)00018-5
Butt, F. A., Elverhoi, A., Solheim, A., and Forsberg, C. F. (2000). Deciphering late Cenozoic development of the western Svalbard margin from ODP site 986 results. Mar. Geol. 169, 373–390. doi: 10.1016/s0025-3227(00)00088-8
Camerlenghi, A. (2018). “Drivers of Seafloor Geomorphic Change,” in Submarine Geomorphology, eds A. Micallef, S. Krastel, and A. Savini (Cham: Springer International Publishing), 135–159.
Channell, J. E. T., Smelror, M., Jansen, E., Higgins, S. M., Lehman, B., Eidvin, T., et al. (1999). Age models for glacial fan deposits off East Greenland and Svalbard (ODP Site 986 and Site 987). Proc. ODP Sci. Results 162, 149–166.
Clark, P. U., and Pollard, D. (1998). Origin of the Middle Pleistocene Transition by ice sheet erosion of regolith. Paleoceanography 13, 1–9. doi: 10.1029/97pa02660
Cronin, T. M., Dwyer, G. S., Caverly, E. K., Farmer, J., Deninno, L. H., Rodriguez-Lazaro, J., et al. (2017). Enhanced Arctic Amplification Began at the Mid-Brunhes Event ~400,000 years ago. Sci. Rep. 7:14475. doi: 10.1038/s41598-017-13821-2
Cronin, T. M., and Whatley, R. (1996). Ostracoda from Sites 910 and 911. Proc. ODP, Sci. 151, 197–201. doi: 10.2973/odp.proc.sr.151.156.1996
Dahlgren, K. I. T., Vorren, T. O., Stoker, M. S., Nielsen, T., Nygard, A., and Sejrup, H. P. (2005). Late Cenozoic prograding wedges on the NW European continental margin: their formation and relationship to tectonics and climate. Mar. Petrol. Geol. 22, 1089–1110. doi: 10.1016/j.marpetgeo.2004.12.008
Dessandier, P.-A., Knies, J., Plaza-Faverola, A., Labrousse, C., Renoult, M., Panieri, G., et al. (2021). Ice-sheet melt drove methane emissions in the Arctic during the last two interglacials. Geology 49. doi: 10.1130/g48580.1 [Epub ahead of print].
Dimakis, P., Braathen, B. I, Faleide, J. I, Elverhoi, A., and Gudlaugsson, S. T. (1998). Cenozoic erosion and the preglacial uplift of the Svalbard-Barents Sea region. Tectonophysics 300, 311–327. doi: 10.1016/s0040-1951(98)00245-5
Dowdeswell, J. A., Ó Cofaigh, C., Noormets, R., Larter, R. D., Hillenbrand, C. D., Benetti, S., et al. (2008). A major trough-mouth fan on the continental margin of the Bellingshausen Sea, West Antarctica: The Belgica Fan. Mar. Geol. 252, 129–140. doi: 10.1016/j.margeo.2008.03.017
Dowdeswell, J. A., Ottesen, D., Rise, L., and Craig, J. (2007). Identification and preservation of landforms diagnostic of past ice-sheet activity on continental shelves from three-dimensional seismic evidence. Geology 35, 359–362. doi: 10.1130/g23200a.1
Dutton, A., Carlson, A. E., Long, A. J., Milne, G. A., Clark, P. U., Deconto, R., et al. (2015). Sea-level rise due to polar ice-sheet mass loss during past warm periods. Science 349:aaa4019. doi: 10.1126/science.aaa4019
Eidvin, E., and Nagy, J. (1999). “Foraminiferal biostratigraphy of Pliocene deposits at Site 986, Svalbard margin,” in Proceedings of the Ocean Drilling Program, Scientific Results, Vol. 162, eds M. Raymo, E. Jansen, P. Blum, and T. D. Herbert (College Station, TX: Ocean Drilling Program), 3–17.
Eidvin, T., Jansen, E., and Riis, F. (1993). Chronology of Tertiary fan deposits off the western Barents Sea - Implications for the uplife and erosion history of the Barents Shelf. Mar. Geol. 112, 109–131. doi: 10.1016/0025-3227(93)90164-q
Eiken, O., and Hinz, K. (1993). Contourites in the Fram Strait. Sedimen. Geol. 82, 15–32. doi: 10.1016/0037-0738(93)90110-Q
Elverhoi, A., Svendsen, J. I, Solheim, A., Andersen, E. S., Milliman, J., Mangerud, J., et al. (1995). Late Quaternary Sediment Yield from the high Arctic Svalbard area. J. Geol. 103, 1–17.
Faleide, J. I., Solheim, A., Fiedler, A., Hjelstuen, B. O., Andersen, E. S., Vanneste, K., et al. (1996). Late Cenozoic evolution of the western Barents Sea-Svalbard continental margin. Global Planet. Change 12, 53–74. doi: 10.1016/0921-8181(95)00012-7
Faleide, J. I, Tsikalas, F., Breivik, A. J., Mjelde, R., Ritzmann, O., Engen, O., et al. (2008). Structure and evolution of the continental margin off Norway and Barents Sea. Episodes 31, 82–91.
Fiedler, A., and Faleide, J. I. (1996). Cenozoic sedimentation along the southwestern Barents Sea margin in relation to uplift and erosion of the shelf. Global Planet. Change 12, 75–93. doi: 10.1016/0921-8181(95)00013-5
Flesche Kleiven, H., Jansen, E., Fronval, T., and Smith, T. M. (2002). Intensification of Northern Hemisphere glaciations in the circum Atlantic region (3.5–2.4 Ma) – ice-rafted detritus evidence. Palaeogeogr. Palaeoclimatol. Palaeoecol. 184, 213–223. doi: 10.1016/S0031-0182(01)00407-2
Forsberg, C. F., Solheim, A., Elverhoi, A., Jansen, E., Channell, J. E. T., Andersen, E. S., et al. (1999). The depositional environment of the western Svalbard margin during the late Pliocene and the Pleistocene: Sedimentary facies changes at Site 986. Proc. Ocean Drilling Prog. Sci. Results 162, 233–246.
Fronval, T., and Jansen, E. (1996). “Late Neogene paleoclimates and paleoceanography in the Iceland-Norwegian Sea: evidence from the Iceland and Vøring Plateaus,” in Proceeding Ocean Drilling Program. Scientific Results, Vol. 151, eds J. Thiede, A. M. Myhre, J. V. Firth, G. L. Johnson, and W. F. Ruddiman (College Station, TX: Ocean Drilling Program), 455–468.
Funder, S., Bennike, O., Bocher, J., Israelson, C., Strand, K., Símonarson, L., et al. (2001). Late Pliocene Greenland -The Kap K0benhavn Formation in North Greenland. Bull. Geol. Soc. 48, 117–134.
Geissler, W. H., and Jokat, W. (2004). A geophysical study of the northern Svalbard continental margin. Geophys. J. Int. 158, 50–66. doi: 10.1111/j.1365-246X.2004.02315.x
Grøsfjeld, K., De Schepper, S., Fabian, K., Husum, K., Baranwal, S., Andreassen, K., et al. (2014). Dating and palaeoenvironmental reconstruction of the sediments around the Miocene/Pliocene boundary in Yermak Plateau ODP Hole 911A using marine palynology. Palaeogeogr. Palaeoclimatol. Palaeoecol. 414, 382–402. doi: 10.1016/j.palaeo.2014.08.028
Henriksen, E., Bjørnseth, H. M., Hals, T. K., Heide, T., Kiryukhina, T., Kløvjan, O. S., et al. (2011). Chapter 17 Uplift and erosion of the greater Barents Sea: impact on prospectivity and petroleum systems. Geol. Soc. London Mem. 35, 271–281. doi: 10.1144/m35.17
Hjelstuen, B. O., Eldholm, O., and Faleide, J. I. (2007). Recurrent Pleistocene mega-failures on the SW Barents Sea margin. Earth Planet. Sci. Lett. 258, 605–618. doi: 10.1016/j.epsl.2007.04.025
Hjelstuen, B. O., Elverhoi, A., and Faleide, J. I. (1996). Cenozoic erosion and sediment yield in the drainage area of the Storfjorden Fan. Global Planet. Change 12, 95–117. doi: 10.1016/0921-8181(95)00014-3
Hjelstuen, B. O., and Sejrup, H. P. (2020). Latitudinal variability in the Quaternary development of the Eurasian ice sheets—Evidence from the marine domain. Geology 49, 346–351. doi: 10.1130/g48106.1
Hofmann, J. C., Knutz, P. C., Nielsen, T., and Kuijpers, A. (2016). Seismic architecture and evolution of the Disko Bay trough-mouth fan, central West Greenland margin. Quaternary Sci. Rev. 147, 69–90. doi: 10.1016/j.quascirev.2016.05.019
Hull, D. M., Osterman, L. E., and Thiede, J. (1996). Biostratigraphic synthesis of Leg 151, North Atlantic-Arctic Gateways. Proc. ODP, Sci. Results 151, 627–644. doi: 10.2973/odp.proc.sr.151.146.1996
Jakobsson, M., Mayer, L., Coakley, B., Dowdeswell, J. A., Forbes, S., Fridman, B., et al. (2012). The International Bathymetric Chart of the Arctic Ocean (IBCAO) Version 3.0. Geophys. Res. Lett. 39:L12609. doi: 10.1029/2012gl052219
Jansen, E., Fronval, T., Rack, F., and Channell, J. E. T. (2000). Pliocene-Pleistocene ice rafting history and cyclicity in the Nordic Seas during the last 3.5 Myr. Paleoceanography 15, 709–721. doi: 10.1029/1999pa000435
Jansen, E., Raymo, M. E., and Blum, P. (1996). “The leg 162 Shipboard Scientific Party, 1996,” in Proceedings of the Ocean Drilling Program, Vol. 162, College Station, TX, 1182.
Jervey, M. T. (1988). “Quantitative Geological Modeling of Siliciclastic Rock Sequences and Their Seismic Expression,” in Sea-Level Changes: An Integrated Approach, eds C. K. Wilgus, B. S. Hastings, H. Posamentier, J. V. Wagoner, C. A. Ross, and C. G. S. C. Kendall (Tulsa, USA: Society of Economic Paleontologists and Mineralogists).
Kitamura, A., and Kawagoe, T. (2006). Eustatic sea-level change at the Mid-Pleistocene climate transition: new evidence from the shallow-marine sediment record of Japan. Quaternary Sci. Rev. 25, 323–335. doi: 10.1016/j.quascirev.2005.02.009
Knies, J., Köseoğlu, D., Rise, L., Baeten, N., Bellec, V. K., Bøe, R., et al. (2018). Nordic Seas polynyas and their role in preconditioning marine productivity during the Last Glacial Maximum. Nat. Commun. 9:3959. doi: 10.1038/s41467-018-06252-8
Knies, J., Matthiessen, J., Mackensen, A., Stein, R., Vogt, C., Frederichs, T., et al. (2007). Effects of Arctic freshwater forcing on thermohaline circulation during the Pleistocene. Geology 35, 1075–1078. doi: 10.1130/G23966A.1
Knies, J., Matthiessen, J., Vogt, C., Laberg, J. S., Hjelstuen, B. O., Smelror, M., et al. (2009). The Plio-Pleistocene glaciation of the Barents Sea-Svalbard region: a new model based on revised chronostratigraphy. Quaternary Sci. Rev. 28, 812–829. doi: 10.1016/j.quascirev.2008.12.002
Laberg, J. S., Andreassen, K., Knies, J., Vorren, T. O., and Winsborrow, M. (2010). Late Pliocene-Pleistocene development of the Barents Sea Ice Sheet. Geology 38, 107–110. doi: 10.1130/g30193.1
Laberg, J. S., Andreassen, K., and Vorren, T. O. (2012). Late Cenozoic erosion of the high-latitude southwestern Barents Sea shelf revisited. Geol. Soc. Am. Bull. 124, 77–88. doi: 10.1130/b30340.1
Laberg, J. S., Rydningen, T. A., Forwick, M., and Husum, K. (2018). Depositional processes on the distal Scoresby Trough Mouth Fan (ODP Site 987): Implications for the Pleistocene evolution of the Scoresby Sund Sector of the Greenland Ice Sheet. Mar. Geol. 402, 51–59. doi: 10.1016/j.margeo.2017.11.018
Laberg, J. S., and Vorren, T. O. (1996a). The glacier-fed fan at the mouth of Storfjorden trough, western Barents Sea: a comparative study. Geologische Rundschau 85, 338–349. doi: 10.1007/bf02422239
Laberg, J. S., and Vorren, T. O. (1996b). The Middle and Late Pleistocene evolution of the Bear Island Trough Mouth Fan. Global Planetary Change 12, 309–330. doi: 10.1016/0921-8181(95)00026-7
Lasabuda, A., Laberg, J. S., Knutsen, S.-M., and Høgseth, G. (2018). Early to middle cenozoic paleoenvironment and erosion estimates of the southwestern Barents Sea: Insights from a regional mass-balance approach. Mar. Petrol. Geol. 96, 501–521. doi: 10.1016/j.marpetgeo.2018.05.039
Matthiessen, J., and Brenner, W. (1996). Dinoflagellate cyst ecostratigraphy of Pliocene–Pleistocene sediments from the Yermak Plateau (Arctic Ocean, Hole 911A). Proc. ODP, Sci. Results 151, 243–253. doi: 10.2973/odp.proc.sr.151.109.1996
Mattingsdal, R., Knies, J., Andreassen, K., Fabian, K., Husum, K., Grosfjeld, K., et al. (2014). A new 6 Myr stratigraphic framework for the Atlantic-Arctic Gateway. Quaternary Sci. Rev. 92, 170–178. doi: 10.1016/j.quascirev.2013.08.022
Montelli, A., Dowdeswell, J. A., Ottesen, D., and Johansen, S. E. (2017). Ice-sheet dynamics through the Quaternary on the mid-Norwegian continental margin inferred from 3D seismic data. Mar. Petrol. Geol. 80, 228–242. doi: 10.1016/j.marpetgeo.2016.12.002
Montelli, A., Dowdeswell, J. A., Ottesen, D., and Johansen, S. E. (2018). Architecture and sedimentary processes on the mid-Norwegian continental slope: A 2.7 Myr record from extensive seismic evidence. Quaternary Sci. Rev. 192, 185–207. doi: 10.1016/j.quascirev.2018.05.034
Mørk, M. B. E., and Duncan, R. A. (1993). Late Pliocene basaltic volcanism on the western Barents Shelf margin: implications from petrology and 40Ar-39Ar dating of volcaniclastic debris from a shallow drill core. Norsk Geologisk Tidsskrift 73, 209–225.
Mudelsee, M., and Stattegger, K. (1997). Exploring the structure of the mid-Pleistocene revolution with advanced methods of time-series analysis. Geologische Rundschau 86, 499–511. doi: 10.1007/s005310050157
Myhre, A., Thiede, J., and Firth, J. A. (1995). Proceedings of the Ocean Drilling Program. Initial Reports, Leg 151, College Station, TX: Ocean Drilling Program, 951.
Newton, A. M. W., and Huuse, M. (2017). Late Cenozoic environmental changes along the Norwegian margin. Mar. Geol. 393, 216–244. doi: 10.1016/j.margeo.2017.05.004
Newton, A. M. W., Huuse, M., Knutz, P. C., and Cox, D. R. (2020). Repeated ice streaming on the northwest Greenland continental shelf since the onset of the Middle Pleistocene Transition. Cryosphere 14, 2303–2312. doi: 10.5194/tc-14-2303-2020
Ó Cofaigh, C., Hogan, K. A., Jennings, A. E., Louise Callard, S., Dowdeswell, J. A., Noormets, R., et al. (2018). The role of meltwater in high-latitude trough-mouth fan development: The Disko Trough-Mouth Fan, West Greenland. Marine Geology 402, 17–32. doi: 10.1016/j.margeo.2018.02.001
Ó Cofaigh, C., Taylor, J., Dowdeswell, J. A., and Pudsey, C. J. (2003). Palaeo-ice streams, trough mouth fans and high-latitude continental slope sedimentation. Boreas 32, 37–55. doi: 10.1080/03009480310001858
Osterman, L. E. (1996). Pliocene and Quaternary benthic foraminifers from Site 910, Yermak Plateau. Proc. ODP Sci. Results 151, 187–195. doi: 10.2973/odp.proc.sr.151.107.1996
Ottesen, D., Dowdeswell, J. A., and Bugge, T. (2016). Deeply buried glacigenic debris-flows imaged in 3D seismic data from early Quaternary sediments of the northern North sea. Geol. Soc. London Mem. 46, 369–370. doi: 10.1144/m46.131
Ottesen, D., Stokes, C. R., Rise, L., and Olsen, L. (2008). Ice-sheet dynamics and ice streaming along the coastal parts of northern Norway. Quaternary Sci. Rev. 27, 922–940. doi: 10.1016/j.quascirev.2008.01.014
Patton, H., Andreassen, K., Bjarnadottir, L. R., Dowdeswell, J. A., Winsborrow, M. C. M., Noormets, R., et al. (2015). Geophysical constraints on the dynamics and retreat of the Barents Sea ice sheet as a paleobenchmark for models of marine ice sheet deglaciation. Rev. Geophys. 53, 1051–1098.
Patton, H., Hubbard, A., Andreassen, K., Winsborrow, M., and Stroeven, A. P. (2016). The build-up, configuration, and dynamical sensitivity of the Eurasian ice-sheet complex to late Weichselian climatic and oceanic forcing. Quaternary Sci. Rev. 153, 97–121. doi: 10.1016/j.quascirev.2016.10.009
Pérez, L. F., Nielsen, T., Knutz, P. C., Kuijpers, A., and Damm, V. (2018). Large-scale evolution of the central-east Greenland margin: New insights to the North Atlantic glaciation history. Global Planet. Change 163, 141–157. doi: 10.1016/j.gloplacha.2017.12.010
Plaza-Faverola, A., Vadakkepuliyambatta, S., Hong, W. L., Mienert, J., Bunz, S., Chand, S., et al. (2017). Bottom-simulating reflector dynamics at Arctic thermogenic gas provinces: An example from Vestnesa Ridge, offshore west Svalbard. J. Geophys. Res. Solid Earth 122, 4089–4105. doi: 10.1002/2016jb013761
Pope, E. L., Talling, P. J., Hunt, J. E., Dowdeswell, J. A., Allin, J. R., Cartigny, M. J. B., et al. (2016). Long-term record of Barents Sea Ice Sheet advance to the shelf edge from a 140,000 year record. Quaternary Sci. Rev. 150, 55–66. doi: 10.1016/j.quascirev.2016.08.014
Pope, E. L., Talling, P. J., and Ó Cofaigh, C. (2018). The relationship between ice sheets and submarine mass movements in the Nordic Seas during the Quaternary. Earth-Sci. Rev. 178, 208–256. doi: 10.1016/j.earscirev.2018.01.007
Rea, B. R., Newton, A. M. W., Lamb, R. M., Harding, R., Bigg, G. R., Rose, P., et al. (2018). Extensive marine-terminating ice sheets in Europe from 2.5 million years ago. Sci. Adv. 4:eaar8327. doi: 10.1126/sciadv.aar8327
Rebesco, M., Laberg, J. S., Pedrosa, M. T., Camerlenghi, A., Lucchi, R. G., Zgur, F., et al. (2014). Onset and growth of Trough-Mouth Fans on the North-Western Barents Sea margin – implications for the evolution of the Barents Sea/Svalbard Ice Sheet. Quaternary Sci. Rev. 92, 227–234. doi: 10.1016/j.quascirev.2013.08.015
Rydningen, T. A., Høgseth, G. V., Lasabuda, A. P. E., Laberg, J. S., Safronova, P. A., Forwick, M., et al. (2020). An Early Neogene—Early Quaternary Contourite Drift System on the SW Barents Sea Continental Margin, Norwegian Arctic. Geochem. Geophys. Geosys. 21:e2020GC009142. doi: 10.1029/2020GC009142
Ryseth, A., Augustson, J. H., Charnock, M., Haugerud, O., Knutsen, S. M., Midboe, P. S., et al. (2003). Cenozoic stratigraphy and evolution of the Sorvestsnaget Basin, southwestern Barents Sea. Norwegian J. Geol. 83, 107–130.
Sættem, J., Bugge, T., Fanavoll, S., Goll, R. M., Mørk, A., Mørk, M. B. E., et al. (1994). Cenozoic margin development and erosion of the Barents Sea: Core evidence from southwest of Bjørnøya. Mar. Geol. 118, 257–281.
Sættem, J., Poole, D. A. R., Ellingsen, L., and Sejrup, H. P. (1992). Glacial geology of outer Bjørnøyrenna, southwestern Barents Sea. Mar. Geol. 103, 15–51. doi: 10.1016/0025-3227(92)90007-5
Safronova, P. A., Laberg, J. S., Andreassen, K., Shlykova, V., Vorren, T. O., Chernikov, S., et al. (2017). Late Pliocene-early Pleistocene deep-sea basin sedimentation at high-latitudes: mega-scale submarine slides of the north-western Barents Sea margin prior to the shelf-edge glaciations. Basin Res. 29, 537–555. doi: 10.1111/bre.12161
Sarkar, S., Berndt, C., Chabert, A., Masson, D. G., Minshull, T. A., and Westbrook, G. K. (2011). Switching of a paleo-ice stream in northwest Svalbard. Quaternary Sci. Rev. 30, 1710–1725. doi: 10.1016/j.quascirev.2011.03.013
Sato, T., and Kameo, K. (1996). “Pliocene to Quaternary calcareous nannofossil biostratigraphy of the Arctic Ocean, with reference to late Pliocene glaciation,” in Proceeding Ocean Drilling Program. Scientific Results, Vol. 151, eds J. Thiede, A. M. Myhre, J. V. Firth, G.L. Johnson, and W. F. Ruddiman (College Station, TX: Ocean Drilling Program), 39–59.
Sigmond, E. M. D. (1992). Bedrock Map of Norway and Adjacent Ocean Areas, scale 1:3,000,000. Trondheim: Geological Survey of Norway.
Smelror, M. (1999). Pliocene-Pleistocene and redeposited dinoflagellate cysts from the western Svalbard Margin (Site 986): Biostratigraphy, paleoenvironments, and sediment provenance. Proc. Ocean Drilling Prog. Sci. Res. 162, 83–97. doi: 10.2973/odp.proc.sr.162.011.1999
Solheim, A., Andersen, E. S., Elverhoi, A., and Fiedler, A. (1996). Late Cenozoic depositional history of the western Svalbard continental shelf, controlled by subsidence and climate. Global Planet. Change 12, 135–148. doi: 10.1016/0921-8181(95)00016-x
Solheim, A., Faleide, J. I., Andersen, E. S., Elverhøi, A., Forsberg, C. F., Vanneste, K., et al. (1998). Late Cenozoic seismic stratigraphy and glacial geological development of the East Greenland and Svalbard–Barents Sea continental margins. Quaternary Sci. Rev. 17, 155–184. doi: 10.1016/S0277-3791(97)00068-1
Solheim, A., and Kristoffersen, Y. (1984). The physical environment, Western Barents Sea, 1:1500000, sheet B; Sediments above the upper regional unconformity: Thickness, seismic stratigraphy and outline of the glacial history. Norsk Polarinstitutt Skrifter 179:26.
Spiegler, D. (1996). “Planktonic foraminifer Cenozoic biostratigraphy of the Arctic Ocean, Fram Strait (Sites 908–909), Yermak Plateau (Sites 910–912), and East Greenland Margin (Site 913),” in Proceeding Ocean Drilling Program. Scientific Results, Vol. 151, eds J. Thiede, A. M. Myhre, J. V. Firth, G. L. Johnson, and W. F. Ruddiman (College Station, TX: Ocean Drilling Program), 153–167. doi: 10.2973/odp.proc.sr.151.104.1996
Svendsen, J. I., Alexanderson, H., Astakhov, V. I., Demidov, I., Dowdeswell, J. A., Funder, S., et al. (2004). Late quaternary ice sheet history of northern Eurasia. Quaternary Sci. Rev. 23, 1229–1271. doi: 10.1016/j.quascirev.2003.12.008
Taylor, J., Dowdeswell, J. A., Kenyon, N. H., and O Cofaigh, C. (2002). “Late Quaternary architecture of trough-mouth fans: debris flows and suspended sediments on the Norwegian margin,” in Glacier-Influenced Sedimentation on High-Latitude Continental Margins, eds J. A. Dowdeswell and C. O. Cofaigh (Bath, UK: Geological Soc Publishing House), 55–71.
Tzedakis, P. C., Raynaud, D., Mcmanus, J. F., Berger, A., Brovkin, V., and Kiefer, T. (2009). Interglacial diversity. Nat. Geosci. 2, 751–755. doi: 10.1038/ngeo660
Vagnes, E., Faleide, J. I, and Gudlaugsson, S. T. (1992). Glacial erosion and tectonic uplift in the Barents Sea. Norsk Geologisk Tidsskrift 72, 333–338.
Vorren, T. O., Kristoffersen, Y., and Andreassen, K. (1986). Geology of the inner shelf west of North Cape, Norway. Norsk Geologisk Tidsskrift 66, 99–105.
Vorren, T. O., and Laberg, J. S. (1997). Trough mouth fans - Palaeoclimate and ice-sheet monitors. Quaternary Sci. Rev. 16, 865–881. doi: 10.1016/s0277-3791(97)00003-6
Vorren, T. O., Richardsen, G., Knutsen, S. M., and Henriksen, E. (1991). Cenozoic erosion and sedimentation in the western Barents Sea. Mar. Petrol. Geol. 8, 317–340. doi: 10.1016/0264-8172(91)90086-g
Keywords: chronostratigraphy, quaternary, glacial intensification, palaeo-ice streams, Trough-Mouth Fan, sedimentation rates, Saalian, Weichselian
Citation: Alexandropoulou N, Winsborrow M, Andreassen K, Plaza-Faverola A, Dessandier P-A, Mattingsdal R, Baeten N and Knies J (2021) A Continuous Seismostratigraphic Framework for the Western Svalbard-Barents Sea Margin Over the Last 2.7 Ma: Implications for the Late Cenozoic Glacial History of the Svalbard-Barents Sea Ice Sheet. Front. Earth Sci. 9:656732. doi: 10.3389/feart.2021.656732
Received: 21 January 2021; Accepted: 16 April 2021;
Published: 14 May 2021.
Edited by:
Ivar Midtkandal, University of Oslo, NorwayReviewed by:
Brian W. Romans, Virginia Tech, United StatesGiacomo Dalla Valle, National Research Council, Consiglio Nazionale delle Ricerche (CNR), Italy
Copyright © 2021 Alexandropoulou, Winsborrow, Andreassen, Plaza-Faverola, Dessandier, Mattingsdal, Baeten and Knies. This is an open-access article distributed under the terms of the Creative Commons Attribution License (CC BY). The use, distribution or reproduction in other forums is permitted, provided the original author(s) and the copyright owner(s) are credited and that the original publication in this journal is cited, in accordance with accepted academic practice. No use, distribution or reproduction is permitted which does not comply with these terms.
*Correspondence: Nikolitsa Alexandropoulou, bmlrb2xpdHNhLmFsZXhhbmRyb3BvdWxvdUB1aXQubm8=