 Femke H. Reidsma1*†
 Irini Sifogeorgaki1†
 Ada Dinckal2Hans Huisman3,4
 Mark J. Sier5,6
 Bertil van Os3
 Gerrit L. Dusseldorp1,7
- 1Human Origins, Faculty of Archaeology, Leiden University, Leiden, Netherlands
- 2Institute for Archaeological Sciences, Senckenberg Centre for Human Evolution and Paleoenvironment, Eberhard Karls University Tübingen, Tübingen, Germany
- 3Section Archaeology, Cultural Heritage Agency of the Netherlands, Amersfoort, Netherlands
- 4Groningen Institute for Archaeology, University of Groningen, Groningen, Netherlands
- 5CENIEH, Burgos, Spain
- 6Department of Earth Sciences, University of Oxford, Oxford, United Kingdom
- 7Palaeo-Research Institute, University of Johannesburg, Johannesburg, South Africa
Umhlatuzana rockshelter is an archaeological site with an occupational record covering the Middle Stone Age, Later Stone Age, and Iron Age. The presence of both Middle and Later Stone Age assemblages makes Umhlatuzana the ideal location for the study of the MSA–LSA transition (20–40 ka) in southern Africa. This transitional period is characterized by important modifications in stone tool technology, from prepared core technology to a toolkit based on microlith production. These changes are argued to have occurred in response to changes in climate and environment leading up to the Last Glacial Maximum. The deposits bearing the transitional assemblages at Umhlatuzana rockshelter appear homogeneous with no visible stratigraphic boundaries. This study integrates geoarchaeological techniques in order to explore fine-resolution geochemical differentiations of the sediments that are macroscopically invisible, and that will provide insight into (post-)depositional processes over time. Samples were systematically retrieved from the western profile of the site following a grid-based sampling strategy and analyzed for pH, elemental composition (XRF), and Magnetic Susceptibility. Additionally, the results were integrated with preliminary micromorphological observations. Our study reveals a steady, gradual change in the geochemistry of the deposits throughout the Pleistocene, related to a combination of environmental change and occupation intensity. We suggest that the part of the sequence reported to bear Middle to Later Stone Age transitional industries is characterized by wetter environmental conditions compared to the underlying deposits. Additionally, we support results from previous studies that excluded large scale post-depositional movement of the sedimentary sequence. Our study offers a successful multi-proxy approach to systematically sample and study archaeological deposits at the macro and micro scale, integrating a variety of geoarchaeological techniques. The approach provides insight into the depositional and post-depositional history of the site, and allows for questions of stratigraphic integrity, anthropogenic input, preservation, and environmental change to be addressed.
Introduction
The transition from the Middle Stone Age (MSA) to the Later Stone Age (LSA) (∼40–20 ka) forms an important period within the behavioral evolution of early humans in South Africa (Villa et al., 2012). While instances of sophisticated, modern behavior are already documented for the MSA (e.g., engravings and jewelry) (see e.g., Henshilwood, 2012; Porraz et al., 2013), it is not until the LSA that modern human behavior is consistently present within the archaeological record (Deacon, 1999; Villa et al., 2012; Bader et al., 2020; Grove and Blinkhorn, 2020). During the transition from the MSA to the LSA the toolkit changes from one based on prepared core technology to one characterized by microlith production, signaling a marked change in the way stone tools were produced and used (Lombard et al., 2012; Villa et al., 2012). These changes appear against a backdrop of environmental change, during the time leading up to the Last Glacial Maximum (∼29.5–19 ka) (Clark et al., 2009; Yokoyama et al., 2018). This period is characterized by a cold climate and frequent severe changes in temperature and humidity, which would have had consequences for resource availability and provided challenges for human groups to adapt to (Simon et al., 2015). It is often assumed that these drastic changes in climate were the driving force behind the MSA–LSA transition (Mitchell, 1988; McCall and Thomas, 2009). Unfortunately, only very few sites with transitional deposits are available (e.g., Border Cave, Rose Cottage Cave, Sehonghong). Moreover, age estimates of these transitional assemblages differ widely between sites (d’Errico et al., 2012; Loftus et al., 2019; Pargeter et al., 2017). In order to resolve questions about the timing and nature of the MSA–LSA transition, more high-resolution data on its archaeological, chronological, environmental, and stratigraphic context is needed.
Umhlatuzana rockshelter, located in KwaZulu-Natal, South Africa (Figure 1), is a good case-study site to address questions related to the MSA–LSA transition. The site preserves an archaeological archive spanning the last 70,000 years (Kaplan, 1990; Lombard et al., 2010; Sifogeorgaki et al., 2020), covering the later part of the MSA as well as the LSA (and some more recent, Iron Age deposits deposits). This makes Umhlatuzana one of the rare sites that has a continuous occupation sequence covering the MSA–LSA transition, making it paramount to understanding the nature of the transition in the region (see overviews in Lombard et al., 2012; Mackay et al., 2014). The site was originally the subject of a rescue excavation in the 1980s (Kaplan, 1990). Subsequent analysis of the materials from this excavation yielded early evidence for the use of complex adhesives (Lombard, 2007), bow-and-arrow (Lombard, 2011), and pressure-flaking (Högberg and Lombard, 2016a). Further, OSL samples were taken at the site to date the lowermost deposits with MSA archaeology (Lombard et al., 2010). In 2018 a new field campaign was launched by a team from Leiden University (in collaboration with the KwaZulu-Natal Museum), aimed at using geoarchaeology to address questions about the site’s stratigraphic integrity and degree of post-depositional disturbance. High-resolution geoarchaeological data proved to be of particular importance, since the Pleistocene deposits did not display clearly visible stratigraphic boundaries in the field. Recent work by the team has addressed this issue by using cluster-analysis on the 3-dimentional distribution of the archaeological materials (Sifogeorgaki et al., 2020), allowing the identification of distinct horizontal artifact density zones and disproving the suggestion of large-scale sediment movement (contra Kaplan, 1990).
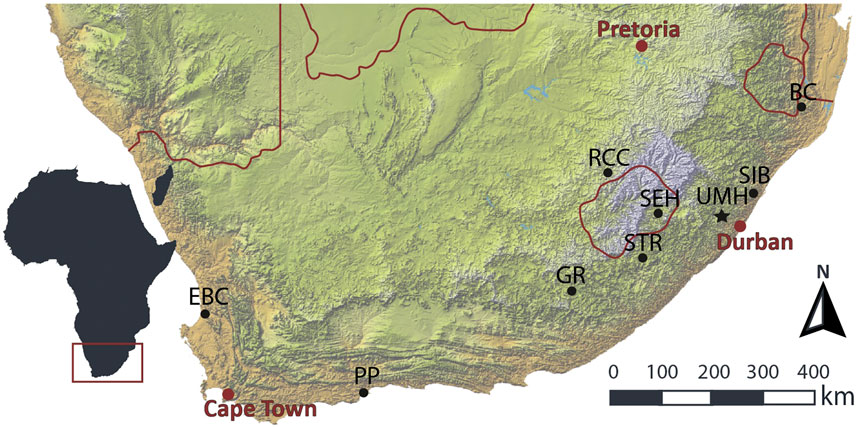
FIGURE 1. Topographic map featuring Umhlatuzana rockshelter and its relative location to other sites mentioned in the text. BP, Border Cave; EBC, Elands Bay Cave; GR, Grassridge rockshelter; PP, Pinnacle Point; RCC, Rose Cottage Cave; SEH, Sehonghong rockshelter; SIB, Sibudu Cave; UMH, Umhlatuzana rockshelter. Map based on SRTM 2000, NASA/JPL/NIMA.
The current study builds upon the study of Sifogeorgaki et al. (2020) by taking a geochemical approach to better understand the visible and invisible variation within the sequence. It examines if more subtle changes in depositional processes and post-depositional environment can be detected through the combined application of several geoarchaeological analyses. Bulk sediment samples were systematically taken from the western profile using a grid-based sampling strategy. Each sample was subsequently analyzed for pH, Magnetic Susceptibility (MS), and elemental composition (XRF). In addition, some preliminary micromorphological and field observations are integrated, allowing a link between processes occurring at the micro and macro scale. The pH can provide insight into the chemical balance of a depositional environment and give clues on which materials can be expected to preserve (e.g., Weiner, 2010; Karkanas and Goldberg, 2018; Braadbaart et al., 2020). The elemental composition of the deposits can provide information on the mineralogy and natural and anthropogenic input (Holcomb and Karkanas, 2019). The presence of reactive (mineral) phases such as carbonates or organic matter determine the long-term preservation of vulnerable archaeological material like bone or organic matter (van Os et al., 2012). MS is used to characterize the magnetic mineral (iron) content within geological deposits. Mapping of MS can provide insight into lateral and vertical changes in this magnetic mineral content, and provide further insight into underlying processes (Dearing, 1999; Herries and Fisher, 2010; Dinckal et al., submitted). Micromorphology is the study of undisturbed sediment samples under the microscope (Courty et al., 1989; Macphail and Goldberg, 2017), which provides valuable insights into the micro context of the deposits, both in terms of content and arrangement. By combining these techniques and systematically sampling the entire profile, questions of stratigraphic integrity, anthropogenic input, preservation, and environmental change can be addressed at both a macro and micro scale. Furthermore, the approach is simple, fast, and relatively cheap. Application to other sites in the region, and beyond, would therefore provide a more systematic and reproducible way to study and contextualize the many homogenous Pleistocene archaeological deposits, and would allow for more systematic comparisons and more ‘invisible’ stratigraphic processes to be revealed.
Background
Site Setting and Research History
Umhlatuzana is located around 35 km North-West of Durban in KwaZulu-Natal, South Africa (Figure 1). The site consists of a shallow North-East facing rockshelter which is 47 m long, 8 m wide, and 17.5 m high (Figure 2). The rockshelter is articulated within quartz arenite sandstones of the Natal Group and overlooks the Umhlatuzana river valley (Marshall, 1994). At the site location, the arenite sandstone beds are at places interspaced with 5–10 cm thick shale layers (personal observation). Due to the high quartz content the Natal sandstones are fairly resistant to weathering and erosion processes, resulting in a rugged landscape with high sandstone ridges.
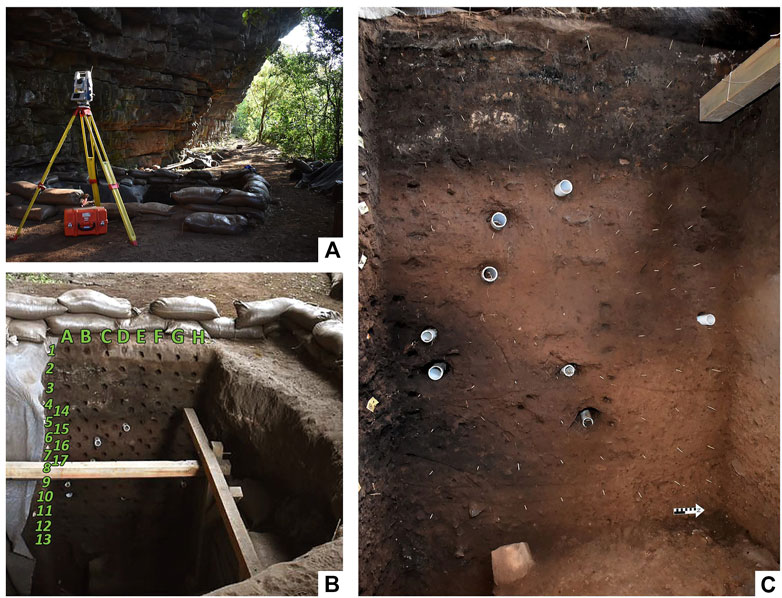
FIGURE 2. (A) View of Umhlatuzana rockshelter. (B) Overview of the western profile after the grid-based bulk sediment sampling. (C) West profile of squares L3A, L2B, L2A with grid-based sample locations. The northern part of the profile is affected by shading from the safety scaffolding installed in the excavation pit.
The site is situated in the summer rainfall zone and has a subtropical moist climate (Sayre et al., 2020). The region has annual rainfall ranging from 750 to 1,350 mm (Nel, 2009). The rockshelter is currently surrounded by a coastal scarp forest, with grassland occurring on nearby plateaus (Mucina and Rutherford, 2006). The rockshelter is well protected from weather conditions and remains dry after rain showers. Although it is surrounded by large trees, sunlight still passes through and is present at the site throughout the day.
Discovered during highway construction, Umhlatuzana was initially excavated in 1985 (Kaplan, 1989, 1990). A rescue excavation of a 6 m2 trench yielded an abundance of finds, predominantly stone tools, dating to the MSA, LSA, and Iron Age (Kaplan, 1990). Kaplan dated the sequence using radiocarbon dating (Kaplan, 1990). The dates were later recalibrated in OxCal using the southern hemisphere calibration curve (Bronk Ramsey, 1995; Sifogeorgaki et al., 2020). Additional Optically Stimulated Luminescence (OSL) dates were obtained for the Pleistocene sediments (Jacobs et al., 2008; Lombard et al., 2010).
In 2018 and 2019 a team from Leiden University, in collaboration with the KwaZulu-Natal museum, conducted small scale excavations aiming to better contextualize the archaeological finds (Sifogeorgaki et al., 2020). Three 50 × 50 cm2 squares (L2A, L2B, L3A) were excavated until a depth of 2.04–2.40 m, exposing a new western profile (Sifogeorgaki et al., 2020) (Figure 3). This profile was documented in detail and sampled for bulk sediment (granulometry, pH, Loss on Ignition, X-ray fluorescence, Fourier-transform infrared spectroscopy), micromorphological, phytolith, MS, lipids, OSL, radiocarbon, and stable isotope analyses. Samples were taken for past, ongoing, and future studies of the site.
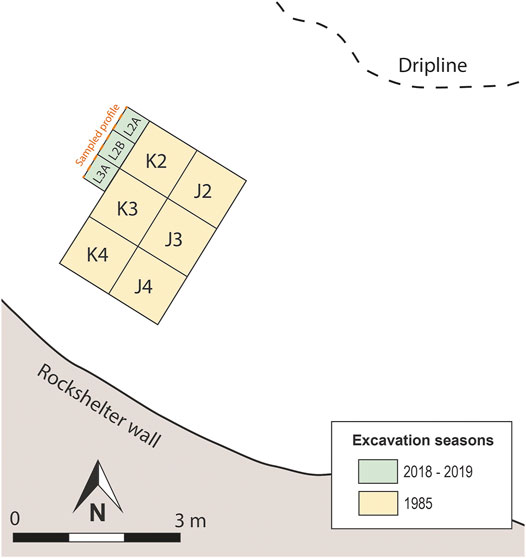
FIGURE 3. Umhlatuzana site map illustrating the excavation squares of the different fieldwork campaigns.
Paleoenvironment
The deposits at Umhlatuzana rockshelter correspond to Marine Isotope Stage (MIS) 4, 3, 2, and 1. Analysis of marine cores off-shore of the South African coast suggest Sea Surface Temperatures (SST) varied modestly across the Pleistocene, with temperatures between 20 and 22°C for MIS 4, 3, and 2, and sometimes decreasing to 19°C during MIS 4 (Simon et al., 2013; Ziegler et al., 2013). Palaeobotanical work in the region also suggests colder winter conditions during MIS 4, compared to MIS 3 and 2 (Bruch et al., 2012). In addition, the colder periods (i.e., MIS 4 and 2) are suggested to have increased precipitation (Chase, 2010). Terrestrial proxies indicate wetter conditions during MIS 4 (Clark, 2013) and dryer conditions during MIS 3 (Baker et al., 2014; Esteban et al., 2020). Furthermore, rainfall seasonality decreased in MIS 2, compared to MIS 4. During the Holocene the SST increased to 22–24°C (Simon et al., 2013; Ziegler et al., 2013), while higher precipitation levels returned (Baker et al., 2014).
Stratigraphy
The deposits of Umhlatuzana rockshelter are divided into Group P (Pleistocene) and Group H (Holocene) (Sifogeorgaki et al., 2020) (Figure 4). It is important to note that the boundary between the two groups does not necessarily correspond chronologically to the Pleistocene-Holocene boundary and additional dating work is required. The lowermost Group P deposits appear homogeneous with no distinct stratigraphic boundaries and their stratigraphic integrity has been questioned (Kaplan, 1990; But see Lombard et al., 2010; Sifogeorgaki et al., 2020). In addition, the Pleistocene deposits are characterized by a lateral differentiation in moisture content. The moisture content is higher in the lowermost deposits and toward the rockshelter wall (square L3A). This is possibly the result of limited water flow on the surface or within the bedrock. On the western profile, the higher moisture levels correspond to Units P6, P7, P9, P12, P14, P16, and P17 (see below and Figure 4). It is important to note that the boundaries between lower and higher moisture sediments are gradual. Higher moisture units demonstrate slightly better charcoal preservation while lower moisture units demonstrate slightly better bone preservation (Sifogeorgaki et al., 2020). The uppermost Group H sequence is characterized by clearly defined layers representing distinctive anthropogenic and biogenic features. They are characterized by the presence of combustion features (hearths) and sediments rich in ash, charcoal and bone fragments (Kaplan, 1990). Across Group H deposits organic finds are much more abundant than in Group P.
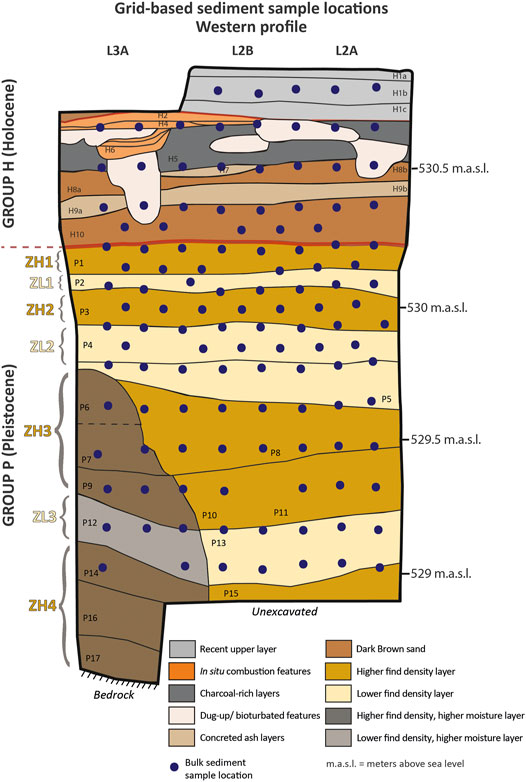
FIGURE 4. Stratigraphic drawing of the western profile based on Sifogeorgaki et al. (2020) highlighting the location of distinct lower and higher find density zones as well as the grid-based sampling locations of the current study.
Grain size analysis indicates consistent loamy sand sediments throughout the sequence. The grain size of the sediments is similar to the grain size of the sandstone bedrock indicating that the sediment input largely originated from in situ weathering of the overhang (Sifogeorgaki et al., 2020). Additionally, FTIR results demonstrate sediment homogeneity, with all readings consistently showing quartz and clay minerals (Sifogeorgaki et al., 2020). Modern surface samples contained traces of apatite. The organic content of the sediments was measured to be between 1.6 and 6.1% with a higher concentration of organics in the Holocene deposits (for complete results see Sifogeorgaki et al., 2020). Moreover, the preliminary pH analysis results published in Sifogeorgaki and others (2020) indicates values ranging from 4.6 to 9.1. The highest pH values are associated with Holocene combustion features (e.g., Unit H9). Organic content and pH values of the same sediment samples prove strongly negatively correlated.
Sifogeorgaki and colleagues (2020) subdivide the Pleistocene stratigraphy in units based on fabric differentiations of the sediments and archaeological find density. Here we use a summarized version of those findings where we subdivide the Pleistocene sequence based on zones characterized by differing densities of archaeological finds. The section is thus divided into four zones that correspond to a higher find density (ZH) and three zones that demonstrate lower find densities (ZL) (Figure 4). The lowermost higher find density Zone ZH4 directly overlies bedrock. It consists of Units P14–P17 and spans a period from ∼70 to ∼60 ka (Lombard et al., 2010). Overlying these sediments is a low-density Zone ZL3 corresponding to Units P12 and P13. An OSL date of 41.9 ± 2.6 ka was obtained from sediments corresponding to P13 (Lombard et al., 2010). The overlying Zone ZH3 consists of Units P6 to P11 (Figure 4). Calibrated radiocarbon dates suggest these sediments may date to between 40,000 and 31,500 BP (Sifogeorgaki et al., 2020, Table 1). Units P4 and P5 comprise another low-density Zone ZL2, for which no radiometric ages are available. Overlying that, Unit P3 encompasses higher find density Zone ZH2 for which similarly no radiometric age is available. Unit P2 represents the final lower find density Zone ZL1 while Unit P1 corresponds to the final higher find density Zone ZH1, which yielded a calibrated radiocarbon age between 15,710 and 16,431 BP.
TABLE 1. Stone tool technocomplexes present at Umhlatuzana rockshelter and their general age range.
The Holocene sequence demonstrates a better preservation of organic materials, notably bone and charcoal that are largely absent from the Pleistocene sediments. The lower part of the Holocene stratigraphy consists of dark brown sand layers (H10 and H8) that contain bone and charcoal fragments. Sediments corresponding to H10 yielded a calibrated radiocarbon date of 10,163–10,572 BP. Two distinct layers of concreted ash, Units H9 and H7, occur at elevations of ∼530.4 and ∼530.5 m, respectively. In particular, Unit H9 has a thickness of ∼10 cm and can be followed throughout the western, northern, and eastern profiles. Charcoal-rich deposits with a high bone fragment concentration overlying H7 likely conform to the unit where a radiocarbon age of 2,766–3,066 BP was obtained (Sifogeorgaki et al., 2020). In the upper part of the Holocene sequence in situ, well-preserved hearths are present (Units H6, H4, H3, H2). The uppermost deposit consists of a dark-brown sand layer and covers the entire excavation area. Dug-up and bioturbation features were visible in the profile and were documented as such (Figure 4).
Archaeology
The archaeology of the Pleistocene deposits at Umhlatuzana rockshelter is characterized by distinct zones of higher find density separated by lower find density zones (see above). An overview of the technocomplexes present at the site is presented in Table 1. The lowermost Zone ZH4 yielded bifacially worked leaf points considered typical of the Still Bay industry (∼75–71 ka) (Lombard et al., 2010; Högberg and Lombard, 2016b). This is supported by an OSL age of 70.5 ± 4.7 ka (Lombard et al., 2010; Högberg and Lombard, 2016b). Interestingly, serrated points were found among the Still Bay materials (Lombard et al., 2010; Mohapi, 2013). Such points are limited to pre-Still Bay sediments at the nearby site of Sibudu (Rots et al., 2017). In the upper part of ZH4 the artifacts are dominated by backed segments, which are the type artifacts of the Howiesons Poort industry (∼65–60 ka) (Kaplan, 1990; Sifogeorgaki et al., 2020). These sediments yielded an OSL age of 60.0 ± 3.5 ka (Lombard et al., 2010). Zone ZL3 was designated Late MSA by the original excavator (Kaplan, 1990; Sifogeorgaki et al., 2020). Previous work highlighted numerous unifacial points from these units (Mohapi, 2013), while segments remained common artifacts (Kaplan, 1990; Sifogeorgaki et al., 2020). The continued occurrence of segments has also been observed at Sibudu in its late and final MSA assemblages (Wadley, 2005). The assemblages of ZH3 can be characterized as late MSA, with a continued dominant presence of segments. Higher up in this zone, hollow-based points are present (Mohapi, 2013; Sifogeorgaki et al., 2020). Based on their presence in the latest MSA deposits at Sibudu (Wadley, 2005), these artifacts have been taken as typical of the final MSA in the region (Mohapi, 2013; Bader et al., 2018). The uppermost hollow-based points at Umhlatuzana are found among lithics that appear transitional between the MSA and LSA, in the very top of Zone ZH3. Material recovered from this area includes both bladelets and bladelet cores, but also large debitage products such as blades and flakes (Kaplan, 1990; Sifogeorgaki et al., 2020). Materials recovered from ZL2 were dubbed early Robberg by the original excavator (Kaplan, 1990). Finally, the uppermost higher-density Zone ZH1 conforms to the later part of the Robberg, which can also be found in the lowermost Holocene sediments (Kaplan, 1990; Sifogeorgaki et al., 2020).
The archaeology of the Holocene deposits is characterized by lower find densities, and contains both LSA and Iron Age material culture (Kaplan, 1989; 1990). The LSA assemblage contains bladelets, and a variety of formal tools that include naturally backed knives and scrapers (Kaplan, 1990). The renewed excavations confirmed the presence of LSA archaeology in the Holocene deposits and also uncovered some Nassarius beads. A very small number of segments were recovered in the LSA sediments (Kaplan, 1990). The topmost sediments contain LSA lithics, (Late) Iron Age thick-walled ceramics, and Achatina beads (Kaplan, 1990; Sifogeorgaki et al., 2020).
Materials and Methods
Grid Placement, Sampling, and Sample Preparation
A sampling grid was set up consisting of eight columns (A to H) and thirteen rows, covering the full extent of the exposed profile (Figures 2 and 4). Sample locations were spaced 15 cm apart. Between row 4 and row 8 additional sample locations (row 14–17) were added directly in the middle of each group of four existing sample locations (e.g., A14 was added between A4, A5, B4, and B5) to increase the resolution of the grid. The coordinates for all sample locations were recorded using a Robotic Total Station. In a few instances sample locations had to be moved slightly or omitted from the grid due to the presence of OSL sample holes or large rock fragments.
From each sample location equal volumes of sediment (60 ml) were collected for analysis. Samples were air-dried overnight. The color of the sediments was determined on dry samples (using the Revised Standard Soil Color Charts 2010). All samples were sieved to <2 mm to remove any coarse material prior to pH, X-Ray fluorescence (XRF) and MS analyses.
pH Analysis
For each sample, 30 ml of sediment (<2 mm) was mixed with 60 ml of deionized water (1:2 sediment-water ratio). Mixtures were stirred thoroughly and left to settle overnight. The organic content was quantified based on the relative amount of material floating in the solution (low, medium, high, absent). The pH of the supernatant was measured using an Accumet AB150 benchtop pH meter equipped with a double junction pH/ATC electrode. Measurements were taken in triplicate and values were averaged before further use.
X-Ray Fluorescence Analysis
The XRF analyses were carried out using a Thermo Scientific Niton XL3t GOLDD + energy-dispersive p-XRF analyzer, equipped with a silicon drift detector. Sediment samples (<2 mm) were compressed manually with an agate pestle into a PE-ring with a height of 10 mm. Analyses were performed using a stand mounted above the sample ring. This setup negates the use of separation foil between the sample and the XRF, that could absorb secondary X-rays from light elements. Measurements were taken in Cu/Zn-mining mode, with a measuring time of 110 s, using 4 sequential energy settings: Light range (Mg to Cl) at 8 kV 200 μA, low range (K to Ti) at 20 kV 100 μA, main range (V to Ag including L-lines for Pb) and high range (Cd–Ba) both at 50 kV, 40 µA. The machine’s factory calibration was checked and adjusted using a set of 14 powdered ISE standard soil samples (www.wepal.nl). Accuracy was tested using the BAMS005B glass standard. All elements for which the results were above the detection limit were included in the dataset.
Magnetic Susceptibility Analysis
MS was measured on bulk samples (∼5 g) gathered at each grid location. Before measurement, sediment was placed in small Ziploc bags. The Low Frequency (χLF) to High Frequency (χHF) MS measurements were taken with the use of a Kappabridge MFK1-FA susceptometer at the CENIEH, Burgos, Spain. Low Frequency measurements were taken at 0.976 kHz, while High Frequency measurements were taken at 15.616 kHz. Field Intensity was set to 200 A/m. All samples were measured in triplicate and averaged. Samples were measured at low frequency and high frequency magnetic fields, as mixtures of magnetic minerals with higher concentrations of finer domain structures (the internal magnetic behavior) contribute less to overall susceptibility when measured at higher frequencies. Comparing measurements at two frequencies provides insight into the size of magnetic domains of the minerals being magnetized. The increase in the frequency of finer domains results in a greater difference between χLF and χHF measurements (Dearing, 1999). χLF MS measurements are mass corrected and presented at 10−6 m3/kg. The difference between the χHF and χLF is presented as both the absolute difference between both values (χFD, Frequency Dependent) and in percentage χFD%, following methodology outlined by Dearing et al. (1996a; 1996b). Mixtures of single-domain magnetic particles and small fractions of SP particles commonly fall in the χFD% range from ∼1 to 7%. As SP proportions in admixture increases, χFD% increases (and may exceed 7%). Dominantly SP properties are present for χFD% values of 12% or higher (Dearing, 1996). Since iron minerals are the primary element driving the magnetic properties of the sediments, any mention of magnetic minerals in the text mainly refers to iron content.
Micromorphological Analysis
The micromorphological samples were taken from the stratigraphic sequence of the western profile using plaster bandages or Kubiena tins (Stoops and Nicosia, 2017). The sampling concentrated on the Group P deposits of square L3A with the exception of one sample taken from the uppermost Unit H1 (square L2A). Sample preparation occurred at the laboratory of the Cultural Heritage Agency of the Netherlands in Amersfoort. The blocks were first air-dried and then oven dried at 25–40°C. They were then impregnated in a mixture of 2:1 polyester resin: acetone. The blocks were irradiated with gamma radiation at the Synergy Health Ede B.V. Company. The hardened blocks were cut into ∼3 cm thick slabs and were documented using a digital SLR (Nikon D3400) with a standard lens. Subsequently, 13 petrographic thin sections of 30 μm thickness were produced (see provenance in Table 2), and observed in plane-polarized and cross-polarized light (PPL, XPL), primarily using a Euromex IS.1053-PLPOLi polarization microscope with 10×/23 mm eyepiece and trinocular, and magnifications from 5 to 40×. The thin sections were analyzed and described following standard micromorphological literature (Stoops, 2003; Stoops et al., 2010; Macphail and Goldberg, 2017).
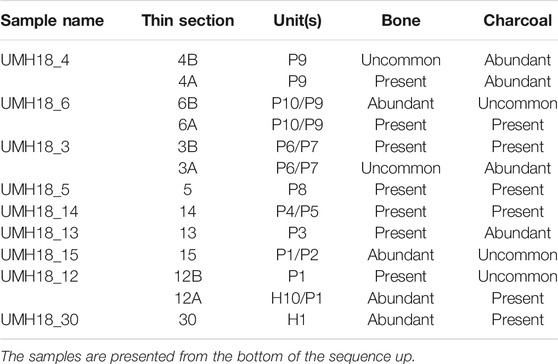
TABLE 2. Stratigraphic provenance of the micromorphology samples at Umhlatuzana rockshelter; bone and charcoal quantification in the thin sections.
Statistical Processing and Visualization
The pH and elemental data were visualized using inverse distance contour plots. Contour and elevation plots were constructed using Grapher® plotting software. For contouring an inverse distance to a power gridding method was used (Davis, 1986). The grid dimensions were 100 rows by 61 columns and to avoid “bull’s eyes” around extreme datapoints, a power factor of 2 and a smoothing factor of 0.05 were selected on the basis of the visual evaluation. Because the sediments are deposited horizontally and bioturbation is limited during deposition to a certain depth, the anisotropy ratio was set to 5 with an angle of 0°. Due to the more heterogeneous nature of the MS data the application of a geostatistical model was required to ensure proper projection of the datapoints. Statistical analysis was conducted with the base R function (R Core Team, 2017), with plots being developed utilizing the GGplot2 package (Wickham, 2016). The heat maps for MS were therefore developed with the use of a combined approach of QGIS and R, with the use of Ordinary Kriging to interpolate predicted values of the grid points. The approach is adapted from Dinckal and others (submitted) to accommodate the use of open access software. R was used to understand the statistical breakdown of the data. Both Histograms and Quantile–Quantile (QQ) plots were developed to understand if the distribution of the data was normal. If distribution was skewed, a log transformation was applied to normalize the data. R, with the use of the gstats package (Pebesma, 2004; Gräler et al., 2016), was further utilized to understand the appropriate model to apply to the interpolation of the dataset. Variogram models were compared and the best fit was identified. These variogram model parameters were then applied to the datasets in QGIS. Data was input into QGIS as delimited text layers. Ordinary Kriging was undertaken with the assistance of the SAGA plugin (Conrad et al., 2015). Parameters identified with the use of R were input in the QGIS system and the interpolated models were developed. The full R script for the development of the statistical analysis and the development of the variogram models can be found in the Supplementary Material.
Results
pH
The pH in the grid ranges from 4.87 (sample position D12) to 8.94 (sample position H5), with an average value of 6.87. The lowest values can be found in the southern part of the bottom of the stratigraphy, while the highest values are located in the top North (Figure 5B). There is a very clear vertical trend of decreasing pH going down the stratigraphy, but also a horizontal trend with pH increasing from South to North. The change in pH happens gradually for both the vertical and horizontal distribution, with a minor shift toward more neutral pH values at the very top of the sequence (Figure 5). The lateral variation is greatest at the bottom of the sequence (Figure 5A).
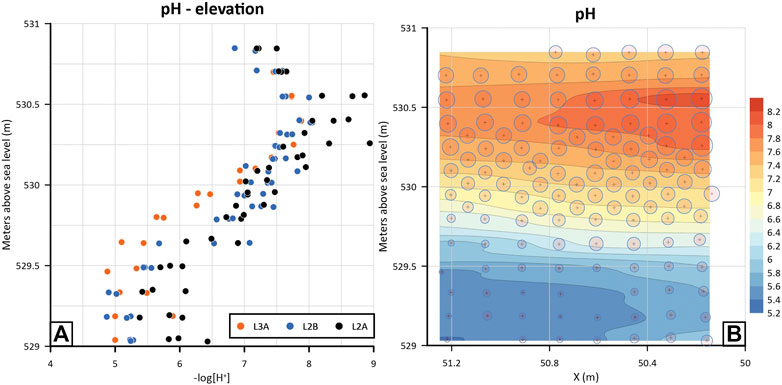
FIGURE 5. Results from the grid-based pH analysis illustrated using an elevation plot (A) and contour map (B).
X-Ray Fluorescence
An overview of the average values and standard deviations of the elemental data is presented in Table 3, while r values for the different element combinations can be found in the Supplementary Material (For the complete dataset and figures for all elements see the Supplementary Material). Within the distribution of the various elements present in the stratigraphy some patterns can be recognized. The upper part of the sequence, down to an elevation of z = 530.25 m, is characterized by the highest values of alkaline earth metals CaO, MgO, Sr, and metals MnO and Zn (Figures 6C,D). These elements all show a similar pattern, peaking in the middle and lower part of this section (z = >530.25). The elements Cl and S have their highest values just below the current surface (Figures 6E,F). However, both remain above the detection limit throughout the entire sequence. Potassium (K2O) also shows an optimum in the middle of this section (z = >530.25). The silicates and iron minerals (SiO2, Fe2O3, Al2O3, TiO2, Zr) have their lowest values here, and all remain stable or increase further down in this part of the sequence (z = >530.25) (Figures 6A,B,G,H,K,L). In this upper part of the sequence the variation in values is quite high for all elements. Below an elevation of z = 530.25 m the alkaline earth metals and metals MnO, Cu, and Zn all rapidly decrease toward very low background concentrations. Silica (SiO2) and potassium have their highest values right below z = 530.25 m and gradually decrease toward the bottom of the sequence. The iron minerals have their lowest to intermediate values in this section (z = <530.25), and gradually increase toward the bottom of the deposits. While variation in elemental concentrations is still present in this part of the sequence (z = <530.25), the variation is considerably lower than in the top part (z = >530.25). The distribution of P2O5 does not fit any of the aforementioned categories, but instead is characterized by a gradual fluctuation between lower and higher values throughout the sequence, with most lateral variation at the bottom (Figures 6I,J).
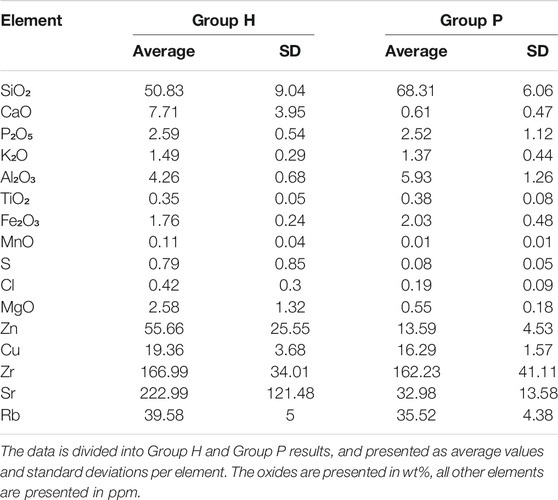
TABLE 3. Overview of the elemental composition of the sediments.
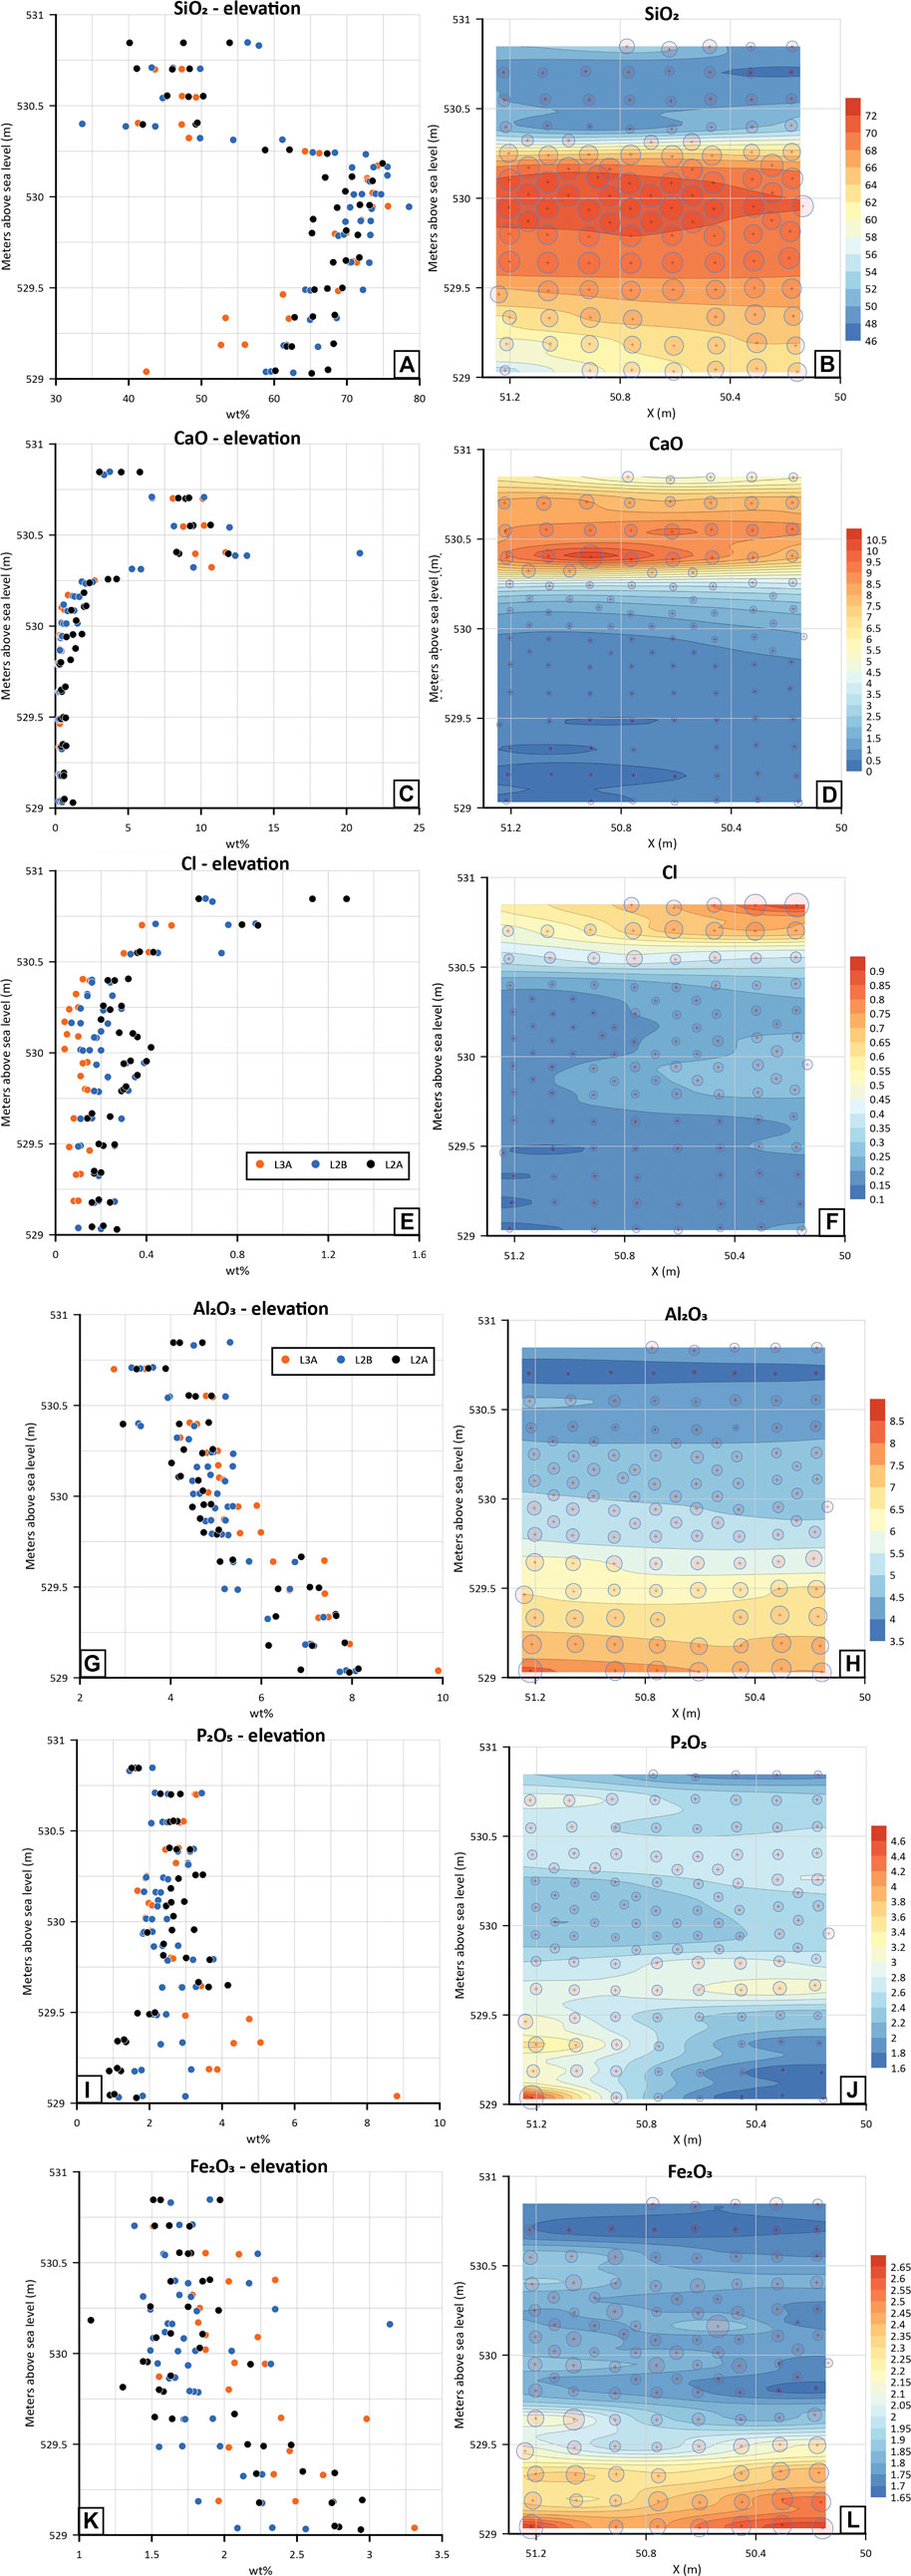
FIGURE 6. XRF results for selected elements. (A) SiO2 elevation plot. (B) SiO2 contour map. (C) CaO elevation plot. (D) CaO contour map. (E) CL elevation plot. (F) Cl contour map. XRF results for selected elements. (G) Al2O3 elevation plot. (H) Al2O3 contour map. (I) P2O5 elevation plot. (J) P2O5 contour map. (K) Fe2O3 elevation plot. (L) Fe2O3 contour map.
Magnetic Susceptibility
Figure 7A shows the distribution of the χLF and the χHF results as well as the relationship between the measurements at the two frequencies. The χLF values range from 1.22 to 4.03[10−6 m3/kg] with a mean of 2.21[10−6 m3/kg], while the χHF values have a range of 1.90–3.68[10−6 m3/kg] with a mean of 2.01[10−6 m3/kg]. The smaller range and lower mean of the χHF MS measurements follows the expected behavior of magnetic minerals having lower susceptibility at higher frequency fields due to the removal of the influence of concentrations of the finer domain magnetic minerals. A Pearson’s correlation of 0.99 demonstrates a clear relationship between the properties. Figure 7B shows the distribution of χFD values and χLF and how the values relate to one another. Despite high variability, Figure 7B indicates a linear relationship between the two datasets. This suggests that the relationship is not strictly driven by an increase in χLF values, but also by the concentration of the finer domain structures. Frequency dependent percentage (χFD%) values range from 3.4 to 13.2%. This places the composition of the domain structures within the regions of single-domain to SP admixtures (χFD% of 2–10%; Dearing, 1996), with the increase in χFD% values indicating an increase in the SP particle contributions. χFD measurements have a mean of 8.94%, with 75% of the values above 7.735%. This indicates that most of the measured material is heavily influenced by concentrations of Superparamagnetic (SP) grains, while a very small fraction, 21 out of 126 samples, measures the influence of Single-Domain concentrations.
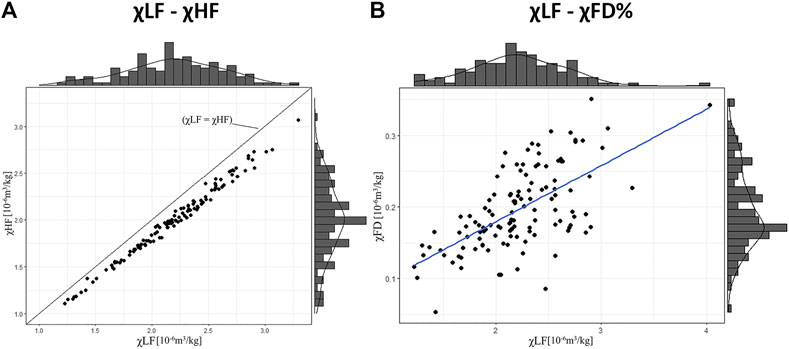
FIGURE 7. (A) Plot of χLF and χHF values, with the distribution of values represented along the margins. The predictive model represents the expected distribution of χLF = χHF. (B) Plot of χLF and χFD values with distribution represented along the margins and liner model demonstrating the relationship between the values.
Figure 8A shows the distribution and the Kriged interpolation of χFD percentages and the distribution and interpolation of χLF values. The data shows that the moderate to high χFD% values are inversely correlated with the χLF values. This is clearly visible in the plots at elevations of z = <529.75 m, at x = 51.0 m, and z = <59.5 m at x = 50.1 m (Figure 8). Based on the MS results in these areas, magnetic mineral concentrations seem relatively high compared to the rest of the sequence. As we move from x = 50.1 m to x = 51.0 m, we find that the χFD% decreases from more than 12% to around 8%, while χLF values increase from moderately high values to high susceptibility values. Domain structures of these magnetic minerals still fall within the range of SP mineral concentrations. It has previously been noted that as χFD% increases (above e.g., 7%), the size of SP domains becomes finer, or the relative contribution of SP particles increases (Thompson and Oldfield, 1986; Dearing, 1999). It is therefore feasible to assume that the increase in χLF is related to the relative increase in domain sizes -either from the depletion of finer material or from an increase in the concentrations of the coarse domain structures. At elevations above z = <529.75 m, at x = 51.0 m, and z = <529.5 m at x = 50.1 m the sequence is characterized by both low χFD% values and low χLF values until elevations of z = 530.25 m (Figure 8B). Below that, magnetic mineral concentrations with coarser domain structures tend toward higher χLF values. Therefore, the low values for both χLF and χFD% could be explained by relatively low magnetic mineral concentrations. At z = 530.25 m a lens of moderately high χLF values is visible, which corresponds to the transition from the Group P to Group H deposits. The increase in χLF, associated with χFD% values of ∼7%, is likely due to an increase in overall magnetic mineral concentration. Directly above this lens, χFD% values show an increase in concentrations of finer SP grains, coupled with a marked decrease in χLF values. This likely corresponds to a dilution of coarser magnetic minerals, removing components that would increase the χLF.
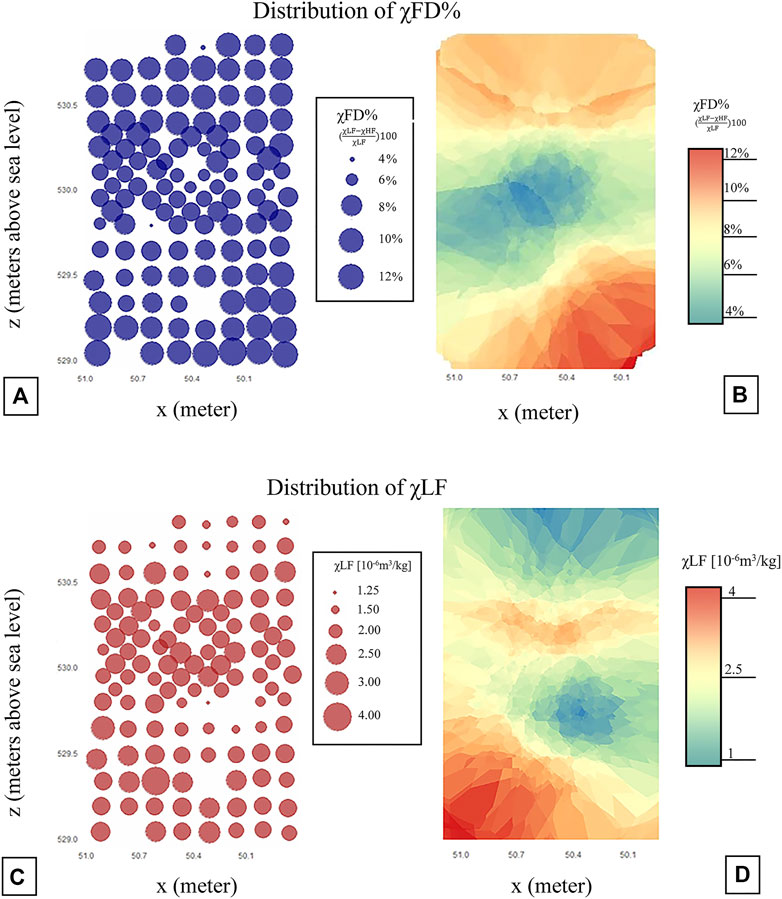
FIGURE 8. (A) FD% bubble plot. (B) FD% heat map. (C) χLF bubble plot. (D) χLF heat map.
Overall, patterning of χLF and χFD% values shows that a change from moderate to higher χLF values is driven by a decrease in χFD%. As χFD% decreases concentrations of coarser SP to Single-Domain magnetic minerals increase, in turn increasing the χFD%. χLF decreases with an increase in χFD% where concentrations of SP magnetic minerals increase or become finer. However, higher concentrations of fine-grained SP minerals, χFD% of ∼10%, can still lead to moderate χLF values assuming there is an overall greater concentration of magnetic minerals. A decrease in χLF can also occur with an overall decrease in the concentration of all magnetic minerals.
Micromorphology
The preliminary micromorphological analysis conducted for this paper shows that the sediments appear homogeneous throughout most of the Group P sequence. Stratigraphic boundaries are not detectable also at the micro-scale. Although the boundary between the Group P and Group H sediments was not visible in the thin section, it was clear that the Group H Unit H9 contained a higher concentration of bone fragments than the underlying Group P Unit P1 (Table 2). Bioturbation features include voids, channels, and infilled burrows (Figures 9A,B). The preliminary study shows no indication for large scale sediment movement (e.g., rotational slipping failure surface, grain orientation).
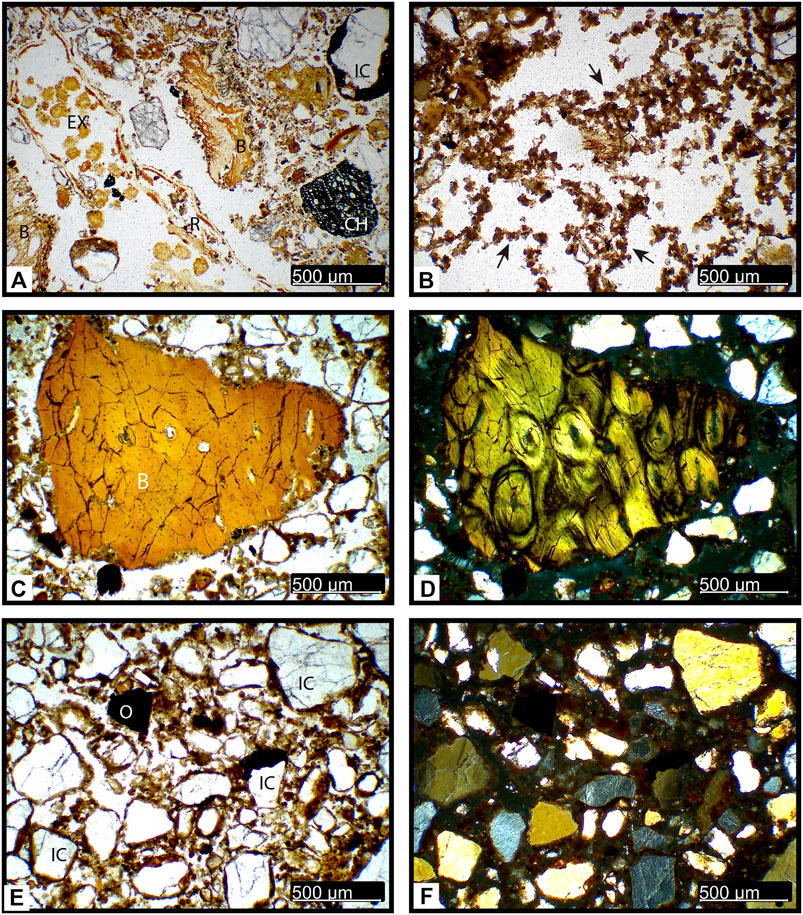
FIGURE 9. Photomicrographs of sedimentary components identified in micromorphology thin sections. A: Degraded bone (B) and organic (root?) tissue (R), including mesofauna excrements (EX), charcoal fragment (CH), and sand grain with iron oxide coating (IC). Sample UMH18_30. (PPL); assorted deposits of uppermost Unit 1. (B) Mesofauna excrements consisting of degraded organic matter (arrow). Sample UMH18_15 (PPL), Unit P2 (Zone LF 1). (B) Bone fragment (B), with orange colors and cracking indicating heating or weathering. Sample UMH18_12B (PPL), Group P–Group H boundary deposits. (D) Idem, (XPL). Haversian canals are clearly visible. (E) Unsorted sand fragments with coatings of organic matter and iron oxides (IC), and organic matter plus iron oxide fine organic aggregates (O). Sample UMH18_12B (PPL). Group P - Group H boundary deposits. (F) Idem, (XPL).
The sediments primarily consist of sand-sized quartz grains. Other smaller sized materials (silt and clay) are usually present as bridges between the quartz grains and coatings and cappings of the clastic materials (Figures 9E,F). Occasionally, clay material form aggregates frequently associated with organic material that has undergone post-depositional oxidation. Two main fabric types were identified. Fabric I is moderately sorted with a single-spaced fine enaulic distribution in a spongy microstructure, while Fabric II is moderately sorted with a double-spaced coarse enaulic distribution within a vughy microstructure. Angular to subangular rock fragments that are mostly the result of anthropogenic input (lithic debitage) are commonly articulated within the matrix. The main raw materials for tool production identified are sandstone, quartz and hornfels; less commonly occurring are chert and dolerite. In addition, opaque iron-rich oxides are present throughout the deposits. Some of the iron oxides appear to be primary angular rocks with sharp boundaries. Additional iron oxides take the form of weakly impregnated iron nodules and coatings that are likely formed post-depositionally. Fine sand to gravel sized angular bone as well as moderately fragmented charcoal remains were identified in all of the thin sections (Table 2). Bone fragments are more frequent in the uppermost Group P deposits (e.g., Figures 9C,D), while charcoal fragments tend to be more abundant in the lowermost Group P deposits (Table 2).
Sandstone rock fragments of a similar composition to the bedrock are present throughout the sedimentary sequence. Those were identified in thin-section and are described as fragments of a quartz arenite sandstone with angular quartz grains ranging from 200 to 600 µm and a low proportion (∼5%) of silica cement. It cannot be determined whether those sandstone rock fragments are the result of roof spall or are by-products of stone tool knapping, but their consistent presence indicates that they probably derive from sandstone of a similar composition to that of the rockshelter overhang.
Discussion
Stratigraphic Implications
Integration of the pH, XRF, MS, and micromorphology data results in information on site-formation processes and changes within the stratigraphic sequence, most of which were not visible in the field or observed during earlier work at the site (Kaplan, 1990; Sifogeorgaki et al., 2020). The first thing that stands out is the difference in dynamics above and below the elevation of z = 530.25 m. This is the elevation where the majority of the elements measured with XRF show a distinct jump in values and change in behavior (Figure 6), and which corresponds nicely to the major stratigraphical change identified in the field; the boundary between the Group P and Group H deposits (Figure 4). The abrupt change in values indicates a limited impact of post-depositional mixing of the sediments. Because of the distinct difference between the sediments above and below this boundary these groups will be discussed separately.
The dominant component of the Pleistocene deposits is quartz, as is reflected by the SiO2 content, the major mineral constituent of the sandstone. Previous work has shown that the deposition of quartz at the site derives from weathering of the sandstone rockshelter, and forms the largest part of the geogenic deposit (Sifogeorgaki et al., 2020). The input of SiO2 gradually increases upwards toward the Group P/H boundary (Figures 6A,B), which is most likely the result of the decrease in other components. Along with the gradual increase of SiO2 there is a gradual increase in K2O, as well as a in the pH from acidic values (4.87–5.38) to more neutral values (∼7.5) at the boundary (Figure 5). The presence of K2O can relate to various inclusions such as K-rich hornfels stone tool debitage, charcoal fragments, ash, and minerals such as micas and feldspars. Further analyses are needed to identify the exact source. In addition, there is a gradual decrease in Al2O3, Fe2O3, Zr, and TiO2 toward the top of the sequence (Figures 6G,H,K,L). These elements are likely related to more fine-grained material such as heavy minerals and clay minerals (Taylor and McLennan, 1985; Huisman et al., 1997), which might derive from in situ weathering of the thin shale layers interbedded between the sandstone bedrock. The micromorphology samples indicate consistent presence of fine matrix (∼10%) that could be partially related to clay minerals. It should be noted that the Al2O3 content of the deposits likely derives from various sources, including clay minerals, feldspars, and aluminum phosphates related to dissolved excrement (Nriagu, 1976; Karkanas, 2000). Based on the MS results the Pleistocene deposits can be divided into three areas: 1) the bottom of the sequence (z = <529.75) with high χLF and moderate χFD% values in the South corner, and lower χLF and high χFD% values in the North corner, 2) the middle of the sequence (z = 529.75–530.50) where both χLF and χFD% values are low, and 3) a thick lens of high χLF values within Area 2 (∼z = 530.25). The minimum in the χFD% values at z = 530.0 coincides the minimum concentration of Zr, indicating that the χFD% values are positively related to the fine fraction of the sediment. This underlines that the χFD% signal is most likely carried by minerals in the finer fraction of the sediment. Similarly, the moderate to high χLF values appear to correlate with the highest concentration in Fe2O3 content. This suggest that the changes in the overall χLF signal can be driven by changes in iron content. The difference between Area 1 and Area 2 suggests a change in the depositional environment. The location of Area 3 coincides with the boundary between the Group P and Group H deposits. The presence of these high χLF values in an area that is otherwise characterized by low χLF and χFD% values suggests that the lens is an enhancement that occurred after the initial deposition of the sediments. It was previously identified that topsoil and surface areas have a tendency to undergo magnetic enhancement through the formation of secondary oxides within the sedimentary clay fraction. This elevates the χLF of surface soils compared to χLF values lower in the same sequence (Thompsons and Oldfield, 1986; Dearing et al., 1996a; Hanesch and Scholger, 2005). At Umhlatuzana, the high χLF values of Area 3, combined with its location at the boundary, suggest the potential presence of an open surface where pedogenesis may have occurred. However, more in-depth MS analysis and micromorphology is needed to test this hypothesis.
The Holocene deposits are characterized by visible layers and features, and the presence of a lot of (cemented) ash (Figure 2). While SiO2 (quartz) is still the dominant component, its percentage is heavily reduced compared to the Pleistocene deposits as the result of a higher input of other materials (mainly ash and organics). This ash is present in hearth features, as well as in the form of an ash layer with an average thickness of 10 cm (Figure 4). The influx of ash in the Holocene deposits is visible in the geochemical data as a marked increase in CaO, MgO, MnO, Sr, and Zn, all known components of wood ash (Figures 6C,D) (Vassilev et al., 2014). The latter elements also all show good correlation with CaO (Figure 10A, Table correlation SI). The enrichment in Cu might also be related to the presence of ash (Welch, 1993; Frassinetti et al., 2006). Bone was ruled out as the dominant source of CaO because there is no correlation between CaO and P2O5 (the main components of bone, see e.g., Reidsma et al., 2016) (Figure 10B). It should be noted that only sample A4 is directly obtained from the ash layer. The data therefore indicates that ash is also a dominant component of the other layers/features within the Holocene deposits. The introduction of large amounts of ash at the site is likely what caused the pH of the Holocene deposits to increase to alkaline values (∼7.5–8.94) (CaO–pH correlation, Figure 10C). While the lower boundary of the ash layer is located at an elevation of ∼z = 530.38, the ash related elements can already be seen to increase slightly below the Group P–Group H boundary at z = 530.25. This can be the result of small-scale movement of ash related compounds into the underlying deposits, or a higher incidence of burning (activities) in the Holocene. Another characteristic of the Holocene deposits is the wider variation in geochemical composition, which is probably related to the presence of identifiable features and greater heterogenous stratification. Due to the preliminary nature of the micromorphological study there were no thin sections available from Group H to complement the geochemical data, with the exception of the one derived from the uppermost Unit H1. The magnetics of the Holocene deposits are characterized by moderately high χFD% values and low χLF values that further decrease toward the top of the sequence. The layers and features present in the Holocene deposits (and clearly visible in the field) likely were not detected by the MS measurements due to the resolution of the sampling grid.
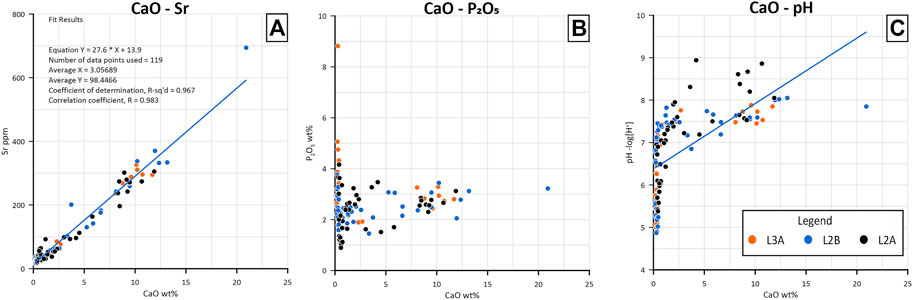
FIGURE 10. Correlation plots for CaO–Sr (A), CaO–P2O5(B), and CaO–pH (C).
Sediment Mixing
The gradual change, both vertically and laterally, in the geochemical composition of the Pleistocene deposits suggests that no large-scale movement has affected the sediments, and that any mixing has only occurred locally. Small-scale mixing by bioturbation is indicated by the micromorphological observations (Figure 9B). Small-scale sediment mixing was also previously demonstrated based on the overdispersion of the luminescence signals of the MSA deposits (Lombard et al., 2010). The current study extends this pattern of small-scale mixing throughout the sequence. The homogeneity of the Pleistocene deposits is likely the result of bioturbation combined with relatively consistent sources of sediment input (see also Sifogeorgaki et al., 2020).
The presence of layers and features, clearly visible in the field, suggests that no large-scale mixing has affected the Holocene deposits (with the exception of documented dug features). The wider variation in the geochemical composition of the Holocene deposits likely relates to this more small-scale stratification. Field observations and micromorphological data do indicate heavy mixing of the top Unit H1 (Figure 9A). The degree of sediment mixing at Umhlatuzana rockshelter will be the focus of the upcoming micromorphological analysis, which will include the examination of additional Holocene and Pleistocene samples.
Site Taphonomy
The high content of SiO2 in the bedrock and sediments of sandstone rockshelters like Umhlatuzana is known to correlate with acidic conditions and affects the baseline pH of the deposits (Lowe et al., 2018; Miller et al., 2016; Stewart et al., 2012). In the case of Umhlatuzana, the pH of the Pleistocene deposits might further be influenced by a decrease in Fe2O3 above z = 529.5, resulting in less acidic conditions than present in the bottom of the sequence (Figures 5 and 6K,L). The variation in pH values has a clear effect on the preservation of organic materials in the Pleistocene sediments, and correlates well with the variation in moisture content observed in the field. The lowest pH values are found in the area with the highest moisture content, which might be enhanced by the water presence itself. Groundwater derived from the sandstone bedrock tends to have a more acidic pH (Auler et al., 2020; Mecchia et al., 2014; Sauro et al., 2019) and enhanced SiO2 dissolution. The high moisture content in the bottom South corner of the sequence is likely the result of groundwater coming in through the sandstone bedrock. The low pH values correspond well with the highest concentrations of P2O5 in the sediments, especially in the area with a higher moisture content (Figures 5 and 6I,J). In contrast, the drier area with low pH values displays much lower P2O5 concentrations. This trend also matches with the variation in bone preservation, with poorly preserved bones in the high moisture/low pH area, and well-preserved bones present in the areas with more neutral pH values. Nevertheless, the poor correlation between P2O5 and CaO (Figure 10B) suggests the dominant source of phosphate in the deposits is not bone. A more likely source for the P2O5 is animal excrement (e.g., from Rock Hyrax: Procavia capensis) (Prinsloo, 2007; Chase et al., 2012). The phosphate in excrement will easily dissolve under wet conditions and/or be absorbed by iron minerals or react with soluble aluminum complexes to form aluminum phosphate minerals (Goldberg and Sposito, 1984; Karkanas, 2000; Nriagu, 1976), which might explain the elevated values at the bottom of the sequence where Fe2O3 concentrations peak. The exact origins of these phosphates will be explored in the upcoming, more elaborate study of micromorphological samples from the site, and will also include additional XRF analysis of the matrix and inclusions within those blocks. At the bottom of the sequence (z = <529.75) the transition from high χFD% values (above 10%) to moderate χFD% (∼8%), with an associated increase in χLF values, is also correlated with an increase in moisture content. Water movement through deposits enriched in ferric minerals can lead to magnetic enhancement through the formation of secondary iron oxides, as well as lead to the removal of finer SP domain magnetic minerals (Thompson and Oldfield, 1986; Herries, 2006). This suggests that the enhanced MS signal here is the result of post-depositional water movement through the sediments that caused the formation of secondary iron oxides, and has removed the finer SP domain minerals, while these finer minerals do remain in the drier northern part of the deposits at the same depth. Micromorphological analysis cannot currently confirm this observation because samples from the lower moisture Group P have not yet been prepared.
The Holocene deposits are characterized by alkaline conditions, most likely related to the abundant presence of ash, both in the combustion features and ash layer, as well as in the rest of the sediments. Most of the CaO in these ash deposits will be present in the form of calcium carbonate. This can be the result of different processes. When wood fuels are combusted the Ca present as calcium oxalate crystals will thermally decompose into calcium carbonate (CaCO3). If high enough temperatures are reached, the calcium carbonate is turned into calcium oxide (CaO). CaO will react with water to form calcium hydroxide (Ca(OH)2), which over time will convert to calcium carbonate. CaO can also react with CO2 (present in the atmosphere and/or the soil) to form calcium carbonate. Both MnO and MgO can be incorporated in calcium carbonate as a result of post-depositional processes and alkaline oxidized conditions (McKenzie, 1989). Calcium carbonate and calcium hydroxide will be the main pH buffering substances in the deposits (van Breemen and Wielemaker, 1974). Strikingly, there is no enrichment of K2O in the Holocene deposits, while this is a known component of ash. This suggests that the ash derived potassium may have been dissolved and transported down to deeper levels. Micromorphology data from the uppermost Unit H1 shows the dominant presence of bone fragments. However, all bones show signs of dissolution (cause still unclear, Figure 9A) and often in a much worse state of preservation than the bone present in the acidic Pleistocene deposits. Due to the presence of high amounts of ash, the source of the P2O5 in the Holocene deposits is unclear. It may relate to (a combination) of ash, bone or the presence of animal excrement (e.g., from Rock hyrax: Procavia capensis) (Prinsloo, 2007; Chase et al., 2012). In addition, despite the clear high incidence of burning, the Holocene deposits have a low χLF signal and moderate to high χFD% values. This might be related to a diluting effect related to the presence of carbonates, caused by the high concentration of ash (van Os et al., 1994). The presence of finer SP domain minerals might relate to the presence of repeated burning, which is a common trend for inland sites in South Africa (Herries, 2009). It also suggests depositional conditions that allow for the preservation of such finer minerals, and for instance no post-depositional removal by water action. Finally, a shift in the geochemical data of the top two rows of the grid suggests that the top of Unit H1 might have been affected by modern contamination. For instance, car emissions from the nearby highway may have resulted in contamination with S, Zn, and Cu (Huisman et al., 1997; Chang et al., 2016). Other potential sources of contamination that should be considered are animal urine and feces, which can contain Cl, K2O, Zn, P2O5, and Cu (Prinsloo, 2007; Chase et al., 2012).
Environmental Change
In the absence of more in-depth analysis of other environmental proxies, such as, phytoliths (forthcoming), the MS data gives a first indication of environmental change at the site. The Group P deposits at Umhlatuzana have a magnetic sedimentary structure predominantly composed of finer SP domain minerals, as indicated by χFD% values exceeding 7%. However, some variation can still be observed. The bottom part of the sequence (z = <529.75) shows moderate to high χFD% values (Figures 8A,B). The upper part of the Pleistocene sequence (z = 529.75–530.25) shows lower χFD% values (Figures 8A,B). While most of these values still show a larger influence of SP magnetic minerals, these sediments consist of higher concentrations of coarser magnetic domains than those displaying the highest χFD% values in the sequence (e.g., those above 10%, Dearing et al., 1996b).
The low χFD% values at the top of the Pleistocene sequence are accompanied by low χLF values. This shift in magnetic properties within the Pleistocene deposits has two possible causes. First, it might be related to the increase in SiO2 visible in the geochemical data. The low χLF and χFD% values in the upper part of the Pleistocene sequence would then be the product of a decrease in the overall magnetic component of the sediments as a result of increased silica input. However, there is no indication of increased weathering of the rockshelter. Instead, the trend in the geochemical data most likely relates to a decrease in anthropogenic input (as evidenced by the find density data, see Sifogeorgaki et al., 2020), and does not reflect a direct increase in silica. Alternatively, the shift in magnetic properties within the Pleistocene sediments might relate to a change in the environmental conditions during the time of deposition. The movement of moisture through sediments can result in the removal of finer SP domain magnetic minerals from the deposits, since moisture has a tendency to remove finer domain minerals before it destabilizes larger domain minerals (Herries, 2006; Thompson and Oldfield, 1986). Therefore, the dominant presence of finer SP domain minerals in the lower part of the sequence could be taken as an indication of aridity during the formation of the deposits. Vice versa, the lower χFD% values in the upper part of the Pleistocene sequence might indicate deposition during a more humid phase where elevated moisture content has led to an overall coarsening of the magnetic minerals. However, the expected associated increase in χLF values is not observed in this part of the sequence. This can be explained by an overall decrease in the concentration of magnetic minerals, related to the decrease in Fe2O3 concentrations at the site, with the upper portion of the Pleistocene sequence having a much lower iron content than the bottom half of the Pleistocene deposits (Figures 6K,L). While this seems the most likely explanation of the observed trends, more in-depth micromorphological analysis is needed to confirm a potential difference in the frequency of secondary iron mineral formation. The switch from a dry period to a more humid period toward the end of the Pleistocene would match well with what is known about the local climate. Environmental data indicates that the region was wet during MIS 2 and 4, while it was drier during MIS 3 (Chase, 2010; Baker et al., 2014; Esteban et al., 2020). Based on previously obtained radiometric ages and assemblages, the Pleistocene deposits at Umhlatuzana, falling within the sampling grid, were deposited during MIS 3 and 2 (Lombard et al., 2010). Additional radiometric dating and paleoenvironmental work are necessary to test this, and are currently underway.
The Holocene deposits are characterized by moderately high χFD% values, suggesting that this part of the sequence was formed during a dry period. However, this does not match with the available paleoenvironmental data from the region, which suggests higher precipitation levels than in the preceding periods (Baker et al., 2014). Taking into account the intense anthropogenic component of the Group H sequence, the geogenic magnetic signal is likely obscured, especially since repeated burnings are known to create finer magnetic minerals (Herries, 2006; 2009).
Link to Archaeology/Anthropogenic Impact
The results of the grid samples (pH, XRF, MS) did not reveal clear layers within the Pleistocene deposits. However, they do show a correlation with the different higher- and lower-density zones apparent from the analysis of piece-plotted materials (Sifogeorgaki et al., 2020). The zones with the highest find density are located at the bottom of the Pleistocene deposits (Zone ZH4; Unit P14-17; Unit P6-11) and are separated by a low find density zone (Zone ZL3; Unit P12-13) (Figure 4). Toward the top of the sequence the find density decreases. This trend of a decrease in find density, and presumed occupation intensity, matches with the gradual changes observed in the geochemical composition of the sediments. As the anthropogenic input in the sediments decreases (e.g., P2O5, CaO, Sr, Zn) the relative contribution of quartz can be seen to increase.
The geochemical data suggests that the anthropogenic input increases drastically within the Holocene deposits, most of which derives from combustion activities. However, the increase in combustion activities is not reflected in the MS data. This is likely caused by a dilution of the MS signal of the sediments connected to the high ash-related carbonate content (van Os et al., 1994), combined with the resolution of the sampling grid. Curiously, the find density appears to be significantly lower within the Holocene (Sifogeorgaki et al., 2020). As piece-plotting during the renewed excavations was done using a 2 cm size threshold, this effect might be due to the microlithization that characterizes the LSA technocomplexes. Although a decrease in occupation intensity remains a distinct possibility (e.g., Reynard et al., 2016), a more likely explanation is that the increased anthropogenic input in the Holocene deposits (mainly ash) resulted in a higher sedimentation rate and a lower artefact-sediment ratio. In addition, this effect could have been enhanced by a shift in site use and activity areas. To confirm this a larger scale excavation of the site would be needed.
Contextualization of the Approach
This section discusses geoarchaeological studies from other rockshelters articulated in siliceous bedrock in an attempt to contextualize the results of the present paper. Geoarchaeological studies within a quartz-rich sandstone bedrock have been conducted on several southern African rockshelter sites like Eland’s Bay Cave (Miller et al., 2016), Diepkloof (Miller et al., 2013), Melikane rockshelter (Stewart et al., 2012), Mwulu Cave (de la Peña et al., 2018), Grassridge rockshelter (Ames et al., 2020), Sibudu (Goldberg et al., 2009), and Pinnacle Point (Karkanas and Goldberg, 2010). Most of these studies have been heavily focused on micromorphological analysis, while none of them have employed bulk sediment elemental analysis and only the Grassridge rockshelter study presents pH data. There is variation in bone and charcoal preservation rates, both between and within the different sites. For example, although Eland’s Bay Cave generally has a good bone preservation, it is reported that bones were completely absent within a ‘wetting front’ of the deposits (Miller et al., 2016). A similar trend is observed at Umhlatuzana, where the higher-moisture sediments display poor bone preservation. Unfortunately, no pH analyses have been reported at Eland’s Bay Cave, so moisture content and sediment pH cannot be correlated. The sediments of Grassridge rockshelter are alkaline and pH values are reported to range between 7.9 and 8.8. The pH remains high also in the lower deposits where a lack of evidence of combustion activity is reported (Ames et al., 2020). These values seem to be high when compared to pH analyses conducted on sandstone rockshelters globally. Some examples outside of South Africa include: Gledswood shelter 1 (Australia), which reports pH ranging from 5 to 5.5 (Lowe et al., 2018), Nonda Rock rockshelter (Australia) with pH ranging from 4.5 to 5.5 (David et al., 2007), Loberia I rockshelter (Argentina) where pH ranges from 3.7 to 5.8 (Martínez et al., 2013), and Santana do Riacho rockshelter (Brazil) with a pH from 4.4 to 6.4 (de Sousa et al., 2017). In comparison, Umhlatuzana displays quite high variation in pH values (4.87–8.94). While this difference suggests a more complex depositional setting at Umhlatuzana, it likely also results from the higher resolution of the grid sampling approach. MS analysis has been employed in Sibudu (Herries, 2006), Melikane (Stewart et al., 2012), and Pinnacle Point 13B (Herries and Fisher, 2010). However, only a study conducted at Pinnacle Point 5/6 used an approach comparable to the present study (Dinckal et al., submitted). At Pinnacle Point 5/6 MS was used to produce visual models, and to correlate that data with anthropogenic features to explore aspect of occupation at the site. The current study takes a similar approach to the Pinnacle Point 5/6 application, but further connects the results to other geoarchaeological methods by analyzing the same samples with multiple techniques. Overall, geoarchaeological studies conducted in South African rockshelters have been heavily focused on micromorphological analysis and cannot be directly compared to the current study.
Evaluation of the Approach
We systematically conducted a variety of geoarchaeological analyses to evaluate the stratigraphic sequence of Umhlatuzana rockshelter. This achieved a fine resolution geochemical overview of the deposits within the study area. The bulk (loose) sediment analyses performed are relatively inexpensive, fast, as well as easy to execute and interpret. Moreover, integrating bulk sediment analyses with field results and micromorphological analysis provides a link between macro and micro scale observations. Using a grid sampling strategy coupled with contour maps allows both a vertical and horizontal view of processes affecting the profile. Grid sampling is quite regularly used in archaeology to sample the horizontal X, Y plane. This happens at various scales, from dense grids in buildings to wide spatial grids in soils or settlements (e.g., Milek and Roberts, 2013; Canti and Huisman, 2015; Frahm et al., 2016). However, the approach is not used to sample profiles. When stratigraphic sections are sampled this commonly happens in vertical series, assuming horizontal homogeneity within a profile (e.g., Arroyo-Kalin, 2012; Barbosa et al., 2020).
The grid approach presented here allowed questions about post-depositional processes (e.g., mixing, preservation conditions) to be addressed in quite some detail, while also providing insight into environmental and anthropogenic impact on the sediment sequence. Current analyses were limited to one section, as only the western profile of the site was excavated. Future studies would benefit from performing the same approach on multiple sections of the same excavation. Finally, the simple but systematic set up will allow more in-depth comparisons with other sites, especially if more researchers adopt this kind of approach. At present, those comparisons are severely limited by the wide variation in sampling strategies and analytical choices.
Conclusion
The current study aimed to shed light on the visible and invisible geochemical variation within the deposits of Umhlatuzana rockshelter, and to answer questions relating to stratigraphic integrity, anthropogenic input, post-depositional processes, and environmental change. This was achieved by applying a grid-based sampling strategy to the full western profile of the site, and by integrating different geochemical proxies (i.e., pH, elemental composition, MS). Integration of this data with preliminary micromorphology observations allowed for a link between the macro and micro scale within the deposits. Based on this research the following conclusions can be drawn:
• The Pleistocene deposits are dominated by geogenic sediments, with clear anthropogenic input, and indications of biogenic materials (excrement). The geochemistry is characterized by a steady, gradual change related to increased geogenic and decreased anthropogenic input toward the top.
• The Holocene deposits are characterized by much higher anthropogenic input related to combustion activities. There are also indications of biogenic input in the deposits.
• The magnetic analysis shows that within the mostly homogenous sedimentary context there are still distinctive lateral and vertical variations within the deposits. This is primarily evidenced by variation in χFD% values, which suggest that the lower part of the Pleistocene sequence was deposited during a dry period, followed by accumulation of sediments during a wetter phase. The Holocene paleoenvironmental MS signal is likely obscured by the high anthropogenic input.
• The gradual change within the geochemical data indicates that no large-scale mixing happened at the site. Small-scale mixing related to bioturbation is visible in the micromorphological thin sections. There are strong indications that the uppermost unit is severely mixed.
• The preservation at the site is driven by the variation in pH, with acidic values in the Pleistocene deposits and alkaline conditions in the Holocene. The pH in the Holocene was buffered by the presence of large amounts of ash.
• Variation in the χFD% values in the bottom part of the sequence indicates that the increase in moisture content (lower South corner of the profile) occurred post-depositionally.
• Different geochemical techniques were successfully integrated, using a grid-based sampling strategy, to better understand the depositional and post-depositional history of the site.
• The concept is simple to execute, fast, and relatively low-cost. The systematic approach allows for more in-depth comparison with other sites, once it is applied more broadly.
Data Availability Statement
The original contributions presented in the study are included in the article/Supplementary Material, further inquiries can be directed to the corresponding author.
Author Contributions
The concept and methodological approach of the study were developed by FR and IS. Sampling, sample preparation, and pH analysis were also done by FR and IS. XRF analysis was done by FR and IS, with assistance from GD. XRF data processing was done by BO. MS analysis was performed by MS, and MS data processing was done by AD. Micromorphology samples were taken, prepared, and analyzed by IS, with assistance from HH. The pH and XRF data were analyzed by FR, with input from BO and HH. The MS data was analyzed by AD and FR. Integration and interpretation of the full dataset was done through discussions with all authors. Elevation plots and contour maps were made by BO, MS plots and heat maps were made by AD. All other images were prepared for publication by IS. The manuscript was written by FR and IS, with contributions from GD, AD, and BO. All authors provided feedback at various stages of the writing process. Funding for the project was provided by GD, who also coordinated the fieldwork campaign.
Funding
The research is funded by NWO Vidi Grant 276-60-004 to Gerrit Dusseldorp.
Conflict of Interest
The authors declare that the research was conducted in the absence of any commercial or financial relationships that could be construed as a potential conflict of interest.
Acknowledgments
We thank Vumani Madinani, Jan Dekker, Guus Halewijn, Chris Thornhill, and Len van Schalkwyk for assistance in the field during the 2019 season when sampling was conducted. The KwaZulu-Natal Museum, Department of Human Sciences, Geoff Blundell, Ghilraen Laue Phumulani Madonda, Mudzunga Munzhedzi, Dimakatso Tlhoalele, and Gavin Whitelaw, supported our excavations. We thank SAHRA and AMAFA aKwaZulu-Natali, for issuing the requisite permits. Lastly, we thank the editors and the two reviewers for their valuable input to improve our manuscript.
Supplementary Material
The Supplementary Material for this article can be found online at: https://www.frontiersin.org/articles/10.3389/feart.2021.664105/full#supplementary-material
References
Ames, C. J. H., Gliganic, L., Cordova, C. E., Boyd, K., Jones, B. G., Maher, L., et al. (2020). Chronostratigraphy, Site Formation, and Palaeoenvironmental Context of Late Pleistocene and Holocene Occupations at Grassridge Rock Shelter (Eastern Cape, South Africa). Open Quat. 6, 5. doi:10.5334/OQ.77
Arroyo-Kalin, M. (2012). Slash-burn-and-churn: Landscape History and Crop Cultivation in Pre-columbian Amazonia. Quat. Int. 249, 4–18. doi:10.1016/j.quaint.2011.08.004
Auler, A. S., Meus, P., and Pessoa, P. F. P. (2020). “Water Tracing Experiments in Low-pH Quartzite Karst Water, Chapada Diamantina, Northeastern Brazil,” Adv. Karst Sci. Editors C. Bertrand, S. Denimal, M. Steinmann, and P. Renard (Cham: Springer), 183–191. doi:10.1007/978-3-030-14015-1_21
Bader, G. D., Linstädter, J., and Schoeman, M. H. (2020). Uncovering the Late Pleistocene LSA of Mpumalanga Province, South Africa: Early Results from Iron Pig Rock Shelter. J. Afr. Arch. 18, 19–37. doi:10.1163/21915784-20200003
Bader, G. D., Tribolo, C., and Conard, N. J. (2018). A Return to Umbeli Belli: New Insights of Recent Excavations and Implications for the Final MSA of Eastern South Africa. J. Archaeological Sci. Rep. 21, 733–757. doi:10.1016/j.jasrep.2018.08.043
Baker, A., Routh, J., Blaauw, M., and Roychoudhury, A. N. (2014). Geochemical Records of Palaeoenvironmental Controls on Peat Forming Processes in the Mfabeni Peatland, Kwazulu Natal, South Africa since the Late Pleistocene. Palaeogeogr. Palaeoclimatol. Palaeoecol. 395, 95–106. doi:10.1016/j.palaeo.2013.12.019
Barbosa, J. Z., Motta, A. C. V., Corrêa, R. S., Melo, V. d. F., Muniz, A. W., Martins, G. C., et al. (2020). Elemental Signatures of an Amazonian Dark Earth as Result of its Formation Process. Geoderma. 361, 114085. doi:10.1016/j.geoderma.2019.114085
Bousman, C. B., and Brink, J. S. (2018). The Emergence, Spread, and Termination of the Early Later Stone Age Event in South Africa and Southern Namibia. Quat. Int. 495, 116–135. doi:10.1016/j.quaint.2017.11.033
Braadbaart, F., Reidsma, F. H., Roebroeks, W., Chiotti, L., Slon, V., Meyer, M., et al. (2020). Heating Histories and Taphonomy of Ancient Fireplaces: A Multi-Proxy Case Study from the Upper Palaeolithic Sequence of Abri Pataud (Les Eyzies-De-Tayac, France). J. Archaeological Sci. Rep. 33, 102468. doi:10.1016/j.jasrep.2020.102468
Bronk Ramsey, C. (1995). Radiocarbon Calibration and Analysis of Stratigraphy: the OxCal Program. Radiocarbon. 37, 425–430. doi:10.1017/s0033822200030903
Bruch, A. A., Sievers, C., and Wadley, L. (2012). Quantification of Climate and Vegetation from Southern African Middle Stone Age Sites - an Application Using Late Pleistocene Plant Material from Sibudu, South Africa. Quat. Sci. Rev. 45, 7–17. doi:10.1016/j.quascirev.2012.04.005
Canti, M., and Huisman, D. J. (2015). Scientific Advances in Geoarchaeology during the Last Twenty Years. J. Archaeological Sci. 56, 96–108. doi:10.1016/j.jas.2015.02.024
Chang, C., Han, C., Han, Y., Hur, S. D., Lee, S., Motoyama, H., et al. (2016). Persistent Pb Pollution in central East Antarctic Snow: A Retrospective Assessment of Sources and Control Policy Implications. Environ. Sci. Technol. 50, 12138–12145. doi:10.1021/acs.est.6b03209
Chase, B. M., Scott, L., Meadows, M. E., Gil-Romera, G., Boom, A., Carr, A. S., et al. (2012). Rock Hyrax Middens: A Palaeoenvironmental Archive for Southern African Drylands. Quat. Sci. Rev. 56, 107–125. doi:10.1016/j.quascirev.2012.08.018
Chase, B. M. (2010). South African Palaeoenvironments during marine Oxygen Isotope Stage 4: a Context for the Howiesons Poort and Still Bay Industries. J. Archaeological Sci. 37, 1359–1366. doi:10.1016/j.jas.2009.12.040
Clark, J. L. (2013). Exploring the Relationship between Climate Change and the Decline of the Howieson's Poort at Sibudu Cave (South Africa). Vertebr. Paleobiology Paleoanthropology. 14, 9–18. doi:10.1007/978-94-007-6766-9_2
Clark, P. U., Dyke, A. S., Shakun, J. D., Carlson, A. E., Clark, J., Wohlfarth, B., et al. (2009). The Last Glacial Maximum. Science 325, 710–714. doi:10.1126/science.1172873
Conrad, O., Bechtel, B., Bock, M., Dietrich, H., Fischer, E., Gerlitz, L., et al. (2015). System for Automated Geoscientific Analyses (SAGA) V. 2.1.4. Geosci. Model. Dev. 8, 2007. doi:10.5194/gmd-8-1991-2015
Courty, M. A., Goldberg, P. S., and Macphail, R. I. (1989). Soils and Micromorphology in Archaeology. Cambridge: Cambridge University Press.
d'Errico, F., Backwell, L., Villa, P., Degano, I., Lucejko, J. J., Bamford, M. K., et al. (2012). Early Evidence of San Material Culture Represented by Organic Artifacts from Border Cave, South Africa. Proc. Natl. Acad. Sci. U.S.A. 109, 13214–13219. doi:10.1073/pnas.1204213109
David, B., Roberts, R. G., Magee, J., Mialanes, J., Turney, C., Bird, M., et al. (2007). Sediment Mixing at Nonda Rock: Investigations of Stratigraphic Integrity at an Early Archaeological Site in Northern Australia and Implications for the Human Colonisation of the Continent. J. Quat. Sci. 22, 449–479. doi:10.1002/jqs.1136
de la Peña, P., Val, A., Stratford, D. J., Colino, F., Esteban, I., Fitchett, J. M., et al. (2018). Revisiting Mwulu's Cave: New Insights into the Middle Stone Age in the Southern African savanna Biome. Archaeol. Anthropol. Sci. 11, 3239–3266. doi:10.1007/s12520-018-0749-9
de Sousa, D. V., Ker, J. C., Prous, A., Schaefer, C. E. G. R., Rodet, M. J., Oliveira, F. S., et al. (2017). Archaeoanthrosol Formation and Evolution of the “Santana Do Riacho” Archaeological Shelter: An Old Burial Site in South America. Geoarchaeology 32, 678–693. doi:10.1002/gea.21645
Deacon, H. J. (1999). in Human Beginnings in South Africa: Uncovering the Secrets of the Stone Age. Editor J. Deacon Cape Town (New York: David Philip).
Dearing, J. A., Dann, R. J. L., Hay, K., Lees, J. A., Loveland, P. J., Maher, B. A., et al. (1996a). Frequency-dependent Susceptibility Measurements of Environmental Materials. Geophys. J. Int. 124, 228–240. doi:10.1111/j.1365-246X.1996.tb06366.x
Dearing, J. A., Hay, K. L., Baban, S. M. J., Huddleston, A. S., Wellington, E. M. H., and Loveland, P. J. (1996b). Magnetic Susceptibility of Soil: an Evaluation of Conflicting Theories Using a National Data Set. Geophys. J. Int. 127, 728–734. doi:10.1111/j.1365-246X.1996.tb04051.x
Esteban, I., Bamford, M. K., House, A., Miller, C. S., Neumann, F. H., Schefuß, E., et al. (2020). Coastal Palaeoenvironments and hunter-gatherer Plant-Use at Waterfall Bluff Rock Shelter in Mpondoland (South Africa) from MIS 3 to the Early Holocene. Quat. Sci. Rev. 250, 106664. doi:10.1016/j.quascirev.2020.106664
Frahm, E., Monnier, G. F., Jelinski, N. A., Fleming, E. P., Barber, B. L., and Lambon, J. B. (2016). Chemical Soil Surveys at the Bremer Site (Dakota County, Minnesota, USA): Measuring Phosphorous Content of Sediment by Portable XRF and ICP-OES. J. Archaeological Sci. 75, 115–138. doi:10.1016/j.jas.2016.10.004
Frassinetti, S., Bronzetti, G. L., Caltavuturo, L., Cini, M., and Croce, C. D. (2006). The Role of Zinc in Life: A Review. J. Environ. Pathol. Toxicol. Oncol. 25, 597–610. doi:10.1615/JEnvironPatholToxicolOncol.v25.i3.40
Goldberg, P., Miller, C. E., Schiegl, S., Ligouis, B., Berna, F., Conard, N. J., et al. (2009). Bedding, Hearths, and Site Maintenance in the Middle Stone Age of Sibudu Cave, KwaZulu-Natal, South Africa. Archaeol. Anthropol. Sci. 1, 95–122. doi:10.1007/s12520-009-0008-1
Gräler, B., Pebesma, E., and Heuvelink, G. (2016). Spatio-temporal Interpolation Using Gstat. R. J. 8, 204–218. doi:10.32614/rj-2016-014
Grove, M., and Blinkhorn, J. (2020). Neural Networks Differentiate between Middle and Later Stone Age Lithic Assemblages in Eastern Africa. PLoS One. 15, e0237528. doi:10.1371/journal.pone.0237528
Hanesch, M., and Scholger, R. (2005). The Influence of Soil Type on the Magnetic Susceptibility Measured throughout Soil Profiles. Geophys. J. Int. 161, 50–56. doi:10.1111/j.1365-246X.2005.02577.x
Henshilwood, C. S. (2012). Late Pleistocene Techno-Traditions in Southern Africa: A Review of the Still Bay and Howiesons Poort, C. 75-59 Ka. J. World Prehist. 25, 205–237. doi:10.1007/s10963-012-9060-3
Herries, A. I. R. (2006). Archaeomagnetic Evidence for Climate Change at Sibudu Cave. Available at: http://www.sahumanities.org.za (Accessed January 25, 2021).
Herries, A. I. R., and Fisher, E. C. (2010). Multidimensional GIS Modeling of Magnetic Mineralogy as a Proxy for Fire Use and Spatial Patterning: Evidence from the Middle Stone Age Bearing Sea Cave of Pinnacle Point 13B (Western Cape, South Africa). J. Hum. Evol. 59, 306–320. doi:10.1016/J.JHEVOL.2010.07.012
Herries, A. I. R. (2009). “New Approaches for Integrating Palaeomagnetic and mineral Magnetic Methods to Answer Archaeological and Geological Questions on Stone Age Sites.” In New Directions in Archaeological Science, Editors. A. Fairbairn, S. O’Conner, and B. Marwick (London: ANU Press), 235–253.doi:10.22459/TA28.02.2009.16
Högberg, A., and Lombard, M. (2016a). Indications of Pressure Flaking More Than 70 Thousand Years Ago at Umhlatuzana Rock Shelter. South African Archaeol. Bull. 71, 53–59. doi:10.1371/journal.pone.0168012
Högberg, A., and Lombard, M. (2016b). Still Bay Point-Production Strategies at Hollow Rock Shelter and Umhlatuzana Rock Shelter and Knowledge-Transfer Systems in Southern Africa at about 80-70 Thousand Years Ago. PLoS One 11, e0168012. doi:10.1371/journal.pone.0168012
Holcomb, J. A., and Karkanas, P. (2019). Elemental Mapping of Micromorphological Block Samples Using Portable X‐ray Fluorescence Spectrometry (pXRF): Integrating a Geochemical Line of Evidence. Geoarchaeology 34, 613–624. doi:10.1002/gea.21741
Huisman, D. J., Vermeulen, F. J. H., Baker, J., Veldkamp, A., Kroonenberg, S. B., and Klaver, G. T. (1997). A Geological Interpretation of Heavy Metal Concentrations in Soils and Sediments in the Southern Netherlands. J. Geochemical Exploration 59, 163–174. doi:10.1016/S0375-6742(97)00018-6
Jacobs, Z., Roberts, R. G., Galbraith, R. F., Deacon, H. J., Grün, R., Mackay, A., et al. (2008). Ages for the Middle Stone Age of Southern Africa: Implications for Human Behavior and Dispersal. Science 322, 733–735. doi:10.1126/science.1162219
Kaplan, J. M. (1989). 45000 Years of hunter-gatherer History in Natal as Seen from Umhlatuzana Rock Shelter. Goodwin Ser. 6, 7–16. doi:10.2307/3858128
Kaplan, J. M. (1990). The Umhlatuzana Rock Shelter Sequence: 100 000 Years of Stone Age History. South. Afr. Humanit. 2, 1–94.
Karkanas, P., Bar-Yosef, O., Goldberg, P., and Weiner, S. (2000). Diagenesis in Prehistoric Caves: the Use of Minerals that Form In Situ to Assess the Completeness of the Archaeological Record. J. Archaeological Sci. 27, 915–929. doi:10.1006/jasc.1999.0506
Karkanas, P., and Goldberg, P. (2010). Site Formation Processes at Pinnacle Point Cave 13B (Mossel Bay, Western Cape Province, South Africa): Resolving Stratigraphic and Depositional Complexities with Micromorphology. J. Hum. Evol. 59, 256–273. doi:10.1016/J.JHEVOL.2010.07.001
Karkanas, P., and Goldberg, P. (2018). Reconstructing Archaeological Sites: Understanding the Geoarchaeological Matrix. Hoboken, NJ: John Wiley & Sons. doi:10.1002/9781119016427
Loftus, E., Pargeter, J., Mackay, A., Stewart, B. A., and Mitchell, P. (2019). Late Pleistocene Human Occupation in the Maloti-Drakensberg Region of Southern Africa: New Radiocarbon Dates from Rose Cottage Cave and Inter-site Comparisons. J. Anthropological Archaeology 56, 101117. doi:10.1016/j.jaa.2019.101117
Lombard, M. (2007). The Gripping Nature of Ochre: The Association of Ochre with Howiesons Poort Adhesives and Later Stone Age Mastics from South Africa. J. Hum. Evol. 53, 406–419. doi:10.1016/j.jhevol.2007.05.004
Lombard, M. (2011). Quartz-tipped Arrows Older Than 60 Ka: Further Use-Trace Evidence from Sibudu, KwaZulu-Natal, South Africa. J. Archaeological Sci. 38, 1918–1930. doi:10.1016/j.jas.2011.04.001
Lombard, M., Wadley, L., Deacon, J., Wurz, S., Parsons, I., Mohapi, M., et al. (2012). South African and Lesotho Stone Age Sequence Updated. South African Archaeol. Bull. 67, 123–144. doi:10.2307/3888989
Lombard, M., Wadley, L., Jacobs, Z., Mohapi, M., and Roberts, R. G. (2010). Still Bay and Serrated Points from Umhlatuzana Rock Shelter, Kwazulu-Natal, South Africa. J. Archaeological Sci. 37, 1773–1784. doi:10.1016/j.jas.2010.02.015
Lowe, K. M., Mentzer, S. M., Wallis, L. A., and Shulmeister, J. (2018). A Multi-Proxy Study of Anthropogenic Sedimentation and Human Occupation of Gledswood Shelter 1: Exploring an interior sandstone Rockshelter in Northern Australia. Archaeol. Anthropol. Sci. 10, 279–304. doi:10.1007/s12520-016-0354-8
Mackay, A., Stewart, B. A., and Chase, B. M. (2014). Coalescence and Fragmentation in the Late Pleistocene Archaeology of Southernmost Africa. J. Hum. Evol. 72, 26–51. doi:10.1016/j.jhevol.2014.03.003
Macphail, R. I., and Goldberg, P. (2017). Applied Soils and Micromorphology in Archaeology. Cambridge: Cambridge University Press. doi:10.1017/9780511895562
Marshall, C. A. G. (1994). The Stratigraphy of the Natal Group. Master’s Thesis. Pietermaritzburg: University of Natal.
Martínez, G. A., Mazzanti, D. L., Quintana, C., Zucol, A. F., Colobig, M. d. l. M., Hassan, G. S., et al. (2013). Geoarchaeological and Paleoenvironmental Context of the Human Settlement in the Eastern Tandilia Range, Argentina. Quat. Int. 299, 23–37. doi:10.1016/j.quaint.2012.12.032
McCall, G. S., and Thomas, J. T. (2009). Re-examining the South African Middle-To-Later Stone Age Transition: Multivariate Analysis of the Umhlatuzana and Rose Cottage Cave Stone Tool Assemblages. Azania: Archaeological Res. Africa. 44, 311–330. doi:10.1080/00672700903337519
McKenzie, R. (1989). Manganese Oxides and Hydroxides. Minerals in Soil Environments. Hoboken: John Wiley & Sons.
Mecchia, M., Sauro, F., Piccini, L., De Waele, J., Sanna, L., Tisato, N., et al. (2014). Geochemistry of Surface and Subsurface Waters in Quartz-Sandstones: Significance for the Geomorphic Evolution of Tepui Table Mountains (Gran Sabana, Venezuela). J. Hydrol. 511, 117–138. doi:10.1016/j.jhydrol.2014.01.029
Milek, K. B., and Roberts, H. M. (2013). Integrated Geoarchaeological Methods for the Determination of Site Activity Areas: A Study of a Viking Age House in Reykjavik, Iceland. J. Archaeological Sci. 40, 1845–1865. doi:10.1016/j.jas.2012.10.031
Miller, C. E., Goldberg, P., and Berna, F. (2013). Geoarchaeological Investigations at Diepkloof Rock Shelter, Western Cape, South Africa. J. Archaeological Sci. 40, 3432–3452. doi:10.1016/J.JAS.2013.02.014
Miller, C. E., Mentzer, S. M., Berthold, C., Leach, P., Ligouis, B., Tribolo, C., et al. (2016). Site-formation Processes at Elands Bay Cave, South Africa. South. Afr. Humanit. 29, 69–128. doi:10.30861/9780860545842
Mitchell, P. (1988). The Late Pleistocene Early Microlithic Assemblages of Southern Africa. World Archaeology 20, 27–39. doi:10.1080/00438243.1988.9980054
Mohapi, M. (2013). The Middle Stone Age point Assemblage from Umhlatuzana Rock Shelter: a Morphometric Study. South. Afr. Humanit. 1, 25–51. doi:10.30861/9780860545217
Mucina, L., and Rutherford, M. C. (2006). The Vegetation of South Africa, Lesotho and Swaziland. Pretoria: South African National Biodiversity Institute.
Nel, W. (2009). Rainfall Trends in the KwaZulu-Natal Drakensberg Region of South Africa during the Twentieth century. Int. J. Climatol. 29, 1634–1641. doi:10.1002/joc.1814
Nriagu, J. O. (1976). Phosphate - clay mineral Relations in Soils and Sediments. Can. J. Earth Sci. 13, 717–736. doi:10.1139/e76-077
van Os, B., de Kort, J. W., and Huisman, H. (2012). A Qualitative Approach for Assessment of the Burial Environment by Interpreting Soil Characteristics; A Necessity for Archaeological Monitoring. Conservation Management Archaeological Sites 14, 333–340. doi:10.1179/1350503312Z.00000000029
Pargeter, J., Loftus, E., and Mitchell, P. (2017). New Ages from Sehonghong Rock Shelter: Implications for the Late Pleistocene Occupation of highland Lesotho. J. Archaeological Sci. Rep. 12, 307–315. doi:10.1016/j.jasrep.2017.01.027
Pebesma, E. J. (2004). Multivariable Geostatistics in S: The Gstat Package. Comput. Geosciences 30, 683–691. doi:10.1016/j.cageo.2004.03.012
Porraz, G., Parkington, J. E., Rigaud, J.-P., Miller, C. E., Poggenpoel, C., Tribolo, C., et al. (2013). The MSA Sequence of Diepkloof and the History of Southern African Late Pleistocene Populations. J. Archaeological Sci. 40, 3542–3552. doi:10.1016/j.jas.2013.02.024
Prinsloo, L. C. (2007). Rock Hyraces: a Cause of San Rock Art Deterioration?. J. Raman Spectrosc. 38, 496–503. doi:10.1002/jrs.1671
Reidsma, F. H., van Hoesel, A., van Os, B. J. H., Megens, L., and Braadbaart, F. (2016). Charred Bone: Physical and Chemical Changes during Laboratory Simulated Heating under Reducing Conditions and its Relevance for the Study of Fire Use in Archaeology. J. Archaeological Sci. Rep. 10, 282–292. doi:10.1016/j.jasrep.2016.10.001
Reynard, J. P., Discamps, E., Wurz, S., van Niekerk, K. L., Badenhorst, S., and Henshilwood, C. S. (2016). Occupational Intensity and Environmental Changes during the Howiesons Poort at Klipdrift Shelter, Southern Cape, South Africa. Palaeogeogr. Palaeoclimatol. Palaeoecol. 449, 349–364. doi:10.1016/j.palaeo.2016.02.035
Rots, V., Lentfer, C., Schmid, V. C., Porraz, G., and Conard, N. J. (2017). Pressure Flaking to Serrate Bifacial Points for the hunt during the MIS5 at Sibudu Cave (South Africa). PLoS One 12, e0175151. doi:10.1371/journal.pone.0175151
Sauro, F., Mecchia, M., Piccini, L., De Waele, J., Carbone, C., Columbu, A., et al. (2019). Genesis of Giant Sinkholes and Caves in the Quartz sandstone of Sarisariñama Tepui, Venezuela. Geomorphology 342, 223–238. doi:10.1016/j.geomorph.2019.06.017
Sayre, R., Karagulle, D., Frye, C., Boucher, T., Wolff, N. H., Breyer, S., et al. (2020). An Assessment of the Representation of Ecosystems in Global Protected Areas Using New Maps of World Climate Regions and World Ecosystems. Glob. Ecol. Conservation 21, e00860. doi:10.1016/j.gecco.2019.e00860
Sifogeorgaki, I., Klinkenberg, V., Esteban, I., Murungi, M., Carr, A. S., van den Brink, V. B., et al. (2020). New Excavations at Umhlatuzana Rockshelter, KwaZulu-Natal, South Africa: a Stratigraphic and Taphonomic Evaluation. Afr. Archaeol Rev. 37, 551–578. doi:10.1007/s10437-020-09410-w
Simon, M. H., Arthur, K. L., Hall, I. R., Peeters, F. J. C., Loveday, B. R., Barker, S., et al. (2013). Millennial-scale Agulhas Current Variability and its Implications for Salt-Leakage through the Indian-Atlantic Ocean Gateway. Earth Planet. Sci. Lett. 383, 101–112. doi:10.1016/j.epsl.2013.09.035
Simon, M. H., Ziegler, M., Bosmans, J., Barker, S., Reason, C. J. C., and Hall, I. R. (2015). Eastern South African Hydroclimate over the Past 270,000 Years. Sci. Rep. 5, 18153. doi:10.1038/srep18153
Stewart, B. A., Dewar, G. I., Morley, M. W., Inglis, R. H., Wheeler, M., Jacobs, Z., et al. (2012). Afromontane Foragers of the Late Pleistocene: Site Formation, Chronology and Occupational Pulsing at Melikane Rockshelter, Lesotho. Quat. Int. 270, 40–60. doi:10.1016/j.quaint.2011.11.028
Stoops, G. (2003). Guidelines for Analysis and Description of Soil and Regolith Thin Sections. Editor M. J. Vepraskas. (Madison:Soil Science Society of America).
Stoops, G., Marcelino, V., and Mees, F. (2010). Interpretation of Micromorphological Features of Soils and Regoliths. (Amsterdam: Elsevier), 663–705. doi:10.1016/C2009-0-18081-9
Stoops, G., and Nicosia, C. (2017). “Sampling for Soil Micromorphology,” in In Archaeological Soil and Sediment Micromorphology (Chichester: John Wiley & Sons, Ltd), 383–391. doi:10.1002/9781118941065.ch35
Taylor, S. R., and McLennan, S. M. (1985). The Continental Crust: Its Composition and Evolution. United States. Berlin: Springer.
Thompson, R., and Oldfield, F. (1986). Environmental Magnetism. Earth-science Rev. 26, 54–55. doi:10.1016/0012-8252(89)90007-X
van Breemen, N., and Wielemaker, W. G. (1974). Buffer Intensities and Equilibrium pH of Minerals and Soils: I. The Contribution of Minerals and Aqueous Carbonate to pH Buffering. Soil Sci. Soc. America J. 38, 55–60. doi:10.2136/sssaj1974.03615995003800010022x
van Os, B. J. H., Lourens, L. J., Hilgen, F. J., De Lange, G. J., and Beaufort, L. (1994). The Formation of Pliocene Sapropels and Carbonate Cycles in the Mediterranean: Diagenesis, Dilution, and Productivity. Paleoceanography 9, 601–617. doi:10.1029/94PA00597
Vassilev, S. V., Baxter, D., and Vassileva, C. G. (2014). An Overview of the Behaviour of Biomass during Combustion: Part II. Ash Fusion and Ash Formation Mechanisms of Biomass Types. Fuel 117, 152–183. doi:10.1016/j.fuel.2013.09.024
Villa, P., Soriano, S., Tsanova, T., Degano, I., Higham, T. F. G., d'Errico, F., et al. (2012). Border Cave and the Beginning of the Later Stone Age in South Africa. Proc. Natl. Acad. Sci. 109, 13208–13213. doi:10.1073/pnas.1202629109
Wadley, L. (2005). A Typological Study of the Final Middle Stone Age Tools from Sibudu Cave Kwazulu-Natal. South African Archaeol. Bull. 60, 51–63. doi:10.3213/2191-5784-10246
Weiner, S. (2010). Microarchaeology: Beyond the Visible Archaeological Record. Cambridge: Cambridge University Press. doi:10.1017/cbo9780511811210
Welch, R. M. (1993). “Zinc Concentrations and Forms in Plants for Humans and Animals,” in Zinc in Soils and Plants: Proceedings of the International Symposium on ‘Zinc in Soils and Plants. Editor A. D. Robson (Dordrecht: Springer Netherlands), 183–195. doi:10.1007/978-94-011-0878-2_13
Wickham, H. (2016). ggplot2: Elegant Graphics for Data Analysis. New York: SpringerAvailable at: https://ggplot2.tidyverse.org
Yokoyama, Y., Esat, T. M., Thompson, W. G., Thomas, A. L., Webster, J. M., Miyairi, Y., et al. (2018). Rapid Glaciation and a Two-step Sea Level Plunge into the Last Glacial Maximum. Nature. 559, 603–607. doi:10.1038/s41586-018-0335-4
Keywords: geochemistry, stratigraphy, Stone Age, pH, XRF, micromorphology, geoarchaeology, magnetic susceptibility
Citation: Reidsma FH, Sifogeorgaki I, Dinckal A, Huisman H, Sier MJ, van Os B and Dusseldorp GL (2021) Making the Invisible Stratigraphy Visible: A Grid-Based, Multi-Proxy Geoarchaeological Study of Umhlatuzana Rockshelter, South Africa. Front. Earth Sci. 9:664105. doi: 10.3389/feart.2021.664105
Received: 04 February 2021; Accepted: 15 June 2021;
Published: 05 July 2021.
Edited by:
Christian Zeeden, Leibniz Institute for Applied Geophysics (LIAG), GermanyReviewed by:
Michael B. Toffolo, Université Bordeaux Montagne, FranceMareike Stahlschmidt, Max Planck Institute for Evolutionary Anthropology, Germany
Copyright © 2021 Reidsma, Sifogeorgaki, Dinckal, Huisman, Sier, van Os and Dusseldorp. This is an open-access article distributed under the terms of the Creative Commons Attribution License (CC BY). The use, distribution or reproduction in other forums is permitted, provided the original author(s) and the copyright owner(s) are credited and that the original publication in this journal is cited, in accordance with accepted academic practice. No use, distribution or reproduction is permitted which does not comply with these terms.
*Correspondence: Femke H. Reidsma, Zi5oLnJlaWRzbWFAYXJjaC5sZWlkZW51bml2Lm5s
†These authors have contributed equally to this work and share first authorship