 M. Bracale
 S. Colombelli
 L. Elia
 V. Karakostas
 A. Zollo
- 1Department of Physics, University of Naples Federico II, Naples, Italy
- 2Department of Geophysics, Aristotle University of Thessaloniki, Thessaloniki, Greece
In this study we implemented and tested the Earthquake Early Warning system PRESTo (PRobabilistic and Evolutionary early warning System, Satriano et al., 2011) on the Greek Ionian islands of Lefkada, Zakynthos and Kefalonia. PRESTo is a free and open source platform for regional Earthquake Early Warning developed at the University of Naples Federico II, which is currently under experimentation in Southern Italy, in the area covered by the Irpinia Seismic Network. The three Ionian islands selected for this study are located on the North-Western part of the Hellenic trench. Here the seismicity rate and the seismic hazard, coupled with the vulnerability of existing critical infrastructures, make this region among the highest seismic risk areas in Europe, where the application of Earthquake Early Warning systems may become a useful strategy to mitigate the potential damage caused by earthquakes. Here we studied the feasibility of implementing an Earthquake Early Warning system on an existing seismic network, which was not specifically made for earthquake early warning purposes, and evaluated the performance of the system, using a data set of real-earthquake recordings. We first describe the technical details of the implementation of PRESTo in the area of interest, including the preliminary parameter configuration and the empirical scaling relationship calibration. Then we evaluated the performance of the system through the off-line analysis of a database of real earthquake records belonging to the most recent M > 4.0 earthquakes occurred in the area. We evaluated the performance in terms of source parameter estimation (location, magnitude), accuracy of ground shaking prediction and lead-time analysis. Finally, we show the preliminary results of the real-time application of PRESTo, performed during the period 01–31 July 2019.
Introduction
Every year devastating earthquakes cause enormous damage in terms of lives and serious threats for human activities in the active seismic regions of the world. During the last 20 years the development of Earthquake Early Warning Systems (EEWS) has allowed to reduce the potential damage directly related to the strong shaking caused by earthquakes or indirectly produced by fires, explosions, tsunamis and other phenomena triggered by the seismic event. Recent examples of successful applications of EEWS are the two earthquakes that occurred in Mexico in September 2017 (Suárez et al., 2018). During the Mw 8.2, September, 7 Tehuantepec earthquake, the Mexican alert system SASMEX gave almost 2 min of warning to Mexico city, prior to the arrival of the strong-motion seismic waves. The second example is the Mw 7.1 Morelos earthquake occurred on September 19, 2017, for which the short epicentral distance to Mexico City allowed for a few seconds of warning prior to the arrival of the S waves. In both cases, the warning was used to start public measures for reducing human losses in the city, including prompt evacuation of schools and buildings. Another relevant example of successful application of EEW alerts is the case of the Mw 9.0 Tohoku-oki (Japan) earthquake. At the time of that earthquake and tsunami, several million people near the epicenter received the EEW about 15–20 s before the most severe shaking occurred, and many more people in surrounding districts had greater lead time before less severe shaking started. About 90% of these people were able to take advance actions to save their own lives and those of family members or to take other actions according to prior planning (Fujinawa and Noda, 2013).
An EEWS is a complex, monitoring infrastructure able to quickly detect an ongoing earthquake, estimate its potential damage and provide an alert message to the target sites, before the arrival of the destructive waves. This is possible thanks to the different velocity of propagation between the P-waves and the S-waves and to the different velocity of propagation between seismic waves (travelling at the speed of ∼3.5–6.5 km/s in the upper crust) and electromagnetic signals (i.e., the alarm signal, travelling at the speed of light). In case of a potentially damaging earthquake, a notification is sent to the target site where the time available from the moment of the alert release to the arrival of the strongest shaking can be used to activate emergency procedures and automatic mechanisms to mitigate the collateral damage, such as to stop elevators, machinery, high speed trains or to stop gas supplies to building (Allen et al., 2009).
Most of the existing EEWSs are based on regional (network-based) or on-site (single-station) configurations, depending on the geometry of the network and of its relative position with respect to the source area (Satriano et al., 2011). The regional configuration consists of a network of stations deployed in the source area, while target sites to be protected are situated far away from it. In this configuration, the near-source, early P-wave signals collected at the stations are used to detect the occurrence of the earthquake, determine its location and magnitude and estimate its shaking potential to nearby and distant sites through the use of empirical attenuation relationships. The alert notification can reach the site to protect within a variable time from the earthquake origin, which typically range from a few seconds (at very short distances from the source), to several tens of seconds (at hundreds kilometers from the source).
Occasionally, the near-source S-wave signals are also used jointly to the P-waves, to better constrain the real-time magnitude estimate (Lancieri and Zollo, 2008), although accurate, automatic, estimation of the first S-wave arrival is a difficult task, due to the high noise contamination related to the presence of large amplitude P-wave coda.
On-site or stand-alone early warning systems are individual or small-aperture array of sensors deployed in proximity of the target site to protect. In this case, the initial P-wave signals are analysed and used as proxies of the late arriving, strongest shaking waves at the same site, with no or poor available information on the earthquake source parameters (such as location and magnitude) (Wu et al., 2005; Caruso et al., 2017). Finally, hybrid approaches are based on the joint use of both regional and on-site configurations, as proposed by Zollo et al. (2021) and Colombelli et al. (2012).
During the last decade the implementation of EEWS is increasing all over the world. Operative systems are currently running in, Japan (Hoshiba, 2014), Mexico (Cuéllar et al., 2014), California (Kohler et al., 2017), Taiwan (Wu et al., 2014) and Romania (Böse et al., 2007), while EEWS development and testing are ongoing in several other active seismic regions of the world, such as Turkey, Switzerland, North Korea, China, Ibero-Maghrebian region (Allen et al., 2009; Clinton et al., 2016). In Italy, currently, the system PRESTo (Satriano et al., 2011) is running in Southern Italy, having the Irpinia Seismic Network (ISNet) as core seismic monitoring infrastructure.
Greece is the most active seismic region of Europe, with more than 60% of the European earthquakes occurring in this region (Papazachos and Papazachou 2003). The geodynamic processes that produce high seismic activity are related to the convergence of the Eurasian and the Eastern Mediterranean lithospheric plates, forming the long Hellenic trench, the dextral strike slip motion along the North Anatolian fault and North Aegean Trough and the fast movement of the Aegean to the south-southwest (Meier et al., 2004; Papadimitriou et al., 2016).
The Ionian islands are located north of the northwest termination of the Hellenic Trench. In this area (Figure 1) the NNE-SSW trending Kefalonia Transform Zone (KTFZ) is prevailing. Here the seismicity rate is the highest in Greece being characterized by a huge number of small magnitude earthquakes, frequently occurring moderate and strong earthquakes with magnitude up to about 7.0. Over the last decade, on average, an earthquake with magnitude between 4 and 4.9 occurs every 10 days, events in the range M 5–M 5.9 occur once every 4–5 months and M > 6 events every 6 years (Karakostas et al., 2010; Karakostas and Papadimitriou, 2010, 2015; Papadimitriou et al., 2013, 2017, Gospondinov et al., 2015, Kostoglou et al., 2020; Karakostas et al., 2020, among others).
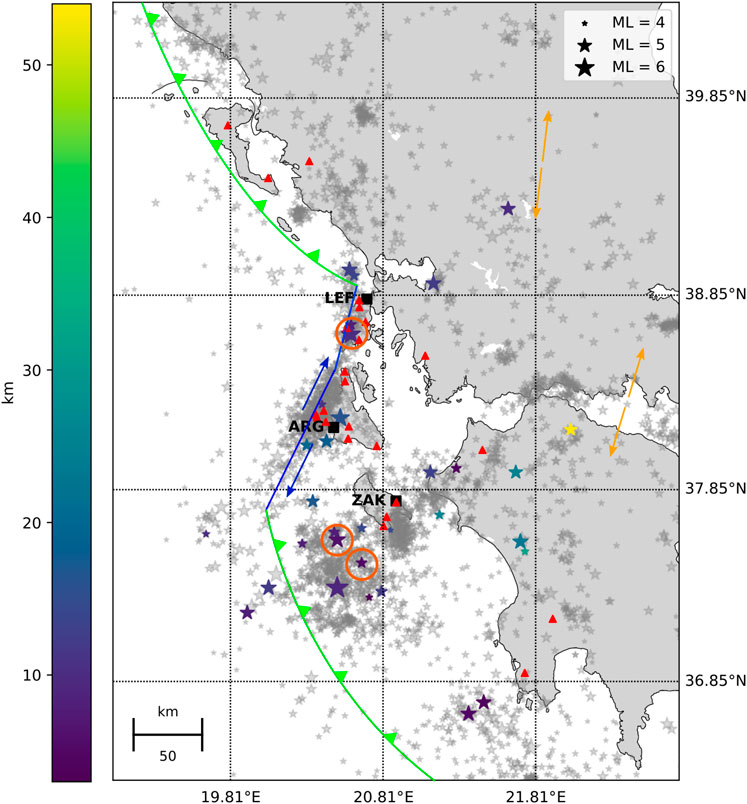
FIGURE 1. Event and Station distribution. The map shows the epicentral position of the events (colored stars), the stations used in this work (triangles), and the three considered targets (squares). The size of the stars is proportional to the earthquake magnitude, while the depth is shown through the color scale. The three events selected for the scenario analysis are indicated with an orange circle. Grey stars show all the events with magnitude M > 3.5 occurred since 2000 and the colored lines show the major faults of the area. Orange arrows show the approximate direction of relative plate motion. Blue line represents the dextral Kefalonia Transform Faut Zone. The green line to the north represents the collision between the Apulia microplate and the Greek mainland, while the green line to the south depicts the subduction of the eastern Mediterranean oceanic plate beneath the Aegean.
Within the framework of past European projects (SAFER (https://cordis.europa.eu/project/id/36935), REAKT (https://cordis.europa.eu/project/id/282862), 2006–2014), several feasibility studies were carried on in order to build the infrastructure for an EEWS in Greece. Test-site applications (touristic harbours and hospitals) in the city of Patras were chosen to provide the opportunity to implement and test scientific products and results achieved in the project (Cauzzi et al., 2016). Specifically, Sokos et al. (2016) discuss the limits and potential of a network-based EEW system for the city of Patras (Greece), which is the third largest city in Greece and represents an ideal candidate for earthquake early warning due to its high seismic hazard and to the presence of critical structures such as the Rion-Antirion bridge. Within the project, the Virtual Seismologist (VS, Cua 2005; Cua and Heaton 2007; Cua et al., 2009) EEW software was installed at the Seismological Laboratory of the University of Patras (UPAT). Given the available station density and network telemetry, the performance of the system was evaluated through synthetic tests and simulations, assuming a fully operational seismic network and the absence of delays in data transmission/processing. The analysis showed that the average time needed for the first magnitude estimate from VS was rather large (tens of seconds) and not satisfactory for routine operational use of EEW, indicating that the seismic networks in Greece need enhancements for regional EEW, either by adding stations or by upgrading the hardware to reduce delays.
Following the route traced by Sokos et al., (2016), here we studied the feasibility of implementing an EEWS on the existing nationwide seismic network, which was not specifically designed for earthquake early warning purposes, and evaluated the performance of the system, using a data set of real earthquake recordings. In the present study we implemented and tested the regional EEWS PRESTo (PRobabilistic and Evolutionary early warning SysTem), developed by RISSC-Lab research group at the University of Naples Federico II, on three Greek Ionian islands of Zakynthos, Lefkada and Kefalonia, which are located on the North-Western part of the Hellenic trench. Here the high seismicity rate and the seismic hazard could make the implementation of an EEWS relevant to reduce the potential damage caused by earthquakes. At the same time, the geography of the area and the station geographical distribution make the implementation of an EEWS really challenging.
Materials and Methods
Dataset Description
The area of interest of this study is embedded in a rectangle of 350 km x 200 km (Figure 1). Within this area, we used the 3-component, velocimetric stations of the Hellenic Unified Seismic Network (HUSN) maintained by the National Observatory of Athens, the Aristotle University of Thessaloniki, the National and Kapodostrian University of Athens and the University of Patras (HUSN, doi:10.7914/SN/HL). The network started being deployed in 1964 and was updated gradually in the following years, resulting in a heterogenous deployment, in terms of sensor typology and geographical distribution. The seismological network has almost its present geometry since 2014, by the installation of nine seismological stations with online connection maintained by the Department of Geophysics of the Aristotle University of Thessaloniki in cooperation with the union of the municipalities of the Ionian islands (PED-IN).
Among the available stations, we selected 23 stations for which it was possible to have real time data, including stations located on the islands (16) and on the mainland (7). With this selection, the geographical distribution of the network becomes heavily heterogeneous, with an inter-station distance varying from few kilometres for stations located on the same island to tens of kilometres considering also the other stations. Moreover, for offshore events in the South-West area, the network configuration makes the number and azimuthal coverage of recording data rather poor.
The collected earthquake dataset is composed by 31 (in Supplementary Table S1) earthquakes (Figure 1), occurred between 2010 and 2019, with local magnitude (ML) ranging from 4.0–6.6. The complete list of selected events is reported in Supplementary Table S1 of Supplementary Material. Among the largest events the database includes the 2018, ML 6.6 Zakynthos earthquake, the 2015 ML 6.0 Lefkada earthquake and the 2014 ML 5.8, Kefalonia earthquake. Most of the events have shallow depths (5–15 km), with the deepest earthquakes located in the South West area, along the subduction fault area of the Hellenic Trench. We used a total number of 254 records, and the histogram distribution of these records as a function of distance is available in Supplementary Figure S1 of the Supplementary Material.
Review of PRESTo Methodology
PRESTo (Satriano et al., 2011) is a free and open-source software platform for Earthquake Early Warning which integrates algorithms for real-time data collection, event detection, rapid earthquake location, magnitude estimation and damage assessment. It uses a regional, network-based approach, processing the real-time ground motion recorded by the stations of a seismic network and providing a prediction of the ground motion at the target. In PRESTo, the Filter-Picker algorithm (Lomax et al., 2012) first identifies the arrival time of the P-wave at each station, based on the real-time evaluation of a specific characteristic function, accounting for both the signal amplitude and its frequency content, in a short and long signal time window. An earthquake is declared when the triggering condition is satisfied by a small (<4) number of stations satisfying spatial and temporal coincidence criteria. As soon as an earthquake is detected, the real-time location is obtained through the RTLoc algorithm (Satriano et al., 2008), which can provide probabilistic estimates of hypocenter coordinates and origin time based on the use of both triggered and non-triggered stations, and on the recorded P-wave arrival times at pairs of stations. The event magnitude is estimated with a Bayesian, probabilistic approach (RTMag, Lancieri and Zollo, 2008) from the analysis of the early peak displacement amplitude in short time windows (2–4 s), on both P and S-waves, and through the use of an empirical scaling relationship relating the early peak ground displacement amplitude to the final event magnitude and hypocentral distance, at any recording station.
At any time t, after the first event detection the conditional probability density function (PDF) of magnitude given the observed data vector is expressed, through the Bayes’ theorem, as the product between the conditional PDF of data, given the magnitude, and a priori PDF based on the prior information available before the time t. In the proposed methodology the a priori distribution is derived by the Gutenberg-Richter occurrence law (see Lancieri and Zollo, 2008 for details of the methodology). Both location and magnitude estimation algorithms (RTMag and RTLoc), provide as output a Probability Density Function (PDF), at each time step after the event origin. Then, the predicted outcome (magnitude or hypocentral location) corresponds to the maximum of PDF.
Once location and magnitude of the ongoing event are known, the peak ground motion is predicted through a regional ground motion prediction equation (GMPE), specifically calibrated for the considered area.
Configuration of PRESTo for the Selected Area
For the current experimentation, we installed PRESTo on a dedicated machine at the seismological station of Thessaloniki, that was configured to receive and process in real-time data from the HUSN stations. As previously mentioned, the software PRESTo is based on a sequence of algorithms for real-time data collection, event detection and location, magnitude estimation and shaking prediction. Each of these algorithms is based on several configuration parameters that require a proper calibration to be adapted to a given network and seismic area. A robust analysis of a massive earthquake catalogue, covering large magnitude and distance ranges, would be needed to correctly calibrate the parameters. Due to the unavailability of such a massive catalogue for the considered area, for the purpose of the present work, we mostly verified whether the default configuration parameters of PRESTo could be adapted to the Greek seismicity. In a few cases, we introduced correction coefficients or performed a trial-and-error analysis to find more suitable parameter. The specific calibration of each module is discussed below.
The phase picking and earthquake detection algorithm (Filter Picker, Lomax et al., 2012) requires the calibration of several parameters, (including, among others, the length of short and long-time windows for average signal computation, the minimum number of triggering stations for the event declaration, the amplitude threshold for event declaration). The proper calibration of each parameter requires a dedicated analysis of a massive number of recorded waveforms and this goes well beyond the purpose of the present work (see Vassallo et al., 2012. Here, we used 7 records (of 12 min length, acquired by different stations and including noise and seismic events) which are representative for the recorded signals in different conditions (i.e., different background noise level and seismic events). Starting from the default Filter Picker configuration parameters, we slightly changed the configuration parameters around their standard values and evaluated the response of the algorithm. We choose the optimal parameters as those that maximise the correct detection of seismic events and minimize both missed and false event declaration. Specifically, we choose 0.5 and 5 s as a short and long-time window respectively, for the characteristic function evaluation and set to 9 the threshold value of this characteristic function for the event declaration. Finally, an event is declared when the triggering condition is satisfied by multiple stations within a pre-determined space-time window, depending on the network geometry, density and distribution. Given the characteristics of the Greek network, we required 3 stations to be triggered within 90 km and 16 s.
As for the location algorithm, here we used the RTLoc method (Satriano et al., 2008) as it is, and adapted it to the area by including the velocity model of Papadimitriou et al. (2017), that was specifically made for the Lefkada and Kefalonia area. On average, for depths between 0 and 40 km, the P-to-S velocity ratio, is 1.83 ± 0.01.
The empirical scaling relationship used for the magnitude computation has the form (Zollo et al., 2006):
where Pd is the initial Peak Displacement (Lancieri and Zollo, 2008), M is the earthquake magnitude, R is the true hypocentral distance (with respect to the real hypocentral location, as provided by NOA reference catalogue available at http://www.gein.noa.gr/en/seismicity/earthquake-catalogs) and A, B, C, A’, B’ are empirical coefficients to be calibrated from data for a 2 s and a 4 s P-wave time window, separately. As for the distance, for the calibration phase and the computation of empirical scaling relationships, we forced the earthquake location to the true value by temporarily deactivating in PRESTo the location module, which was then reactivated during the remaining performance analysis. The initial peak displacement (Pd) is defined as the absolute maximum amplitude on displacement waveforms, measured in a short time window (2 s, 4 s) after the P-wave arrival. The peak displacement is measured on integrated velocimetric waveforms, band-pass filtered in the range 0.075–3 Hz, to remove the noise and low frequency drift introduces by the integration operation. Examples of displacement waveforms with the portion of P-wave signals used are shown in Figure 2. In Eq. 2, Pd10 is the Pd value once it has been corrected by the geometrical spreading effect. The coefficients have been specifically calibrated for each time window, using the available data in this study through a standard regression analysis and are reported in Table 1 for 2P and 4P time windows, respectively, while the beta value of the Gutenberg Richter for the prior distribution to be used in RTMag algorithm was set b = 0.9 (Papadopoulos, 2014). As for the use of two equations, since it may occur that the P-wave peak amplitude increases with time within the P-wave time window especially for M > 6 events (Colombelli et al., 2012), the use of a larger time window with specifically calibrated coefficients is more appropriate. Figure 3 shows the scaling between Pd and Magnitude for the two selected time windows, while Supplementary Figure S2 in Supplementary Material shows the distribution of residuals after the calibration. The residuals are normally distributed on zero (mean value 0.05), with a standard deviation of 0.26.
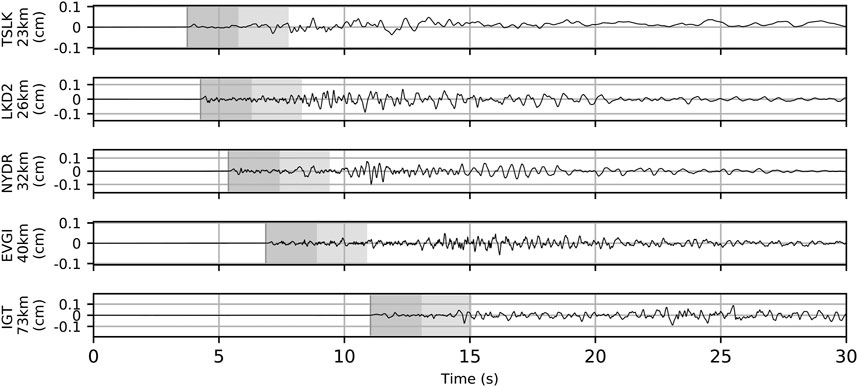
FIGURE 2. Data. Example of displacement waveforms used for the analysis. The figure shows the waveforms recorded during the 2019-01-15 event (ID XXVIII). From top to bottom, the waveforms are sorted by source-to-receiver (hypocentral) distance. The P-wave arrival time is shown with a vertical grey solid line, corresponding to the beginning of the first, dark gey box, while the 2P and 4P time windows are shown with the dark and light grey bars.
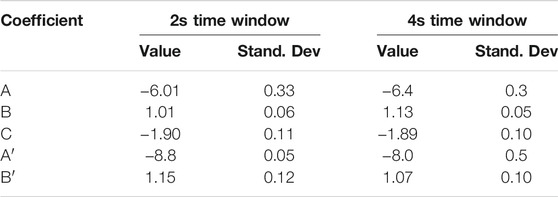
TABLE 1. Coefficients for magnitude scaling relationship. The table shows the coefficients of the scaling relationship defined by Eq. 1 and Eq. 2 for 2P and 4P time windows. The standard deviation of each coefficient is also provided (but not used for predictions).
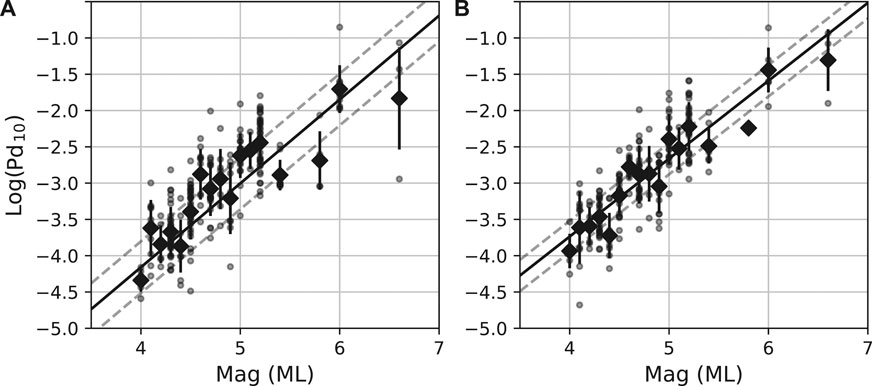
FIGURE 3. Calibration laws for magnitude prediction. The figure shows the logarithm of measured Pd as a function the event magnitude for 2P(A) and 4P(B) time windows. The figure shows the observed data (grey dots), the average Pd value for each magnitude (dark diamonds). The linear regression obtained using the average values is shown through a solid black line, while dashed lines represent the standard error bounds (one standard deviation), as obtained from the fitting procedure. In both panels, the observed Pd is referred to a distance of 10 km, as obtained by Eq. 2.
Due to the sparse station distribution of the used Greek network we decided to exclude the use of S-waves for EEW given the low level of accuracy in bracketing with automatic algorithms the S-phase on seismic records. Indeed, as proved in previous works (Satriano et al., 2011), the use of the S-waves for a regional EEWS is critical, since it grounds on the reliable estimation of the S-arrival time, which in turn depends on a precise earthquake location obtained in real-time from the P-wave readings.
The Ground Motion Prediction Equation (GMPE) is used to predict the median Peak Ground Motion value (PGA or PGV) once the earthquake location and magnitude are known. Due to the unavailability of a massive catalogue for the considered area, we evaluated the prediction error for both PGA and PGV, using the standard GMPE calibrated by Akkar and Bommer (2007) for the European large earthquake dataset and already implemented in PRESTo. With respect to the original GMPE, we discarded site and fault coefficients. The functional form of the ground motion prediction equation used in this work to predict either PGA and PGV (denoted as PGX in the equation) is given by (Akkar and Bommer, 2007):
Where M is the earthquake magnitude,
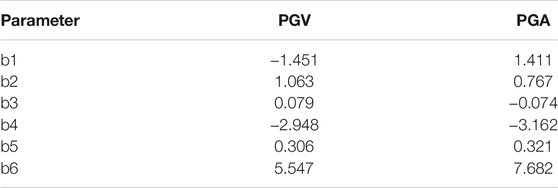
TABLE 2. Coefficients for ground shaking prediction relationship. The table shows the coefficients of the ground motion prediction equation of Akkar and Bommer (2007) for PGV and PGA (from b2 to b6), while the additional correction coefficients is included in parameter b1.
For both quantities (PGA and PGV), while no apparent trend with distance is observed, we found that the mean value of residuals (computed as observed minus predicted value) is not centred at zero, suggesting the possibility of introducing a constant correction coefficient to account for the observed bias. Figures 4A,B shows the logarithm of observed PGA and PGV values, as a function of distance with respect to the theoretical scaling laws of Akkar and Bommer (2007) for three magnitude classes. The comparison shows that, after correcting the theoretical laws with a constant coefficient, the observed data are in good agreement with the theoretical laws. Figures 4C,D shows the distribution of prediction errors (for PGA and PGV) as a function of distance, with different colors for the same magnitude classes, once the constant bias has been corrected, while the coefficients of Akkar and Bommer (2007) scaling relationships and the constant correction coefficient (included in the b1 value) are reported in Table 2.
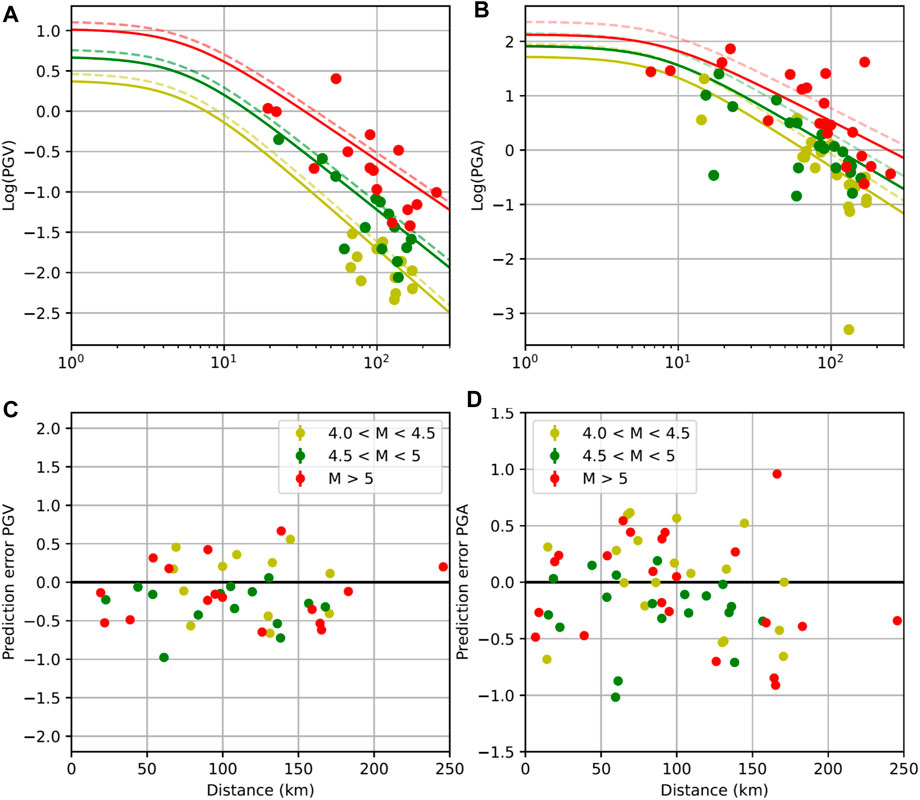
FIGURE 4. Calibration of GMPE and prediction error. (A) and (B) show the logarithm of observed PGA and PGV as a function of the hypocentral distance in logarithmic scale, where units are cm/s2 for PGA and cm/s for PGV. Circles represent the observed data while the theoretical scaling laws obtained by correction of Akkar and Bommer (2007) are shown with dashed lines (corresponding to the central magnitude value of each interval (C) and (D) show the prediction error on PGV (A) and PGA (B) for all the records available in the dataset. The average value has been corrected using the Akkar and Bommer (2007) GMPE. Solid lines show the corrected curves, including the coefficients, while dashed lines are those uncorrected. In all panels, the events have been grouped in three ranges of magnitudes, shown with different colors.
Results
The performance analysis is crucial to understand whether and how the available network is suitable for earthquake early warning applications and how the existing network can be improved to optimize the performance. We first choose a sub-set of 3 earthquakes, among those available in the dataset, to perform a specific scenario-analysis, which are the M4.7 2013-5-23 earthquake, the M5.4 2018-10-30 earthquake and the M6.0 2015-11-17 earthquake. Then we evaluate the overall performance of the system in terms of first-alert times and in terms of accuracy of the estimates of source parameters (location and magnitude) on the whole dataset. Since the performance of an EEWS is strongly dependent on the network geometry, number and coverage of stations, we selected events with magnitude greater than 4 that were occurred in two different areas of the country and have been recorded by a sufficient number of stations. The selected earthquakes are indicated in Figure 1 with circles.
Scenario Analysis
For the 3 selected events, we looked at the detailed time evolution of earthquake source parameters (epicentral coordinates, depth and magnitude), prediction error on PGA and number of available data, starting from the first available estimate and stopping when the latest station has recorded the P-wave signal. Figure 5 show the time evolution of real-time estimates for the M4.7 2013-5-23 earthquake (Panels A, D, G, J, M), the M5.4 2018-10-30 earthquake (Panels B, E, H, K, N) and the M6.0 2015-11-17 earthquake (Panels C, F, I, L, O).
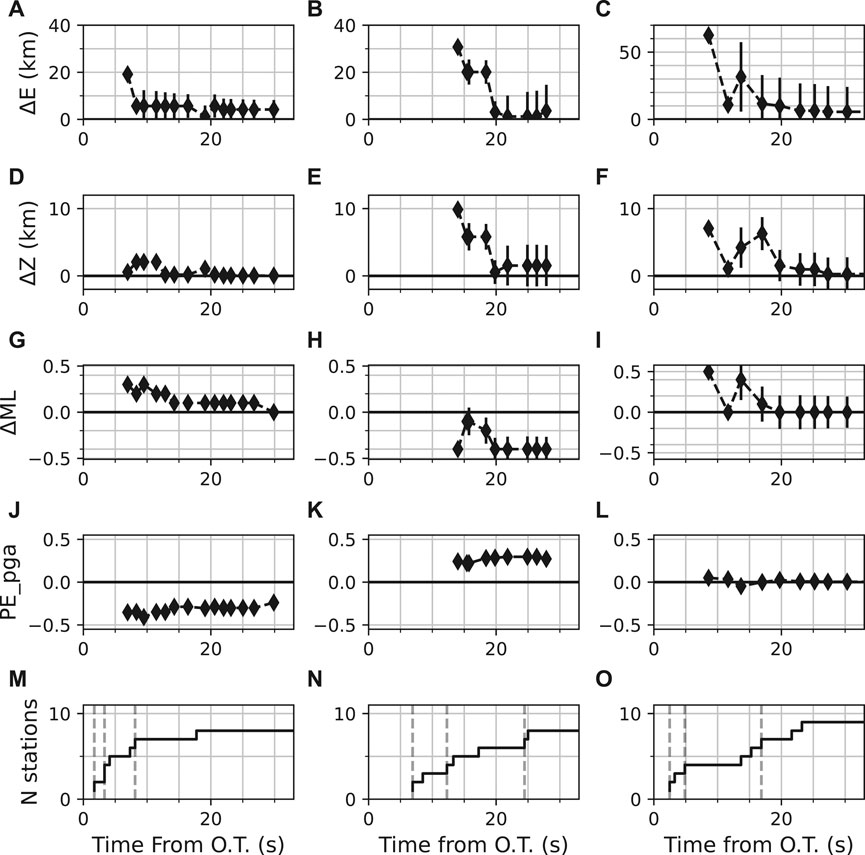
FIGURE 5. Scenario analyses for the three selected earthquakes. The figure shows the time evolution of the estimated source parameters, for the three scenario earthquakes: magnitude M4.7 (A, D, G, J, M), magnitude M5.4 (B, E, H, K, N), magnitude M6.0 (C, F, I, L, O). From top to bottom the figure shows the residuals on: epicentral coordinate estimation, depth estimation, local magnitude, peak ground shaking prediction and number of triggering stations as a function of time. The time axis is given with respect to the origin time (O. T.) of the event. For each quantity, the average value and the standard error bars (standard deviation) are represented with filled diamonds and black line, respectively. As for the location, we first computed the location error from the probability density function defined in Satriano et al., 2008. We then estimated the distance between the pick of the pdf (which is the observed value) and its boundary, defined by cutting the pdf at 68%. This error is finally propagated in the magnitude scaling law and in the GMPE. Vertical dashed lines in (M–O) indicate the use of 1, 3 and 6 stations, respectively.
Overall, after a few seconds from the first estimate, for the three events the estimates of location and magnitude converge to the real value, as it can be seen from the timelines of Figure 5. As for the earthquake location, we separately analysed the time evolution of epicentral and depth estimates, with the relative uncertainties. For the three events, as soon as a consistent (>6) number of stations is used, the estimates of both epicentral position and source depth converge to the real value, with a relative uncertainty (error bound) of about ±10 km for the epicentral position and ±2 km for the depth. Differently from what is expected, the uncertainties on the source depth turn out to be overall smaller than those on the epicentral position. This is likely due to the fact that most the events in the dataset have similar, shallow depths and the initial, a-priori solution for the source depth (set to 15 km) is very close to the real value in most of the cases. Thus, the real-time location estimates soon converge and stabilize to the true solutions. As for the magnitude, the real-time estimates show nearly stable residuals, distributed around zero shortly after the very first estimates, with a final average uncertainty of about 0.25 units, except for the M 5.4 event (Figure 5H), for which we found a systematic underestimation of magnitude of about 0.3 units (despite of a good location estimate). This could be probably due to the poor number of stations and azimuthal coverage, or to source effects (such as finite fault, fault orientation, directivity) which are not considered in the prediction model of Eq. 1, or propagation/site effects that produce lower observed amplitudes. Finally, for the three events, the prediction error on PGA (panels J, K, L), (computed as the difference in logarithm between observed and predicted PGA value) is not centred on zero (due to errors in location and magnitude) although it is nearly stable with time around ±0.3–0.4, and is consistent with the typical standard deviation on PGA prediction (Akkar and Bommer, 2007; Bindi et al., 2011).
Overall Performance Analysis
The time of the first alert (alert time) is the shortest time needed for the system to provide a warning and it depends on the number of triggered stations required for the event declaration and on the spatial distribution of these stations. We evaluated the detection time when the triggering condition is satisfied by 1 and 3 stations, respectively, as the difference between the event declaration time and the earthquake origin time. When a single or 3 stations are required, the detection times range between 3 and 24 s and follow a non-gaussian, unimodal distribution, having a median value of 1.9 and 9.8 s, respectively. The detailed results for the detection times are reported in Supplementary Table S2 of the Supplementary Material, in terms of minimum, maximum and median value for the selected events.
We also analysed the performance of the EW system for the whole dataset, by looking at the time evolution of residuals for magnitude and location estimates (Figure 6) and for PGA prediction error. As expected, both for the location and magnitude, the residuals generally decrease with time, as more stations contribute to the estimates. Specifically, for the earthquake location (Figures 6A,B), we observed that depth residuals are rather small since the initial estimates and converge to an average value about 7 km. Epicentral location residuals are larger (as also observed in the scenario analysis) and slowly decrease, reaching a nearly constant average value of about 20 km, after 17 s from the first P-wave trigger. We believe that the large final average value is likely due to the presence of a few (5) events in the data-set, located outside the network, in the South-West area, for which location residuals are very large ( >50 km), because of the high level of noise contaminating data, the low number of triggering stations, and the poor azimuthal coverage. As for the magnitude estimates, the average residuals (represented by the red line in Figure 6C) are nearly stable around zero since the very first estimates and range between ± 0.5 points. For a few events, the residuals are rather large (±1) at the beginning but converge to zero, with a certain delay from the first P-wave trigger, depending on the availability and quality of recorded waveforms. As for the prediction error on PGA, we found that this is nearly stable around zero, with a maximum variation within the ±1 interval.
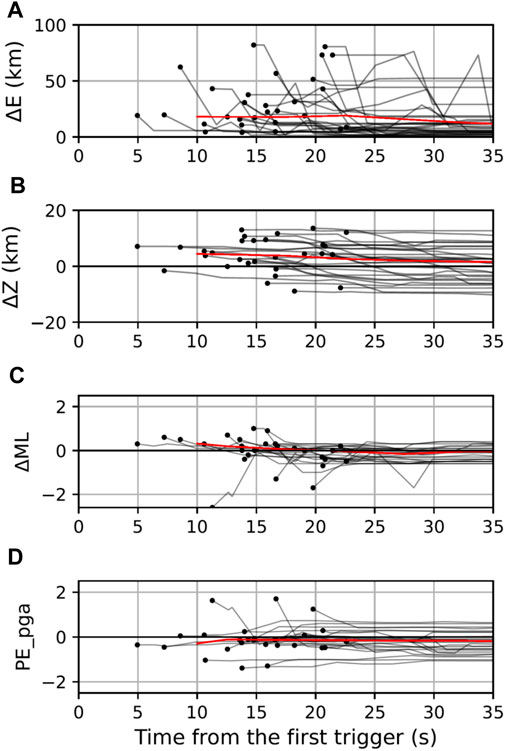
FIGURE 6. Time evolution of location and magnitude residuals for all the events. The figure shows the evolution of location, and magnitude residuals and the prediction error on PGA for all the considered events. For each line, the black point identifies the time of the first triggered station. From top to bottom, the figure shows epicentral residuals (A), depth residuals (B) and magnitude residuals (C), prediction error on PGA (D). The thin, red line is the average value of residuals as a function of time.
Lead-Time Analysis
The “lead-time” is one relevant parameter for an earthquake early warning system, and it corresponds to the time available at the target for taking emergency measures to mitigate the earthquake impact in real-time. We computed the lead-time for the three main towns of the islands which are Lefkada (Lefkada Island), Zakynthos (Zakynthos Island) and Argostoli (Kefalonia Island), denoted ad “LEF”, “ZAK” and “ARG”, respectively in Figure 1. The lead-time is computed as the difference between the theoretical S-waves arrival time at the target and the first-alert at the network (i.e., the alert time provided by PRESTo). Because of the sparse network density and coverage in the South-West area, we excluded 5 events located in this area for the computation of the lead-times. Figures 7A–C shows the lead-time as a function of distance, for the three selected targets. For the considered network and set of events, negative lead-times (e.g. S waves arrive before the first-alert issuing) are found at distances smaller than 20–25 km, as it is shown with vertical lines. At larger distances, lead times are of the order of 10 s for 70–75 km, and are about 20 s for distances larger than 100–120 km.
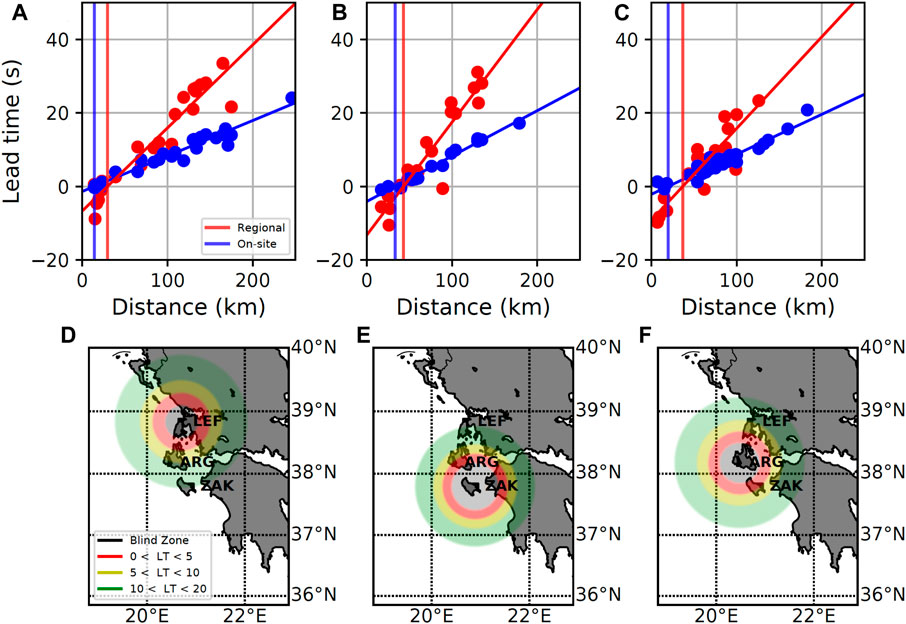
FIGURE 7. Lead Times. Panels (A), (B), (C) show the distribution of lead-time as a function of distance for the three targets. In red the lead time for a regional EEWS with detection for trigger of three stations, in blue the lead time for an on-site single station EEWS. The vertical lines represent the blind zone radius relative to the target where the two EEWSs are applied. The analysis has been repeated for the three targets (A) Lefkada, (B) Zakynthos, (C) Argostoli. Panels (D–F) show the lead-time map for each target (D), Lefkada, (E), Zakynthos, (F), Argostoli), for all the available events. The map shows the epicentral positions that would provide a given lead-time to the considered target. Specifically, the red circle represents the epicentral locations that would provide less than 5 s to the target. The yellow circle represents the epicentral locations that would provide 5–10 s to the target and green circle those that would give 10–20 s of lead time. The grey area represents the blind zone, where no alert can be provided to the target.
In order to account for the very sparse network distribution, we also estimated the lead-time by simulating a single-station, on-site EWS. Specifically, for this simulation, we assume each single station of the network to behave as an on-site EW system, i.e., as if each station would coincide with a target site. As for the regional system, instead, for the lead-time computation, we considered 2 seconds of computational time after the time of the first triggered station. In Figures 7A–C we compared the lead-times between the regional and on-site configurations. The figure shows that, at short distances, the lead-times are larger for the on-site than for the regional approaches, while at larger distances, the regional configuration provides larger lead-times, as expected (Satriano et al., 2011). In the figure, red lines correspond to the regional configuration, with three stations needed for the event declaration, while the blue lines define the lead-time for the on-site configuration. Both for regional and on-site configurations, the fit has been obtained through a linear regression analysis, considering the lead time for each event as a function of the relative target to source distance. It is worth to mention that the lead-times estimated in our work are also affected by the sparse station distribution, which is reflected into large P-wave arrival times at the network, as it can be seen from the histogram of Figure 8 showing the P-wave travel times at the three selected targets, while Supplementary Table S3 of the Supplementary Material shows the fit parameters of lead-time as a function of distance.
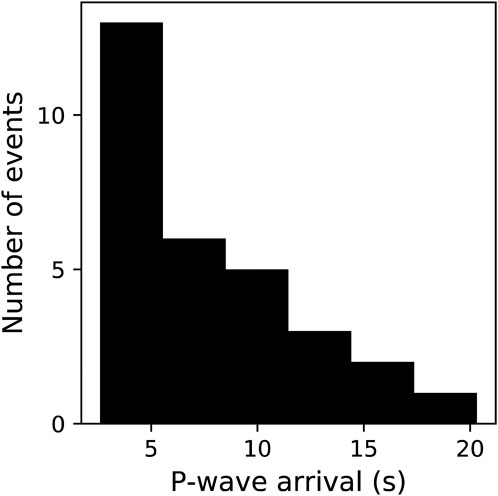
FIGURE 8. Histograms of P-wave travel times. The figure shows the histogram of P-wave arrival times observed at the network.
Finally, a useful scheme to assess the performance of PRESTo EWS for earthquakes in Ionian islands is provided in the form of a map in Figures 7D–F for the three selected targets, assuming that the target is at the centre of the map. In the maps, the grey area shows the blind zone, where no warning time is available. Red, yellow and green circles represent the areas with 0–5 s, 5–10 s and 10–20 s of warning time, respectively.
Discussion
The aim of this study was to design, implement, validate and test the regional EEWS PRESTo on the three Ionian Islands of Lefkada, Kefalonia and Zakynthos, which are in an extremely high seismic hazard region of Europe. Here we focus on PRESTo EW software and did not explore the application of other algorithms for EEW such as Virtual Seismologist (Cua and Heaton, 2007), E-larms (Allen, 2007), PLUM (Kodera et al., 2018). The comparison of performances of different algorithms is beyond the purpose of the present study. We applied the Early Warning System PRESTo through the off-line analysis of 31 earthquakes with local magnitude greater then 4, occurred between 2011 and 2019. We studied the performance of the alert system in terms of rapidity of the first alert release, accuracy of source parameter estimates (magnitude, location) and ground motion prediction and in terms of available lead-time.
When considering only the events occurring close to the islands and inland, the application showed that, on average, about 20 s after the earthquake origin time the event is fully described, with an accuracy of 20 km on the epicentral position, 7 km on the depth, and 0.1 on the local magnitude. In terms of lead-time, the system shows highly variable timing, depending on the earthquake location, and varying in the range from a few to tens of seconds. The blind zone radius depends on the source-to-receiver distance and for this reason, it changes from target to target. The average value between the three targets is 36 km. This value appears to be rather large and many of the strongest events could occur within the blind zone. However, both lead-times and blind zones here are computed through the theoretical arrival of the S-wave, while in most of the cases, the peak value of ground shaking occurs at a later time (either on the S-wave or on surface waves), thus providing additional warning time.
The GMPE shown in Figure 4 can be used to evaluate the significance of the expected ground shaking at different distances. For example, for analyzed events with magnitude in the range M4 – M6, recorded at distances between 20 and 50 km, we expect a PGV in the range between 0.3–3 cm/s, which corresponds to a perceived shaking from weak to moderate, and an expected damage from none to light, assuming the PGV-IMM conversion table (Worden et al., 2012). These levels of shaking apparently do not justify the implementation of an Early Warning system in this area. However, we point out that from the historical catalogue of Greek earthquakes, large events with magnitude greater that 6.5, producing strong-to-severe shaking at the same distance range, may occur, and these are the shocks the Early Warning system is addressed to. Moreover, the experience of large populated areas (such as Italy), shows that even moderate events (shallow, M around 4 events) can be perceived by the population and produce panic and social consequences, which civil protection and authorities need to account and manage, making the effectiveness of Early Warning Systems very relevant even for small magnitude events.We also evaluated the lead-time by including the events in the South-West area (see Supplementary Table S3 of the Supplementary Material). When the South-Western events are excluded, the slope of the lead-time regression line vs distance increases for all the targets, confirming that the performance of the regional approach improves. Similarly, the radius of the blind zone reduces when excluding stations in the South-Western area, as shown by Supplementary Table S3.
Our analysis shows that when the event occurs close to the target islands or in the South-West region, the on-site approach offers better performances in terms of lead-times. The regional approach becomes more performing when the target is located in a different island than the one where the earthquake occurs.
EEWS using a regional approach, are generally made with dense distribution of sensors surrounding the fault area. In the case of Greece, the density, coverage and number of stations on the three islands is rather large, while a non-uniform station distribution (in terms of number and distance) is available inland. Most of the seismicity occurs between the islands and the sea, several kilometres away from the coast, or in the South West area, where the station coverage is rather poor. For most of the events, the network configuration makes the azimuthal coverage rather poor, with consequent large errors on the estimation of location, magnitude and, consequently, on the ground motion prediction. Additional observables could be included to better constrain the hypocentre position in real-time. Among them, for example, the joint use of time, amplitude ratio and back-azimuth estimates, as proposed by Zollo et al., (2021), could represent a valid strategy to avoid wrong location estimates for off-network events.
In view of a future implementation of an integrated onsite and regional EEWS in this region of Greece, two main critical issues should be considered and solved. The first one is the seismic network density and areal coverage. This would obviously require the installation of new stations, mainly at the sea bottom, which represents a difficult and expensive operation. The problem may be partially solved by using a hybrid EEW approach, in which each seismic station can operate as a stand-alone, onsite EEW system and within the regional configurations. In this view, a single station (or small arrays of stations) deployed at the islands, could be used for the P-wave based early earthquake detection, while the network of stations could confirm or possibly cancel the alert issued by the single sensor. This would increase the available lead-time for earthquakes occurring at the sea, keeping at the same time the accuracy and reliability of source parameter estimates, provided by the network-based approach.
The second main issue is the performance of data communication and transmission system, which was not originally designed for running EEW applications. The current Greek network has a station-server transmission time of about 5–7 s on average, but it may reach extreme values up to 10–15 s. The solution to this problem demands a new technological improvement, requiring the development and installation of more advanced communication systems and digital, dedicated data transmission lines, which should be designed in all its components to have fixed and certified deadline for data release of less than one second, which is now quite a standard for modern communication technologies.
From July 2nd –July 10th, 2019, the software PRESTo has been operative, to start the evaluation of a potential real-time application. Although a reliable estimation of real-time performances would require several months of experimentation with the occurrence of moderate-to-strong events in different areas of the country, here we can rapidly comment the preliminary results of this test, to discuss the most critical issues that were observed.
During the period, PRESTo detected a total of 35 small events, with magnitude larger than 1, and 6 of them having magnitude larger than 3. Two main issues raised during the real-time operation mode. The first problem is related to a few external events (for example occurring on the island of Creta) that were located as internal. In these cases, indeed, the location algorithm often tends to look for and force the solution within the area covered by network. Ad-hoc solutions in terms of space and time coincidence criteria or apparent wave velocity could be included to avoid the detection of such external events. Alternatively, constraints on the location probability distributions could be adopted to distinguish the case of an external event from that of an internal earthquake.
The second problem is related to the missed detection, i.e., the occurrence of multiple events that are detected as if they were a single earthquake. This issue reflects a peculiarity of the seismicity of this area, for which different magnitude earthquakes often occur in a really short time window (5–10 s). The detection algorithm is not able to recognize the individual earthquakes and the results is that a wrong event is detected, by considering waves from both events. This is the case of one of the detected events, that was preceded few seconds before by another earthquake, belonging to the same faults system. In this case, the system was not able to detect both events separately, resulting in a wrong detection. The occurrence of multiple events is a critical issue of all network-based EEWS and more adapted strategies should be considered, as for instance, those proposed by Liu and Yamada (2014) and Wu et al. (2015) who applied a Bayesian, EEW probabilistic scheme to identify multiple concurrent earthquakes through the scan of a posterior probability density function which jointly uses wave time and displacement amplitude information from triggered and not-triggered stations.
The last critical issue to consider is the maintenance of the network, that must be continuously operative in real-time, with no interruption of data recording and communications.
In conclusion, the results achieved in this study represents a first attempt and provide preliminary guidelines to build an integrated regional/onsite earthquake early warning system for Greece and could be useful for further nationwide applications in the region, to optimize the software and for studying its strengths and weaknesses.
Data Availability Statement
The raw data supporting the conclusions of this article will be made available by the authors, without undue reservation.
Author Contributions
MB implemented and applied the methodology, analysed the results and prepared the related figures. SC and MB wrote the text. All authors contributed to the methodological development, the interpretation of the results and the manuscript redaction.
Conflict of Interest
The authors declare that the research was conducted in the absence of any commercial or financial relationships that could be construed as a potential conflict of interest.
Publisher’s Note
All claims expressed in this article are solely those of the authors and do not necessarily represent those of their affiliated organizations, or those of the publisher, the editors and the reviewers. Any product that may be evaluated in this article, or claim that may be made by its manufacturer, is not guaranteed or endorsed by the publisher.
Acknowledgments
The work has been made in collaboration with the Aristotle University of Thessaloniki which provided knowledge, data, and stations availability and took place for 5 months in Thessaloniki and 5 months at the University of Naples Federico II. This research used the algorithm NonLinLoc by Lomax (http://alomax.free.fr/nlloc/) and the PRESTo software (http://www.prestoews.org/). The seismograms used in this study and their relative the information have been downloaded from the European Integrated Data Archives (EIDA) knot, maintained by the Institute of Geodynamics, National Observatory of Athens (http://www.gein.noa.gr/en/seismicity/earthquake-catalogs, http://eida.gein.noa.gr/waveform/, http://www.gein.noa.gr/en/networks/husn). The authors wish to thank Prof. E. Papadimitriou for inviting MB to the Aristotle University of Thessaloniki in the framework of Erasmus project and for the continuous cooperation during his stay, A. Kostoglou for his technical assistance and fruitful discussions, and the union of municipalities of the Ionian Islands (PED-IN) for its continuous support in the operation of the seismological network. The authors wish to thank the Editor CG, the two Reviewers EZ and RDR, and an Reviewer for the significant comments, which really improved the original version of the manuscript.
Supplementary Material
The Supplementary Material for this article can be found online at: https://www.frontiersin.org/articles/10.3389/feart.2021.667160/full#supplementary-material
References
Akkar, S., and Bommer, J. J. (2007). Prediction of Elastic Displacement Response Spectra in Europe and the Middle East. Earthquake Engng Struct. Dyn. 36 (10), 1275–1301. doi:10.1002/eqe.679
Allen, R. M., Gasparini, P., Kamigaichi, O., and Böse, M. (2009). The Status of Earthquake Early Warning Around the World: An Introductory Overview. Seismol. Res. Lett. 80 (5), 682–693. doi:10.1785/gssrl.80.5.682
Allen, R. M. (2007). “The ElarmS Earthquake Early Warning Methodology and Application across California,” in Earthquake Early Warning Systems. Editors P. Gasparini, G. Manfredi, and J. Zschau (Berlin, Heidelberg: Springer). doi:10.1007/978-3-540-72241-0_3
Bindi, D., Pacor, F., Luzi, L., Puglia, R., Massa, M., Ameri, G., et al. (2011). Ground Motion Prediction Equations Derived From the Italian Strong Motion Database. Bull. Earthquake Eng. 9, 1899–1920. doi:10.1007/s10518-011-9313-z
Böse, M., Ionescu, C., and Wenzel, F. (2007). Earthquake Early Warning for Bucharest, Romania: Novel and Revised Scaling Relations. Geophys. Res. Lett. 34, L07302. doi:10.1029/2007GL029396
Caruso, A., Colombelli, S., Elia, L., Picozzi, M., and Zollo, A. (2017). An On-Site Alert Level Early Warning System for Italy. J. Geophys. Res. Solid Earth. 122, 2106–2118. doi:10.1002/2016JB013403
Cauzzi, C., Gasparini, P., and Wiemer, S. (2016). Preface to the Special Issue “Strategic Applications of Real-Time Risk Mitigation Strategies and Tools: Case Studies and Lessons Learned in REAKT. Bull. Earthquake Eng. 14, 2437–2439. doi:10.1007/s10518-016-9966-8
Clinton, J., Zollo, A., Marmureanu, A., Zulfikar, C., and Parolai, S. (2016). State-of-the Art and Future of Earthquake Early Warning in the European Region. Bull. Earthquake Eng. 14 (9), 2441–2458. doi:10.1007/s10518-016-9922-7
Colombelli, S., Amoroso, O., Zollo, A., and Kanamori, H. (2012). Test of a Threshold-Based Earthquake Early-Warning Method Using Japanese Data. Bull. Seismological Soc. America. 102, 1266–1275. doi:10.1785/0120110149
Cua, G., and Heaton, T. (2007). “The Virtual Seismologist (VS) Method: a Bayesian Approach to Earthquake Early Warning,” in Earthquake Early Warning Systems. Editors P. Gasparini, G. Manfredi, and J. Zschau (Berlin, Heidelberg: Springer), 97–132. doi:10.1007/978-3-540-72241-0_7
Cua, G., Fischer, M., Heaton, T., Wiemer, S., and Giardini, D. (2009), Real-Time Performance of the Virtual Seismologist Earthquake Early Warning Algorithm in Southern California, Seismological Research Letters. 80 (5), 740–747. doi:10.1785/gssrl.80.5.740
Cuéllar, A., Espinosa-Aranda, J. M., Suarez, R., Ibarrola, G., and Uribe, A. (2014). “The Mexican Seismic Alert System (SASMEX): its Alert Signals, Broadcast Results and Performance During the M 7.4 Punta Maldonado Earthquake of March 20th, 2012,” in Early Warning for Geological Disasters. Editors F. Wenzel, and Z. Zschau (Berlin: Springer-Verlag), 71–87. doi:10.1785/gssrl.80.5.740
Fujinawa, Y., and Noda, Y. (2013). Japan's Earthquake Early Warning System on 11 March 2011: Performance, Shortcomings, and Changes. Earthquake Spectra. 29 (1_Suppl. l), 341–368. doi:10.1193/1.4000127
Gospodinov, D., Karakostas, V., and Papadimitriou, E. (2015). Seismicity Rate Modeling for Prospective Stochastic Forecasting: the Case of 2014 Kefalonia, Greece, Seismic Excitation. Nat. Hazards. 79, 1039–1058. doi:10.1007/s11069–015–1890–8
Hoshiba, M. (2014). “Review of the Nationwide Earthquake Early Warning in Japan During its First Five Years,” in Earthquake Hazard, Risk, and Disasters. Editor J. F. Shroder (Waltham, MA: Academic), 505–529.
Karakostas, V. G., and Papadimitriou, E. E. (2010). Fault Complexity Associated With the 14 August 2003 Mw6.2 Lefkada, Greece, Aftershock Sequence. Acta Geophysica. 58, 838–854. doi:10.2478/s11600-010-0009-6
Karakostas, V. G., Papadimitriou, E. E., Karamanos, C. K., and Kemenztetzidou, D. A. (2010). Microseismicity and Seismotectonic Properties of the Lefkada – Kefalonia Seismic Zone. Bull. Geol. Soc. Greece. 43, 2053–2063. doi:10.12681/bgsg.11395
Karakostas, V., Kostoglou, A., Chorozoglou, D., and Papadimitriou, E. (2020). Relocation of the 2018 Zakynthos, Greece, Aftershock Sequence: Spatiotemporal Analysis Deciphering Mechanism Diversity and Aftershock Statistics. Acta Geophys. 68, 1263–1294. doi:10.1007/s11600-020-00483-4
Karakostas, V., Papadimitriou, E., Mesimeri, M., Gkarlaouni, Ch., and Paradisopoulou, P. (2015). The 2014 Kefalonia Doublet (Mw6.1 and Mw6.0) Central Ionian Islands, Greece: Seismotectonic Implications Along the Kefalonia Transform Fault Zone. Acta Geophysica. 63, 1. doi:10.2478/s11600-014-0227-4
Kodera, Y., Yamada, Y., Hirano, K., Tamaribuchi, K., Adachi, S., Hayashimoto, N., et al. (2018). The Propagation of Local Undamped Motion (PLUM) Method: A Simple and Robust Seismic Wavefield Estimation Approach for Earthquake Early Warning. Bull. Seismol. Soc. Am 108 (2), 983–1003. doi:10.1785/0120170085
Kohler, M. D., Cochran, E. S., Given, D., Guiwits, S., Neuhauser, D., Henson, I., et al. (2017). Earthquake Early Warning ShakeAlert System: West Coast Wide Production Prototype. Seismol. Res. Lett. 89 (1), 99–107. doi:10.1785/0220170140
Kostoglou, A., Karakostas, V., Bountzis, P., and Papadimitriou, E. (2020). Τhe February-March 2019 Seismic Swarm Offshore North Lefkada Island, Greece: Microseismicity Analysis and Geodynamic Implications. Appl. Sci. 10, 4491. doi:10.3390/app10134491
Lancieri, M., and Zollo, A. (2008). A Bayesian Approach to the Real-Time Estimation of Magnitude From the EarlyPandSwave Displacement Peaks. J. Geophys. Res. 113, B12302. doi:10.1029/2007JB005386
Liu, A., and Yamada, M. (2014). Bayesian Approach for Identification of Multiple Events in an Early Warning System. Bull. Seismological Soc. America. 104 (3), 1111–1121. doi:10.1785/0120130208
Lomax, A., Satriano, C., and Vassallo, M. (2012). Automatic Picker Developments and Optimization: FilterPicker-Aa Robust, Broadband Picker for Real-Time Seismic Monitoring and Earthquake Early Warning. Seismological Res. Lett. 83, 531–540. doi:10.1785/gssrl.83.3.531
Meier, T., Rische, M., Endrun, B., Vafidis, A., and Harjes, H.-P. (2004). Seismicity Of The Hellenic Subduction Zone In The Area Of Western And Central Crete Observed By Temporary Local Seismic Networks. Tectonophy. 383 (3–4), 149–169. doi:10.1016/j.tecto.2004.02.004
Papadimitriou, E., Gospodinov, D., Karakostas, V., and Astiopoulos, A. (2013). Evolution of the Vigorous 2006 Swarm in Zakynthos (Greece) and Probabilities for Strong Aftershocks Occurrence. J. Seismol. 17, 735–752. doi:10.1007/s10950-012-9350-3
Papadimitriou, E., Karakostas, V., Mesimeri, M., and Vallianatos, F. (2016). The Mw6.7 12 October 2013 Western Hellenic Arc Main Shock And Its Aftershock Sequence: Implications Of The Slab Properties. Inter. J. Earth Sci. 105, 2149–2160. doi:10.1007/s00531-016-1294-3
Papadimitriou, E., Karakostas, V., Mesimeri, M., Chouliaras, G., and Kourouklas, C. (2017). The Mw6.5 17 November 2015 Lefkada (Greece) Earthquake: Structural Interpretation by Means of the Aftershock Analysis. Pure Appl. Geophys. 174 (10), 3869–3888. doi:10.1007/s00024-017-1601-3
Papazachos, B. C., and Papazachou, C. (2003). The Earthquakes of Greece. Thessaloniki: Ziti Publication, 317.
Popandopoulos, G. A. (2014). Gutenberg-Richter Law Parameters Analysis Using the Hellenic Unified Seismic Network Data Through FastBee Technique. Earth. 3 (No. 5), 122–131. doi:10.11648/j.earth.20140305.12
Satriano, C., Elia, L., Martino, C., Lancieri, M., Zollo, A., and Iannaccone, G. (2011). PRESTo, the Earthquake Early Warning System for Southern Italy: Concepts, Capabilities and Future Perspectives. Soil Dyn. Earthquake Eng. 31 (2), 137–153. doi:10.1016/j.soildyn.2010.06.008
Satriano, C., Lomax, A., and Zollo, A. (2008). Real-Time Evolutionary Earthquake Location for Seismic Early Warning. Bull. Seismological Soc. America. 98 (3), 1482–1494. doi:10.1785/0120060159
Sokos, E., Tselentis, G.-A., Paraskevopoulos, P., Serpetsidaki, A., Stathopoulos-Vlamis, A., and Panagis, A. (2016). Towards Earthquake Early Warning for the Rion-Antirion Bridge, Greece. Bull. Earthquake Eng. 14, 2531–2542. doi:10.1007/s10518-016-9893-8
Suárez, G., Espinosa‐Aranda, J. M., Cuéllar, A., Ibarrola, G., García, A., Zavala, M., et al. (2018). A Dedicated Seismic Early Warning Network: The Mexican Seismic Alert System (SASMEX). Seismological Res. Lett. 89 (2A), 382–391. doi:10.1785/0220170184
Vassallo, M., Satriano, C., and Lomax, A. (2012). Automatic Picker Developments and Optimization: A Strategy for Improving the Performances of Automatic Phase Pickers. Seismological Res. Lett. 83 (3), 541–554. doi:10.1785/gssrl.83.3.541
Worden, C. B., Gerstenberger, M. C., Rhoades, D. A., and Wald, D. J. (2012). Probabilistic Relationships between Ground–Motion Parameters and Modified Mercalli Intensity in California. Bull. Seismol. Soc. Am 102 (1), 204–221. doi:10.1785/0120110156
Wu, S., Yamada, M., Tamaribuchi, K., and Beck, J. L. (2015). Multi-events Earthquake Early Warning Algorithm Using a Bayesian Approach. Geophys. J. Int. 200, 791–808. doi:10.1093/gji/ggu437
Wu, Y.-M., and Hiroo, K. (2005). Rapid Assessment of Damage Potential of Earthquakes in Taiwan from the Beginning of P Waves. Bull. Seismological Soc. America. 95 (3), 1181–1185. doi:10.1785/0120040193
Wu, Y.-M., Hsiao, N-C., Chin, T-L., Chen, D-Y., Chan, Y-T., and Wang, K-S. (2014). “Earthquake Early Warning System in Taiwan,” in Encyclopedia of Earthquake Engineering. Editors M. Beer, I. A. Kougioumtzoglou, E. Patelli, and S. K. Au (Berlin: Springer). doi:10.1007/978-3-642-36197-5_99-1
Zollo, A., Caruso, A., de Landro, G., Colombelli, S., and Elia, L. (2021). A Bayesian Method for Real‐Time Earthquake Location Using Multiparameter Data. J. Geophys. Res. Solid Earth. 126, e2020JB020359. doi:10.1029/2020JB020359
Keywords: earthquake early warning (EEW), ionian islands, real-time seismology, seismic risk, real-time source parameters
Citation: Bracale M, Colombelli S, Elia L, Karakostas V and Zollo A (2021) Design, Implementation and Testing of a Network-Based Earthquake Early Warning System in Greece. Front. Earth Sci. 9:667160. doi: 10.3389/feart.2021.667160
Received: 12 February 2021; Accepted: 13 September 2021;
Published: 29 September 2021.
Edited by:
Carmine Galasso, University College London, United KingdomReviewed by:
Elisa Zuccolo, Fondazione Eucentre, ItalyRaffaele De Risi, University of Bristol, United Kingdom
Copyright © 2021 Bracale, Colombelli, Elia, Karakostas and Zollo. This is an open-access article distributed under the terms of the Creative Commons Attribution License (CC BY). The use, distribution or reproduction in other forums is permitted, provided the original author(s) and the copyright owner(s) are credited and that the original publication in this journal is cited, in accordance with accepted academic practice. No use, distribution or reproduction is permitted which does not comply with these terms.
*Correspondence: S. Colombelli, c2ltb25hLmNvbG9tYmVsbGlAdW5pbmEuaXQ=