 Wanju Li1,2
 Xueyan Bi
 Lifang Sheng
 Jianhua Sun
- 1College of Oceanic and Atmospheric Sciences, Ocean University of China, Qingdao, China
- 2Guangzhou Institute of Tropical and Marine Meteorology, China Meteorological Administration, Guangzhou, China
- 3State Key Laboratory of Severe Weather, Chinese Academy of Meteorological Sciences, Beijing, China
- 4Key Laboratory of Cloud-Precipitation Physics and Severe Storms, Institute of Atmospheric Physics, Chinese Academy of Sciences, Beijing, China
Based on hourly high-density precipitation data in Guangdong Province, China, 134 warm-sector heavy rainfall (WSHR) events were selected from 2016 to 2018. The synoptic weather patterns of these WSHR events were objectively classified using T-mode principal component analysis. Six WSHR weather patterns were identified, as follows: Type 1-southwest (T1-SW), Type 2-southeast (T2-SE), Type 3-coastal jets I (T3-CJI), Type 4-coastal jets II (T4-CJ II), Type 5-western low vortex (T5-WL), and Type 6-high-pressure (T6-HP). Three high-occurrence WSHR centers were finally extracted: the areas of Yangjiang and Shanwei, and the urban agglomeration of Guangdong–Hong Kong–Macao Greater Bay Area (GBA). Compared with the other five patterns, T6-HP is a newly identified WSHR weather pattern, which is related to a local/small-scale weather system in the context of anomalous northward movement of the western Pacific subtropical high. Notably, the precipitation area of the T6-HP type of WSHR event is smaller, which can only be captured by high-density observations. In addition, the occurrence locations of six large-scale extreme precipitation events were closely associated with the urban agglomerations in GBA, implying that urbanization plays an important role in extreme magnitudes of large-scale WSHR events and their occurrence centers.
Introduction
South China has the most abundant rainfall in China. Rainstorms in South China usually occur not only in front and behind the front, but also in the warm sector south of the front. Due to the effect of the inconspicuous baroclinicity of the environment, sufficient atmospheric water vapor, strong instability, complex topography, and underlying surface, the warm-sector heavy rainfall (WSHR) often happens suddenly, with significant regional characteristics, and frequent activities of micro and meso-scale systems, which is difficult to forecast (He et al., 2016; Sun et al., 2019).
Previous studies have shown that there are many factors influencing WSHR events in South China, including large-scale circulation, weather systems, the underlying surface, topography, and cloud microphysical processes (Zhao and Wang, 2009). The atmospheric circulations in the middle and high latitudes of Eurasia, the West Pacific subtropical high, the South Asian high, and the subtropical westerly jet are the main weather systems that lead to WSHR in South China. The weather system plays an important role in the configuration and adjustment of the conditions of the convective environment, such as vertical shear, convective stability, and water vapor distribution (Wang et al., 2018). The typical weather systems of WSHR events have been classified and summarized based on different criteria. For example, the large-scale circulation patterns can be divided into the Eurasian circulation type, subtropical high type, and tropospheric divergence type (Li et al., 1981; Zhao and Wang, 2009). According to the weather situation of the low-level troposphere, Huang (1986) summarized four types of WSHR: warm wind shear line, the Low Level Jet (LLJ) along coastlines, the prefrontal LLJ, and cold fronts or quasi-stationary fronts. Lin (2006) classified WSHR in the pre-rainy season into three types: (1) high-altitude trough, which means heavy rain caused by the convergence of southerly winds in the boundary layer and forced uplift of the terrain; (2) strong southwest monsoon, which is a type of heavy rain caused by strengthening of the monsoon and formation of low-level jets; and (3) backflow heavy rainfall, which is where the cold air flows back after moving out to sea, and the easterly and southwesterly winds converge. This last type is relatively rare compared with the other two. Chen et al. (2012) used reanalysis data and 77 meteorological stations to count the WSHR events from 2000 to 2009 in May and June, and divided them into three types: shear linear, low vortex, and southerly wind. He et al. (2016) summarized three WSHR weather system configuration models – namely, boundary layer convergence line type, southerly wind speed convergence type, and strong southwest jet type. Based on the data of 124 national stations in the South China region, Liu et al. (2019) identified 177 WSHR events from 1982 to 2015 and summarized their spatial and temporal distribution characteristics. They suggested that the weather patterns of WSHR in South China mainly include wind shear, a low vortex, southerly wind, and backflow. However, despite these efforts, due to differences in case selection, classification, data selection, and study period, no unified conclusion has yet been reached on classifying the weather situation that affects WSHR.
The main influencing factors of WSHR are the southerly wind, jet stream, low vortex, and shear line, which play key roles in determining the location, time, and intensify of WSHR. Based on statistical analysis of operational practice and experience, and by using precipitation data from national basic stations along with reanalysis data, previous studies mainly classified the WSHR events before 2016, and the statistical results were mostly the typical circulation characteristics. However, WSHR is sometimes caused by abnormal weather patterns, which tend to be small in scope, and the width of some extremely heavy rains are only 20–30 km (Lin, 2006).
To date, there have been few examples of applying objective weather classification methods to studying the weather pattern statistics of WSHR. With this in mind, the present paper uses an objective classification method to classify the weather situation affecting WSHR. Not only can it identify the typical circulation situation when the rainstorm occurs, but it can also distinguish the abnormal circulation, so as to better reflect the temporal and spatial characteristics of precipitation in different types of WSHR events.
Guangdong Province has a high spatiotemporal density of automatic weather stations (Wu et al., 2020), As the increased station density, more extreme precipitation events can be recorded by automatic weather stations. For example, a persistent torrential rain event associated with monsoon depression occurred in Guangdong from 27 August to 1 September 2018 resulting in a 24 h rainfall amount of 1056.7 mm recorded by automatic weather station, which refreshed the historical record of Guangdong Province (Cai et al., 2019). Hence, we employed the data of this dense observation station network, which is conducive to capturing small-scale processes, to explore WSHR events. The rest of the paper is organized as follows: The data and methods are introduced in section 2. The WSHR selection and classification results are presented in sections 3 and 4, respectively. The temporal and spatial distribution characteristics of WSHR under different weather types are analyzed in section 5. The possible reasons for abnormal weather are discussed in section 6, and conclusions are given in section 7.
Data and Methods
Data
The rainfall cases were selected by using the hourly precipitation data of Guangdong regional automatic stations from 1 April 2016 to 30 September 2018. Considering the continuity of the data, the proportion of effective hourly precipitation data was required to be no less than 85% of the total data, meaning a total of 2,667 stations were selected. To identify the synoptic patterns, we used ERA5 [the fifth major global reanalysis produced by the European Center for Medium-Range Weather Forecasts (ECMWF)]. Severe precipitation events in southern China caused by typhoons were excluded (Ying et al., 2014).
Classification Method
T-mode principal component analysis (PCT) in COST733 software (Philipp et al., 2014) were used to objectively classify the weather system when the rainstorm occurred in WSHR events. COST733 is a weather classification software developed by the EU COST (European Cooperation in Science and Technology) 733 program. PCT is the most widely used objective classification method at present. Huth (1996) pointed out that the principal component analysis (PCA) method is more stable in time and space, less dependent on preset parameters, and can better retain the information of the original field, making it a more promising objective classification method. PCT is based on the PCA, and further improved by Huth (2000); and Huth et al. (2008). T-mode means daily patterns form the columns in the input data matrix, whereas the grid-point values form its rows. The PCT method has been widely used in classifying weather patterns in research on precipitation, ozone, and haze, amongst others (Dong et al., 2020; Ning et al., 2020; Yang et al., 2021; Zong et al., 2021).
In this study, daily mean GH at 850 hPa level is chosen to identify synoptic patterns of WSHR, as the water vapor flux is closely related to 850 hPa synoptic systems (Yang et al., 2021). More detailed information about the objective classification and the PCT method is provided in the supplementary document. To assess the performance of synoptic classification and determine the number of classes, the explained cluster variance (ECV) is selected in this study (Hoffmann and Schlünzen, 2013; Philipp et al., 2014; Ning et al., 2019, 2020). The detailed information about the ECV is also provided in the supplementary document.
Definition and Selection of WSHR Events
Due to the complexity and variability of WSHR, there is no uniform definition of the WSHR in South China. According to Liu et al. (2019), heavy precipitation events were selected first, as follows: (1) the precipitation affected by typhoons was eliminated; (2) the daily precipitation of three or more stations whose distance was less than 100 km was greater than or equal to 50 mm; (3) the total precipitation of a single station in three consecutive hours was greater than or equal to 30 mm, and the hourly precipitation of each of these 3 h was greater than or equal to 5 mm (Wang et al., 2014). In these heavy precipitation events, the criteria for selecting the WSHR events were as follows: (1) According to the distribution of the daily precipitation of the selected cases, sites were selected that met the requirements of three consecutive hours of precipitation greater than or equal to 30 mm and a single hour greater than or equal to 5 mm. In the precipitation area, the station with the largest amount of precipitation that met the above conditions was the representative station (if there were multiple precipitation areas at the same time, a representative station for each precipitation area was chosen). (2) Along the longitude of each representative station, a vertical profile of the relevant physical quantities was drawn (potential pseudo-equivalent temperature (θse), temperature advection, station precipitation) (the figure is omitted), and the location of the front (with dense θse profiles), cold advection, and precipitation determined. (3) If there was no obvious front in the profile, the middle and low altitudes of the precipitation area featured southerly wind and the distance from the surface northerly wind was greater than 200 km. (4) If there was an obvious frontal system in the profile, the distance between the precipitation area and the front was greater than 200 km.
Based on the data of 2,667 automatic stations in Guangdong, 134 cases of WSHR events were selected from April to September 2016 to 2018. By counting the average rainfall of each station in all WSHR events (Figure 1), it can be seen that the average precipitation of WSHR events in Guangdong is more in the coastal area and less in the inland area. There are three WSHR centers. In addition to the two WSHR centers on the western coast of Guangdong near Yangjiang and the eastern coast of Guangdong near Shanwei mentioned by Wu et al. (2019), a precipitation center over the urban agglomeration near Guangzhou is also apparent.
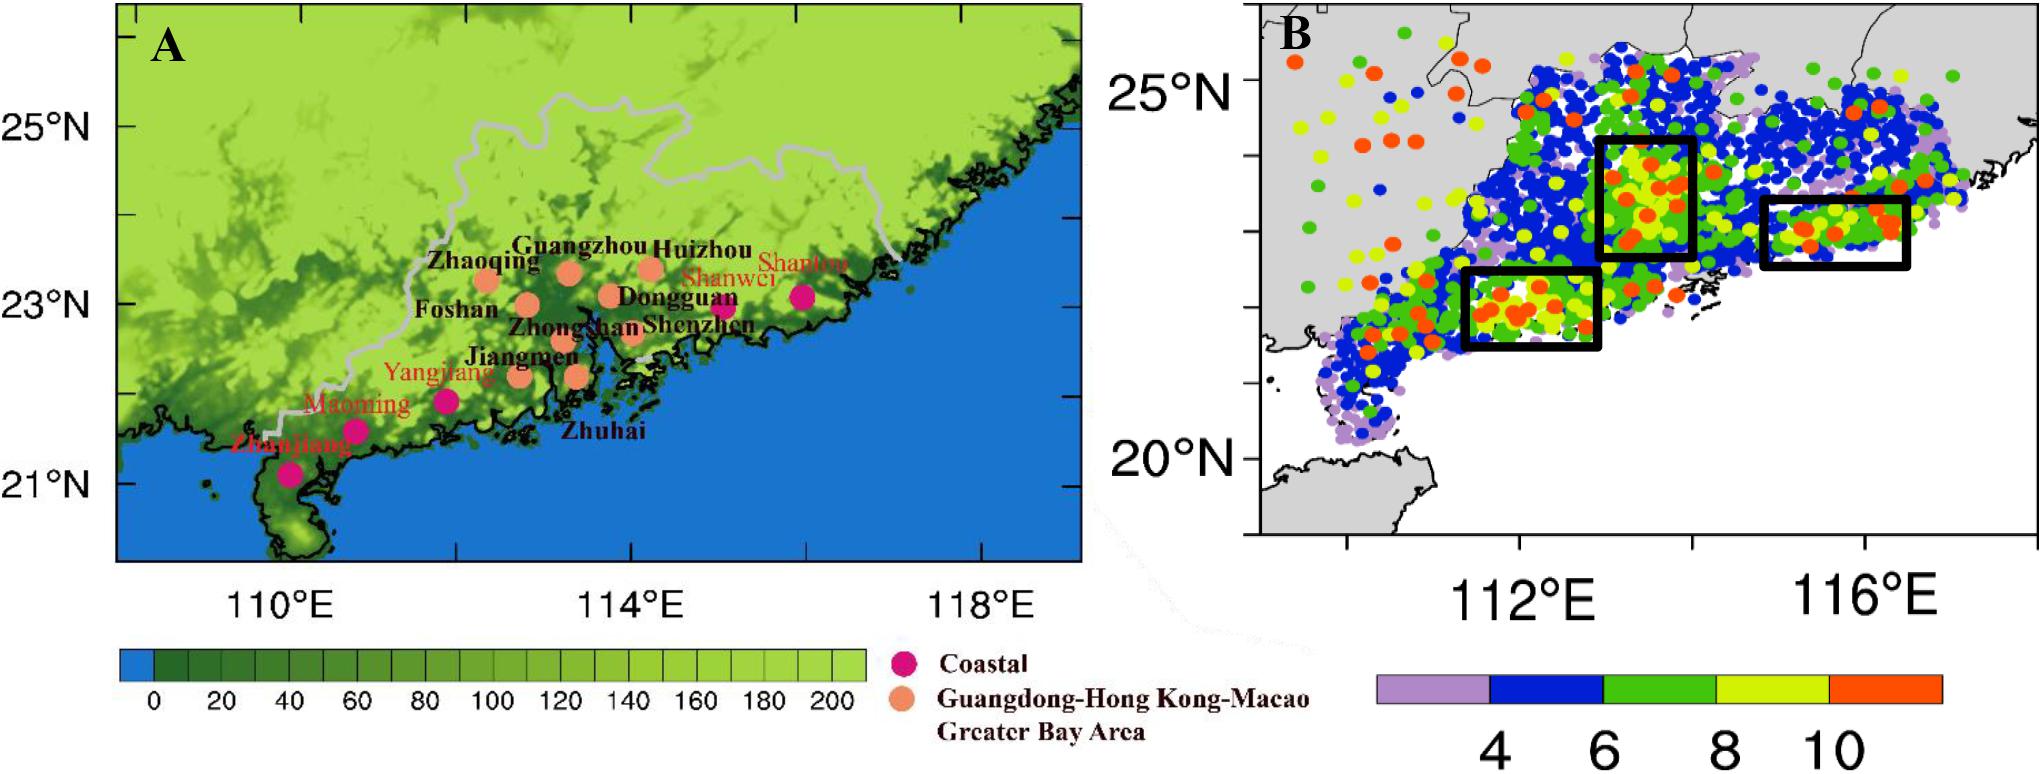
Figure 1. (A) the spatial distribution of major cities mentioned below in Guangdong Province (B) Average daily precipitation during WSHR events recorded by meteorological stations from April to June 2016–2018 (units: mm/d). The black boxes indicate the locations of the three heavy rainfall centers.
Objective Weather Classification of WSHR
Classification Results
PCT objective typing was performed on the 850 hPa geopotential height field, and six circulation types were obtained (Figure 2). These patterns exhibit distinct spatial characteristics, as follows: (1) Type1-southwest wind (T1-SW), in which Guangdong is mainly controlled by southwesterly wind. This kind of weather situation is similar to the southerly wind pattern described in previous study (Chen et al., 2012). The rainstorm of T1-SW is mostly caused by the convergent shear of the southwesterly wind. It is a common type of rainstorm in WSHR (Chen et al., 2012), and accounts for nearly half of the total (Table 1). (2) Type2-southeast wind (T2-SE), in which the southeasterly wind is perpendicular to the coastline, which is similar to the southerly wind pattern in previous study (Miao et al., 2018). In the pre-rainy season, heavy rain, local heavy rain, and extreme heavy rain that forms along the coast of South China – especially to the west of the Pearl River Estuary in Guangdong – are mostly caused by this circulation (Miao et al., 2018). (3) Type3- coastal jets I (T3-CJI) and (4) Type4- coastal jets II (T4-CJII), which are both accompanied by coastal jets (gray shaded area in Figure 2), but differ in that the T3-CJI jet is located to the north and Guangdong is in the jet stream, which is similar to the southwest jet stream (Miao et al., 2018) and the strong southwest jet stream (He et al., 2016). This type of WSHR is mainly triggered by the low-level jet stream axis or the high-wind core, as well as by boundary layer wind speed pulsation and topographic uplift. Compared with previous studies, the T4-CJII jet stream is slightly southerly, and wind speeds converge in Guangdong. (5) Type5- western low vortex (T5-WL), in which there is a low vortex in the western part of Guangdong, and Guangdong is in the front part of the low vortex, which is consistent with the low vortex type obtained in previous studies (Chen et al., 2012; Liu et al., 2019). The precipitation corresponding to this type is large, and the WSHR event occurs in the low vortex circulation area – close to the center of the low vortex (Chen et al., 2012). (6) Type6-high pressure (T6-HP), in which the wind speed in Guangdong is relatively low, and the entire area is under the control of high pressure. This is a new type of weather circulation that cannot be classified into previous weather types. The number of cases and their percentages of the six weather types are shown in Table 1. T6-HP has a relatively lower frequency of occurrence, which is different from the typical weather circulation in previous studies and belongs to abnormal weather types.
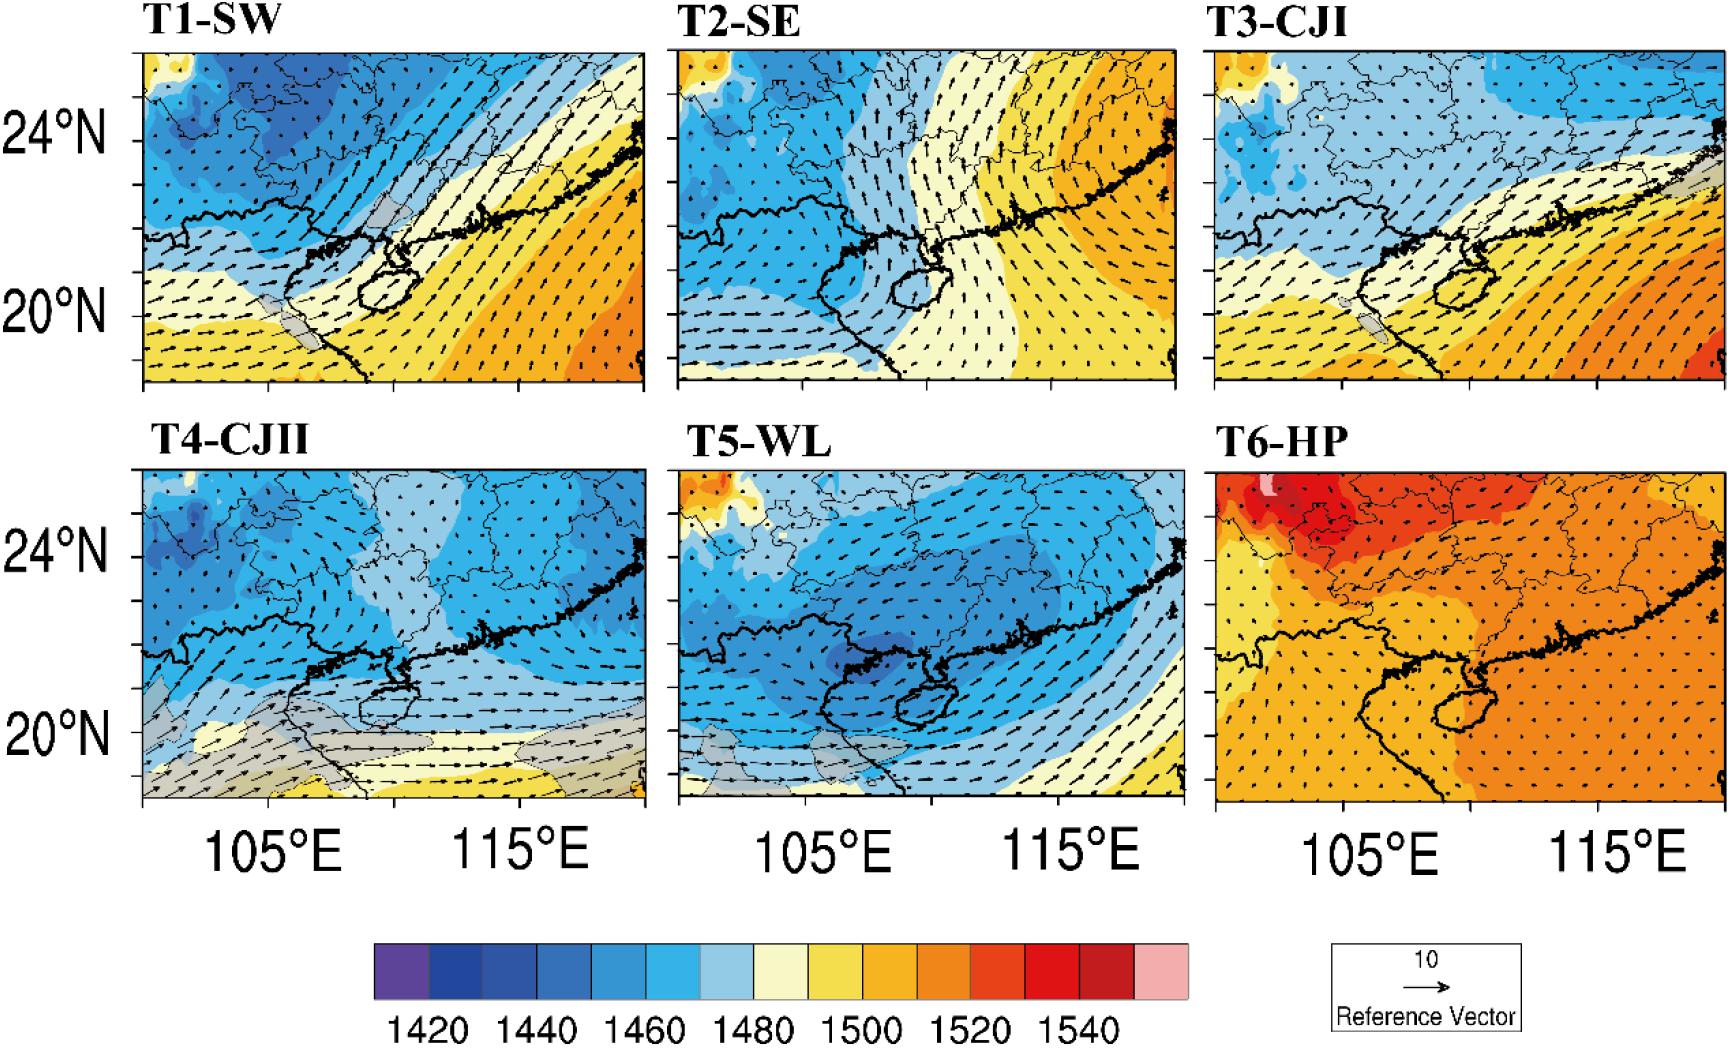
Figure 2. Mean 850-hPa geopotential height and wind vector in six types of WSHR. The gray shading indicates areas where the wind speed is greater than 10 m/s.
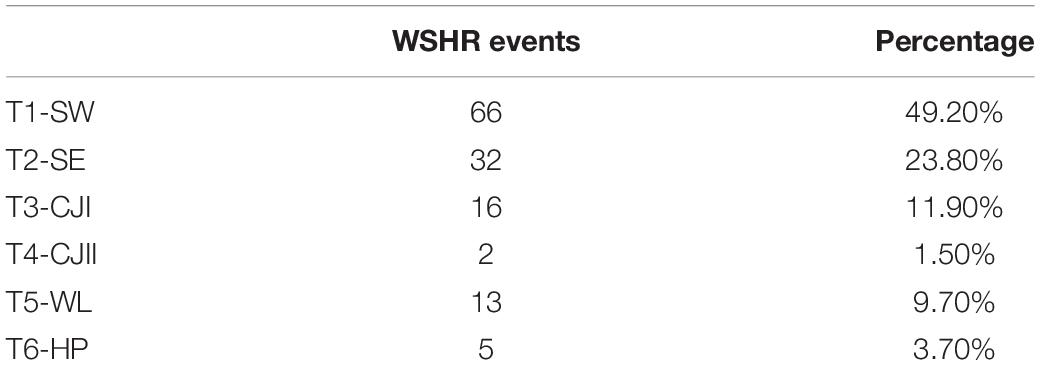
Table 1. Number and percentage of WSHR events for six synoptic weather types.
Temporal and Spatial Characteristics of Different WSHR Types
Figure 3 shows the daily, monthly, and annual distributions of the six synoptic weather types. It can be seen that the six types of circulation have obvious monthly and intra-year changes. The incidence of WSHR is high in June and July, with 32 and 35 occurrences. After August, the frequency of WSHR decreases significantly, with only 14 occurrences. This shows that WSHR occurs not only in the pre-rainy season, but also in the post-rainy season, which should be paid more attention.
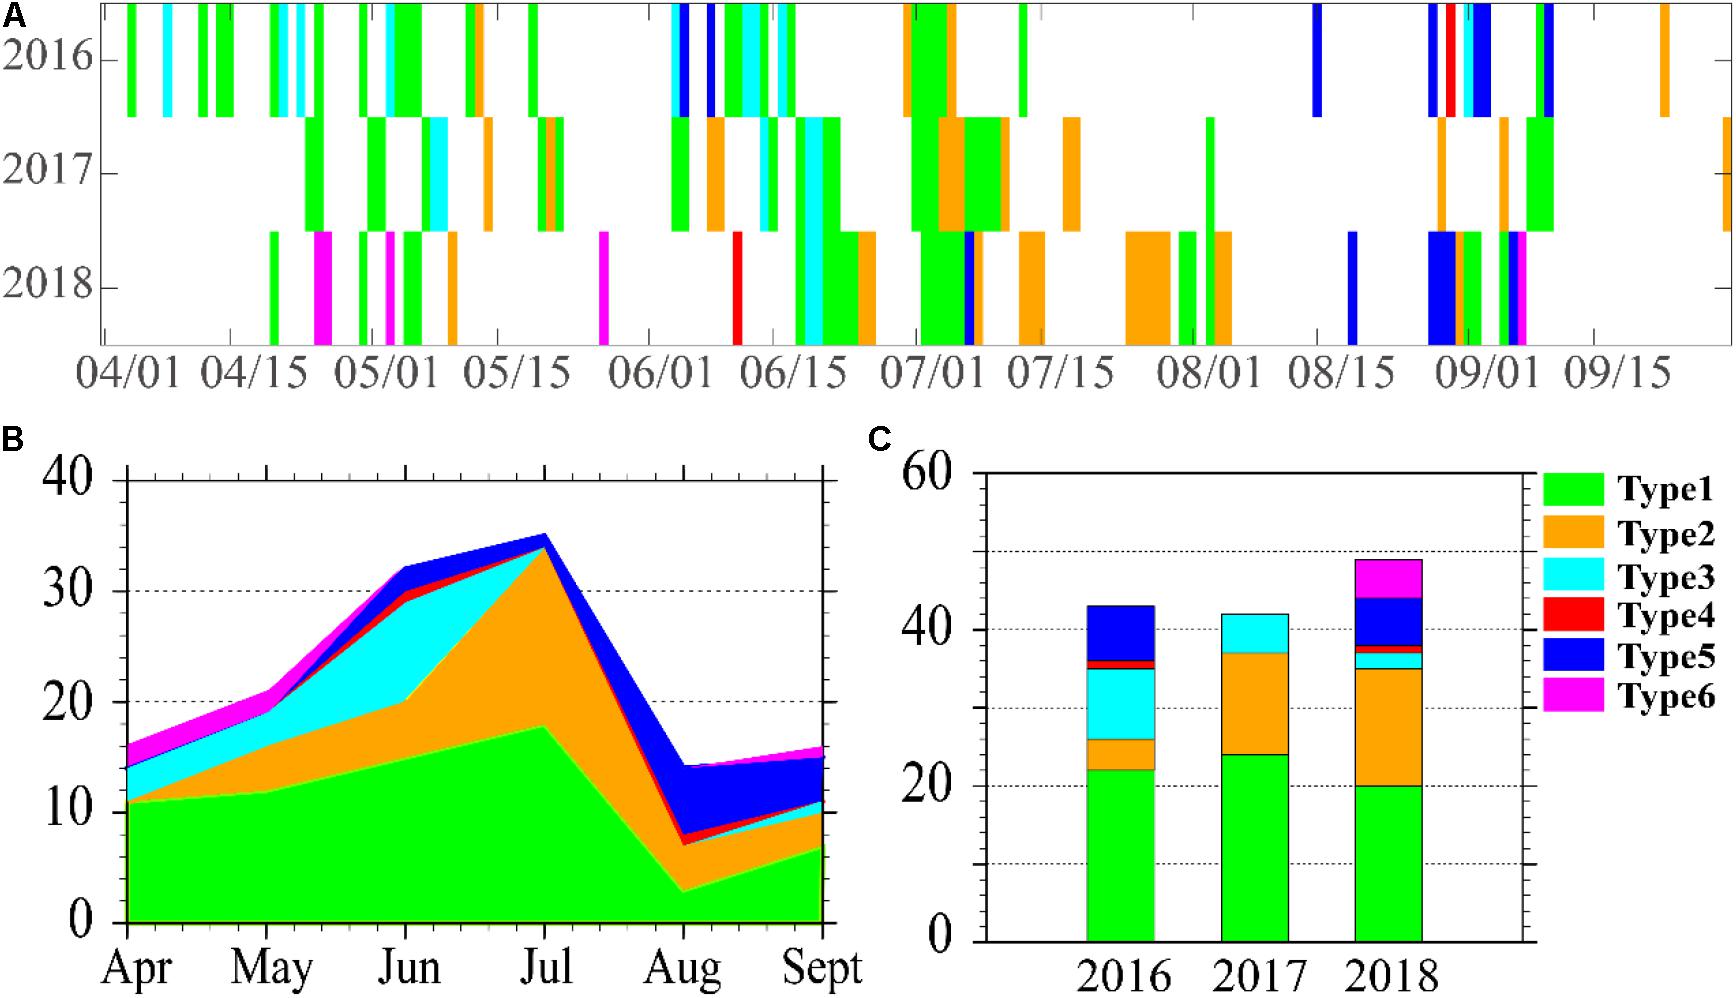
Figure 3. Distributions of WSHR during six synoptic weather types: (A) daily, (B) monthly, and (C) annual.
As the main circulation type, T1-SW appears throughout almost the whole of the rainy season. T2-SE, T3-CJI, T5-WL, and T6-HP have obvious temporal distributions. The pre-rainy season mainly consists of T3-CJI; the post-rainy season is mainly T5-WL; and T6-HP occurs before the onset of the South China Sea summer monsoon. Afterward, T6-HP almost disappears, while the frequency of T2-SE increases significantly. T4-CJII only occurs twice, on 30 August 2016 and 11 June 2018, respectively. It is worth mentioning that T6-HP has not been seen in previous studies and only appears in 2018 during the 3 years of statistics (Figure 3C), which is discussed in detail below.
Figure 4 shows the anomaly distributions of the corresponding warm rainstorms under six synoptic weather patterns, and mean values of daily precipitation of WSHR are provided in the supplementary document. The spatial patterns of the average precipitation are highly consistent with the anomalies of precipitation, indicating that the results for precipitation spatial patterns of WSHR associated with six synoptic patterns are robust. The precipitation of the T1-SW type is concentrated in the areas of Yangjiang, Guangzhou and Shanwei, while that of a similar weather type in previous work was in Yangjiang area (Chen et al., 2012). The precipitation of the T2-SE type is concentrated in Yangjiang, Jiangmen and Zhanjiang areas, which is similar to previously reported (Miao et al., 2018), but with Zhanjiang added. In previous studies, T3-CJI and T4-CJII were not distinguished owing to their similar weather conditions, but because of the different locations of the jet stream, the precipitation area also differs. The T3-CJI type is concentrated over the urban agglomerations of the Guangdong – Hong Kong – Macao Greater Bay Area (GBA) urban agglomeration and Shantou, which is basically consistent with the conclusion of Miao et al. (2018). T4-CJII concentrates in the area of Zhanjiang. The rainfall of T5-WL is relatively large, concentrated over urban agglomerations and coastal areas of Shantou. Compared with the conclusion in previous studies that the precipitation center is concentrated in Shantou (Chen et al., 2012; Liu et al., 2019), urban agglomerations have been added in the present study. The high T6-HP precipitation areas are concentrated in urban agglomerations.
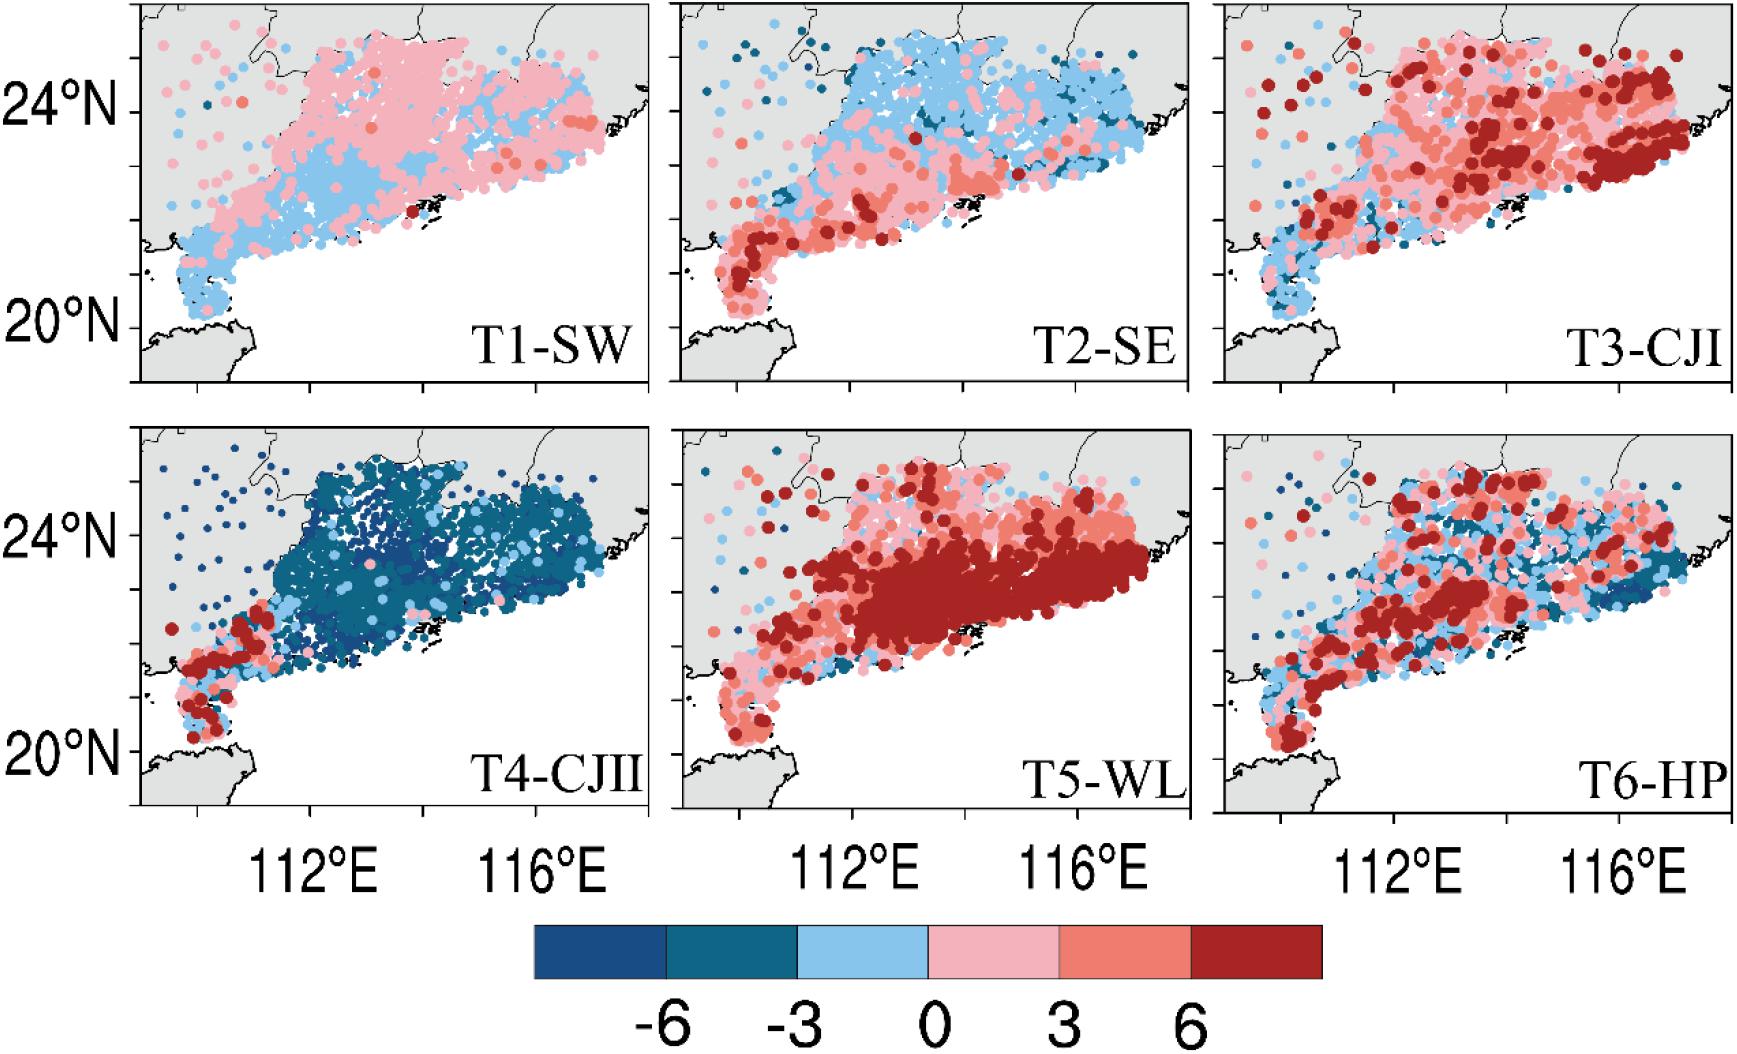
Figure 4. Average daily precipitation anomaly of WSHR for six synoptic weather types (units: mm/d).
Comparing the results of previous studies (Table 2), the T1-SW type adds two high precipitation areas – namely, Guangzhou and Shanwei. For the T2-SE type, Zhanjiang also becomes a high precipitation area. For T3-CJI, T4-CJII, T5-WL, and T6-HP, GBA becomes a high precipitation area. It is found that the precipitation centers of the same type are roughly similar, but the newly discovered urban agglomerations have become precipitation centers under multiple types, indicating that it too is an area with a high incidence of WSHR.
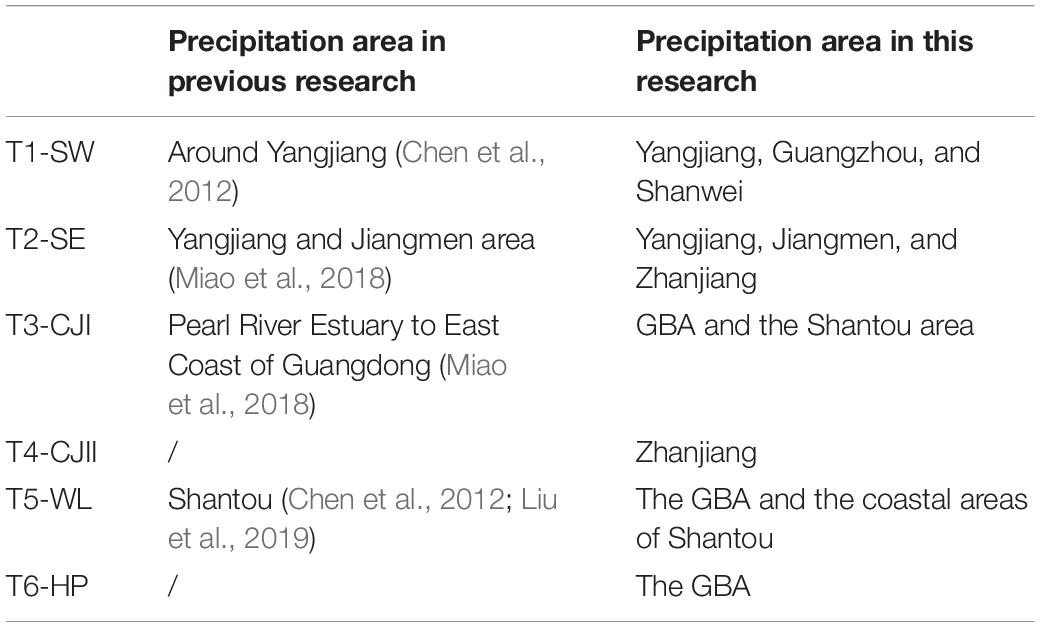
Table 2. Comparison of the precipitation area with previous studies.
In order to explore the scope and intensity of the WSHR events, station with the maximum amount of precipitation among all stations during an extreme precipitation event was set as central station, and the number of stations with daily precipitation exceeding 50 mm within 100 km were counted (Figure 5). It can be seen that the number of stations with precipitation exceeding 50 mm around the central station generally does not exceed 20, and the diameter of the precipitation area is less than 60 km. However, there are also extreme precipitation events. There are more than 100 stations with precipitation exceeding 50 mm around the central station. The estimated diameter of the precipitation area is greater than 134 km, indicating that these WSHR events have strong precipitation and large scope. Six large-scale heavy rainfall events were counted, among which T1-SW occurs twice (on 12 April 2016 in Foshan and on 7 May 2017 in Guangzhou), T5-WL occurs three times (on 5 June 2016 in Zhongshan, on 28 August 2018 in Guangzhou, and on 29 August 2018 in Zhongshan), and T6-HP occurs once (on 3 May 2018 in Jiangmen). These large-scale WSHR events are mostly located closer to the urban agglomeration, which may be related to the heat island effect of the city. Wu et al. (2019) showed that most of the stations in the Pearl River Delta region have experienced a trend of extreme hourly rainfall and increased frequency caused by urbanization in the past few decades. Su et al. (2019) analyzed the variation in presummer precipitation in South China from 1979 to 2015 and its relationship with urbanization, the results also revealed that the intensity of precipitation and the occurrence of extreme precipitation events during the presummer season in South China have increased significantly, and the upward trend is much more significant in urban areas than in non-urban areas. This is because the release of anthropogenic heat and the aerosols produced by urbanization have changed the radiation budget in urban areas, which is conducive to enhanced water vapor transport and upward convergence movement, leading to more frequent extreme precipitation events (Lin et al., 2020).
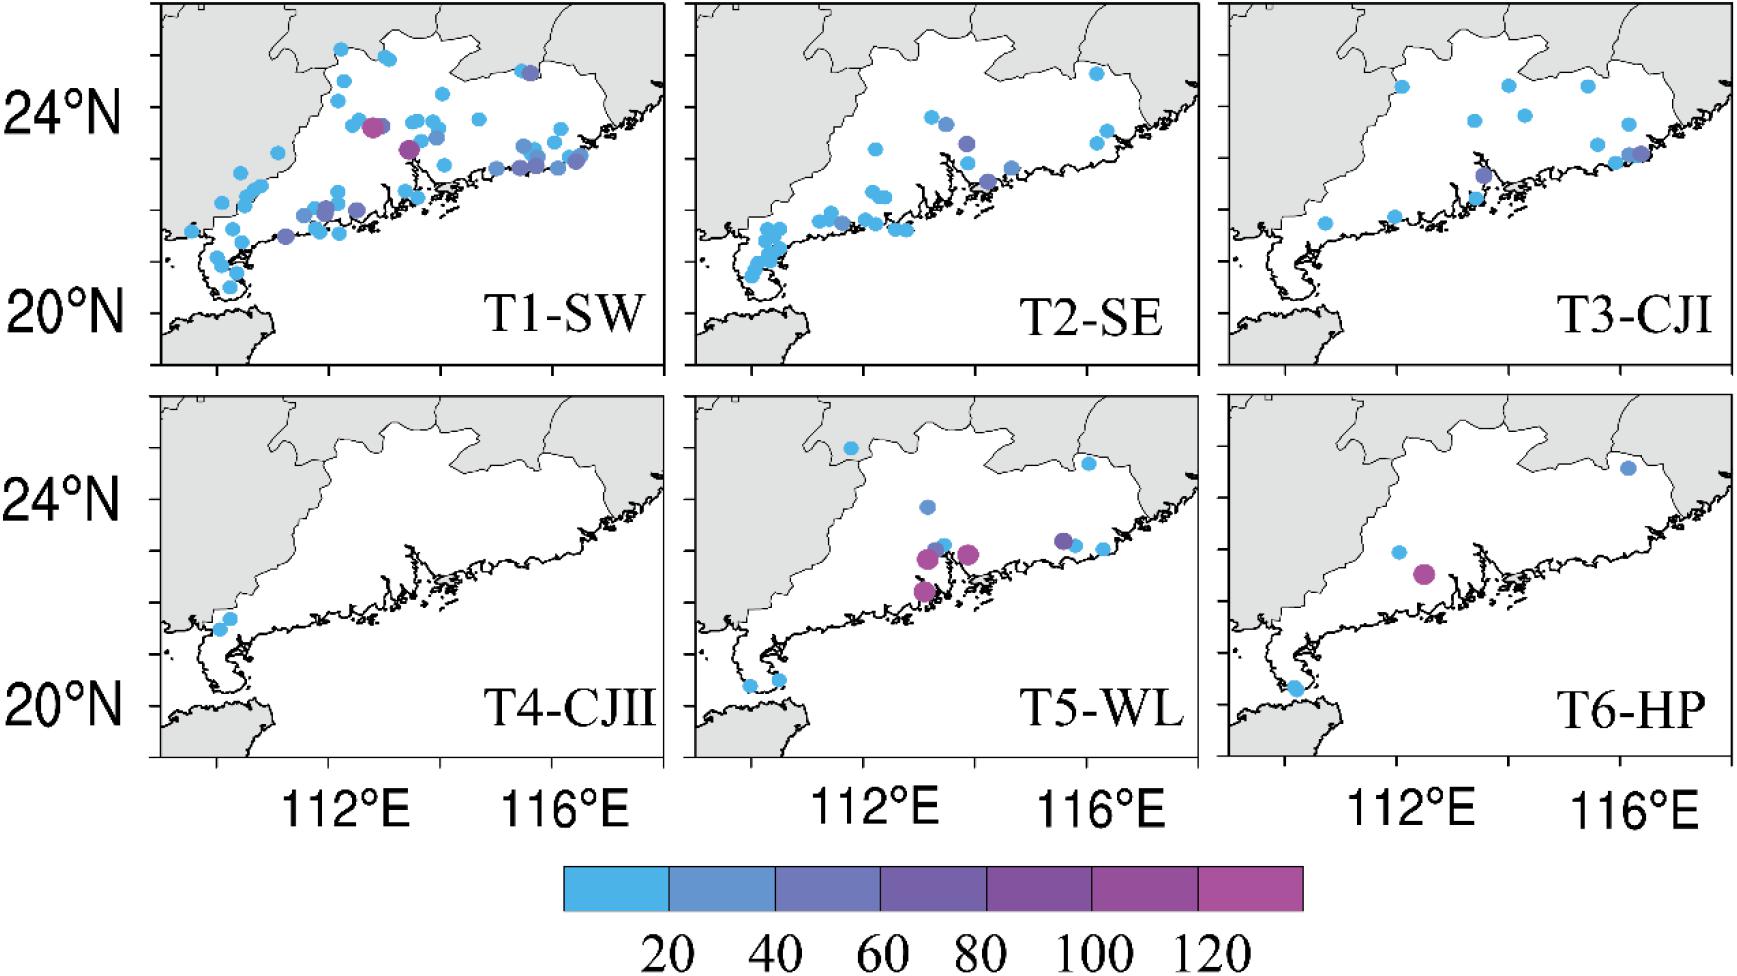
Figure 5. Number of stations with heavy rain (daily precipitation >50 mm/d) around the central station for six weather types.
The percentages of precipitation centers of the six types of WSHR are shown in Figure 6. According to the location of the precipitation center, the WSHR events of South China can be divided into three areas – namely, the coast of Guangdong (coastal), inland of Guangdong (inland), and GBA. It can be seen that in different types the distribution characteristics are also different. Among the six types, coastal precipitation accounts for a large proportion (38.5–100%). T2-SE also accounts for a high percentage of coastal precipitation, reaching 75%. The T4-CJI type of precipitation only occurs along the coast. In addition, T5-WL has the most significant effect on GBA, reaching 38.5%. Under the circulation of T6-HP, the proportion of precipitation in warm areas in inland Guangdong has increased compared with other types, reaching 40%.
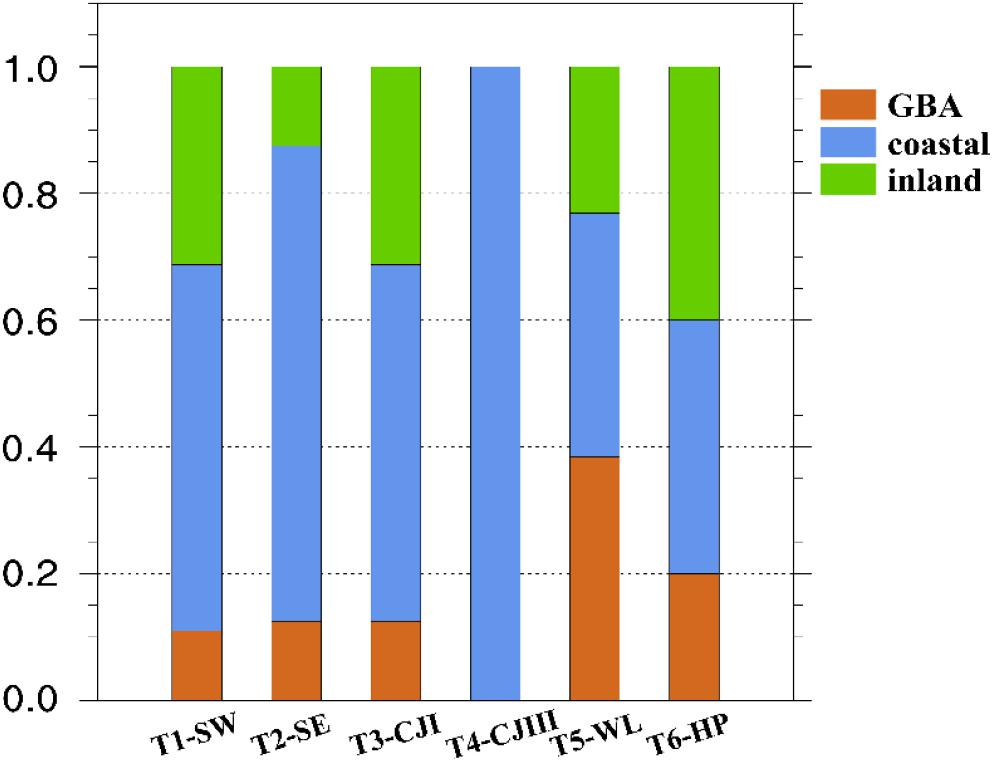
Figure 6. Regional distribution characteristics of six WSHR types.
Potential Association Between Extreme Precipitation and Urbanization
Previous studies have revealed urban areas are more exposed to extreme precipitation than non-urban areas, due to changed land cover, enhanced urban heat island (UHI) and resultant specific local circulation in urban areas (Su et al., 2019; Wu et al., 2019; Lin et al., 2020; Zheng et al., 2020). For example, when there are sufficient water vapors in the lower-level atmosphere, UHI can induce strong updrafts to easily trigger moist convection, enhancing precipitating convective systems with extreme precipitation (Han and Baik, 2008; Su et al., 2019; Lin et al., 2020). To explore the relationship between the six extreme precipitation events mentioned above and UHI effect, the urban heat island intensity (UHII) is introduced (Wu, 2019), which is defined as:
Where Tu and Tr are the hourly average temperatures of urban agglomeration stations and non-urban agglomeration stations, respectively. When there is at least 2 h of UHII >0.53°C, the event is regarded as a strong UHI event; otherwise, it is regarded as a weak UHI event (Wu, 2019).
Figure 7 shows changes of UHII before and after six extreme precipitation near urban agglomerations. It can be seen that within a few hours before precipitation, the UHII increased in varying degrees, and decreased rapidly due to the cooling effect after precipitation. According to the statistics of UHIIs in 3 h before the occurrence of WSHR events in GBA from 2016 to 2018, a total of 21 WSHR events occurred, and the UHII is shown in Table 3. There are 14 strong UHI events (bold), four weak UHI events (∗), and three weak urban cold island events, showing that most extreme precipitation events occurred under the strong UHI situation before precipitation. This implies that urban heat island effect has a potential role in promoting the occurrences of local extreme precipitation events in warm sector, which is coincide with previous studies over south China (Su et al., 2019; Wu et al., 2020; Lin et al., 2020).
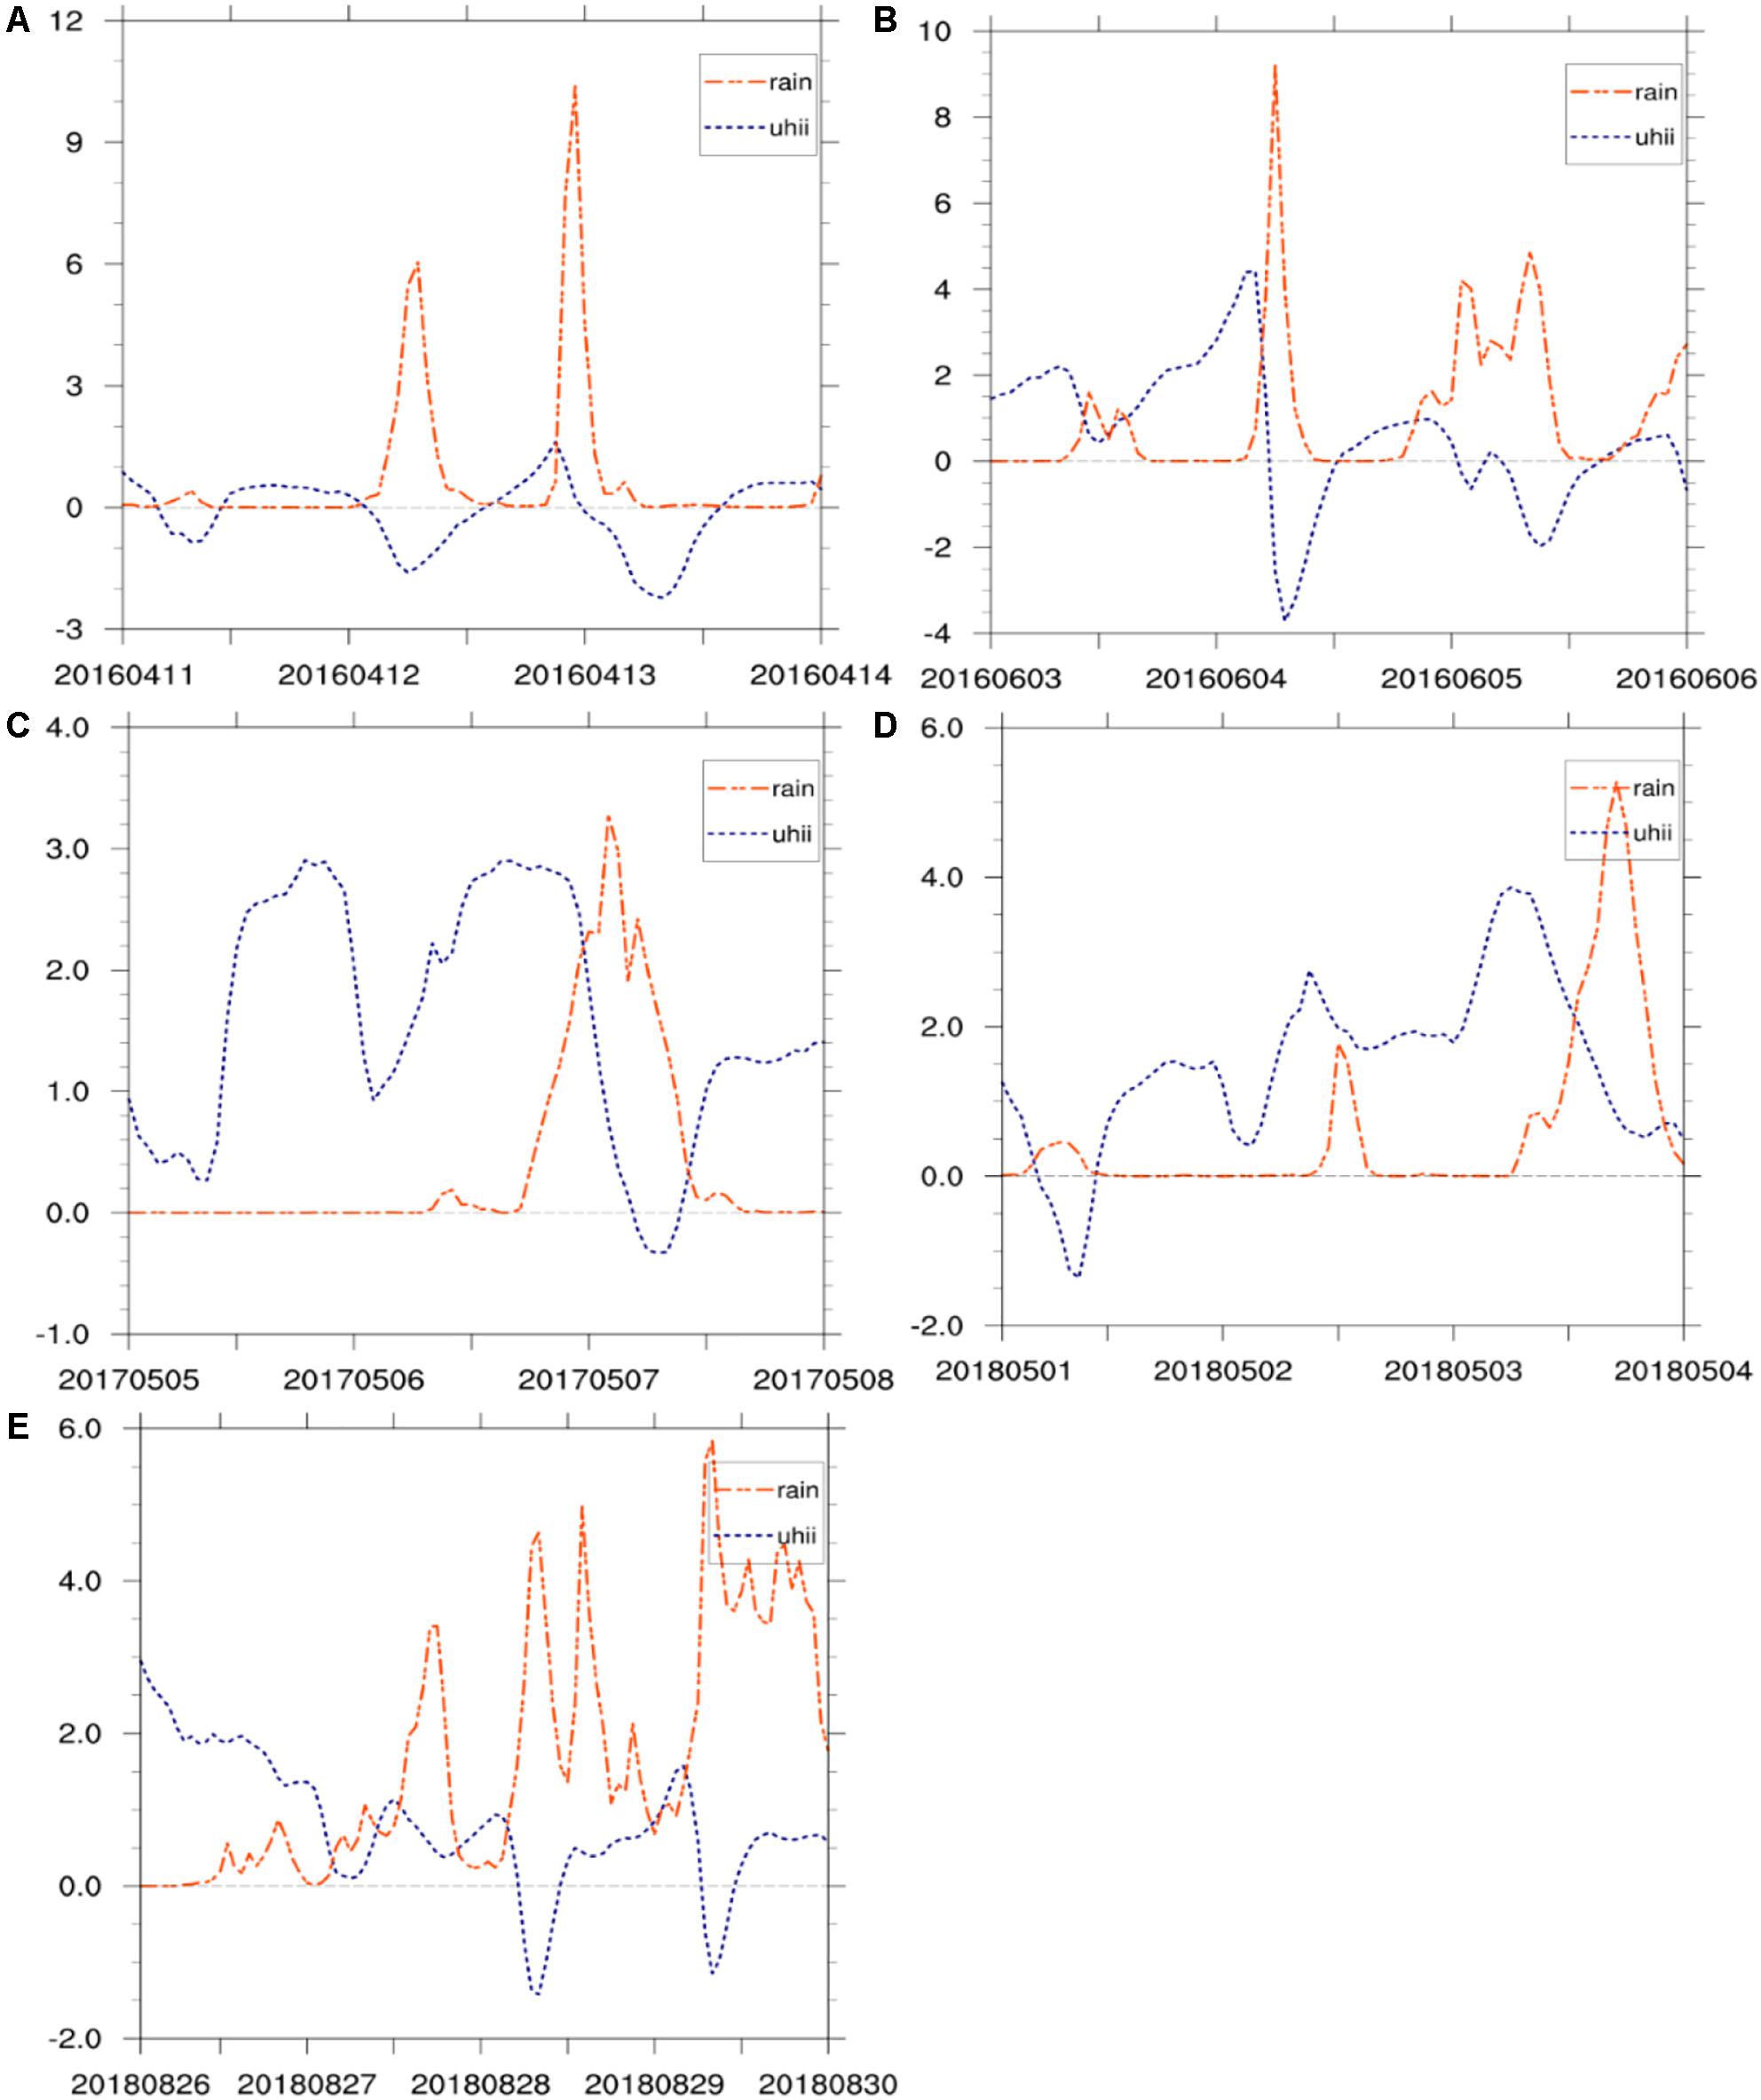
Figure 7. Hourly precipitation (unit: mm) and UHII (unit:°C) change with time on (A) 12 April 2016, (B) 5 June 2016, (C) 7 May 2017, (D) 3 May 2018, (E) 28 August 2018 and 29 August 2018.
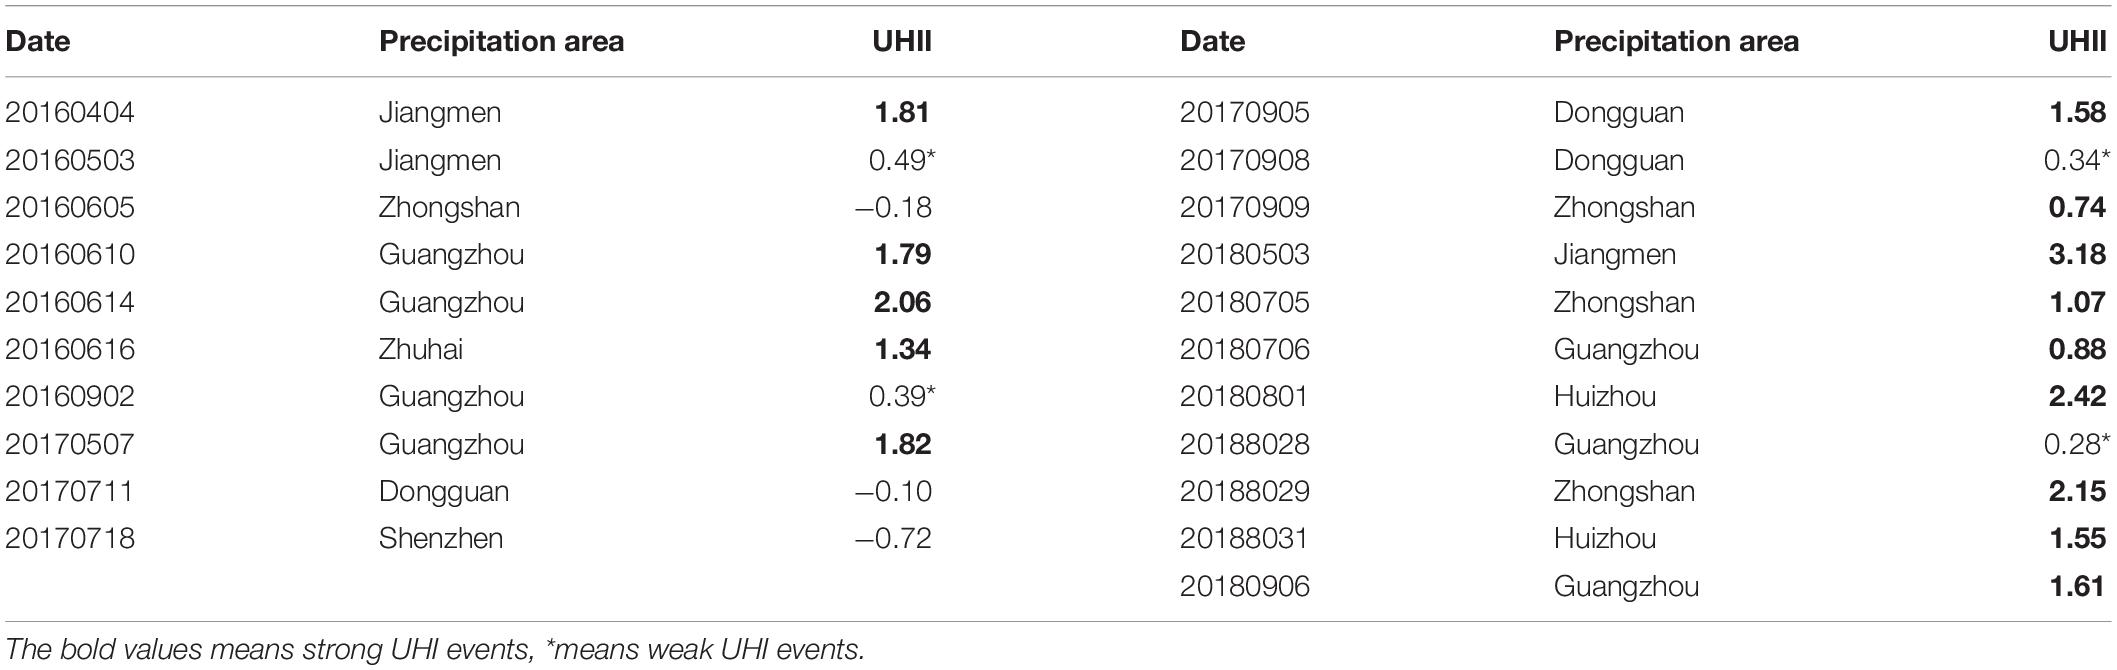
Table 3. WSHR events associated with UHII in GBA.
Abnormal Weather Type
Previous studies failed to mention that WSHR can occur under the control of high-pressure weather systems, possibly because of the absence of capturing these processes. Figure 8 shows the daily precipitation distributions of five WSHR events under T6-HP circulation. It can be seen from the figure that the WSHR events under this type are mostly small in scale and strong in locality. Many high-value areas lack the distribution of basic stations. According to the criteria for judging WSHR, this may lead to the this process not being identified when quantifying the WSHR, thereby omitting this type of weather.
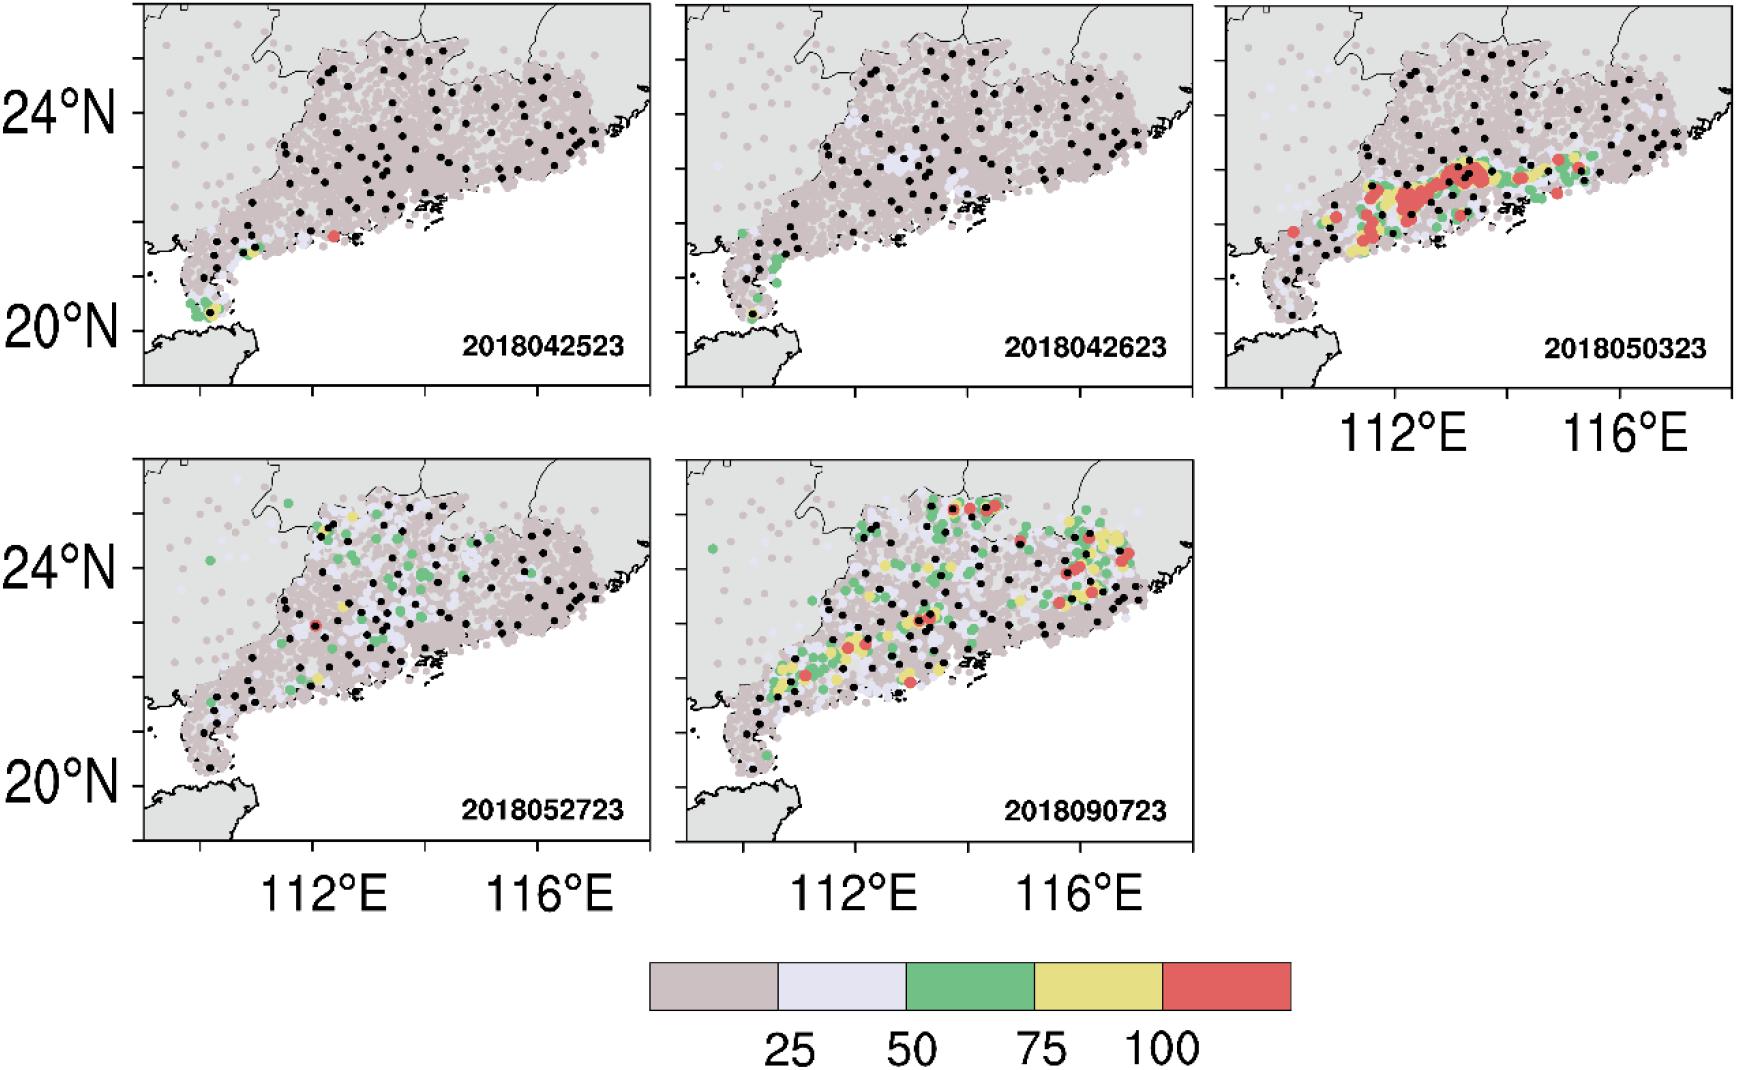
Figure 8. The locations of national basic stations (black dots) and regional automatic stations (colored dots), for which the color refers to the daily precipitation (units: mm/d).
In addition to the objective limitation of station density, the circulation in this year was also different from the previous 2 years. Comparing the location of the 500-hPa subtropical high of the six types (Figure 9) and four related indexes (Figure 10), it can be seen that the subtropical high area of T4-CJII and T6-HP is relatively small, the ridge point is westward, and the intensity is weak. The ridge line in T2-SE and T5-WL is also northward, but the location is eastward. The reason for this phenomenon may be attributable to interannual changes. By observing the variation of the Niño3.4 index (Figure 11), the anomaly is lower than 0.5°C for six consecutive months from 2017 to 2018, and it is judged that a La Niña event occurred in that year (Trenberth, 1997). According to the research of Ai and Chen (2000), La Niña will affect the position of the subtropical high, leading to a northward displacement of the subtropical high in the following summer. Other studies have shown that when the tropical western Pacific is cooling in spring, the subtropical high moves westward (Hung et al., 2006). In summary, the subtropical high is northward and westward, and Guangdong is under the control of the subtropical high. The wind direction is a weak southerly wind, but the overall strength of the subtropical high is relatively weak. The southern branch trough is active, cold air is prone to intrusion in the lower layer, and a convection system can develop. Under this condition, the T6-HP circulation situation appears.
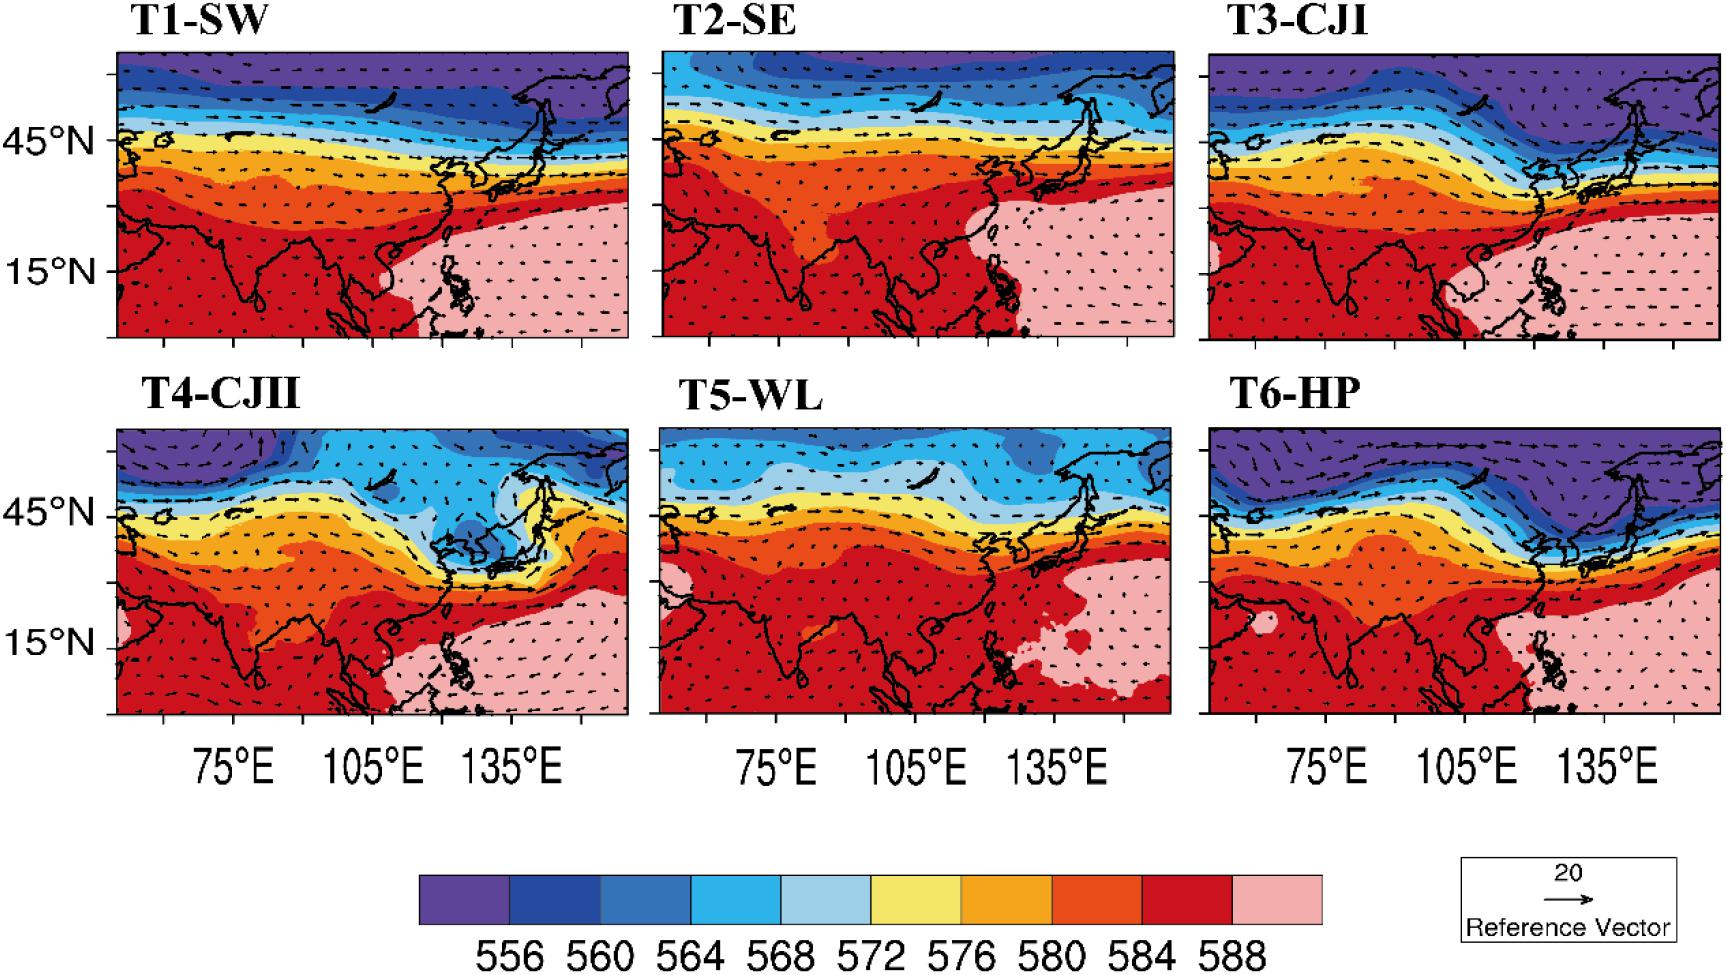
Figure 9. The 500-hPa geopotential height (colorbar; unit: dagpm) and wind field (arrows; units: m/s) in WSHR of six weather types.
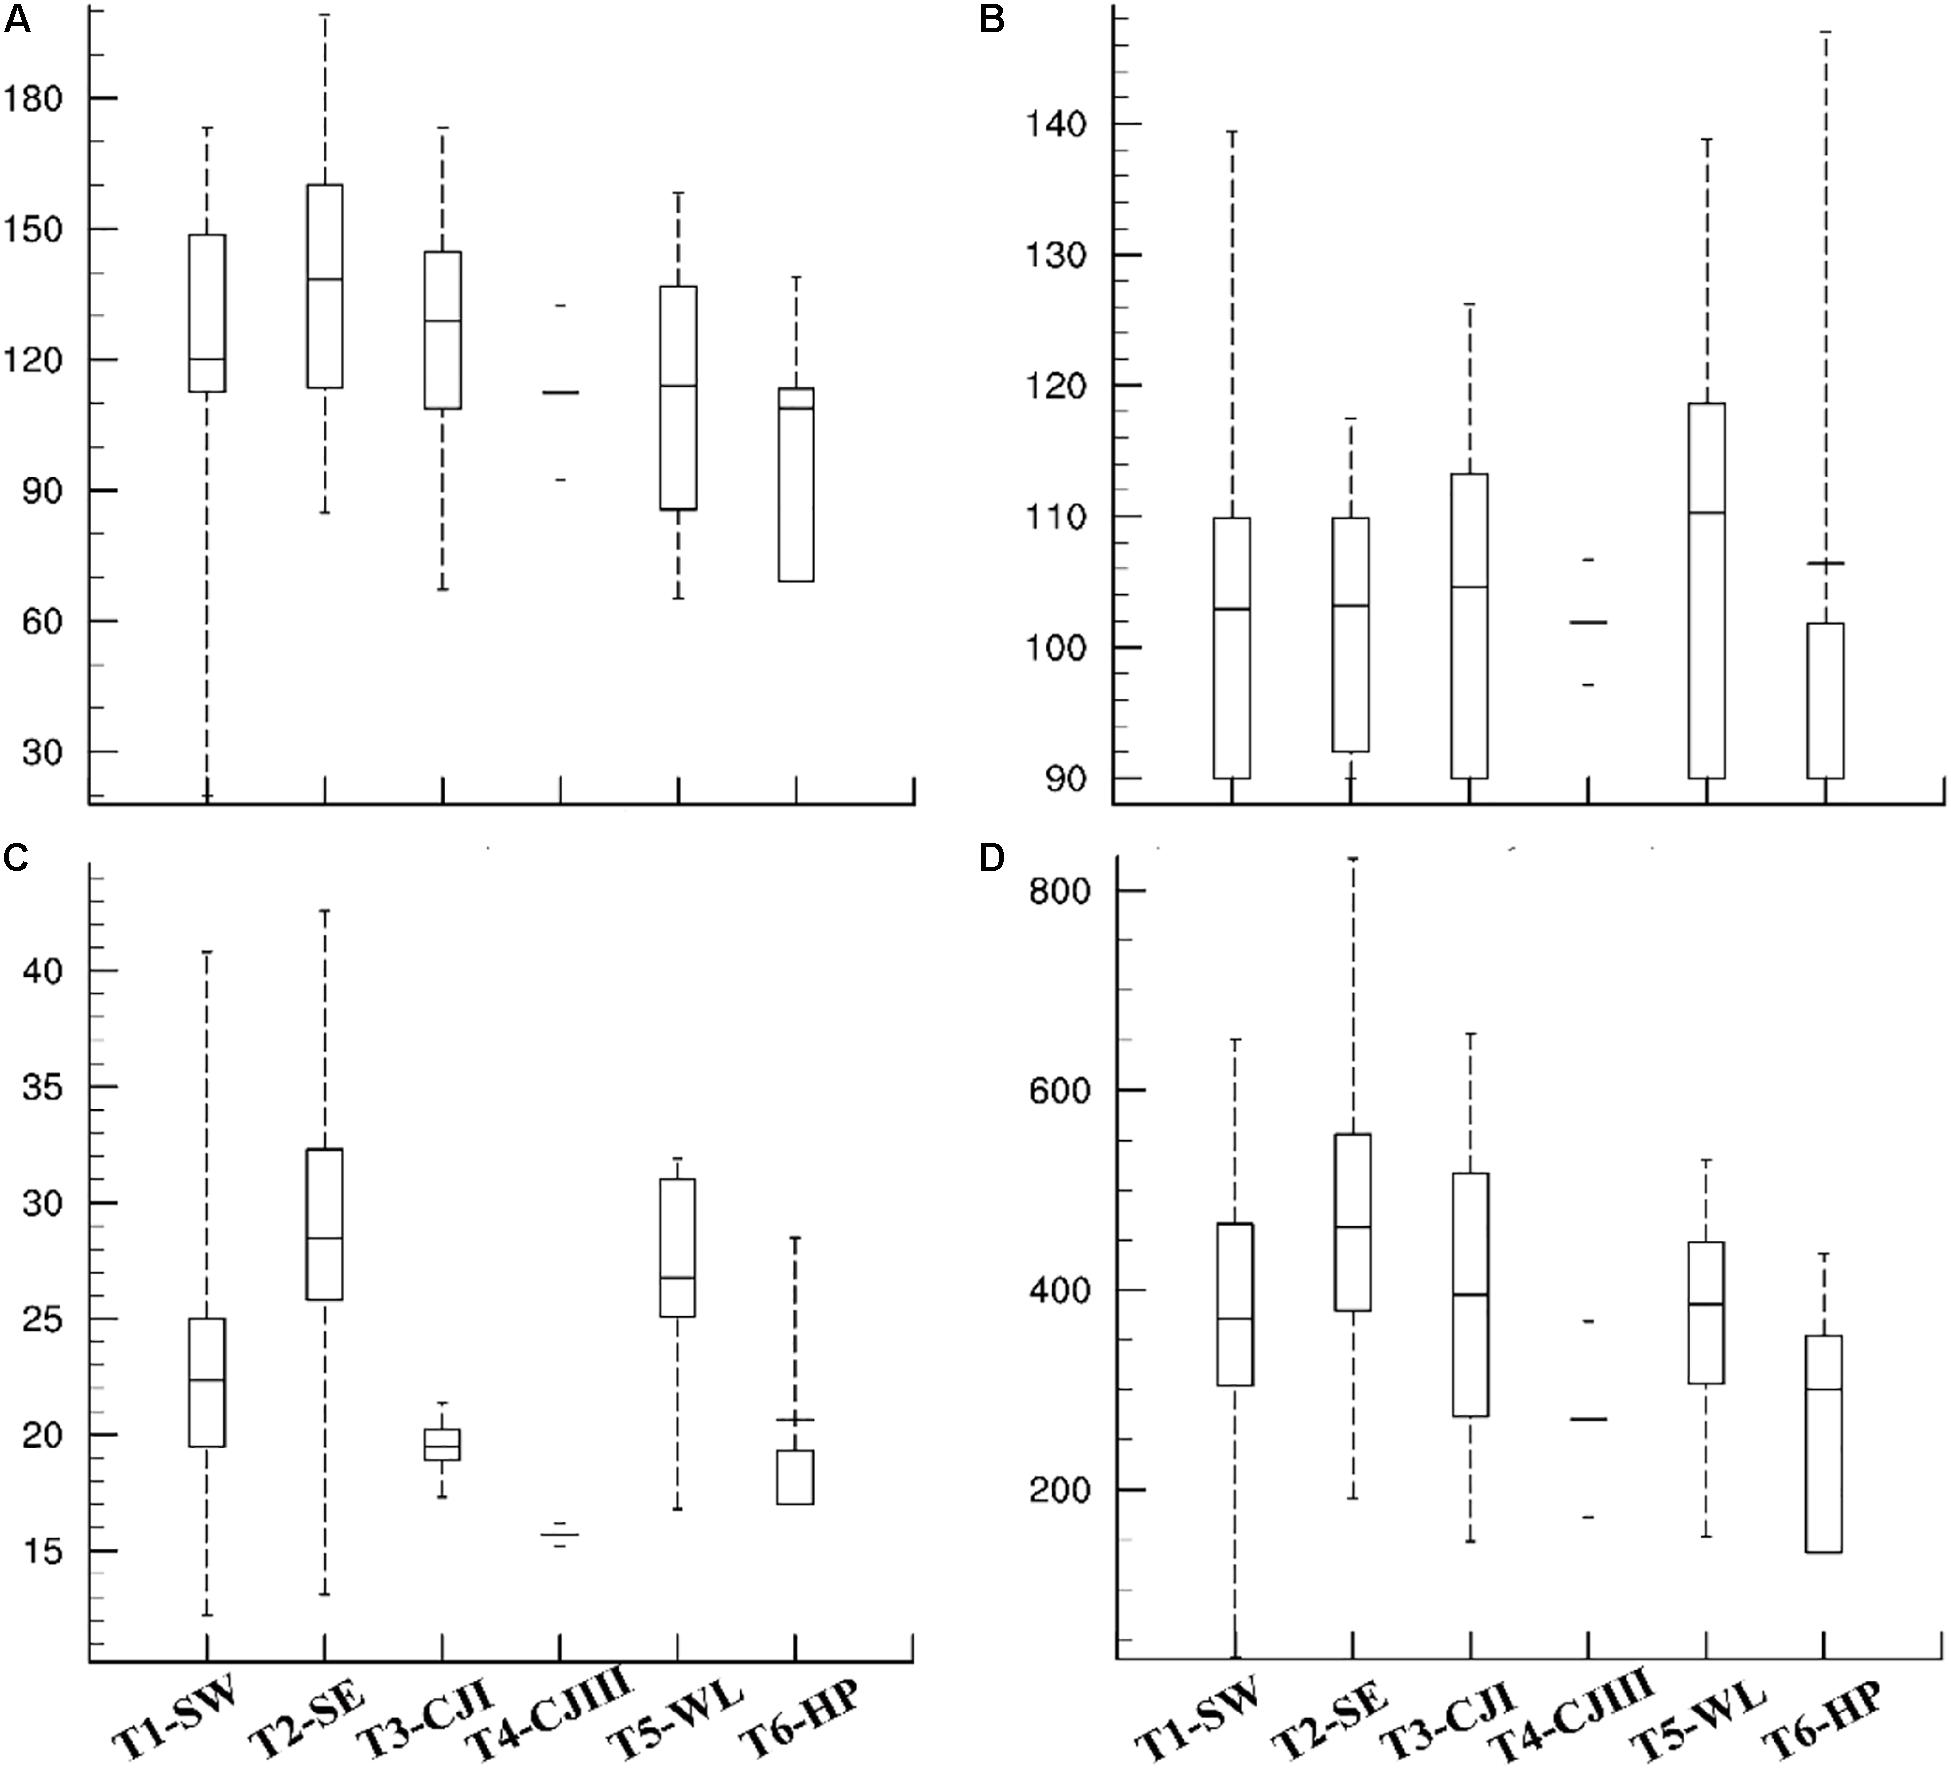
Figure 10. Indices for the (A) western Pacific subtropical high area, (B) western Pacific subtropical high western ridge point, (C) western Pacific subtropical high ridge line, and (D) western Pacific subtropical high intensity.
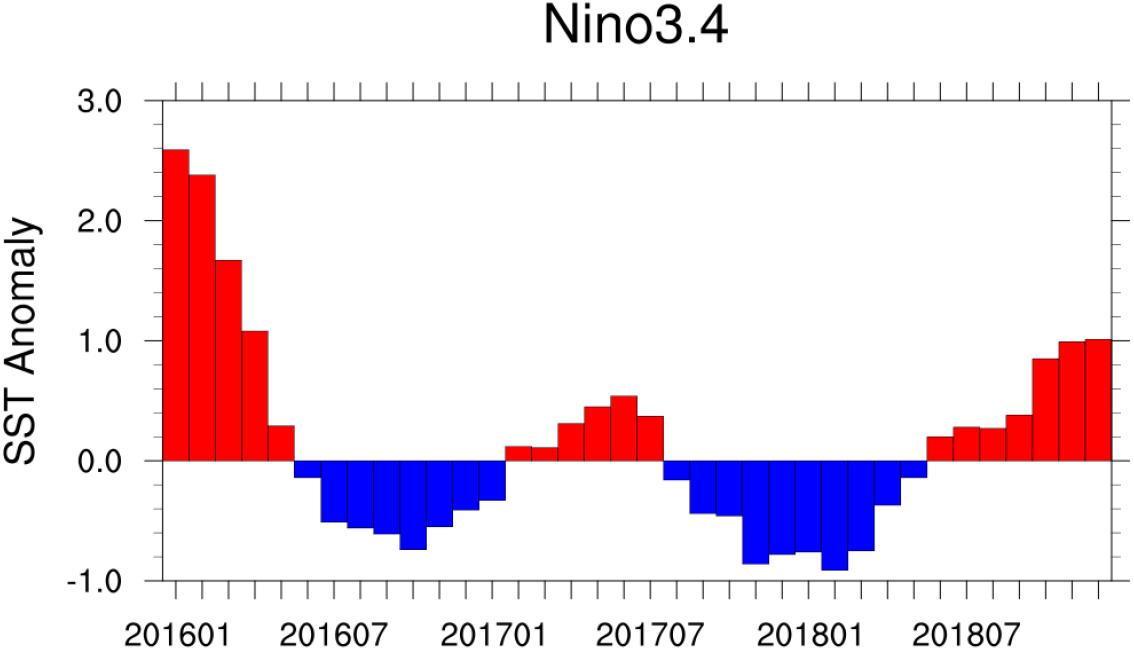
Figure 11. Monthly Niño3.4 index from 2016 to 2018.
Conclusion and Discussion
Based on high-density station data, 134 WSHR events from April to September 2016 to 2018 were identified, and the typical weather patterns that caused WSHR objectively classified by using the PCT method. Our conclusions are as follows:
(1) On average, WSHR rainfall occurs more in coastal areas and less in inland areas. There are three heavy rain centers: Yangjiang, Shanwei, and the GBA urban agglomeration. The weather types of WSHR in Guangdong can be divided
into six types: T1-SW, T2-SE, T3-CJI, T4-CJ II, T5-WL, and T6-HP. T1-SW is the main weather system, which mainly appears from April to July. T2-SE is obvious after the onset of the monsoon; T3-CJI mainly occurs in the pre-rainy season; and T5-WL occurs in the post-rainy season.
(2) Different weather types have different precipitation locations. T1-SW and T3-CJI are concentrated in the GBA urban agglomeration and the areas of Shantou and Shanwei; T2-SE is concentrated along the coast, especially in the area of Yangjiang. There were two cases of precipitation for T4-CJII, both of which occurred along the southwest coast (Zhanjiang and Maoming). GBA is most affected by T5-WL, and three of six extreme precipitation events occurred under this type. Therefore, for the T5-WL type, attention should be paid to the possibility of large-scale extreme precipitation in urban agglomerations. Precipitation for the T6-HP type is also concentrated in urban agglomerations, and the inland proportion of WSHR has increased compared with other types, reaching 40%. So, we can conclude that urbanization plays an important role in extreme magnitudes of large-scale WSHR events and their occurrence centers.
(3) T6-HP is a new weather type, and its appearance may be related to ENSO. During the La Niña period, the subtropical high moved northward but the overall strength was weaker, the southern branch trough was active, and cold air intruded at the lower level. In such weather conditions, the scale of precipitation is often small. Previous low-resolution observations have been unable to capture these small-scale events, thus omitting local/small-scale rainfall under this weather situation. In contrast, the high-density observations employed in the present work were able to capture T6-HP WSHR events with their smaller coverage areas.
Previous research found that weather patterns of WSHR over the southern of middle and lower reaches of the Yangtze River include subtropical high pattern, which is similar to T6-HP (Chen et al., 2016; Wang et al., 2018). The mechanism is that the area where the heavy rain occurs has been under high temperature control for a long time and has accumulated considerable energy and water vapor, and with the role of mesoscale convergence line, atmospheric stratification becomes unstable, causing convective instability condition development. Our findings provide new insight into the cause of WSHR events over South China, but the formation mechanism of T6-HP type WSHR events needs to be further studied to improve the accuracy of WSHR forecasts.
Data Availability Statement
Publicly available datasets were analyzed in this study. This data can be found here: The TC best track dataset is provided by the CMA Shanghai Typhoon Institute at http://tcdata.typhoon.org.cn/en/. The ERA5 reanalysis data are provided by the ECMWF at https://cds.climate.copernicus.eu/cdsapp#!/dataset/reanalysis-era5-pressure-levels?tab=overview.
Author Contributions
XB designed the research. WL performed the data analyses and prepared the figures. XB and WL wrote the manuscript. LS took part in manuscript discussion. YL and JS commented on the manuscript and give some useful suggestions. All authors contributed to the article and approved the submitted version.
Funding
This work was jointly supported by National Key R&D Program of China (Grant Nos. 2018YFC1507404 and 2018YFC1507402); National Natural Science foundation of China (Grant No. 41975008); and National Natural Science Foundation of China (Grant No. 41875021).
Conflict of Interest
The authors declare that the research was conducted in the absence of any commercial or financial relationships that could be construed as a potential conflict of interest.
Supplementary Material
The Supplementary Material for this article can be found online at: https://www.frontiersin.org/articles/10.3389/feart.2021.678230/full#supplementary-material
References
Ai, Y., and Chen, X. (2000). Analysis of the correlation between the subtropical high over western pacific in summer and SST. J. Trop. Meteorol. 1. doi: 10.16032/j.issn.1004-4965.2000.01.001
Cai, J., Wu, Z., Chen, X., Lan, Y., Guo, Z., and Guo, C. (2019). Cause analysis of persistent torrential rain associated with monsoon depression occurred in Guangdong on August 2018. Torrential Rain Disasters 38, 576–586.
Chen, X., Ding, Z., Liu, C., Chang, Y., and Zhu, C. (2012). Statistic analysis on the formation system of warm-sector heavy rainfall in May and June from 2000–2009. J. Trop. Meteorol. 28, 707–718. doi: 10.1016/s0713-2743(00)80080-x
Chen, Y., Chen, Y., Chen, T., and He, H. (2016). Characteristics analysis of warm-sector rainstorms over the middle-lower reaches of the yangtze river. Meteorol. Mon. 42, 724–731. doi: 10.7519/j.issn.1000-0526.2016.06.008
Dong, Y., Li, J., Guo, J., Jiang, Z., Chu, Y., Chang, L., et al. (2020). The impact of synoptic patterns on summertime ozone pollution in the North China Plain. Sci. Total Environ. 735:139559. doi: 10.1016/j.scitotenv.2020.139559
Han, J. Y., and Baik, J. J. (2008). A theoretical and numerical study of urban heat island–induced circulation and convection. J. Atmos. Sci. 65, 1859–1877. doi: 10.1175/2007jas2326.1
He, L., Chen, T., and Kong, Q. (2016). A review of studies on prefrontal torrential rain in South China. J. Appl. Meteorol. Sci. 27, 559–569.
Hoffmann, P., and Schlünzen, K. H. (2013). Weather pattern classification to represent the urban heat island in present and future climate. J. Appl. Meteorol. Climatol. 52, 2699–2714. doi: 10.1175/jamc-d-12-065.1
Huang, S. H. (1986). South China Rainstorm in the First Flood Season. Guangdong: Science & Technology Press.
Hung, R., Gu, L., Zhou, L., and Wu, S. (2006). Impact of the thermal state of the tropical western Pacific on onset date and process of the South China Sea summer monsoon. Adv. Atmos. Sci. 23, 909–924. doi: 10.1007/s00376-006-0909-1
Huth, R. (1996). An intercomparison of computer-assisted circulation classification methods. Int. J. Climatol. 16, 893–922. doi: 10.1002/(sici)1097-0088(199608)16:8<893::aid-joc51>3.0.co;2-q
Huth, R. (2000). A circulation classification scheme applicable in GCM studies. Theor. Appl. Climatol. 67, 1–18. doi: 10.1007/s007040070012
Huth, R., Beck, C., Philipp, A., Demuzere, M., Ustrnul, Z., Cahynová, M., et al. (2008). Classifications of atmospheric circulation patterns: recent advances and applications. Ann. N. Y. Acad. Sci. 1146, 105–152. doi: 10.1196/annals.1446.019
Li, Z. H., Liang, B., and Bao, C. (1981). The Causes and Forecast of the Heavy Rain in the First Flood Season in South China. Beijing: China Meteorological Press.
Lin, L., Gao, T., Luo, M., Ge, E., Yang, Y., Liu, Z., et al. (2020). Contribution of urbanization to the changes in extreme climate events in urban agglomerations across China. Sci. Total Environ. 744:140264. doi: 10.1016/j.scitotenv.2020.140264
Liu, R., Sun, J., and Chen, B. (2019). Selection and classification of warm-sector heavy rainfall events over South China. Chin. J. Atmos. Sci. 43, 119–130.
Miao, C. S., Yang, Y. Y., Wang, J. H., and Li, P. (2018). A comparative study on characteristics and thermo-dynamic development mechanisms of two types of warm-sector heavy rainfall along the South China coast. J. Trop. Meteorol. 24, 494–507.
Ning, G., Yim, S. H. L., Wang, S., Duan, B., Nie, C., Yang, X., et al. (2019). Synergistic effects of synoptic weather patterns and topography on air quality: a case of the Sichuan Basin of China. Clim. Dynam. 53, 6729–6744. doi: 10.1007/s00382-019-04954-3
Ning, G., Yim, S. H. L., Yang, Y., Gu, Y., and Dong, G. (2020). Modulations of synoptic and climatic changes on ozone pollution and its health risks in mountain-basin areas. Atmos. Environ. 240:117808. doi: 10.1016/j.atmosenv.2020.117808
Philipp, A., Beck, C., Esteban, P., Kreienkamp, F., Krennert, T., Lochbihler, K. U., et al. (2014). Cost733class-1.2 User Guide. Augsburg Germany.
Su, L., Li, J., Shi, X., and Fung, J. C. (2019). Spatiotemporal variation in presummer precipitation over south China from 1979 to 2015 and its relationship with urbanization. J. Geophys. Res. Atmos. 124, 6737–6749.
Sun, J., Zhang, Y., Liu, R., Fu, S., and Tian, F. (2019). A review of research on warm-sector heavy rainfall in China. Adv. Atmos. Sci. 36, 1299–1307. doi: 10.1007/s00376-019-9021-1
Trenberth, K. E. (1997). The definition of el nino. Bull. Am. Meteorol. Soc. 78, 2771–2778. doi: 10.1175/1520-0477(1997)078<2771:tdoeno>2.0.co;2
Wang, L., Chen, Y., Xiao, T., Li, S., and Ge, L. (2018). Statistical analysis of warm-sector rainstorm characteristics over the Southern of middle and lower reaches of the Yangtze River in summer. Meteorol. Mon. 44, 771–780.
Wang, H., Sun, J., Wei, J., and Zhao, S. (2014). Classification of persistent heavy rainfall events over Southern China during recent 30 years. Climatic and Environmental Research 19, 713–725. doi: 10.3878/j.issn.1006-9585.2013.13143
Wu, H. Y., Li, Z., Li, W., and Zheng, J. (2020). Characteristics analysis of extremly severe precipitation based on regional automatic weather stations in guangdong. Meteorol. Mon 46, 801–812.
Wu, M. (2019). A Dissertation Submitted to University of Chinese Academy of Sciences in Partial Fulfillment of the Requirement for the Degree of Doctor of Meteorology. [dissertation/doctor’s thesis]. Chennai: Chinese Academy of Meteorological Sciences.
Wu, M., Luo, Y., Chen, F., and Wong, W. K. (2019). Observed link of extreme hourly precipitation changes to urbanization over coastal South China. J. Appl. Meteorol. Climatol. 58, 1799–1819. doi: 10.1175/jamc-d-18-0284.1
Wu, N., Ding, X., Wen, Z., Chen, G., Meng, Z., Lin, L., et al. (2020). Contrasting frontal and warm-sector heavy rainfalls over South China during the early-summer rainy season. Atmos. Res. 235:104693. doi: 10.1016/j.atmosres.2019.104693
Yang, Y., Wang, R., Chen, F., Liu, C., Bi, X., and Huang, M. (2021). Synoptic weather patterns modulate the frequency, type and vertical structure of summer precipitation over Eastern China: a perspective from GPM observations. Atmos. Res. 249:105342. doi: 10.1016/j.atmosres.2020.105342
Ying, M., Zhang, W., Yu, H., Lu, X., Feng, J., Fan, Y., et al. (2014). An overview of the China meteorological administration tropical cyclone database. J. Atmos. Oceanic Technol. 31, 287–301. doi: 10.1175/jtech-d-12-00119.1
Zhao, Y. C., and Wang, Y. H. (2009). A review of studies on torrential rain during pre-summer flood season in South China since the 1980’s. Torrential Rain Disasters 28, 3–38.
Zheng, Z., Zhao, C., Lolli, S., Wang, X., Wang, Y., and Ma, X. (2020). Diurnal variation of summer precipitation modulated by air pollution: observational evidences in the beijing metropolitan area. Environ. Res. Lett. 15:094053. doi: 10.1088/1748-9326/ab99fc
Keywords: warm-sector heavy rainfall, objective weather classification, T-mode principal component analysis, South China, high-density observations
Citation: Li W, Bi X, Sheng L, Luo Y and Sun J (2021) Modulations of Synoptic Weather Patterns on Warm-Sector Heavy Rainfall in South China: Insights From High-Density Observations With Principal Component Analysis. Front. Earth Sci. 9:678230. doi: 10.3389/feart.2021.678230
Received: 09 March 2021; Accepted: 13 April 2021;
Published: 03 May 2021.
Edited by:
Ming Luo, Sun Yat-sen University, ChinaReviewed by:
Xiaoming Shi, Hong Kong University of Science and Technology, Hong KongGuicai Ning, The Chinese University of Hong Kong, China
Copyright © 2021 Li, Bi, Sheng, Luo and Sun. This is an open-access article distributed under the terms of the Creative Commons Attribution License (CC BY). The use, distribution or reproduction in other forums is permitted, provided the original author(s) and the copyright owner(s) are credited and that the original publication in this journal is cited, in accordance with accepted academic practice. No use, distribution or reproduction is permitted which does not comply with these terms.
*Correspondence: Xueyan Bi, eHliaUBnZDEyMS5jbg==