 Barbara J. Tewksbury
 Elhamy A. Tarabees
 Robert M. Welch
 Charlotte J. Mehrtens4
- 1Department of Geosciences, Hamilton College, Clinton, NY, United States
- 2Department of Geology, Damanhour University, Damanhour, Egypt
- 3Department of Earth and Planetary Sciences, Harvard University, Cambridge, MA, United States
- 4Department of Geology, University of Vermont, Burlington, VT, United States
Indirect indicators are critically important for recognizing hypogene karst that is too deep-seated to have explorable hypogene caves. We have suggested in previous publications that an extensive network of non-tectonic synclines in otherwise flat-lying Eocene limestone in Egypt might be such an indirect indicator. We proposed that synclines formed by sag of limestone layers overlying a zone of hypogene karst that today remains deep below the surface and suggested that hypogene speleogenesis resulted from ascending aggressive fluids associated with crustal extension and magmatism in Egypt during Red Sea Rift initiation. Without hypogene caves to explore, however, we were unable to provide compelling evidence for hypogene karst processes. By doubling our mapping area from 4,000 to 8,000 km2, a clear picture has emerged of patterns in the syncline network that provide compelling evidence for hypogene speleogenesis. Over this larger area, the network displays two distinct patterns: 1) synclines and ridges that outline polygons 700–2,000 m across, and 2) narrow N–S zones of synclines spaced 5–10 km apart, with WNW–ESE to NW–SE trending shallow synclines and ridges traversing the panels between N–S zones. The geometries suggest that the syncline network is controlled by two structural patterns in rocks underlying the limestones: 1) polygonal faults in underlying shales and 2) reactivated N–S, left-lateral basement faults that are largely blind at the current level of erosion. These structures served as conduits that conveyed fluids upward into the overlying Eocene limestones, triggering dissolution at depth and a pattern of sag above that was inherited from the nature and pattern of faults and fractures in rocks underlying the limestones. The unique patterns and characteristics of this network of synclines are applicable elsewhere as an indirect indicator of deep-seated hypogene karst. Our new data also strongly suggest that syncline formation spanned the time of crustal extension in Egypt associated with onset of Red Sea rifting ∼23–22 Ma. Endogenic CO2 associated with mantle-derived basaltic magmas was likely a significant component of fluids, perhaps involving highly aggressive supercritical CO2. Mantle-derived C and He in modern Egyptian oasis water suggest that hypogene speleogenesis may still be locally active.
Introduction
Over the past 25 years, hypogene karst has been recognized and studied on every continent across the globe (Klimchouk et al., 2017, which contains 61 papers from occurrences all over the world). Over that time, an understanding of the processes of hypogene speleogenesis, and the features that are characteristic of hypogene karst, has developed through exploration of small and large hypogene cave systems. Hypogene speleogenesis is undoubtedly far more widespread in general in both terrestrial and marine environments, however, than it would appear from published studies that are based on direct observation of accessible hypogene cave systems. Unlike epigenic karst, which is intimately tied to the meteoric/groundwater cycle, hypogene speleogenesis involves ascending aggressive fluids that cause dissolution and void space creation as fluids rise into soluble horizons, decompress, cool, and/or mix with existing fluids in the rocks (Klimchouk et al., 2012). Consequently, hypogene karst can develop as deep as several kilometers, and hypogene speleogenesis can operate continuously or intermittently for millions of years (Klimchouk, 2017 and references therein), hidden from our view at the Earth’s surface.
The features that we think of as diagnostic of hypogene speleogenesis will remain inaccessible and essentially invisible unless uplift and erosion exposes the hypogene karst zone for exploration. For hypogene karst systems that remain inaccessible in the subsurface, the challenge becomes how we might detect the presence of hypogene karst systems that are too deep to be explored. Is it possible, for example, to find areas where the features at the surface might be the “smoking gun” that indicates the presence of hypogene karst at depth?
We have previously reported the discovery of an unusual network of synclines in lower Eocene limestones in Egypt and characterized the network across an area of about 4,000 km2 in the Western Desert (Tewksbury et al., 2017a.; Tarabees et al., 2017) (Figures 1, 2). We evaluated a number of hypotheses for the origin of the synclines and proposed hypogene karst at depth as one of the viable hypotheses. Although the features of the syncline network provide no direct evidence for hypogene speleogenesis, we suggested that sag in overlying limestone layers might provide indirect evidence of hypogene speleogenesis at depth.
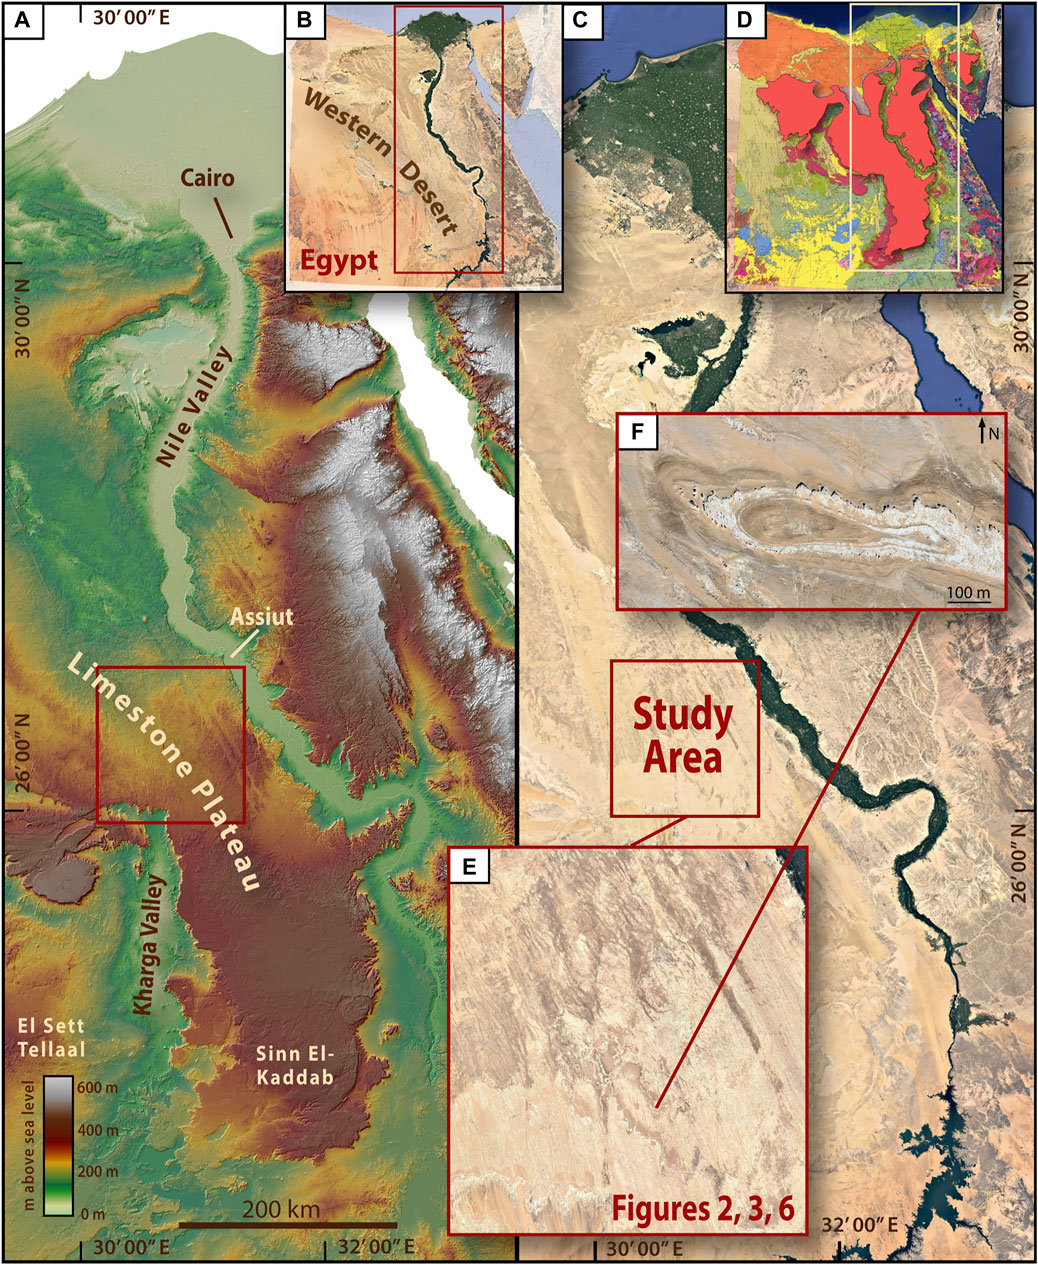
FIGURE 1. Context maps. (A) Colorized shaded relief map with location of study area (red square) on Limestone Plateau west of Nile Valley. (B) Context map showing Western Desert and location of 1A and 1C (red rectangle). (C) Satellite image of same area as 1A, showing location of study area. (D) Geologic map of Egypt showing outcrop area of Eocene carbonates (dark pink) in Egypt and location of 1A and 1C (tan rectangle). Adapted from EGSMA (1981). (E) Satellite image showing “wormy” patterning on the Limestone Plateau in the study area, plus two wide, dark, NNW–SSE stripes co-located with Red Sea Rift-related grabens. (F) Wormy patterning is due to synclines such as this one in the limestone bedrock. Satellite imagery source: Google Earth. Elevation model data source: Shuttle Radar Topography Mission (SRTM) digital elevation data. Coordinates for Google Earth images: E) 26.525270, 30.771237; F) 26.263030, 30.895574. Note: Supplementary Figure S1 shows all image locations in map view.
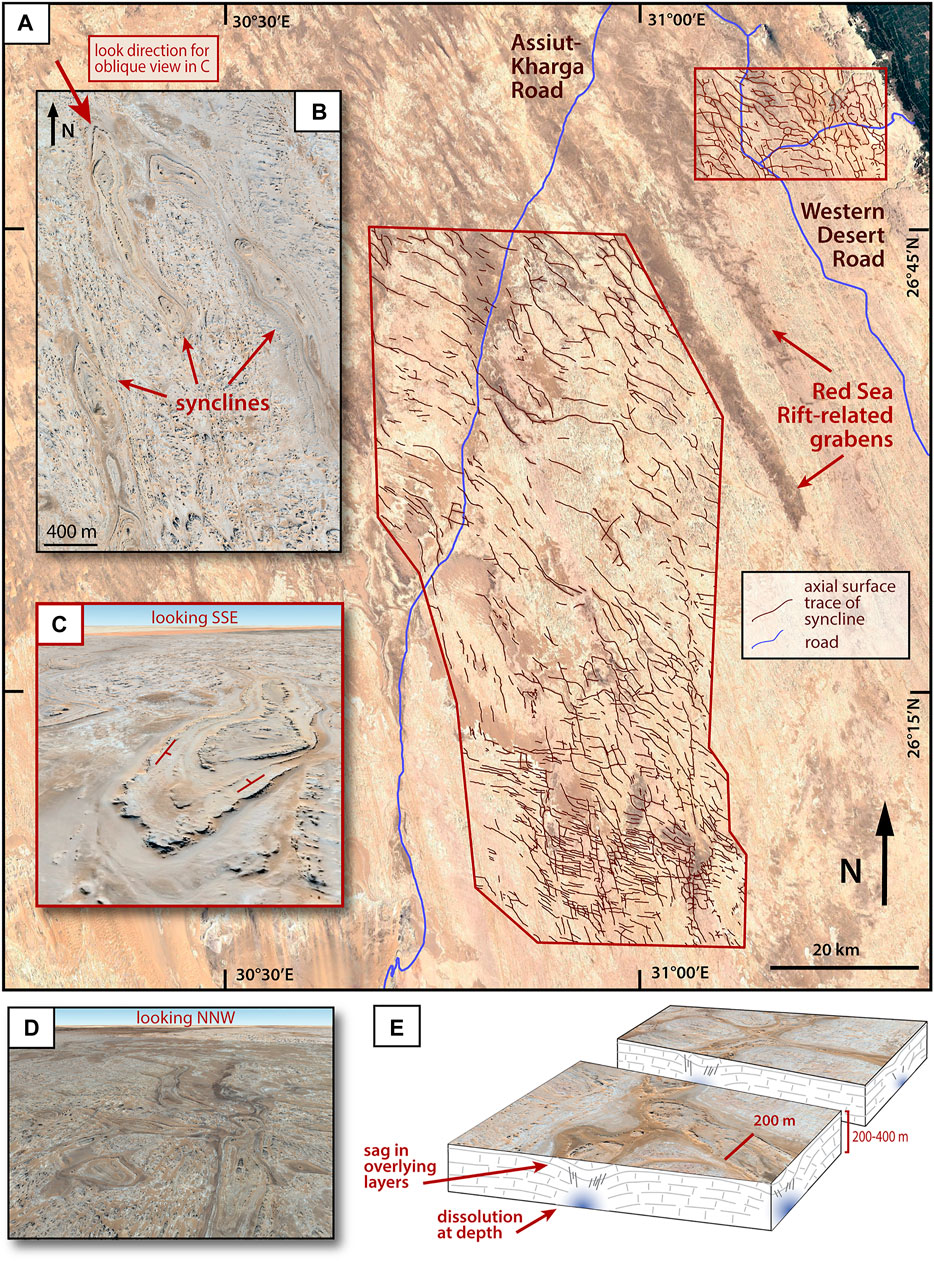
FIGURE 2. Previous results of our syncline network mapping (Tewksbury et al., 2017a). (A) Brown lines show axial surface traces of synclines in the network. (B) Synclines occur as downwarps in otherwise flat-lying limestones and have shallow limb dips, porpoising hinges, and multiple basin closures along trend. (C) Oblique view looking SSE across syncline shown with red arrow in 2A; shows shallow inward dips of layers. (D) Synclines include both small isolated singlets and long synclines that branch, curve, and merge with one another to form a network. (E) Model for origin of syncline network proposed in Tewksbury et al. (2017a) involving dissolution at depth in limestone and syncline formation by sag in overlying limestone layers. Image source: Google Earth. Coordinates for Google Earth images: B) 26.200966, 30.979914; C) 26.215634, 30.972404; D) 26.210351, 30.924365; E) 26.053406, 30.954647.
In this paper, we present strong evidence based on an additional 4,000 km2 of mapping using high resolution satellite imagery, combined with a modest amount of additional field work, that hypogene speleogenesis is, in fact, a very likely cause of the syncline network. We show that the syncline pattern varies systematically across the region and is strongly controlled by the pattern of fault and fracture networks in units underlying the limestones, especially the Esna Formation, suggesting upward fluid flow and supporting a model of hypogene speleogenesis at depth in the limestones, with sag in overlying layers. The unique patterns and characteristics of these bedrock structures are applicable elsewhere as an indirect indicator of deep-seated hypogene karst, allowing inferences into what might have happened (or might still be occurring) at depth.
Background and Prior Work
Geologic Setting
The Western Desert of Egypt stretches from the Nile on the east to the Libyan border on the west, and from the Mediterranean to the border with Sudan. The eastern portion, where our study area lies (Figures 1A–C), is part of what is known as the Limestone Plateau. The shaded elevation model shows both the flat top of the Limestone Plateau and the gentle northward slope of the plateau surface. In our study area, the plateau stands 200–350 m above the Nile Valley to the east and the Kharga Valley to the west and is flanked by escarpments on both sides. The landscape of the plateau itself has little local relief and is essentially undissected by fluvial features except along the escarpments. The groundwater table lies 400–500 m below the surface of this part of the plateau (Salim, 2012), and vegetation is negligible. Only two roads traverse this part of the Limestone Plateau, the Western Desert Road near the Nile escarpment and the road that connects Assiut on the Nile with the Kharga Valley. The vast majority of the plateau is remote and inaccessible.
Much of the research by previous workers on the bedrock in this area of the Western Desert has targeted sedimentology, stratigraphy, paleontology, and geochemistry (e.g., King et al., 2017; El-Azabi and Farouk, 2011; Issawi et al., 2009 and references therein), and the general stratigraphy is well known. Lower Eocene shallow water carbonates cap the entire Limestone Plateau (Figure 1D) and dip beneath Oligocene and Miocene sedimentary cover in northern Egypt. The Eocene limestones overlie less resistant Cretaceous through lowest Eocene marine shale, chalk, and marl, which are exposed in the escarpments bordering the Plateau. Upper Jurassic and Cretaceous fluvial and shallow marine clastic sedimentary rocks comprising the lowest part of the stratigraphic section crop out below the escarpment in the Kharga Valley and lie unconformably on Precambrian basement. For the geologic map of our study area (Figure 3), we use the stratigraphic nomenclature and formation contacts from Klitzsch et al. (1987), in which a Thebes Group is divided into a number of formations. The Drunka and El Rufuf Formations dominate at the surface in our study area.
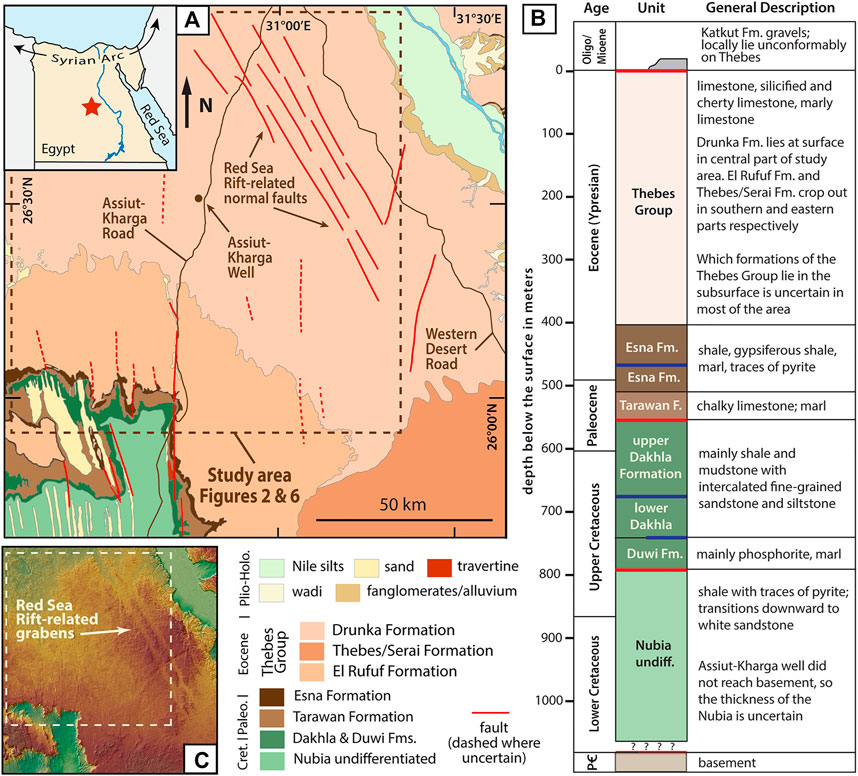
FIGURE 3. (A) Generalized geologic map adapted from Klitzsch et al. (1987), Riad et al. (2005), and Ghobrial, 1967. Minor faults are extremely common in the map area; we have shown only major faults, which are generalized at this scale. Dashed brown rectangle shows mapping area of this study. (B) Representative stratigraphic column for study area; colors correlate with geologic map in 3A. Colored horizontal lines show general stratigraphic positions of unconformities described by several authors (e.g., Khalifa et al., 2004). Red lines show unconformities where significant erosion may have occurred. Blue lines designate paraconformities where a depositional hiatus occurred but without subaerial erosion. Half line at top of the Duwi shows a local paraconformity. Oligocene/Miocene Katkut Formation is included in the stratigraphic column but not the geologic map (3A), because Katkut gravels have not been reliably mapped across the Limestone Plateau. Depths to specific formations are based primarily on Assiut-Kharga well (Barakat and Asaad, 1965), located in the middle of our study area. Data from El-Azabi and Farouk (2011), King et al. (2017), Said (1960, 1962, 1990), El Hinnawi et al. (1978), Issawi (1972), Issawi et al. (2009), Keheila and El-Ayyat (1990), Khalil and El-Younsy (2003), Keheila et al. (1990), and El Hinnawi et al. (2005). Reprinted from Tewksbury et al. (2017a)with permission from Elsevier.(C) Colorized shaded relief map for same area shown in 3A, with illumination direction from the NW. Dashed tan rectangle shows mapping area of this study. Elevation model data source: Shuttle Radar Topography Mission (SRTM) digital elevation data.
Because the topography of the Limestone Plateau is so flat and undissected and the regional stratigraphy dips very shallowly to the north, virtually all work on the stratigraphic section near our study area has been undertaken in areas with significant vertical exposure, namely along the Nile and Kharga escarpments. The only information about what directly underlies our study area comes from a borehole that was drilled in the 1960s along the Assiut-Kharga road (Barakat and Asaad, 1965), although the hole did not penetrate to basement, and correlation with more recently measured sections is complicated by changes in stratigraphic nomenclature. For this paper, we will use the same stratigraphic column (Figure 3B) that we presented in Tewksbury et al. (2017a), which uses the Thebes Group nomenclature. Figure 3B also shows our best estimate for stratigraphic thicknesses under our study area based on recent work by King et al. (2017), combined with data from the Assiut-Kharga well. Detailed rationale for both the stratigraphic nomenclature and thicknesses are provided in Tewksbury et al. (2017a).
The Limestone Plateau surface in our study area displays distinctive color patterning in satellite imagery. Two grabens associated with extension in Egypt during Red Sea rifting show up prominently as wide, dark stripes oriented NNW-SSE (Figures 1E, 2A) and correlate with two shallow, flat-floored topographic depressions (Figure 3C). These grabens have been known for decades, and generalized bounding faults (Figure 3A) are included on the 1981 geologic map of Egypt (EGSMA, 1981).
The finer-scale, dark “wormy” patterning (Figures 1E, 2A), on the other hand, has attracted very little attention. Brookes (2001) mapped the patterns using Landsat imagery and suggested that the features are erosional flutes produced by catastrophic flooding across the plateau surface. His analysis was hampered, however, by the resolution of Landsat imagery, which, at 30 m/pixel for color and 15 m/pixel for panchromatic, was not sufficient to resolve details for adequately testing his model. Using much higher resolution (∼1 m/pixel) satellite imagery freely available in Google Earth, we have shown that these features are not erosional flutes (Tewksbury et al., 2012), but, rather, a remarkable set of previously unrecognized structural features in Thebes Group limestones (Figure 1F) that combine to form a network of thousands of small, narrow synclines and elongate structural basins in otherwise quasi-horizontal limestone (Tewksbury et al., 2017a; Tarabees et al., 2017).
Our Prior Work on the Syncline Network
Syncline Network Characteristics
The syncline network is developed in limestones of the Thebes Group that are interlayered at the scale of meters. Field work and thin section analysis (Tewksbury et al., 2012) show that the most resistant layers consist of partially silicified, fine-grained, fossiliferous limestone (wackestone and packstone) that is white on a fresh surface but very pale brown both in outcrop and in satellite imagery due to small amounts of desert varnish on cherty and silicified portions. Non-siliceous limestone layers are white in both outcrop and imagery and range from moderately resistant, dense, low porosity limestone to non-resistant, porous, chalky limestone. These differences in color and resistance to erosion (Figures 2B–E), combined with nearly complete exposure on the undissected hyperarid desert surface of the plateau, made it possible for us to map the synclines in high resolution satellite imagery (Tewksbury et al., 2017a).
Our previous work (Tewksbury et al., 2017a) established that individual synclines in these limestones are narrow (150–400 m across) and range from isolated, elongate basins a few hundred meters long to synclines many kilometers long with multiple basin closures along trend (Figure 2B). Bedding dips shallowly in syncline limbs (Figure 2C); hinges also plunge shallowly and porpoise along the trend of an individual syncline. With the exception of differences in length, synclines are similar in scale across the area, with no larger structures and no parasitic folds. Each of the “worms” in the wormy patterning that is visible in the satellite imagery is, in fact, a syncline.
Figure 2A shows the axial surface traces of all synclines presented in Tewksbury et al. (2017a) and reveals several important aspects of the syncline pattern in our original mapping area. Two dominant syncline trends are common, NNW-SSE and WNW-ESE, parallel to prominent joint sets in the limestone. Synclines from the two trends branch, merge, and curve into one another (Figure 2A,D), forming networks. Despite similarities in scales of individual synclines, both the spacing of synclines and the overall pattern of the network vary from place to place in the mapped area.
We emphasized in Tewksbury et al. (2017a) that one of the most distinctive features of the synclines is that they occur as downwarps in otherwise flat-lying limestone, which is why we have called this a syncline network and not a fold network. Where synclines are closely spaced, inter-syncline areas look like broad, flat-topped anticlines, but they are actually “accidental” anticlines, formed where limbs of adjacent synclines are close together (Figure 2E).
Age and Origin of the Syncline Network
The syncline network is not a recent feature of the Thebes limestones. Satellite image analysis supplemented by additional field work (Tewksbury et al., 2018) shows clearly that the syncline network was both present in the limestones and eroded to a quasi-flat surface before deposition of fluvial gravels of the Katkut Formation, which lie 180–240 m above the current Nile floodplain and themselves predate incision of the modern Nile toward the end of the Miocene. This constrains the age of the syncline network to the Miocene or older.
We explored seven models for the origin of the syncline network and argued that the synclines are best described as non-tectonic sag structures caused by volume reduction at depth and sag in overlying limestone layers (details and evidence are provided in Tewksbury et al., 2017a). We suggested that, of the seven mechanisms, hypogene speleogenesis is the most consistent with the geometry and age of the syncline network, the overall stratigraphic sequence, and the tectonic setting and has no obvious fatal flaws. We proposed that faults and fractures acted as conduits that carried ascending aggressive fluids through shales and into overlying lower Eocene limestones, causing dissolution and collapse deep in the Thebes and sag in shallower layers (Figure 2E). We further suggested that hypogene fluids may have originated during extension in Egypt that was related to onset of Red Sea rifting at the Oligocene–Miocene boundary.
This Study
Because we had no direct evidence for hypogene karst, our model in Tewksbury et al. (2017a) that proposed hypogene speleogenesis was based on indirect evidence that was permissive but far from conclusive. We had noted that the pattern of the syncline network varies across the area that we had previously mapped, ranging from closely spaced and quasi-rectilinear in the south, to wormy and herringbone in the center and north, to trellis-like in the northeast (Figure 2A). What we had not been able to address with our existing data, however, is why the pattern of the syncline network differs from place to place, and what those differences might suggest about the viability of hypogene speleogenesis as a mechanism. We knew from reconnaissance mapping that syncline network patterns both east and west of the mapped area in Tewksbury et al. (2017a) have differences from the patterns mapped in Figure 2A. In this paper, we will show that extending detailed mapping of the network into these new areas, combined with a small amount of additional field work along the Western Desert Road by one of us (Tarabees), provides the first evidence that is compelling for hypogene speleogenesis, rather than simply permissive. This enables us, then, to speculate on the implications for recognizing hypogene speleogenesis in areas elsewhere that lack explorable hypogene karst.
Data Sets and Methods
Data Sets
Freely available, high resolution satellite image data are critical for this project, and our primary data set is high resolution satellite imagery from Maxar Technologies (formerly DigitalGlobe) that is available in Google Earth. The spatial resolution of <1 m/pixel is a 15-fold improvement over the resolution of Landsat panchromatic images, making it possible to study small-scale features that have previously been hidden at the scale of Landsat images.
Google Earth Pro for desktop is essential for our work, because, unlike Google Earth on web or mobile, the desktop version has layers of legacy imagery that are accessible via the time slider. Although much of the imagery is equally high in terms of spatial resolution, the appearance of images varies significantly depending on the algorithm used by Google to pansharpen the color bands to <1 m/pixel. Much of the most recent imagery is processed to be low in contrast and more “natural” in color (Figure 4A), which makes it difficult for image interpretation because individual layers and features are hard to distinguish from one another. Higher contrast imagery, where features are easier to distinguish (Figure 4B), is accessible for many areas via the time slider, and we use that where available. Colors are exaggerated, but the basic data are the same as those in the low contrast images. Sun illumination in the Maxar imagery is from the southeast, and we use winter/low sun-angle imagery where available because we rely heavily on shadows for interpretation of micro-topographic features. We did all mapping directly in Google Earth, using paths for mapping and placemarks as “field notes” for observations.
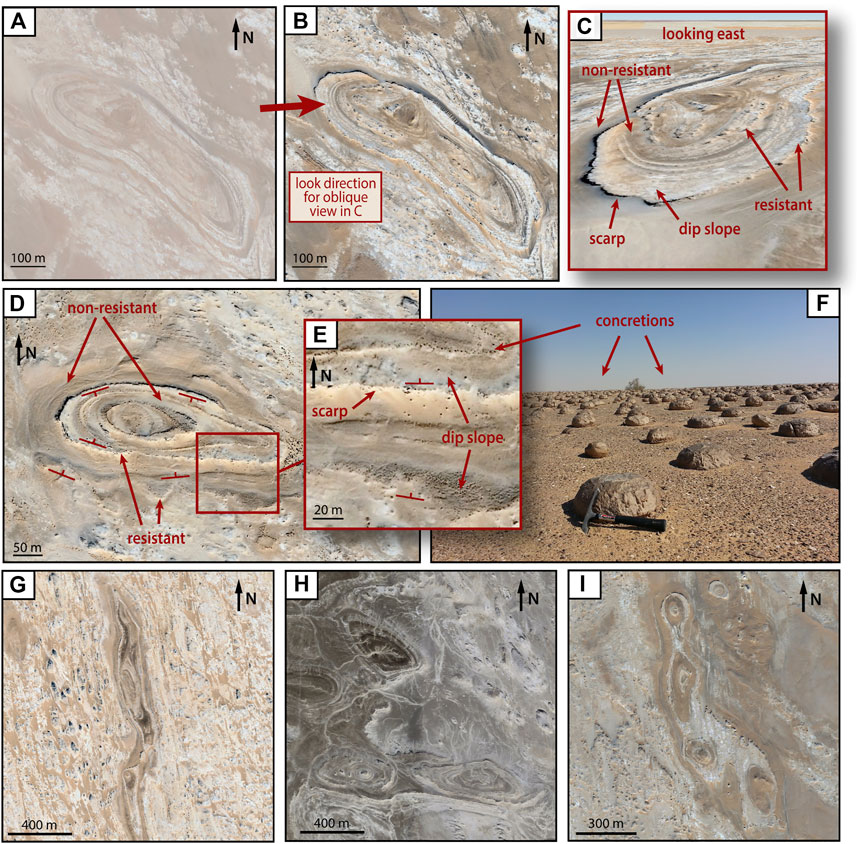
FIGURE 4. Datasets and mapping methods. (A) Current high resolution (<1 m/pixel) Maxar image in Google Earth with low contrast and high sun angle, making structural mapping difficult. (B) Equally high resolution Maxar image of same area as 4A, accessed using historical imagery slider; high contrast and low sun angle are ideal for structural mapping. (C) Oblique view looking ENE across syncline shown with red arrow in 4B; shows thin limestone interlayers with different resistance to erosion and appearance in satellite imagery, which make identification of synclines possible. (D) Differences in erosional resistance between limestone layers less than a few meters thick produces low scarps and prominent dip slopes. We use relative locations of scarps and dip slopes, Vs in micro-wadis, and scallops in micro hogback ridges to determine dip direction. (E) Zoomed-in view of dip indicators. (F) Dark speckles in 4F are large concretions that are ubiquitous on weathered dip slopes of siliceous limestone layers. Hammer for scale in front of foreground concretion. (G–I) Our mapping makes use of distinctive patterns characteristic of synclines in the network as established in our previous mapping area (Tewksbury et al., 2017a), including narrow color stripes of dipping layers in syncline limbs and “eyes” with concentric color rings in basin closures. Satellite imagery source: Google Earth. Coordinates for Google Earth images: A–C) 26.232518, 30.991498; D) 26.249925, 30.958276; E) 26.249151, 30.959524; G) 26.257994, 30.833053; H) 26.889168, 31.164989; I) 26.275977, 30.801059.
We also use Shuttle Radar Topography Mission (SRTM) DEM data to produce colorized, shaded elevation models using standard tools in ArcMap. Regional elevation models use 90 m/pixel SRTM data; study area elevation models use 30 m/pixel SRTM data. Shaded elevation models in all figures are illuminated from the northwest.
Mapping Methods
Our satellite image interpretation and mapping methods rely both on recognition of distinctive patterns and on criteria for determining dip directions in shallowly dipping, eroded limestone layers that have local topographic relief of only a few meters. Although our methods are detailed in Tewksbury et al. (2012) and Tewksbury et al. (2017a), we have included a brief description here so that readers are prepared to understand the patterns in the satellite imagery and the evidence presented in the Results section of this paper.
Our previous work has shown that thin, inclined, resistant layers (typically siliceous limestone) underlain by less resistant limestone produce a distinctive micro-topography of low scarps and shallow dip slopes (Figures 4C–E). Dip slopes are commonly littered with large, dark-brown, desert-varnished concretions that are easily visible as dark speckles in high resolution satellite imagery (Figures 4E,F). The presence of interlayers of limestones with different resistances is critical for structural interpretation, because we use both the scarp-and-dip-slope topography and Vs in outcrop traces that cross micro-wadis to determine dip directions of layer contacts (Figures 4D,E). This method for determining dip direction is detailed in Tewksbury et al. (2012), and we have verified in the field in multiple areas that the method produces accurate results.
The patterns of the thin interlayered limestone subunits in the satellite imagery are conspicuously different in the synclines and in the inter-syncline areas, and we use these patterns for mapping and interpretation (Tewksbury et al., 2017a). In syncline areas, layers are dipping and consequently show up as narrow bands, rather than as wide areas in the satellite imagery (Figure 4G). Distinctive eye-shaped patterns characterize both the isolated basin closures and the multiple basin closures along the trend of longer synclines (Figures 4H,I).
In inter-syncline areas, we have shown that, despite being only a few meters thick, individual layers are exposed over wide areas as a result of the combination of quasi-horizontal bedding and lack of dissection of the flat surface of the plateau (Tewksbury et al., 2017a). The non-siliceous white limestone in inter-syncline areas is variously characterized by low-relief, wind-scoured surfaces, dendritic outcrop traces typical of horizontal contacts, and scattered remnants of eroded younger layers (Figures 5A,B). Fields of yardangs (stream-lined, wind-eroded ridges) with quasi-horizontal bedding surrounded by scoured white limestone surfaces are prominent in many areas of the plateau (Figures 5C,D). Silicious limestone layers in inter-syncline areas form aerially extensive, pale-brown surfaces littered with dark brown concretions (Figures 5E,F).
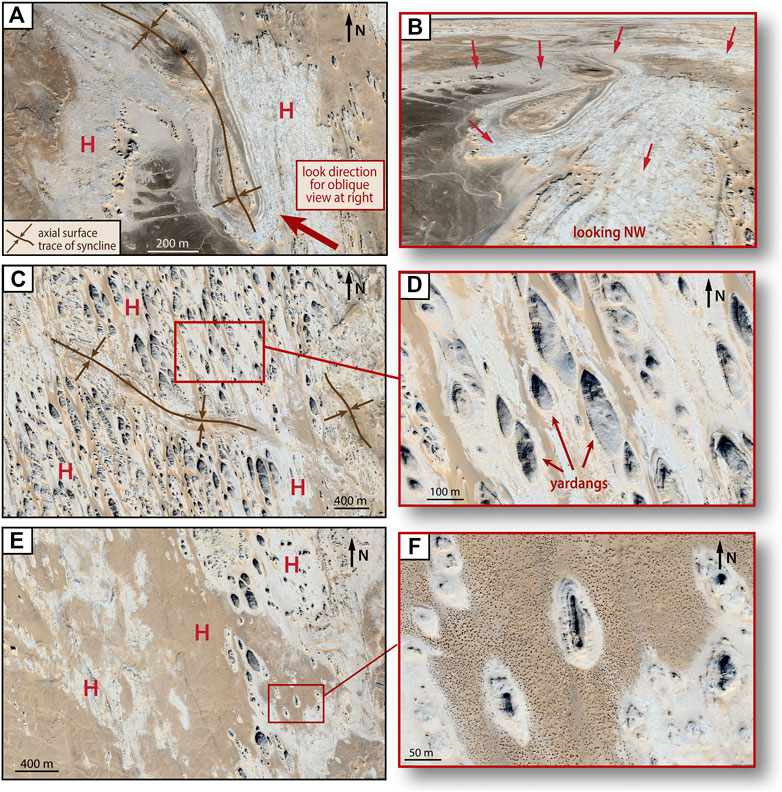
FIGURE 5. Mapping methods. Our mapping also makes use of the distinctive patterns of quasi-horizontal limestone layers in inter-syncline areas, as established in our previous mapping area (Tewksbury et al., 2017a). Red H indicates horizontal bedding. (A) Non-siliceous white limestone with low-relief, wind-scoured surfaces, dendritic outcrop patterns, and scattered erosional remnants of eroded younger layers. (B) Oblique view looking NW across syncline shown with red arrow in 5A; red arrows show extensive outcrop area of a single, thin white limestone layer where bedding is quasi-horizontal. (C) Yardangs (stream-lined, wind-eroded ridges) with quasi-horizontal bedding surrounded by scoured white limestone. (D) Zoomed-in view of 5C, showing horizontal bedding in yardangs. (E, F) Thin, resistant siliceous limestone layers form aerially extensive pale brown surfaces with concretions (dark brown speckles in 5F) and erosional remnants of younger layers of limestone. Satellite imagery source: Google Earth. Coordinates for Google Earth images: A) 26.287473, 30.968942; B) 26.282612, 30.970593; C) 26.446217, 30.929685; D) 26.450399, 30.931964; E) 26.297099, 30.925204; F) 26.292921, 30.934480.
Figures 4 and 5 nicely illustrate the contrast in pattern between the narrow stripes of the layers in the synclines and the wide outcrop areas characteristic of the inter-syncline areas in our previously mapped area. The prominent white limestone layer marked with the arrows in Figure 5B is no thicker than the white limestone that forms a single white stripe of a dipping layer in the adjacent syncline, yet it is exposed for 100s of meters east of the syncline and can be traced for kilometers across the plateau.
We have also previously established in the field (Tewksbury et al., 2012) that the most porous, least resistant white limestone forms few outcrops. Instead, a lag of desert varnished chert fragments accumulates over white, powdery, weathered limestone, forming dark-colored surfaces in both outcrop and satellite imagery (e.g., the dark gray-brown stripes and eyes in the synclines in Figures 4C, 5A). For image analysis and structural interpretation, this distinctive surficial deposit is a good a proxy for the presence of an underlying non-resistant limestone layer where it is confined between the outcrop traces of adjacent beds, but not where it has been redistributed by local surface processes (Tewksbury et al., 2012).
When we began mapping the syncline network, we divided the area into tiles that each cover ∼11 km by ∼7 km on the ground so that mapping could be done systematically. The mapping presented in this paper covers ∼100 tiles. The network as published in Tewksbury et al. (2017a) covers ∼45 of those tiles, which were mapped by Tewksbury and research students under her supervision. Tewksbury mapped 40 of the remaining 55 tiles, and Welch mapped 15. Tewksbury also vetted, standardized, and updated the mapping in all 100 tiles. The Supplementary Material contains more information about the full mapping dataset.
Results
Figure 6 presents both an updated version of our original syncline network and the additional mapping that we have completed since publication of Tewksbury et al. (2017a). Extending the mapping both east and west roughly doubles the area previously mapped to approximately 8,000 km2 and provides a clearer picture of the range of network geometries and their distributions in this part of the Thebes Group. Three areas in particular provide important clues to the origin and evolution of the network, and, below, we describe these three areas: 1) the small “ghost network” terrain that lies between the Red Sea Rift-related grabens and the Nile Escarpment; 2) the N–S panel network in the southwest; and 3) the area of the two Red Sea Rift-related grabens themselves.
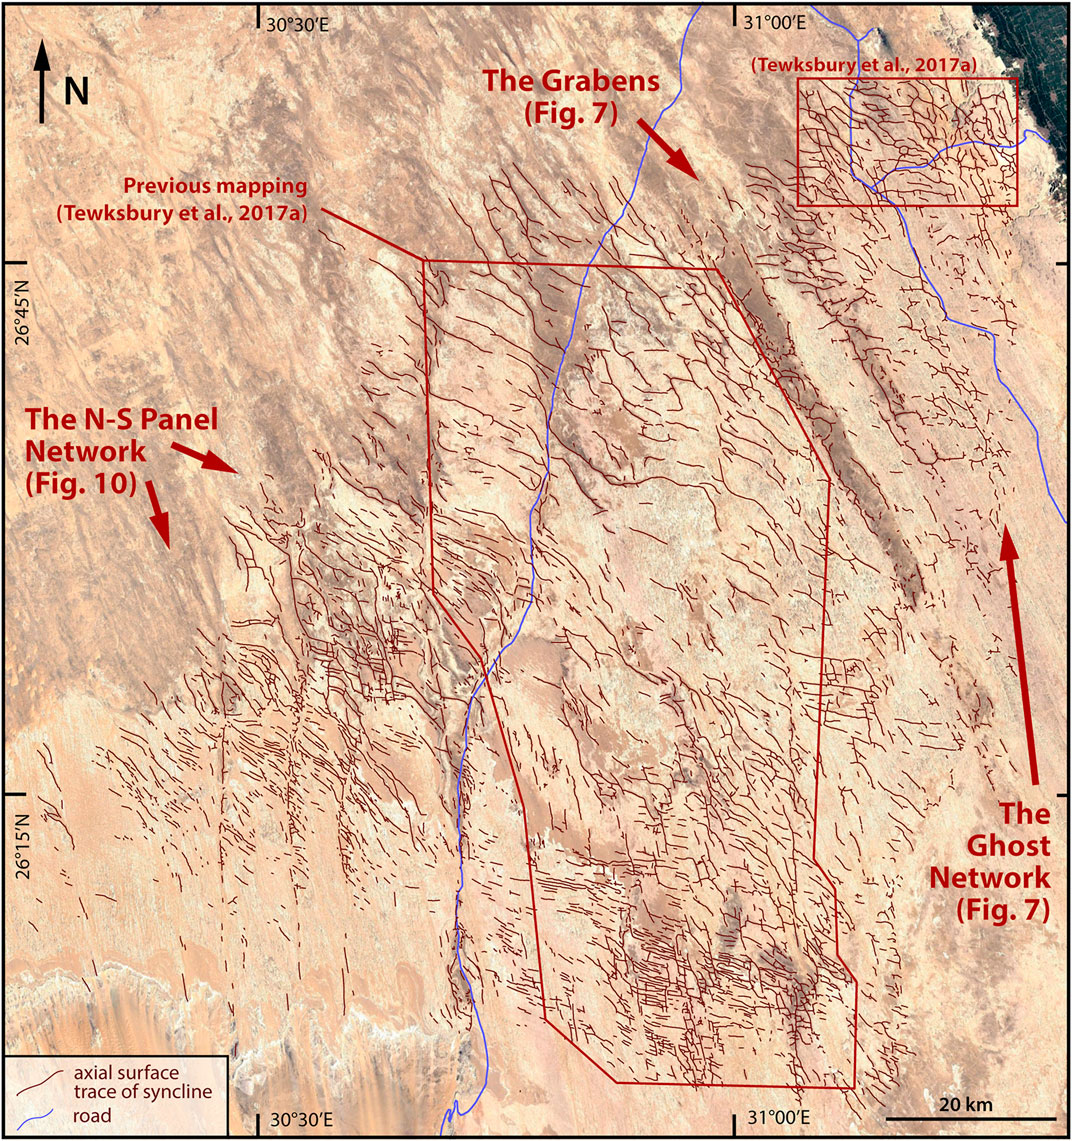
FIGURE 6. Syncline network, showing axial surface traces of all synclines mapped to date. Includes new mapping in three areas addressed separately in this paper (the ghost network, the N–S panel network, and the grabens area), plus an update of the network map from Tewksbury et al. (2017a) (red outlines). Areas in NW, SE, and S that show no synclines have not yet been mapped; they are not syncline-free. Satellite imagery source: Google Earth. See the Data Availability Statement for access to the full mapping data set as a kmz file.
Area 1: The Ghost Network
The ghost network terrain is conspicuously different in appearance in the satellite imagery from areas that we have mapped previously. The prominent wormy patterns that characterize the syncline network to the west are largely absent (Figures 6, 7), and satellite images are dominated by areas 700–2,000 m across that contain fields of large, gray-topped white limestone yardangs on wind-scoured white limestone surfaces (Figures 8A,B). Bedding in the yardangs is horizontal (Figures 8C,D).
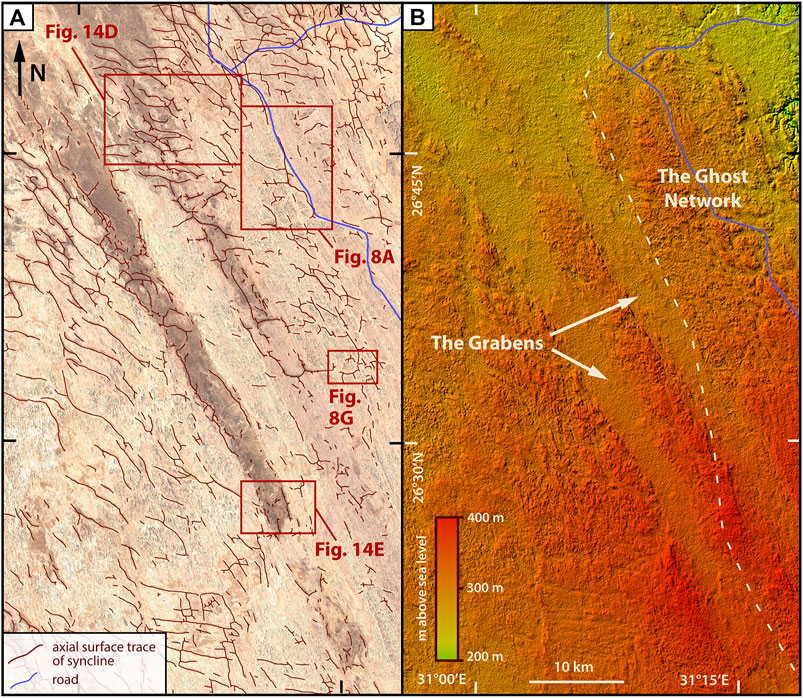
FIGURE 7. Syncline network and topography in the ghost network and the grabens areas. (A) Axial surface traces of all synclines. (B) Colorized shaded relief map of same area shown in 7A. White arrows show topographic expression of grabens related to crustal extension in Egypt during initiation of Red Sea rifting. Satellite imagery source: Google Earth. Elevation model data source: Shuttle Radar Topography Mission (SRTM) digital elevation data. Coordinates for Google Earth image: A) 26.593547, 31.134081.
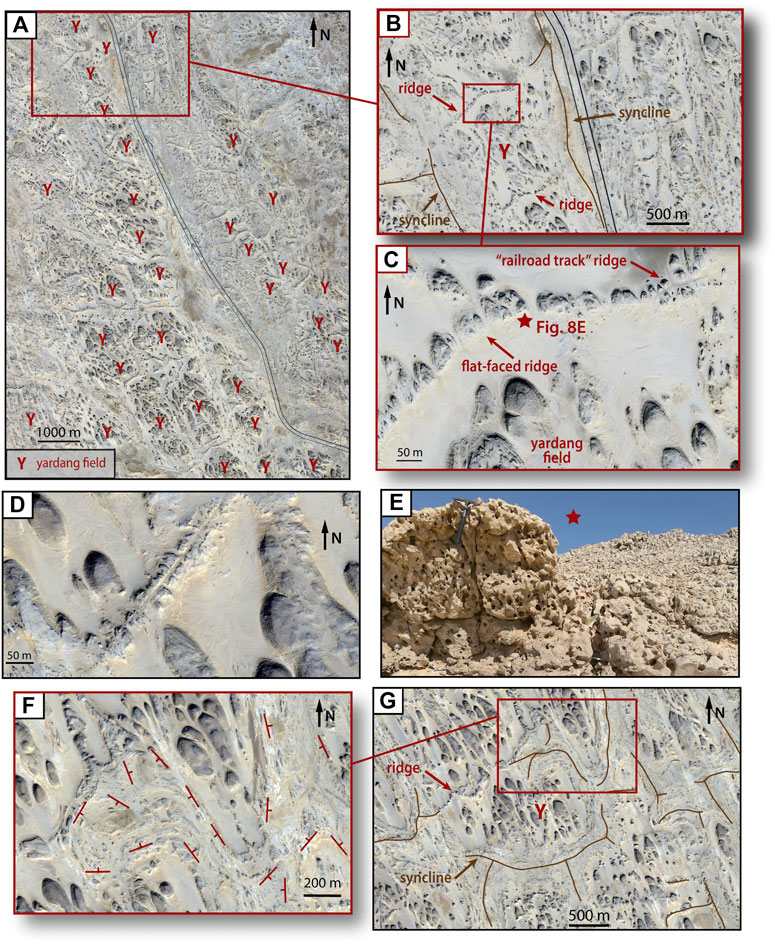
FIGURE 8. (A) Ghost network terrain with quasi-polygonal yardang fields (Y) 700–2,000 m across. Figure 7 shows location. (B) Yardang field (Y) separated from adjacent yardang fields on NW and SE sides by narrow ridges. (C) Ridges have quasi-horizontal bedding and commonly have one flat, eroded vertical face. (D) “Railroad track” ridge with a less resistant core. (E) Honeycomb structure in ridge face at star in (C). (F) Typical ghost network syncline almost entirely in white limestone units. (G) Yardang field (Y) separated from adjacent yardang fields by synclines on all but NW side. Figure 7 shows location. Satellite imagery source: Google Earth. Coordinates for Google Earth images: A) 26.741701, 31.196545; B) 26.780786, 31.178656; C) 26.783211, 31.172064; D) 26.419267, 31.267455; F) 26.577290, 31.261319; G) 26.569470, 31.260204. Field location: E) 26.783773, 31.171450.
What separates one quasi-polygonal yardang field from another varies from place to place. Many polygons are outlined or partially outlined by flat-topped white limestone ridges 20–40 m wide and 2–5 m high (Figures 8B,C). Outcrop patterns in the satellite imagery, plus limited field data, indicate that bedding in the limestone of the ridges is quasi-horizontal. One of the curious things about the ridges in many areas of the ghost network terrain is that they show one very flat, nearly vertical side (Figure 8C), and some show a peculiar “railroad track” geometry (Figures 8C,D) with a longitudinal groove eroded down the center. Both suggest that the ridges might have a vertical core that is less resistant than the rest of the limestone and that cuts across bedding at a high angle.
Field work by one of us (Tarabees) both at the star in Figure 8C and along several ridges elsewhere in the ghost network reveals that the faces of these ridges are characterized by a very distinctive honeycomb structure (Figure 8E). The pits of the honeycomb structure have sharp, more resistant septa between them, and thin sections reveal that the septa between pockmarks are thin calcite veins. In some outcrops, weathering reduces the honeycomb structure to a boxwork, or even a lacey, network.
Other quasi-polygonal yardang fields in the ghost network terrain are outlined or partially outlined by synclines. Because the ghost network terrain is dominated by non-siliceous white limestone units that lack distinctive color differences among interlayers, synclines are not nearly as obvious as they are elsewhere in our mapping area. Subtle differences in resistance among the limestone subunits do occur, however, revealing the inward dips and enabling mapping of the synclines (Figure 8F). Figure 8G shows a nearly continuous quasi-polygonal syncline network separating adjacent fields of yardangs.
One of the striking aspects of the ghost network terrain is that ridges and synclines occupy similar locations with respect to the quasi-polygonal yardang fields. In Figure 8B, the central yardang field is separated from other yardang fields by a ridge on the NW and SE sides and by a syncline on the NE and SW sides. In Figure 8G, the central yardang field is nearly completely surrounded by a syncline. A ridge, rather than a syncline, marks the NW side where the syncline dies out and the trend continues as a narrow, resistant ridge. In addition, ridges with quasi-horizontal bedding connect basin closures, as shown in Figure 9A, where we also have field data.
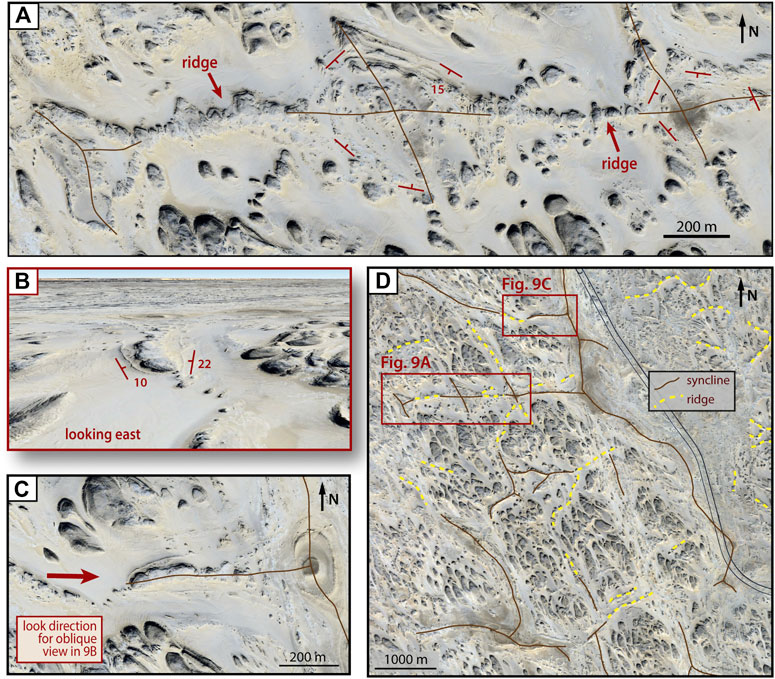
FIGURE 9. Ridges and synclines occupy similar locations with respect to yardang fields in the ghost network terrain. Where a syncline dies out along trend, the trend typically continues as a narrow ridge. (A) Ridges with quasi-horizontal bedding connect three basin closures. (B, C) Discontinuous narrow ridge connects eastward to broad ridge with shallow inward dips, which grades further east to a basin closure. (D) Combined with yardang fields, ridges and synclines define a subtle polygonal “ghost” network. Satellite imagery source: Google Earth. Coordinates for Google Earth images: A) 26.724487, 31.178602; C) 26.737089, 31.192582; D) 26.713315, 31.195420.
Not only do ridges connect along trend with synclines, they also grade in morphology from narrow resistant ridges with essentially horizontal bedding to wider ridges with shallow inward dips to synclines that are characteristic of our syncline network. Figure 9B shows a wide, flat, white limestone ridge in the core of a very shallow syncline. Inward dips are clear on both sides of the ridge, and field measurements confirm inward dips ranging from 10° to 20°. Eastward, the syncline deepens, and the ridge connects directly in a “spoon handle” geometry to a basin closure (Figure 9C). Westward, it connects to a narrow ridge with quasi-horizontal bedding.
Figure 9D shows the intimate connection between ridges and synclines in the ghost network terrain, defining a truly polygonal and integrated pattern in this terrain. In Figure 7A, we have mapped only the syncline traces in order to preserve consistency in what we have mapped across the rest of the region. As a result, the mapped pattern of synclines in the ghost network terrain as shown in Figure 7A is more discontinuous and poorly integrated than is suggested by Figure 9D, where we have included both synclines and ridges.
The along-trend continuity coupled with a gradation in morphology suggest that the ridges and synclines have a common origin and that the characteristics of both the ridges and the synclines, along with the network they form, should offer insights into the origin of the network in general, which we call a “ghost network” here, in part because it is subtle and easily overlooked. The pattern of synclines in this terrain is so sparse and discontinuous that it truly isn’t network-like taken alone. If we add in the ridges, though, a true polygonal network appears.
Area 2: The N–S Panel Network
The syncline network in the N–S panel terrain, which lies west of the Assiut-Kharga Road, displays a striking pattern of N–S “panels” 5–10 km wide that are separated from one another by narrow N–S zones (Figure 10). The syncline network pattern in the panels is conspicuously different from the pattern in the N–S zones. Within panels, synclines trend NW–SE in the middles of panels, changing to more northerly trends near panel boundaries, forming an open “Lazy-S” geometry (Figure 10) across each panel (by Lazy-S, we mean an open S rotated to lie on its back). Orientations within the narrow N–S zones are dominated by synclines with N–S and NNW-SSE trends, although individual synclines that continue into the panels change to a NW–SE trend away from the N–S zones. We will describe the patterns in the panels first, and then the patterns in the N–S zones.
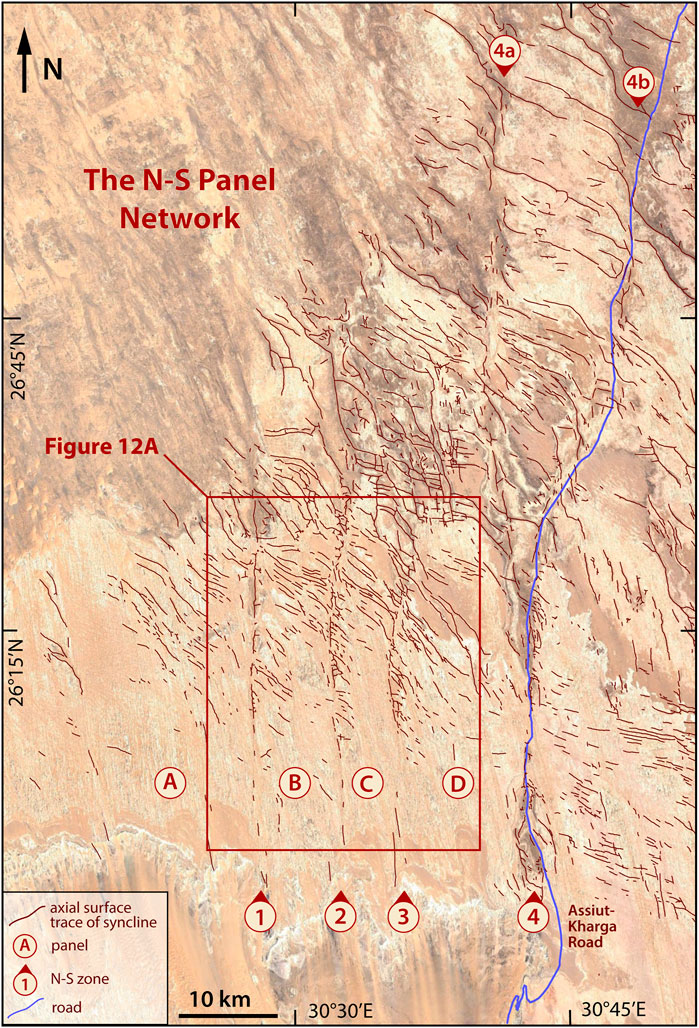
FIGURE 10. Synclines in the N–S panel network. Four panels (A–D) are 5–10 km wide and have WNW–ESE to NW–SE trending synclines. Four N–S zones (1–4) are narrow and have synclines with both N–S trends and NNW-SSE trends. Synclines in the panels curve to become more northerly with proximity to the N–S zones, defining an overall Lazy-S pattern in each panel.
The Panels
Within the panels, synclines are similar in scale to those elsewhere in our mapping areas and range in width from 150 to 400 m. Individual synclines range from isolated singlets a few 100 m long to curving synclines more than a kilometer long. Synclines occur as shallow sags in otherwise flat-lying limestone that displays well-developed yardangs (Figure 11A). Individual synclines commonly have one or more basin closures along their lengths, resulting in easily recognizable, elongate, eye-shaped patterns formed by the outcrop traces of shallowly dipping contacts.
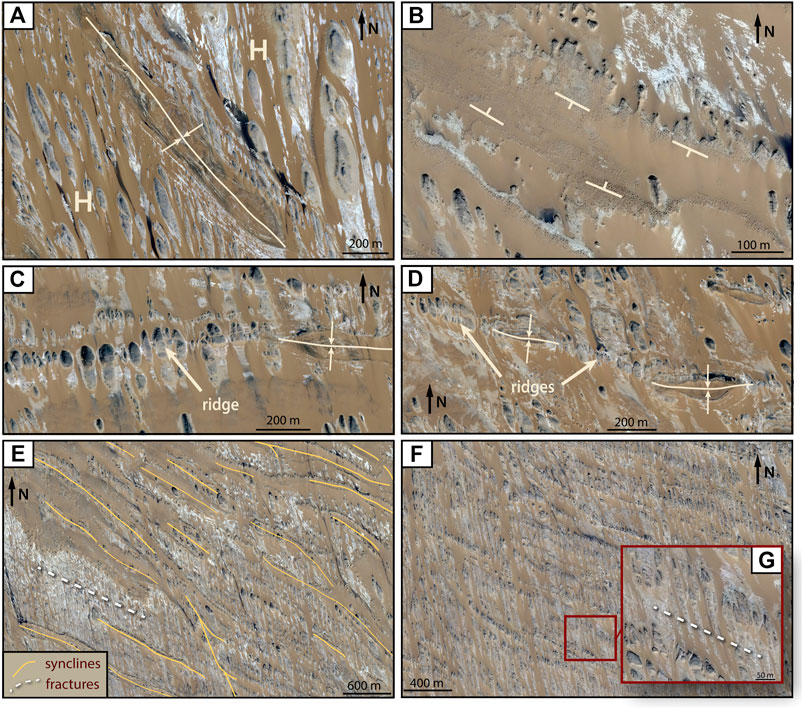
FIGURE 11. Synclines and ridges in the panels. (A) Syncline with typical “stripe-and-eye” pattern in otherwise horizontal limestone (H) characterized by yardangs. (B) Subtle syncline indicated only by shallow inward dip slopes in pale brown siliceous limestone layer. (C) Syncline continuing on trend as a ridge. (D) Small elongate basins connected by ridges. (E) WNW–ESE to NW–SE syncline trends in central part of panel B. (F) WNW–ESE to NW–SE ridge trends in panel B 10 km south of (E). (G) Ridges and synclines are parallel to prominent fracture set (white dashes in E,G). Satellite imagery source: Google Earth. Coordinates for Google Earth images: A) 26.276997, 30.393522; B) 26.287539, 30.504026; C) 26.297358, 30.648197; D) 26.313914, 30.492954; E) 26.275627, 30.502326; F) 26.187253, 30.512228.
In many areas of the panel terrain, however, synclines are not as easy to recognize as this, because the only indication is the very shallow inward dips of contacts. Close examination of the area in Figure 11B, for example, shows shallow inward dips of a thin, concretion-bearing silicified limestone layer, forming a very shallow, sand-filled trough where an overlying less resistant layer has been almost entirely removed by erosion. The syncline continues to the west as a very gentle swale in the concretion-bearing layer that is only discernable as a syncline because it lies topographically lower than the underlying white limestone immediately to the north and south.
As in the ghost network terrain, the panels have both synclines and ridges. Some synclines continue along trend as ridges (Figure 11C), and some small elongate basin closures are linked by ridges (Figure 11D), as they are in the ghost network (e.g., in Figure 9A). The most striking aspect of the ridges and synclines, however, is the parallelism of synclines and ridges within each panel, as illustrated by a comparison of the syncline network in the central part of panel B (Figure 11E) with the ridge network 10 km to the south in the same panel (Figure 11F). The ridges are not as narrow and distinct as they are in the ghost network, but, like those in the ghost network, the ridges are each an erosional remnant of a quasi-horizontal layer, where the limestone in the ridge is more resistant to erosion than other parts of the same limestone layer. Figures 11E,G illustrate the fact that both the ridges and the synclines are parallel to a prominent fracture set in the limestone.
Within each panel, synclines dominate in the central and northern parts of the panel, and ridges dominate in the southern parts, shown in Figure 10 by the sharp decrease in the number of synclines toward the south in each panel. So, as in the ghost network, ridges and synclines occupy the same positions in the network, indicating that a plausible model for syncline formation must also account for ridge formation, along with different overall patterns in different places on the plateau.
The N–S Zones
Synclines in the N–S zones have somewhat different orientations and more complex patterns than they do in the panels. N–S syncline orientations are virtually absent in the panels but are common in the N–S zones (Figures 10, 12). Synclines in the N–S zones that are not oriented N-S have more northerly trends than synclines in a panel either to the east or west of a particular zone. Branching and merging of synclines along trend from one orientation to another (Figures 12A,B) is ubiquitous in the N–S zones and virtually absent in the panels (Figures 10, 12). Figure 12B, from zone 2, shows clearly that synclines are present in the N–S zones even where they are rare in the adjacent panels. Figures 10 and 12A both show that the density of synclines is higher in most areas along the N–S zones than it is in the adjacent panels.
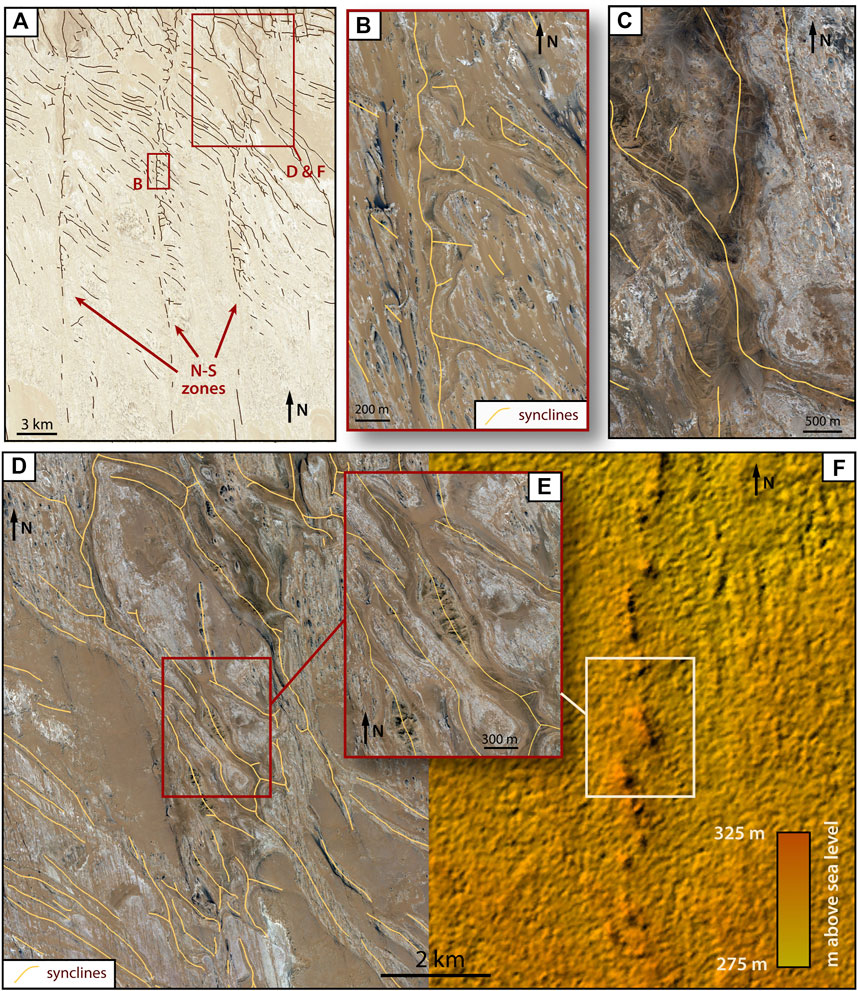
FIGURE 12. (A) N–S zones 1–3, map area shown in Figure 10. (B) Merging of NW–SE trending synclines with N–S synclines in zone 2. (C) Syncline from northern part of zone 4A coming into the N–S zone from panel to the east, swinging N, continuing NNW and then NW into the panel west of the zone. (D) Synclines in zone 3 trend NNW-SSE across the zone. (E, F) Colorized shaded relief map (illumination direction from NW) covers same area as (D) and shows en echelon ridges in the topography along zone 3. Synclines (E) coincide with the ridges. Satellite imagery source: Google Earth. Elevation model data source: Shuttle Radar Topography Mission (SRTM) digital elevation data. Coordinates for Google Earth images: A) 26.248415, 30.569295; B) 26.246786, 30.531585; C) 26.642740, 30.677912; D-F) 26.307682, 30.595043.
The relationship between synclines and the N–S zones themselves is consistently asymmetric in the same way in all four zones. For those synclines not parallel to a N–S zone, the acute angle between the syncline trend and the zone trend opens to the north on the west side of a zone and to the south on the east side of a zone. In other words, synclines not parallel to a zone are oriented counterclockwise from the trend of the zone on both the east and west sides of the zone. This is a consistent pattern and, although it may seem obvious, we want to underscore it here as an important aspect that must be accounted for in any model for the origin of the network.
With proximity to a N–S zone, syncline trends in the panels become more northerly, and many individual synclines merge with those in the N–S zone (Figures 10, 12). On the west side of a zone, panel synclines merge southward with the zone, and on the east side, panel synclines merge northward. The consistency of the asymmetry of synclines not parallel to N–S zone trends, and the merging of individual synclines between panel trends (more westerly) and N–S zone trends (more northerly) produces the conspicuous Lazy-S pattern of synclines across the N–S panel network. We also point out that, although zone 4 branches northward into a zone 4a and a zone 4b (Figure 10), the asymmetry remains the same in both zones, as does the Lazy-S pattern.
Especially in the central and northern parts of the N–S zones, synclines are commonly continuous from a panel into a zone, across the zone, out the other side, and into the adjacent panel (Figure 12C). Figures 12D–F show a particularly spectacular area in zone 3 where a number of well-developed synclines oriented NNW-SSE cut across the N–S zone at an angle, with no fault offsets of any of the synclines in the zone. It is also striking that the topography shows a pattern of short, en echelon topographic ridges (Figure 12F), each of which coincides with a syncline.
Despite the fact that the syncline pattern is different in the narrow N–S zones than it is in the panels, the networks share similarities in geometry and merge seamlessly with one another. We have seen nothing to suggest that one network is simply overprinted on the other. Formation of a network such as this requires a syncline-forming process that can produce broadly similar individual features over large areas as well as networks with different overall patterns in different places.
Before leaving the N–S panel network, we would also like to mention an interesting and different terrain in the southern part of the N–S panel terrain that lies toward the bottom of the Thebes Group. This area displays an extensive bedding plane exposure of thin, pale brown, concretion-bearing silicified units interlayered with white limestone (Figure 13A). The area has a distinctive and, in our experience, unique rectilinear pattern of very narrow, sand-filled zones in the concretion-bearing units (yellow arrows, Figure 13). The rectilinear pattern is defined by two prominent orientations of sand-filled zones, one set NE–SW and the other NW–SE. Sand-filled zones have a typical spacing of a few tens of meters to 100 m or so, and the zones themselves are only a few meters to <10 m across.
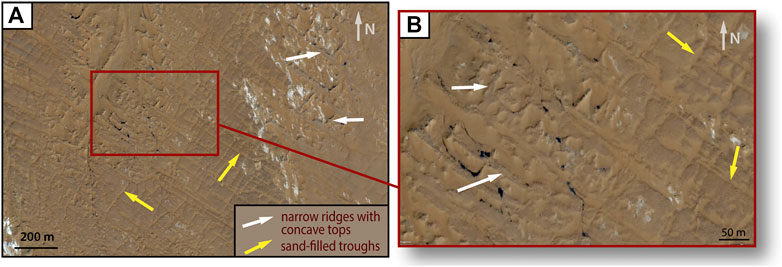
FIGURE 13. (A) Extensive bedding-plane exposure of pale-brown siliceous limestone with a rectilinear network of shallow, mostly sand-filled troughs oriented NW–SE and NE–SW (yellow arrows) and narrow ridges (white arrows) with the same orientations. (B) Zoomed-in view shows that ridges have concave tops and are eroded remnants of what underlies the sand-filled troughs, suggesting that the rectilinear pattern is a network of shallow sags in the siliceous limestone layer. Satellite imagery source: Google Earth. Coordinates for Google Earth images: A) 26.077868, 30.444569; B) 26.078738, 30.442983.
Our first thought was that the sand-filled zones represent less resistant zones in the silicified unit, with sand filling areas differentially eroded in the layer. More careful inspection reveals, however, that where erosion in the rectangular areas between the sand-filled zones has breached the silicified layer and cut down into the underlying less resistant white limestone, rectangular areas are surrounded by a rectilinear network of narrow ridges with gently concave tops and with the same two dominant orientations as the sand-filled zones (white arrows, Figure 13). The sand-filled zones, then, are actually a rectilinear network of narrow, very shallow sags in the concretion-bearing unit that simply accumulated sand because they were topographically lower. Other areas confirm this, where sags in the silicified layer are not sand-filled. This network is two orders of magnitude smaller than our syncline networks.
Area 3: The Grabens
Two young grabens related to crustal extension in Egypt associated with opening of the Red Sea occur in this part of the Limestone Plateau and are prominently expressed both in the topography and in the satellite imagery (Figures 2, 7). The grabens trend NNW–SSE, lie 10–60 m lower than the adjacent plateau surface, and are dark-colored in the satellite imagery throughout much of our study area. Before discussing the relationship between the grabens and the syncline network, we will address the question of how accurately the syncline network can be mapped in these dark areas of the satellite imagery.
Despite their dark, murky appearance in the regional imagery, these areas are not entirely featureless in the high resolution Google Earth imagery. In many areas, light-colored resistant layers have enough topographic expression to enable determination of dip direction (e.g., at the arrows in Figure 14A). In other areas, light-colored layers are visible but lack interpretable patterns, either because of lack of relief or partial masking by thin, dark-colored surficial material (e.g., Figure 14B). In still other parts of the dark areas, fluvial processes have mobilized surficial materials, and the bedrock is completely covered (e.g., Figure 14C). In Figure 7, we have mapped synclines only where we could confidently determine dip directions, and dark areas with no mapped synclines should not be taken as syncline-free.
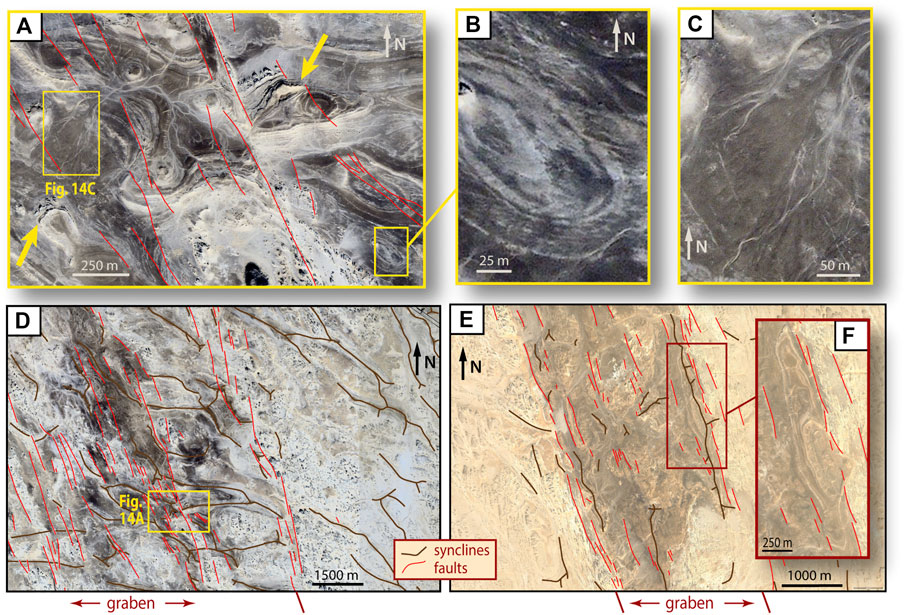
FIGURE 14. Two areas in the grabens terrain (locations in Figure 7) showing synclines and graben-related normal faults. General graben boundaries in (D, E) are based on topographic and satellite image expression of the grabens. (A) Satellite imagery in the grabens is commonly dark, but some places have enough topographic expression (e.g., yellow arrows) to determine dip direction. (B) Bedding commonly ghosts through thin surficial deposits, but determining dip is impossible where topographic relief is low. (C) In some areas, bedding is completely masked by mobilized dark surficial material. Because of B and C, areas in Figure 7 in the grabens with no mapped synclines should not be taken as syncline-free. (D) Synclines that cut across the graben from adjacent foot wall areas are offset by normal faults within the graben, indicating that these synclines predate the grabens. (E, F) Orientation of synclines parallel to, and just inboard of, graben margin, suggests that some synclines postdate graben-bounding faults. Satellite imagery source: Google Earth. Coordinates for Google Earth images: A) 26.763458, 31.076086; B) 26.758834, 31.082969; C) 26.763507, 31.069313; D) 26.783403, 31.100265; E) 26.451921, 31.188014; F) 26.454506, 31.197233.
In the ghost network terrain and the N–S panel terrain, we focused on the distinctiveness of the patterns and the characteristics of the networks. In the grabens terrain, however, pattern is not the important feature. What is important is the relationship between the synclines and the grabens.
Figure 7A shows that synclines oriented WNW–ESE, E–W, and ENE–WSW occur both in the grabens and in the adjacent mapped areas. Many synclines cross into the grabens from the adjacent countryside, and some wander completely across a graben and out the other side. Where these synclines cross a graben, they are pervasively faulted along normal faults (Figure 14A) that strike approximately parallel to the NNW–SSE graben margins (Figure 14D). These synclines clearly predate graben formation and were well-established as a network in the limestones across the area before the grabens cut the network.
In addition to the pre-graben synclines, both grabens have NNW–SSE trending synclines that are oriented parallel to a graben margin and that are typically located just inboard of a graben margin (Figures 7, 14E,F). This spatial correlation coupled with the similarity in orientation of the grabens and synclines, suggests that this is a later set of synclines whose orientation was influenced by the presence of the graben faults.
Discussion
We have established a picture of how the patterns of the syncline network vary across our mapped region. We will now address the question of what controls the variation in network pattern and what the implications are for the origin of the network. In this section, we will make the argument that the controlling factor is the local pattern of faults and fractures in the stratigraphic section beneath the Thebes Group limestones, which strongly implicates upward fluid flow in dissolution and sag in the Thebes.
Network Patterns and Implications for Ascending Fluids
The Ghost Network
As described in the section Area 1: The Ghost Network, the ghost network consists of synclines and ridges that outline broadly polygonal areas 700–2,000 m across. The question is, why a polygonal pattern, and why at that scale? The pattern and scale of the polygons in the ghost network are strikingly similar to those of polygons in polygonal fault systems, where layer-bound normal faults of different orientations form broadly polygonal planforms (Figure 15A). Polygonal faults form in very fine-grained sediments by radially isotropic, layer-parallel shrinkage and fluid expulsion during early burial and diagenesis. Polygonal faults are very common in modern marine basins, where they have been studied extensively using 2D and 3D seismic data in conjunction with petroleum exploration (Cartwright, 2011 and references therein).
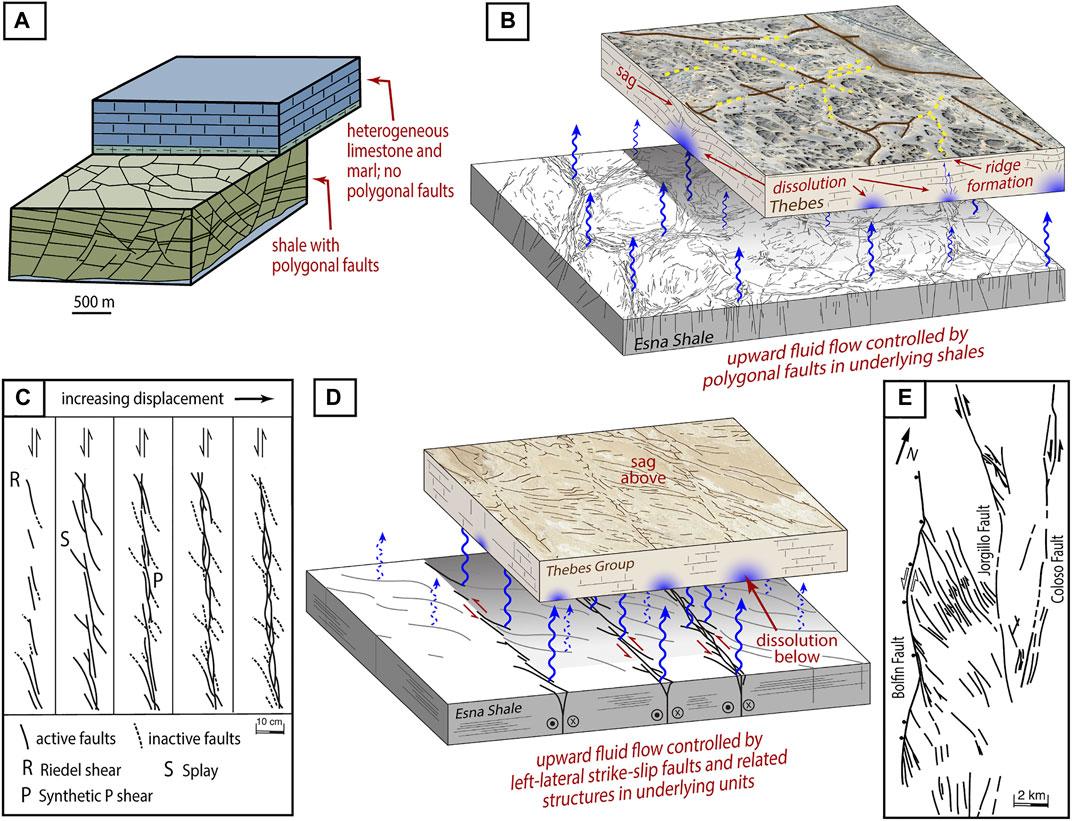
FIGURE 15. Summary model of bedrock structures controlling upward flow of aggressive fluids through bedrock underlying the Thebes limestones, with hypogene speleogenesis at depth in the limestones and sag in shallower limestone layers to create a sag syncline network with patterns that reflect the structural patterns in the underlying bedrock. (A) Schematic diagram showing planform and scale of polygonal faults. Adapted from Cartwright (1994) to show polygonal faults only in layers susceptible to polygonal faulting during early burial and diagenesis. (B) Conceptual model of polygonal faults in underlying shale controlling upward fluid flow into Thebes limestones. The pattern of polygonal faults is based on real-world polygonal faults as mapped by Tewksbury et al. (2014) in Cretaceous chalk of the Khoman Formation, which is well-exposed at the surface near Farafra Oasis, Egypt. (C) Diagram (Naylor et al., 1986) showing sequence of structures developed in analog models during upward propagation of a left-lateral strike-slip fault. Modified with permission from Elsevier.(D) Conceptual model of underlying, largely blind, left-lateral strike-slip faults in the N–S zones and related structures in the panels controlling upward fluid flow into Thebes limestones. (E) Structures with Lazy-S geometry developed between two left-lateral strike-slip faults in the Atacama Desert. Modified from Cembrano et al. (2005) with permission from Elsevier.
Polygonal faults occur dominantly in very fine-grained, clay-rich sediments, and, to a lesser extent, in chalk (e.g., Hansen et al., 2004; Tewksbury et al., 2014). The Thebes Group is a heterogenous succession of compact, fine-grained limestone, nodular limestone, chalky limestone, marl, bioclastic beds, siliceous limestone, concretionary limestone, and coquina that was deposited in several shallowing upward depositional cycles (Khalifa et al., 2004; El-Azabi and Farouk, 2011; King et al., 2017). The Thebes itself is an unlikely candidate to have developed a polygonal fault system. The underlying sequence is a different story. Logs from the Assiut-Kharga well indicate that the limestones overlie a succession more than 200 m thick consisting entirely of Paleocene and lower Eocene shales, which themselves overlie another 500 m of Upper Cretaceous sediments that consist mainly of shales (Barakat and Asaad, 1965). These thick shales would have been good candidates to develop polygonal faults.
The ghost network, then, has a pattern that is typical of polygonal faults, but the network pattern itself occurs in the Thebes. A logical explanation is that the polygonal syncline pattern was imparted from below and reflects a polygonal fault network in an underlying lithology that was susceptible to polygonal faulting, such as the shales of the Esna Formation. We suggest that polygonal faults provided pathways with a polygonal planform for aggressive fluids to rise through the Esna Formation and into the overlying Thebes limestones, imparting a broadly polygonal pattern to dissolution, sag, and related features (Figure 15B).
If this is a reasonable model, the relationship between ridges and synclines, as well as the features of the ridges themselves, should be consistent with the proposed process. As described in the section Area 1: The Ghost Network, synclines in the ghost network transition along trend from well-developed synclines to very shallow synclines cored by resistant ridges of limestone, to narrow flat-topped ridges of limestone with no discernable evidence in satellite imagery for inward dips. The syncline-to-ridge transition reflects decreasing amounts of sag along trend, which suggests that ridges occur over areas at depth in the limestone where dissolution was inadequate to cause much, if any, sag.
One might expect that the ridges should nevertheless contain evidence of upward fluid flow along the polygonal pathways. The ridges that we sampled in the field do, in fact, have networks of narrow calcite veins, indicating fluid flow and providing a reasonable explanation for why the limestone is more resistant there and forms ridges that contribute to the polygonal pattern.
We are also intrigued by the presence of honeycomb structure, ridges with one vertical side, and “railroad track” ridges. Klimchouk (2018) has proposed a fundamental link between upward flow of hypogene fluids, alteration of the host rock along fluid pathways, and subsequent differential weathering to produce honeycomb structures. We speculate that the honeycomb structure in our ridges may be evidence of this process, that longitudinal troughs in the “railroad track” ridges might reflect these vertical zones of alteration, and that the ridges with one vertical face and abundant honeycomb structure might be the exposed face of the center of a “railroad track” ridge. We have not, unfortunately, had the opportunity to carry out field work and sampling to test this idea.
In summary, we propose that the broadly polygonal pattern of the ghost network of synclines and ridges reflects the pattern of fluid pathways in the underlying rocks, in this case, a proposed polygonal fault system in the shales underlying the Thebes limestone, and that the ghost network, therefore, reflects upward fluid flow.
The N–S Panel Network
As described in the section Area 2: the N–S Panel Network, some synclines in the N–S zones trend parallel to the zones, whereas others trend NNW–SSE and either cross a zone obliquely or curve to merge with a N–S syncline. Despite the fact that the map in Figure 10 simply shows the traces of synclines, the map gives the impression of a set of N–S striking faults spaced 5–10 km apart that cut across the Thebes limestones. We suggest that this is not a coincidence and that a set of N–S strike-slip faults underlies the Thebes limestones and provided fluid pathways for ascending aggressive fluids to be carried upward into the limestones. Much as underlying polygonal faults governed patterns in the ghost network, we suggest that the pattern of faults underlying the N–S zones shaped the syncline network pattern in the overlying limestone. What, then, accounts for the distinctive asymmetric pattern of synclines in the N–S zones?
When a strike-slip fault is reactivated after deposition of a cover of younger rocks, the fault propagates upward from below and into the cover as slip takes place. Analog modeling of strike-slip faulting by many workers over the years has shown that a distinctive pattern and sequence of fault segments develop in the younger cover as the fault climbs upward and before a through-going strike-slip fault zone develops in the overlying rocks (Figure 15C) (e.g., Naylor et al., 1986; Sylvester, 1988; Dooley and Schreurs, 2012).
Figure 15C illustrates a number of important points. The earliest manifestation in the younger cover rocks of slip on a strike-slip fault at depth is typically a set of en echelon fault segments at a low angle to the strike of the fault at depth. These are the main Riedel (or R) shears, which are fault segments that have the same sense of shear as the strike-slip fault at depth but are oriented counterclockwise with respect to the underlying fault in left lateral shear (as in Figure 15C), and clockwise in right lateral shear.
With continued slip on the underlying fault, the tips of the R shears curve into extensional splays (or “horsetails”). With even more slip, a lower angle set of shears develops, called P shears, and segments become integrated as a through-going strike-slip fault zone in the cover rock. The structures in the cover vary not only over time but also in space and are dependent on the overall amount of slip at any location on the reactivated fault at depth.
We suggest that a set of N–S striking, left-lateral strike-slip faults with Riedel shears, splays, and connecting shears underlies the Thebes Group, perhaps extending into the Thebes in places. The complex and distinctive pattern of fault segments provided fluid pathways for ascending aggressive fluids to be carried upward into the limestones, imparting a Riedel pattern on dissolution zones in the limestone and on the resulting sag in the syncline network of the N–S zones that mimics, albeit imperfectly, the pattern and asymmetry of Riedel shears, splays, and connecting shears in the underlying left-lateral strike-slip fault (Figure 15D).
The presence of N–S synclines suggests that segments in the underlying fault zone were likely linked in many places and conveyed fluids upward along N–S zones. Other areas, however, suggest that the system underlying the Thebes consists primarily of en echelon segments. Figure 12F shows a pattern of narrow, en echelon ridges in the topography of zone 3. Synclines coincide with these en echelon ridges, suggesting a blind left-lateral strike-slip fault with R shears at depth that channeled fluids upward into the limestones.
N–S striking faults are well-known in the Kharga Valley (El Hinnawi et al., 1978; EGSMA, 1981), and modern artesian water rising along these faults is responsible for the N–S string of oases in the Valley. Tewksbury et al. (2017b) investigated faults in El Sett Tellaal in the southern Kharga Valley and documented Riedel geometries consistent with left-lateral strike slip along NNE-SSW striking faults produced by basement fault reactivation during the late Eocene. Sakran and Said (2018) also provide evidence for post-early Eocene left-lateral strike slip on a major N–S fault cutting Eocene limestones in the southern part of the Sinn El-Kaddab east of El Sett Tellaal.
The tectonic context for slip on these N–S faults was a brief, major compressional event related to plate motions that affected North Africa in the early part of the late Eocene (∼37 Ma) and that reactivated the major E–W faults in southern Egypt in right-lateral strike slip and the less prominent N–S faults in left-lateral strike slip (Guiraud et al., 2001; 2005). Our interpretation that N–S faults, reactivated in left-lateral strike slip, cut the Paleogene section in our study area toward the end of the Eocene is consistent with these previous findings.
In the panels between the N–S zones, syncline density is lower than in the N–S zones, and synclines are typically shallow, exhibiting less sag than synclines in the N–S zones. Synclines transition to ridges along trend, and areas in the panels that have few synclines instead have ridges with the same orientations. We suggest that, as in the ghost network, synclines and ridges are related to the same process of ascending fluids and dissolution at depth in Thebes limestones. Synclines resulted where dissolution at depth was enough to promote sag, and ridges occur where dissolution at depth was inadequate to generate local sag. As in the ghost network, vein networks may be responsible for making the limestone in the ridges locally more resistant.
The Lazy-S pattern of synclines and ridges likely reflects the mechanical interactions between structures forming along the N–S faults themselves and those forming in the panels between the faults during the late Eocene compressional event. WNW–ESE joint orientations are common in the panels, in our previously mapped area (Tewksbury et al., 2017a) and in the Eocene limestones as far as the southern end of the Sinn El-Kaddab. If regional joints were forming while the N–S faults were also active, mechanical interaction between the joint and fault structures would have locally re-orientated stresses, resulting in joints near the N–S faults with orientations different from the overall WNW–ESE regional orientations elsewhere in the panels. Alternatively, extensional splays (horsetails) associated with Riedel shears along the N–S faults may have triggered formation of joint clusters with NW–SE and WNW–ESE orientations in the panels.
A third possibility is that the N–S faults are close enough together that structures forming in the panels resulted directly from interactions between adjacent N–S faults, as suggested by experimental results from Hempton and Neher (1986). Cembrano et al. (2005) show Lazy-S patterns similar to ours in a complex set of extensional structures and low-displacement faults that developed between left-lateral strike-slip faults spaced 5 km apart in the Atacama Fault system of Chile (Figure 15E). Features produced by any one of these models could have served to localize fluid flow, producing the Lazy-S pattern of ridges and the synclines within the panels.
Before leaving the N–S panel network, we would like to comment briefly on the rectilinear pattern of very shallow sags exposed on bedding surfaces toward the bottom of the Thebes (Figures 13A,B), which we interpret as sags resulting from minor amounts of dissolution along a set of intersecting joints. We suggest that these features are yet another indication of ascending fluids. Given that these features are two orders of magnitude smaller than the sag features of our syncline network, they might provide a window into what was happening at the very bottom of the limestones, where small amounts of less localized fluid transfer occurred.
The Grabens
Our new work has revealed two sets of synclines in the grabens area, one that crosses the grabens and is offset along graben-related faults and a second set that is typically located just inboard of, and parallel to, the graben margins. The graben-margin synclines are similar in scale and characteristics to those in the pre-graben syncline network and dissimilar in scale and characteristics to folds typically produced in the hanging wall by extensional faulting (e.g., Schlische, 1995; Khalil and McClay, 2002). We suggest that both sets of synclines in the limestones were formed by dissolution and sag processes, with the graben-margin synclines controlled by later upward fluid flow along graben-bounding faults that cut earlier-formed parts of the syncline network.
Space and Time Synthesis
We have looked in detail at the patterns in three specific parts of the new area that we mapped, and we can apply what we have learned to areas that we have previously mapped, as well as to areas where we have carried out reconnaissance.
For the ghost network, we suggest that the syncline network pattern reflects the pattern of polygonal faults in underlying shales, and it is worth considering whether there are other areas in the Eocene limestones for which this might also be true. Polygonal fault networks vary considerably both in planform (e.g., rectangular, elongate, or irregular polygons) and in the extent of interconnectedness of faults (Cartwright, 2011). The syncline pattern in the trellis area that we mapped previously is also polygonal, although better integrated than the ghost network and with polygons strongly elongated NW–SE. Reconnaissance mapping shows similar, broadly polygonal patterns in the syncline network to the east and north of the trellis area, to the east of the ghost network, to the south along both sides of the Western Desert Highway, and across the Nile in places in the Eastern Desert.
For the N–S panel network, we suggest that the syncline network pattern reflects a set of fluid pathways under the Thebes limestones that were shaped by upward propagation of a set of N–S, left-lateral strike-slip faults and by a Lazy-S pattern of fractures between N–S zones. This combined pattern helps illuminate the area that we mapped previously between the Assiut-Kharga Road and the grabens (Figure 6), which also displays a Lazy-S pattern of synclines. The tails of these Lazy-S patterns line up along N–S zones in several places, and the density of synclines is higher in the panel areas adjacent to them than it is elsewhere. This suggests to us that the pattern here, too, is influenced by fluid pathways associated with blind left-lateral strike-slip faults at depth that stalled during upward propagation before reaching the current level of erosion in our previous mapping area.
We have focused entirely on the syncline network and have said nothing so far about whether there are mappable N–S faults at the current level of erosion. High resolution satellite imagery does show considerable fracturing as well as minor faults along the N–S zones, but, despite the nearly complete exposure, we have found very few clear, mappable faults of any length along the N–S zones, and the definitive ones typically cut synclines of the network. We interpret this as indicating that, in large parts of our mapping area, the N–S strike-slip faults were largely blind when the syncline network formed and that crustal extension at the onset of Red Sea rifting at the Oligocene-Miocene boundary (Bosworth et al., 2015) reactivated the N–S faults, producing fracture sets, modest faults, and low-amplitude monoclines that are visible at the current level of erosion. At the surface today, the N–S zones remain dominated by the syncline network.
In our previous paper (Tewksbury et al., 2017a), we concluded that the syncline network predated Red Sea Rift-related faulting, although we couldn’t determine by how much. Adding the constraint provided by our new work on the role of the N–S strike-slip faults narrows the time of formation of the main part of the syncline network in our mapped area to a window between the end of the early late Eocene tectonic event ∼37 Ma and initiation of the Red Sea Rift ∼23–22 Ma.
Our new work also indicates that, although much of the syncline network formed prior to the grabens, the syncline-forming process spanned a time that also included Red Sea Rift-related faulting in this part of the Limestone Plateau. This timing is consistent with our work on the Katkut Formation in the eastern part of our mapping area (Tewksbury et al., 2018), which shows that the syncline network was eroded to a nearly flat surface prior to deposition of the Katkut gravels, which were deposited prior to the late Miocene.
Our Egypt-wide reconnaissance survey (Tewksbury et al., 2017a) revealed that synclines occur in Eocene limestones over an area of ∼100,000 km2, although not equally well-developed everywhere. Especially to the north and west of our mapping area, synclines are dominated by NNW–SSE orientations, i.e., orientations parallel to the grabens. Given our new results, we suggest that, as in our mapping area, these synclines may be younger than the main part of our syncline network and may reflect syncline-forming activity that could conceivably be continuing to this day.
The clear temporal connection between the syncline network and crustal extension strengthens our proposed model (Tewksbury et al., 2017a) that ascending aggressive fluids responsible for hypogene speleogenesis were related to intrusion of mantle-derived magmas associated with crustal extension prior to rapid unzipping of the Red Sea Rift at the Oligocene-Miocene boundary, which was accompanied by eruption of voluminous basalts from the Cairo mini-plume (Bosworth et al., 2015). Although there are essentially no exposed basalts in the Thebes at the current level of erosion, two geophysical studies have proposed basaltic intrusions in the subsurface (Bakheit et al., 2003; Bakheit, 2005), and the widespread occurrence of Cenozoic basalts elsewhere in Egypt (Klitzsch et al., 1987; Meneisy, 1990) suggests that basaltic intrusions are likely under the Thebes.
Mantle degassing and transfer of endogenic helium and carbon from the mantle to the crust is a pervasive and long-lived feature of areas undergoing crustal extension (Crossey et al., 2016; Lee, et al., 2016), as the Egyptian crust was during the onset of Red Sea rifting. Endogenic CO2 associated with mantle-derived magmas can drive significant hypogene speleogenesis, as suggested by Bayari et al. (2017) for the obruks in Turkey.
Furthermore, Decker at al. (2015) have suggested that rising supercritical CO2 (sCO2) can be particularly important in hypogene speleogenesis, because sCO2 not only migrates easily through faults and fractures but also generates highly aggressive fluids when it mixes with water encountered during upward migration. Mixed fluids such as this are most aggressive just above the supercritical/subcritical transition, which occurs at depths of about 350–750 m at normal to somewhat elevated geothermal gradients. Given the current (eroded) thickness of the limestones (∼400 m), it is not unreasonable to propose that the supercritical-to-subcritical transition in sCO2 may have played an important role in hypogene speleogenesis at depth in the Thebes.
Mantle degassing and geothermal activity are occurring even today in Egypt. Analyses of modern spring water in the main Western Desert oases indicate that more than 30% of the carbon is endogenic and that mantle-derived helium is still entering the aquifer system from below (Mohammed et al., 2014; Mohammed, 2015). Thermal springs and wells are present in all of the main Western Desert oases, and some portions of the Limestone Plateau in our study area even have moderate to high favorability ratings for geothermal development (Abdel Zaher et al., 2018). All of these factors indicate that it is not unreasonable to suggest that hypogene fluids 20 million years ago would have likely been both chemically and thermally aggressive.
Given the evidence that we have for hypogene fluids and a variety of structural conduits capable of conducting hypogene fluids to a variety of levels over a long period of time, it would be perfectly reasonable to suggest that explorable hypogene caves may be present in some places in limestones that also display the syncline network. Caves are, in fact, common in limestones of the Thebes Group and have been widely attributed to epigenic karst processes during late Neogene to early Holocene pluvial events in the Sahara (e.g., Abdeltawab, 2013; Mostafa, 2013; Abd El Aal et al., 2020). An exception to this interpretation is a brief description by Mostafa (2012) in which he suggests a hypogene origin for the El Balayza Cave along the Nile Escarpment south of Assiut. Critical examination of known caves in Egypt, along with exploration for others of potential hypogene origin, is a fruitful area for future field research in the Thebes.
Key Takeaways
The theme of this paper is patterns. The pattern of features related to hypogene speleogenesis is not explainable unless one looks at the pattern that would have been in the underlying rocks at the time and that would have governed the pattern of upward flow of aggressive fluids. For our rocks, those patterns are the unique and recognizable patterns of specific types of faults and fractures, which allow us to demonstrate that upward flow was a critical component in the origin of the syncline and ridge network in the Thebes.
Can we account for every pattern everywhere in our syncline network? Definitely not, for a number of reasons. First, patterns in features related to hypogene karst will be an imperfect reflection of underlying fluid pathways, because ascending fluids will be influenced by fluid flow pathways and mixing in overlying units. Second, even if one knows what the potential controlling structures might have been, many structures can serve as either fluid-flow pathways or fluid flow barriers, depending on their histories and the state of stress of the crust at the time (Faulkner et al., 2010 and references therein). In our area, upward fluid flow was likely promoted by extension in the crust, which may well have opened otherwise tight faults and fractures. Third, for any particular area, patterns of hypogene speleogenesis will likely reflect the best fluid flow pathways, not all of the ones that are potentially available. Fourth, the best fluid flow pathways can change over time. These latter two takeaways are illustrated by the graben-parallel synclines and by the dominance of young NNW-SSE synclines in the north and west.
Implications for Hypogene Karst Studies
We recognize that our ability to make a compelling case for the syncline network in the Thebes as a “smoking gun” for hypogene speleogenesis at depth hinges on the unique setting of the Limestone Plateau. The combination of a flat plateau surface, a quasi-horizontal stratigraphic sequence, nearly complete absence of fluvial dissection, and lack of cover by surficial deposits and vegetation make it possible to develop a clear and complete picture that would be difficult to put together in most other on-land settings. On the other hand, aspects of what we have learned can provide guidance in what to look for in field areas that are less well-exposed or in areas where seismic reflection data are available.
Without good exposure, sag synclines would admittedly be easy to overlook in the field. They are hundreds of meters wide and can be spaced kilometers apart, dips are low, and bedding is likely to be quasi-horizontal between synclines. But knowing these parameters could make the difference between dismissing subtle dip changes in a large roadcut and recognizing the first hint of a sag syncline.
Being able to see the outcrop patterns of our eroded syncline network has been crucial for developing a picture of the planform and extent of the network, and, in vegetated areas, these patterns could easily be hidden even in high resolution satellite or aerial imagery. LiDAR data has tremendous potential for exploration in areas such as this because the data can be processed to effectively remove vegetation and produce a bare Earth digital terrain model (DTM). High resolution digital shaded relief maps developed from DTMs could reveal the distinctive outcrop patterns of eroded synclines and basin closures in contrast to outcrop patterns of the country rock if layers have differences in resistance to erosion. It is important to remember that, in an inactive, eroded network, the elevation of syncline and basin cores with respect to adjacent areas is governed by resistance to erosion, rather than by sag. In many of the areas of our syncline network in Egypt, in fact, erosional remnants in syncline cores do, in fact, sit topographically higher than the surrounding area.
Because the pattern of conduits that carry hypogene fluids upward and into soluble horizons can be reflected, albeit not perfectly, in the pattern of sag synclines, understanding what the patterns might be at depth in a particular area can be useful in looking for evidence of a sag syncline network at the surface. Geologists with different specialties develop eyes for different kinds of patterns, and working with colleagues who have different pattern recognition experiences, especially patterns that are relevant to the bedrock geology and structural history of the area, can make a critical difference in figuring out what patterns to look for in a potential syncline network.
2D and 3D seismic data hold tremendous potential for recognizing features related to hypogene karst. Using data from the South China Sea, Sun et al. (2013) and Chen et al. (2015) describe chaotic reflectors at depth in a carbonate sequence overlain by sedimentary layers with pipe-shaped structures that display inwardly dipping layers. They attribute the chaotic reflectors to dissolution in the carbonates, with resulting sag of overlying layers over a vertical extent of 140–870 m. Sun et al. suggest that ascending aggressive fluids were associated with several episodes of magmatic activity at depth, whereas Chen et al. suggest a different source for fluids but point to the role of faults in focusing upward movement of fluids. Although Sun et al. do not mention hypogene karst, and Chen et al. only mention it in passing in the introduction, both papers perfectly describe the process of hypogene speleogenesis.
Horizontal coherence slices in Sun et al. (2013) and Chen el al. (2015) show eye-shaped sags 200–700 m across that are in the size range of the basin closures in our syncline network. What is missing is a network of synclines that connects the “eyes.” A question for future studies will be whether a field of “eyes” that are truly isolated basin closures in otherwise horizontal sedimentary layering is yet another “smoking gun” feature that would point to hypogene karst at depth or whether the sag in the syncline “connectors,” which is less than in the basin closures, is simply hidden below the resolution of the seismic data.
And last, field exposures of the syncline network in the Western Desert of Egypt could offer a unique opportunity to look for other features, such as geochemical fingerprints, that could be used in other areas to prospect for the presence of hypogene karst at depth.
Data Availability Statement
The data set presented in this study is available at https://doi.org/10.6084/m9.figshare.14650140.
Author Contributions
BT conceived the study and led the mapping, analysis, and interpretation. She is also PI of the Desert Eyes Project of which this study is a part. ET conducted field work and collected structural data and samples. RW mapped the N–S zones network for his undergraduate research thesis and contributed to broader analysis and interpretation. CM contributed sample and thin section descriptions, as well as expertise on stratigraphy. BT prepared the initial manuscript draft, and all four authors contributed to revision of the manuscript and figures and approved the final submission.
Funding
Funding for our work has been provided by U.S. National Science Foundation IRES Grant 1030224 and by Hamilton College. Damanhour University provided support for ET in the field.
Conflict of Interest
The authors declare that the research was conducted in the absence of any commercial or financial relationships that could be construed as a potential conflict of interest.
Acknowledgments
We gratefully acknowledge the careful mapping and satellite image analysis of various areas in the Western Desert over the past four years by Hamilton students Anika Huq, Alex Holmwood, Mia Ratino, and Chris Skeldon. We thank Mahmoud Hanafy for assisting ET in the field. We are grateful to colleagues in the karst community, especially Lewis Land and George Veni of the National Cave and Karst Research Institute, for invaluable discussions and for continued interest in our unique structures. We thank Marie-Pierre Aubry for sharing her knowledge of Thebes limestones and for clarifying the terminology used in the literature. Thanks as well to Abdallah Zaki for generously sharing field photos with us. Dave Tewksbury was instrumental in developing GIS data sets and maps. We are also grateful for the review comments by Philippe Audra and Francisco Hilario Bezerra; their suggestions made this a much better manuscript. We thank Alexander Klimchouk for his interest in our work and for encouraging us to contribute this manuscript.
Supplementary Material
The Supplementary Material for this article can be found online at: https://www.frontiersin.org/articles/10.3389/feart.2021.678565/full#supplementary-material
References
Abd El Aal, A. K., Nabawy, B. S., Aqeel, A., and Abidi, A. (2020). Geohazards Assessment of the Karstified Limestone Cliffs for Safe Urban Constructions, Sohag, West Nile Valley, Egypt. J. Afr. Earth Sci. 161, 103671. doi:10.1016/j.jafrearsci.2019.103671
Abdel Zaher, M., Elbarbary, S., El-Shahat, A., Mesbah, H., and Embaby, A. (2018). Geothermal Resources in Egypt Integrated with GIS-Based Analysis. J. Volcanology Geothermal Res. 365, 1–12. doi:10.1016/j.jvolgeores.2018.09.013
Abdeltawab, S. (2013). Karst Limestone Geohazards in Egypt and Saudi Arabia. Int. J. Geoengineering Case Histories 2 (4), 258–269. doi:10.4417/IJGCH-02-04-02
Bakheit, A. A., Senosy, M. M., and Ibrahim, H. A. (2003). “Ground Magnetic Survey on Some Basaltic Bodies in Gebel Gebeil and West of El-Bahnasa Areas, Western Desert, Egypt,” in The Third International Conference on the Geology of Africa, 531–545.
Bakheit, A. A. (2005). “Geomagnetic and Geological Studies on Kolit Abu Gilbana, Eastern Desert, Egypt,” in The Fourth International Conference on the Geology of Africa, 853–866.
Barakat, M. G., and Asaad, F. A. (1965). Geological Results of the Assiut-Kharga Well. United Arab. Republic J. Geol. 9 (2), 81–87.
Bayari, C. S., Özyurt, N. N., Koray, T., Pinar, A., Noyan, G. I., and Pekkan, E. (2017). “Geodynamic Control of Hypogene Karst Development in Central Anatolia, Turkey,” in Hypogene Karst Regions and Caves of the World. Cave and Karst Systems of the World. Editors A. Klimchouk, A. N. Palmer, J. De Waele, A. S. Auler, and P. Audra (Cham, Switzerland: Springer International Publishing AG), 449–462. doi:10.1007/978-3-319-53348-3_27
Bosworth, W., Stockli, D. F., and Helgeson, D. E. (2015). Integrated Outcrop, 3D Seismic, and Geochronologic Interpretation of Red Sea Dike-Related Deformation in the Western Desert, Egypt - the Role of the 23 Ma Cairo "Mini-Plume". J. Afr. Earth Sci. 109, 107–119. doi:10.1016/j.jafrearsci.2015.05.005
Brookes, I. A. (2001). Possible Miocene Catastrophic Flooding in Egypt's Western Desert. J. Afr. Earth Sci. 32 (2), 325–333. doi:10.1016/S0899-5362(01)90010-7
Cartwright, J. (2011). Diagenetically Induced Shear Failure of Fine-grained Sediments and the Development of Polygonal Fault Systems. Mar. Pet. Geology 28, 1593–1610. doi:10.1016/j.marpetgeo.2011.06.004
Cartwright, J. A. (1994). Episodic Basin-Wide Fluid Expulsion From Geopressured Shale Sequences in the North Sea Basin. Geology 22 (5), 447–450. doi:10.1130/0091-7613(1994)022<0447:EBWFEF>;2.3.CO;2
Cembrano, J., González, G., Arancibia, G., Ahumada, I., Olivares, V., and Herrera, V. (2005). Fault Zone Development and Strain Partitioning in an Extensional Strike-Slip Duplex: A Case Study from the Mesozoic Atacama Fault System, Northern Chile. Tectonophysics 400, 105–125. doi:10.1016/j.tecto.2005.02.012
Chen, D., Wu, S., Völker, D., Dong, D., Shi, H., Zhao, S., et al. (2015). Tectonically Induced, Deep-Burial Paleo-Collapses in the Zhujiang Miocene Carbonate Platform in the Northern South China Sea. Mar. Geology 364, 43–52. doi:10.1016/j.margeo.2015.03.007
Crossey, L. J., Karlstrom, K. E., Schmandt, B., Crow, R. R., Colman, D. R., Cron, B., et al. (2016). Continental Smokers Couple Mantle Degassing and Distinctive Microbiology within Continents. Earth Planet. Sci. Lett. 435, 22–30. doi:10.1016/j.epsl.2015.11.039
Decker, D. D., Polyak, V. J., and Asmerom, Y. (2015). “Depth and Timing of Calcite Spar and “Spar Cave” Genesis: Implications for Landscape Evolution Studies,” in Caves and Karst across Time. Editors J. Feinberg, Y. Gao, and E.C. Alexander (Boulder, CO: Geological Society of America). Special Paper 516. doi:10.1130/2015.2516(08)
Dooley, T. P., and Schreurs, G. (2012). Analogue Modelling of Intraplate Strike-Slip Tectonics: A Review and New Experimental Results. Tectonophysics 574–575, 1–71. doi:10.1016/j.tecto.2012.05.030
EGSMA (1981). “Geologic Map of Egypt, 1:2,000,000,” in Egypt, Ministry of Industry and Mineral Resources. Cairo: The Egyptian Geological Survey and Mining Authority.
El Hinnawi, M., Abdallah, A. M., and Issawi, B. (1978). Geology of Abu Bayan-Bolaq Stretch, Western Desert, Egypt. Ann. Geol. Surv. Egypt 8, 19–50.
El Hinnawi, M. E., Said, M. M., El Kelani, A. H., and Attiya, M. N. (2005). Stratigraphic Lexicon and Explanatory Notes to the Geological Map of the South Western Desert, Egypt. Cairo: The Egyptian Geological Survey and Mining Authority (EGSMA) and the National Authority for Remote Sensing and Space Sciences, 117.
El-Azabi, M. H., and Farouk, S. (2011). High-resolution Sequence Stratigraphy of the Maastrichtian-Ypresian Succession along the Eastern Scarp Face of Kharga Oasis, Southern Western Desert, Egypt. Sedimentology 58, 579–617. doi:10.1111/j.1365-3091.2010.01175.x
Faulkner, D. R., Jackson, C. A. L., Lunn, R. J., Schlische, R. W., Shipton, Z. K., Wibberley, C. A. J., et al. (2010). A Review of Recent Developments Concerning the Structure, Mechanics and Fluid Flow Properties of Fault Zones. J. Struct. Geology 32, 1557–1575. doi:10.1016/j.jsg.2010.06.009
Ghobrial, M. G. (1967). The Structural Geology of the Kharga Oasis: General Egyptian Organization for Geological Research and Mining. Geol. Surv. 43, 39.
Guiraud, R., Issawi, B., and Bosworth, W. (2001). “Phanerozoic History of Egypt and Surrounding Areas,” in Peri-Tethys Memoir 6: Peri-Tethyan Rift/Wrench Basins and Passive Margins: Paris Memoires du Museum National d'Histoire Naturelle. Editors P.A. Ziegller, W. Cavazza, A.H.F. Robertosn, and S. Crasquin-Soleau (Berlin: Springer), 469–509.
Guiraud, R., Bosworth, W., Thierry, J., and Delplanque, A. (2005). Phanerozoic Geological Evolution of Northern and Central Africa: an Overview. J. Afr. Earth Sci. 43, 83–143. doi:10.1016/j.jafrearsci.2005.07.017
Hansen, D. M., Shimeld, J. W., Williamson, M. A., and Lykke-Andersen, H. (2004). Development of a Major Polygonal Fault System in Upper Cretaceous Chalk and Cenozoic Mudrocks of the Sable Subbasin, Canadian Atlantic Margin. Mar. Pet. Geology 21, 1205–1219. doi:10.1016/j.marpetgeo.2004.07.004
Hempton, M. R., and Neher, K. (1986). Experimental, Fracture, Strain and Subsidence Patterns over En Échelon Strike-slip Faults: Implications for the Structural Evolution of Pull-apart Basins. J. Struct. Geology 8 (6), 597–605. doi:10.1016/0191-8141(86)90066-0
Issawi, B., Francis, M. H., Youssef, El-S. A. A., and Osman, R. A. (2009). The Phanerozoic Geology of Egypt: A Geodynamic Approach. 2nd Edn. Cairo: Ministry of Petroleum and The Egyptian Mineral Resources Authority Special Publication, Vol. 81, 571.
Issawi, B. (1972). Review of Upper Cretaceous-Lower Tertiary Stratigraphy in Central and Southern Egypt. Am. Assoc. Pet. Geologists Bull. 56 (8), 1448–1463. doi:10.1306/819A40F2-16C5-11D7-8645000102C1865D
Keheila, E. A., and El-Ayyat, A. A. M. (1990). Lower Eocene Carbonate Facies, Environments and Sedimentary Cycles in Upper Egypt: Evidence for Global Sea-Level Changes. Palaeogeogr. Palaeoclimatol. Palaeoecol. 81, 33–47. doi:10.1016/0031-0182(90)90038-9
Keheila, E. A., Soliman, H. A., El-Ayyat, A. A. M., and Abd Alla, M. (1990). Litho- and Biostratigraphy of the Lower Eocene Carbonate Sequence in Upper Egypt: Evidence for Uplifting and Resedimentation of the Paleocene Section. J. Afr. Earth Sci. (and Middle East) 11 (1/2), 151–168. doi:10.1016/0899-5362(90)90085-S
Khalifa, M. A., Abu El Ghar, M. S., Helal, S., and Hussein, A. W. (2004). “Depositional History of the Lower Eocene Drowned Carbonate Platform (Drunka Formation), West of Assiut-Minia Stretch, Western Desert, Egypt,” in 7th International Conference on the Geology of the Arab World (Cairo University), 233–254.
Khalil, M., and El-Younsy, A. R. M. (2003). Sedimentological Approach to High Resolution Sequence Stratigraphy of the Upper Cretaceous-Lower Eocene Succession, Farafra Oasis, Western Desert, Egypt. United Arab Republic J. Geology 47 (1), 275–300. doi:10.1016/j.jafrearsci.2020.104096
Khalil, S. M., and McClay, K. R. (2002). Extensional Fault-Related Folding, Northwestern Red Sea, Egypt. J. Struct. Geology 24, 743–762. doi:10.1016/S0191-8141(01)00118-3
King, C., Dupuis, C., Aubry, M.-P., Berggren, W. A., Knox, R. O. B., Galal, W. F., et al. (2017). Anatomy of a Mountain: The Thebes Limestone Formation (Lower Eocene) at Gebel Gurnah, Luxor, Nile Valley, Upper Egypt. J. Afr. Earth Sci. 136, 61–108. doi:10.1016/j.jafrearsci.2017.05.008
Klimchouk, A., Tymokhina, E., and Amelichev, G. (2012). Speleogenetic Effects of Interaction between Deeply Derived Fracture-Conduit Flow and Intrastratal Matrix Flow in Hypogene Karst Settings. Int. J. Speleol. 41 (2), 161–179. doi:10.5038/1827-806X.41.2.4
Klimchouk, A., Palmer, A. N., De Waele, J., Auler, A.S., and Audra, P. (2017). Hypogene Karst Regions and Caves of the World (Cham, Switzerland: Springer International Publishing AG), 911. doi:10.1007/978-3-319-53348-3
Klimchouk, A. (2017). “Types and Settings of Hypogene Karst,” in Hypogene Karst Regions and Caves of the World: Cave and Karst Systems of the World. Editors A. Klimchouk, A. N. Palmer, J. De Waele, A. S. Auler, and P. Audra (Cham, Switzerland: Springer International Publishing AG), 1–39. doi:10.1007/978-3-319-53348-3_1
Klimchouk, A. (2018). “Tafoni and Honeycomb Structures as Indicators of Ascending Fluid Flow and Hypogene Karstification,” in Advances in Karst Research: Theory, Fieldwork and Applications. Editors M. Parise, F. Gabrovsek, G. Kaufmann, and N. Ravbar (London: Geological Society London, Special Publications), 466, 79–105. doi:10.1144/SP466.11
Klitzsch, E., List, F. K., and Pöhlmann, G. (1987). Geologic Maps of Egypt, 1:500,000 Scale. Cairo: The Egyptian General Petroleum Company (EGCP) and Conoco Coral, Asyut, Luxor, and El-Saad El-Ali sheets.
Lee, H., Muirhead, J. D., Fischer, T. P., Ebinger, C. J., Kattenhorn, S. A., Sharp, Z. D., et al. (2016). Massive and Prolonged Deep Carbon Emissions Associated With Continental Rifting. Nat. Geosci. 9, 145–149. doi:10.1038/ngeo2622
Meneisy, M. Y. (1990). “Vulcanicity,” in The Geology of Egypt. Editor R. Said (Rotterdam, Netherlands: A.A. Balkema), 157–172.
Mohammed, A., Crossey, L. J., Karlstrom, K. E., Kehew, A. E., Sultan, M., and Krishnamurthy, R. V. (2014). Structural Control of the Continental-Scale Nubian Sandstone Aquifer System Constrained by Hydrochemical, Stable Isotopes, and Noble Gas Data (Abstr.) Geol. Soc. America, Abstr. Programs 46 (6), 117.
Mohammed, A. M. (2015). Deep Fluid Inputs into the Continental-Scale Nubian Sandstone Aquifer System Constrained by Hydrochemical Stable Isotope, and Noble Gas Data. PhD Dissertation. (Kalamazoo, MI: Western Michigan University).
Mostafa, A. (2012). Caves of the Nile Valley (Governorate of Assiut, Middle Egypt): a Long-Term Interaction between Human Societies and Their Environment. Geomorphologie 18 (1), 37–44. doi:10.4000/geomorphologie.9719
Mostafa, A. (2013). Paleokarst Shafts in the Western Desert of Egypt: a Unique Landscape. Acta Carsologica 42, (1), 49–60. doi:10.3986/AC.V42I1.631
Naylor, M. A., Mandl, G., and Sijpesteijn, C. H. K. (1986). Fault Geometries in Basement-Induced Wrench Faulting under Different Initial Stress States. J. Struct. Geol. 8 (7), 737–752. doi:10.1016/0191-8141(86)90022-2
Riad, S., El Hinnawi, M., Mohammad, P., Emad, R., El Khawaga, R., and Mohammad, L. (2005). Geological Map Quadrangles of Egypt 1:250,000 Scale. Cairo: The Egyptian Geological Survey and Mining Authority (EGSMA) National Authority for Remote Sensing and Space Sciences (NARSS), United Nations Development Program (UNDP) and United Nations Educational Scientific and Cultural Organization (UNESCO) Tahta and Qena sheets.
Said, R. (1960). Planktonic Foraminifera from the Thebes Formation, Luxor, Egypt. Micropaleontology 6, 277–286. doi:10.2307/1484234
Said, R. (1990). “The Cenozoic,” in The Geology of Egypt. Editor R. Said (Rotterdam, Netherlands: A.A. Balkema), 451–486.
Sakran, S., and Said, S. M. (2018). Structural Setting and Kinematics of Nubian Fault System, SE Western Desert, Egypt: An Example of Multi-Reactivated Intraplate Strike-Slip Faults. J. Struct. Geology 107, 93–108. doi:10.1016/j.jsg.2017.12.006
Salim, M. G. (2012). Selection of Groundwater Sites in Egypt, Using Geographic Information Systems, for Desalination by Solar Energy in Order to Reduce Greenhouse Gases. J. Adv. Res. 3, 11–19. doi:10.1016/j.jare.2011.02.008
Schlische, R. W. (1995). Geometry and Origin of Fault-Related Folds in Extensional Settings. AAPG Bull. 79 (11), 1661–1678. doi:10.1306/7834DE4A-1721-11D7-8645000102C1865D
Sun, Q., Cartwright, J., Wu, S., and Chen, D. (2013). 3D Seismic Interpretation of Dissolution Pipes in the South China Sea: Genesis by Subsurface, Fluid Induced Collapse. Mar. Geology 337, 171–181. doi:10.1016/j.margeo.2013.03.002
Sylvester, A. G. (1988). Strike-slip Faults. Geol. Soc. America Bull. 100, 1666–1703. doi:10.1130/0016-7606(1988)100<1666:SSF>2.3.CO;2
Tarabees, E. A., Tewksbury, B. J., Mehrtens, C. J., and Younis, A. (2017). Audio-magnetotelluric Surveys to Constrain the Origin of a Network of Narrow Synclines in Eocene Limestone, Western Desert, Egypt. J. Afr. Earth Sci. 136, 168–175. doi:10.1016/j.jafrearsci.2017.03.001
Tewksbury, B. J., Dokmak, A. A. K., Tarabees, E. A., and Mansour, A. S. (2012). “Google Earth and Geologic Research in Remote Regions of the Developing World; an Example from the Western Desert of Egypt,” in Google Earth and Virtual Visualizations in Geoscience Education and Research. Editors S. J. Whitmeyer, J. E. Bailey, D. G. De Paor, and T. Ornduff (Boulder, CO: Geological Society of America Special Paper 492), 23–36. doi:10.1130/2012.2492(02)
Tewksbury, B. J., Hogan, J. P., Kattenhorn, S. A., Mehrtens, C. J., and Tarabees, E. A. (2014). Polygonal Faults in Chalk: Insights from Extensive Exposures of the Khoman Formation, Western Desert, Egypt. Geology 42 (6), 479–482. doi:10.1130/G35362.1
Tewksbury, B. J., Tarabees, E. A., and Mehrtens, C. J. (2017a). Origin of an Extensive Network of Non-tectonic Synclines in Eocene Limestones of the Western Desert, Egypt. J. Afr. Earth Sci. 136, 148–167. doi:10.1016/j.jafrearsci.2017.02.017
Tewksbury, B. J., Mehrtens, C. J., Gohlke, S. A., Tarabees, E. A., and Hogan, J. P. (2017b). Constraints from Mesozoic Siliciclastic Cover Rocks and Satellite Image Analysis on the Slip History of Regional E-W Faults in the Southeast Western Desert, Egypt. J. Afr. Earth Sci. 136, 119–135. doi:10.1016/j.jafrearsci.2017.06.026
Tewksbury, B. J., Tarabees, E. A., Hanafy, M. I., and Huq, A. C. (2018). Fluvial Gravels of the Katkut Formation, Oligocene/Miocene Landscape, and Constraints on Timing of Formation of Non-tectonic Synclines in Eocene Limestones of the Western Desert, Egypt. Geol. Soc. America Abstr. Programs 50, 6. doi:10.1130/abs/2018AM-319199
Keywords: hypogene karst, speleogenesis, syncline, remote sensing, fluid flow, Google Earth, polygonal faults, Riedel shears
Citation: Tewksbury BJ, Tarabees EA, Welch RM and Mehrtens CJ (2021) Inferring Hypogene Karst at Depth from the Patterns of Non-Tectonic Syncline Networks in Eocene Limestones, Western Desert, Egypt. Front. Earth Sci. 9:678565. doi: 10.3389/feart.2021.678565
Received: 09 March 2021; Accepted: 07 June 2021;
Published: 30 June 2021.
Edited by:
Alexander Klimchouk, National Academy of Sciences of Ukraine, UkraineReviewed by:
Philippe Audra, Université Côte d'Azur, FranceFrancisco Hilario Bezerra, Federal University of Rio Grande do Norte, Brazil
Copyright © 2021 Tewksbury, Tarabees, Welch and Mehrtens. This is an open-access article distributed under the terms of the Creative Commons Attribution License (CC BY). The use, distribution or reproduction in other forums is permitted, provided the original author(s) and the copyright owner(s) are credited and that the original publication in this journal is cited, in accordance with accepted academic practice. No use, distribution or reproduction is permitted which does not comply with these terms.
*Correspondence: Barbara J. Tewksbury, YnRld2tzYnVAaGFtaWx0b24uZWR1