 S. Butcher
 A. F. Bell
 S. Hernandez2
 M. Ruiz
- 1School of Geosciences, University of Edinburgh, Edinburgh, United Kingdom
- 2Instituto Geofísico, Escuela Politécnica Nacional, Quito, Ecuador
Cayambe Volcano is an ice-capped, 5,790 m high, andesitic-dacitic volcanic complex, located on the equator in the Eastern Cordillera of the Ecuadorian Andes. An eruption at Cayambe would pose considerable hazards to surrounding communities and a nationally significant agricultural industry. Although the only historically documented eruption was in 1785, it remains persistently restless and long-period (LP) seismicity has been consistently observed at the volcano for over 10 years. However, the sparse monitoring network, and complex interactions between the magmatic, hydrothermal, glacial, and tectonic systems, make unrest at Cayambe challenging to interpret. In June 2016 a seismic “crisis” began at Cayambe, as rates of high frequency volcano-tectonic (VT) earthquakes increased to hundreds of events per day, leading to speculation about the possibility of a forthcoming eruption. The crisis began 2 months after the Mw7.8 Pedernales earthquake, which occurred on the coast, 200 km from Cayambe. Here we show that the 2016 seismicity at Cayambe resulted from four distinct source processes. Cross correlation, template matching, and spectral analysis isolate two source regions for VT earthquakes–tectonic events from a regional fault system and more varied VTs from beneath the volcanic cone. The temporal evolution of the LP seismicity, and mean Q value of 9.9, indicate that these events are most likely generated by flow of hydrothermal fluids. These observations are consistent with a model where a new pulse of magma ascent initially stresses regional tectonic faults, and subsequently drives elevated VT seismicity in the edifice. We draw comparisons from models of volcano-tectonic interactions, and speculate that static stress changes from the Pedernales earthquake put Cayambe volcano in an area of dilation, providing a mechanism for magma ascent. Our findings provide a better understanding of “background” seismicity at Cayambe allowing faster characterization of future crises, and a benchmark to measure changes driven by rapid glacial retreat.
1 Introduction
1.1 Motivation
Seismic records at active volcanoes can be a rich and informative dataset for monitoring and understanding internal processes. The characteristics of a seismic signal can be indicative of the source process that generated it (Zobin, 2012; Chouet and Matoza, 2013; McNutt and Roman, 2015). If recorded across multiple stations then the locations of the earthquakes can be used to infer the source mechanism (Woods et al., 2018; Lehr et al., 2019). The rates at which earthquakes occur can also indicate whether a source mechanism is constant and stable or evolving. Accelerating sequences of earthquakes have been linked to material failure and can be significant in forecasting eruption (Voight, 1988; Boué et al., 2015; Bell et al., 2018). Whilst very long term, constant and sometimes periodic earthquake rates may suggest a stable or resonating process (Park et al., 2019). The emergence of new swarm seismicity including spasmodic bursts may suggest a change in the stress regime, and may be associated with fluid migration, or rock fracturing (Hill et al., 2002a; Hotovec-Ellis et al., 2018). Understanding and characterizing different types of volcano-seismic events allows us to attribute them to specific processes, and can be particularly important in hazard assessment and forecasting. This is particularly the case at volcanoes which have been dormant. When there is not an extensive historical record of seismicity at a volcano, recognising patterns may help to identify signs of “re-awakening” (White and McCausland, 2019).
Interpreting patterns of seismicity in terms of volcanic processes and evolving unrest can be challenging. Earthquakes in volcanic regions can originate from a number of different sources, and may be independent from processes that may drive new eruptive activity. Active fault systems, hydrothermal systems and permanent glacial cover can add another element of complexity to geophysical monitoring at volcanoes (Jónsdóttir et al., 2007; Cusano et al., 2008). Particularly within the tropics, small, high altitude glaciers can respond to small changes in climate on short timescales, and may be susceptible to significant impacts from El Niño and La Niña years (Ceballos et al., 2006; Basantes-Serrano et al., 2016). Whilst it is known that equatorial glacier retreat has been ongoing for 150 years, this has accelerated in the last 30 years and should be closely monitored at active volcanoes (Manciati et al., 2014). Glaciers on a volcano can act as a constant supply of fluid to alter and weaken the ediface (Carrasco-Núñez et al., 1993) and so increasing retreat may lead to an acceleration of these processes. In the event of a volcanic eruption, glacier melt waters can contribute to disastrous debris flows, such as those seen at Nevado del Ruiz in 1985 (Huggel et al., 2007) and Nevado del Huila in 2007 (Worni et al., 2012). Several large non-cohesive lahars involving glacial melt, have been mapped in the valleys surrounding Mt Rainier, where runouts extend over 100 km (Hoblitt et al., 1998).
1.2 Cayambe Volcano
This study focuses on Cayambe Volcano, in the north of the Eastern Cordillera of the Ecuadorian Andes, just 60 km north of the capital Quito. The complex is a notably large volcanic centre, with a peak elevation of 5,790 m. Above 4,800 m the volcano is covered in a 22 km2 ice cap, which in places is as thick as 100 m (Guillier and Chatelain, 2006; Detienne et al., 2017). Tephrochronology studies have revealed previous explosive activity in the last 4,000 years, including pyroclastic flows, lava dome extrusions and collapse events (Samaniego et al., 1998). Hydrothermal alteration of flank deposits and thawing soils from glacial retreat act to destabilise the western slopes of Cayambe. Small perturbations in the system, for example, from a magmatic intrusion or seismic event, could lead to catastrophic failure and significant landslides (Hoblitt et al., 1998; Detienne et al., 2017). This would pose a threat to the town of Cayambe, population 20,000, that sits just 15 km west of the volcano (Samaniego et al., 1998). Mass debris flows and lahars descending the eastern flanks of Cayambe could also easily damage the Trans-Ecuadorian oil pipeline and major highways to the oilfields in northeastern Ecuador (Schuster et al., 1996). Whilst there has only been one historically documented eruption at Cayambe (1785–1786), it has been persistently restless in the last 20 years and mountaineers regularly report sulphur smells from the upper flanks. The 1785 eruption is thought to have been a Vulcanian type eruption ∼VEI 1–2 (Global Volcanism Program, 2013; Bernard and Samaniego, 2017), similar to the Cotopaxi eruption of 2015 (Bernard et al., 2016) and those seen at Tungurahua in 2014 (Hall et al., 2015).
Activity at Cayambe is monitored by the Instituto Geofísico de la Escuela Politécnica Nacional (IGEPN), the national geophysical monitoring agency of Ecuador. In 2016, IGEPN detected a seismic crisis at Cayambe. Swarms of high-frequency volcano-tectonic (VT) events in June and September were recorded by three seismometers on the flanks of Cayambe volcano. These swarms involved daily earthquake rates significantly above previously recorded baseline seismicity. These swarms included two events of magnitude 3.3 and 3.7 during November, the largest two VT events of the year at Cayambe (Global Volcanism Program, 2013; IGEPN, 2016), and raised speculation about the possibility of an imminent eruption. In this study we characterize the seismicity during 2016 at Cayambe and try and to quantify the differences between the events of the seismic crisis and typical baseline seismicity in the preceding years. Subtle changes in the character of the waveforms can be indicative of a changing source or path process. Previously, detailed retrospective studies of temporal and spatial patterns in seismicity, have revealed key characteristics in eruption styles at comparable andesitic volcanoes, including Volcán de Colima (Zobin et al., 2015), Redoubt Volcano (Buurman et al., 2013) and Soufrière Hills Volcano (Neuberg et al., 2006).
Also of note, on April 16, 2016, 2 months before the onset of seismic unrest at Cayambe, the Mw7.8 Pedernales thrust earthquake struck the coast of Ecuador, 200 km from Cayambe (Heidarzadeh et al., 2017; Nocquet et al., 2017; Yoshimoto et al., 2017). This event caused MMI intensity III to IV ground shaking around Cayambe, and was followed by seven Mw > 6.0 events in the following 3 months (USGS, 2021). Tectonic earthquakes can generate both permanent static changes and temporary dynamic changes in the stress field (Manga and Brodsky, 2006). Static changes are a direct result of slip on the earthquake fault and crustal deformation and are more prevalent closer to the earthquake epicentre. Whilst dynamic stress field changes are related to passing teleseismic surface waves and can effect distances much further from the earthquake (Prejean et al., 2004). Stress changes from tectonic events are known to be able to trigger both eruptive activity and seismic activity at volcanoes (Hill and Prejean, 2015). However, distinguishing between causation and correlation is complex, particularly if there are limited records of historical earthquakes or eruptions (Prejean and Hill, 2018). Here we investigate the relationship between the Pedernales earthquake in April 2016 and unrest at Cayambe that commenced in June 2016.
The permanent ice cap on Cayambe presents a further potential complication for hazard assessments from seismic records. Studies further south in the Chilean Andes have shown icequakes to be much more common than previously thought (Lamb et al., 2020). These can be generated by basal slip on the glacier, slip at fractures within the glacier or the resonance of fluids within glacier cracks. Icequakes observed at Cotopaxi volcano, Ecuador and Katla volcano, Iceland, show waveforms that look very similar to long period (LP) earthquakes (Métaxian, 2003; Jónsdóttir et al., 2009). We refer to LP events as low frequency emergent signals, often associated with fluid movement, including magma emplacement and hydrothermal systems (Varley N. R. et al., 2010; Woods et al., 2018). Therefore being able to clearly distinguish between the two phenomena is key to reducing uncertainty in hazard assessment. This is particularly the case when we cannot confidently constrain depths and locations to separate sources.
Here we introduce the seismic data records during the 2016 crisis. We then describe the template matching process used to expand the catalogue of picked events. We detail the different methods used to quantify sequences of significant events throughout the year. We then present an interpretation of the seismic swarms that occurred during 2016. Our results identify a stable source of long period seismicity, likely associated with a shallow hydrothermal system. We also demonstrate the two VT swarms to be separate populations, from both local tectonic and volcanic sources. We draw comparisons between the seismic observations and models of re-awakening volcanoes, and speculate the significance of the Pedernales event prior to activity at Cayambe in 2016. Finally we discuss the wider implications of a seismic crisis like this for hazard assessment in the future.
2 Data and Methods
2.1 Monitoring Data
The volcanic complex at Cayambe is defined by three cones, and bound by a significant regional fault to the north east, the “La Sofía-Río Chingual” fault. Old Cayambe is a basic-andesitic stratovolcano that is more than 250,000 years old. It has mostly been eroded and the more recent Nevado Cayambe, a composite cone has been built in its place, and over the eastern flanks (Samaniego et al., 1998). There has been a permanent geophysical monitoring network on Cayambe volcano since 1988, maintained by IGEPN (Guillier and Chatelain, 2006). Initially a single station on the northern flank, the network is now comprised of three stations, with telemetry to IGEPN in Quito. The seismic network includes one, three-component broadband seismometer (Trillium Compact 120), CAYA, and two short period seismometers (L4C), CAYR and ANGU, each sampling at 100 Hz (Figure 1). There was also a short temporary deployment of seismometers between 1997 and 1998 (Guillier et al., 1999; Guillier and Chatelain, 2006). Station CAYA is positioned between the Nevado Cayambe cone and the La Sofía-Río Chingual fault, whilst ANGU and CAYR are positioned close to the edge of the glacier line on the western flanks. For this study, we have access to 366 days of data from station CAYA in 2016, and data from January 2015 through to December 2017 at station CAYR to specifically examine the LP seismicity. Waveform data from station ANGU are unavailable during July-September 2016 and the station was upgraded from a short-period to a broadband instrument in December 2016. As such we are only able to use data from January to November in 2016.
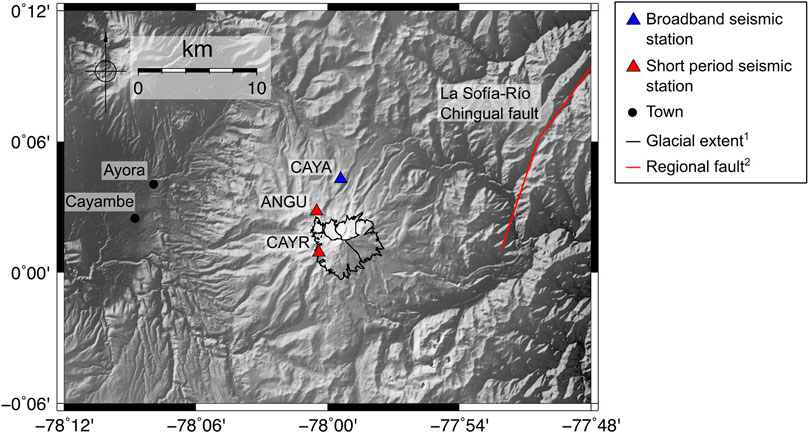
FIGURE 1. Permanent geophysical monitoring network installed on Cayambe Volcanic Complex. 1Glacier extent from GLIMS Database (Cogley et al., 2015), 2Regional fault data from Active Tectonics of the Andes (ATA) (Veloza et al., 2012)
2.2 Signal Processing
Seismic data are analysed and processed using the ObsPy toolkit (Krischer et al., 2015). Our initial analysis uses a catalogue of manually picked and categorized events, provided by IGEPN. Events in the catalogue are labeled broadly as either LP, VT, hybrid (HYB) or tectonic (TECT) events. We remove tectonic events, and cross reference the Cayambe catalogues, with catalogue data for nearby Reventador volcano and a tectonic events catalogue to ensure there are no falsely identified events. We filter the data between 1 and 40 Hz. After earthquakes are identified, we create a 30 s event waveform for analysis, slicing 5 s before the pick time and 25 s afterward. Station CAYR lies much closer to the summit of Nevado Cayambe (∼2.5 km) and exhibits a much higher signal to noise ratio (SNR). As a result, over 80% of picked events in the catalogue are identified at CAYR (Figure 2). The IGEPN catalogue also includes some located VT events. These are used to map and interpret some of the significant swarms in 2016.
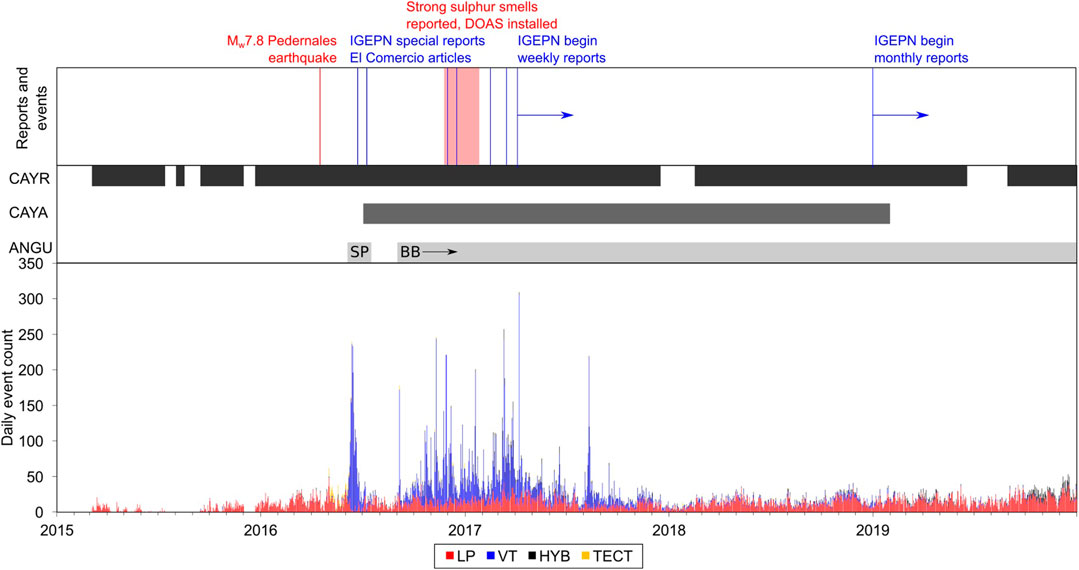
FIGURE 2. Summary of seismicity at Cayambe, 2015–2019. Top panel identifies key milestones in the monitoring, including reports from IGEPN and El Comercio (national Ecuadorian newspaper). The middle panel indicates when the three stations were active. SP, short period; BB, broadband. Bottom panel shows daily seismic event counts.
First, using catalogue picks at station CAYR, we run a cross correlation analysis. Each event is cross correlated with every other event, generating a cross correlation coefficient (XCC) between 0 and 1 as well as and the shift, in seconds, required to align the two picks at the maximum coefficient. The coefficient can be considered a measure of similarity (Petersen, 2007; Waite et al., 2008; Thelen et al., 2011). We set a minimum coefficient threshold of 0.7 to group events into families (Bell et al., 2017; Park et al., 2019; Butcher et al., 2020). The event with the most coefficients greater than the threshold is selected as the master event of the first family and every event with a coefficient greater than the threshold is included in the family. This is repeated until the families are too small to be considered significant. We set a minimum requirement of 20 events to be considered a family. The master event from each family is then used in a template matching method to extend the catalogue (Gibbons et al., 2007; Park et al., 2019). The master event is cross correlated with the signal for each whole day, and when a cross correlation threshold is exceeded, an event is picked. We then consider patterns within and across the families identified from the cross correlation analysis. The master event of each family is cross correlated with every other master to determine which families might be closely related. Every event in a family is shifted in time to align with the point of maximum cross correlation and stacked. These stacked events are then also cross correlated.
For each event, we determine the Q factor of the signal. The Q factor has been used in volcano-seismology studies to quantify and group event types (Molina et al., 2004; Lokmer et al., 2008). Q describes how quickly energy in a signal is attenuated, either as a result of a source or path process, and can be used as a metric to identify patterns of change in series of earthquakes (Rossing and Fletcher, 2004). Q and the interpreted attenuation is often empirically related to resonance in a fluid filled crack model (Kumagai and Chouet, 1999; Lipovsky and Dunham, 2015). This value can be calculated by a number of different methods and reported values for Q vary between 100 and 103 (Molina et al., 2004; Lipovsky and Dunham, 2015). This range is validated by a series of synthetic tests for fluid-filled cracks where the fluid compositions are varied (Kumagai and Chouet, 2000). In any one study, however, only one method is used to calculate the Q value for an event. These broad ranges in Q values can in turn lead to very different interpretations of the seismic event sequences. We apply three different approaches to calculate Q for each event and compare the output. We will use these Q values as a tool to distinguish earthquake events associated with different processes.
The decay method is used in a comparative study across Mt Etna, Colima and Campi Flegrei volcanoes (Elmore and Heald, 1985; Del Pezzo et al., 2013). The method relies on decay time, τ, defined as the time taken for the squared amplitude of the waveform to decay to less than
We also apply the bandwidth method, which is closely related to the decay method. It relies on identifying the bandwidth of the spectral peak frequency,
Finally, we apply an auto-regressive moving average (ARMA) methodology to determine QARMA, as described in Lesage (2009). The ARMA approach assumes a signal is a superposition of many individual harmonic decaying oscillations, each defined by their own frequency, (f, Hz) and decay rate (g, s−1). We consider all AR filters from 2 to 50 and plot cumulative f-g diagrams (Lesage, 2008). The method is automated to identify points in the complex frequency space that cluster at a pole around the spectral peak (Butcher et al., 2020). This method is closely related to the Sompi method which uses eigen-decomposition to identify poles and calculate QARMA (Hori et al., 1989; Kumazawa et al., 1990) (Eq. 3).
For each event, we also identify the peak spectral frequency from the periodogram of the signal, and the maximum absolute amplitude of every event. On single station records, we can then consider maximum amplitude as a proxy for magnitude and gather information about amplitude ratios between stations.
In order to identify clustered swarms of events, and locate any episodes of periodic activity we calculate the inter-event times (IETs) and periodicity (Bell et al., 2017). This is done for the whole catalogue initially and then within families and by event type. The periodicity is the ratio between the mean and standard deviation of the inter-event times. This is a useful tool to identify swarms and periodic episodes as it assumes events are randomly distributed and so have a ratio and periodicity equal to one. Clusters and swarms will have a periodicity much lower than one and periodic episodes of drumbeat-like, repeating seismicity will have periodicities much greater than one.
3 Results
3.1 Located Events
Due to the sparse monitoring network on Cayambe, only 179 of the 11,990 VT events in the IGEPN catalogue are located, and even then with significant uncertainties. Despite this, the locations identify at least two distinct VT clusters throughout the year (Figure 3). Manual inspection of the records show the events group broadly in four very distinct time intervals, with little overlap: June, July, September and November-December. We use these locations to aid our interpretations from the individual event analysis. The June events are widely spread over the north and eastern flanks, whilst the November events are much more concentrated near upper reaches of the Nevado Cayambe cone. The network geometry is such that the shallowest events are best captured by short period station CAYR on the highest flanks of the Nevado Cayambe, and is the most reliable station in the network.
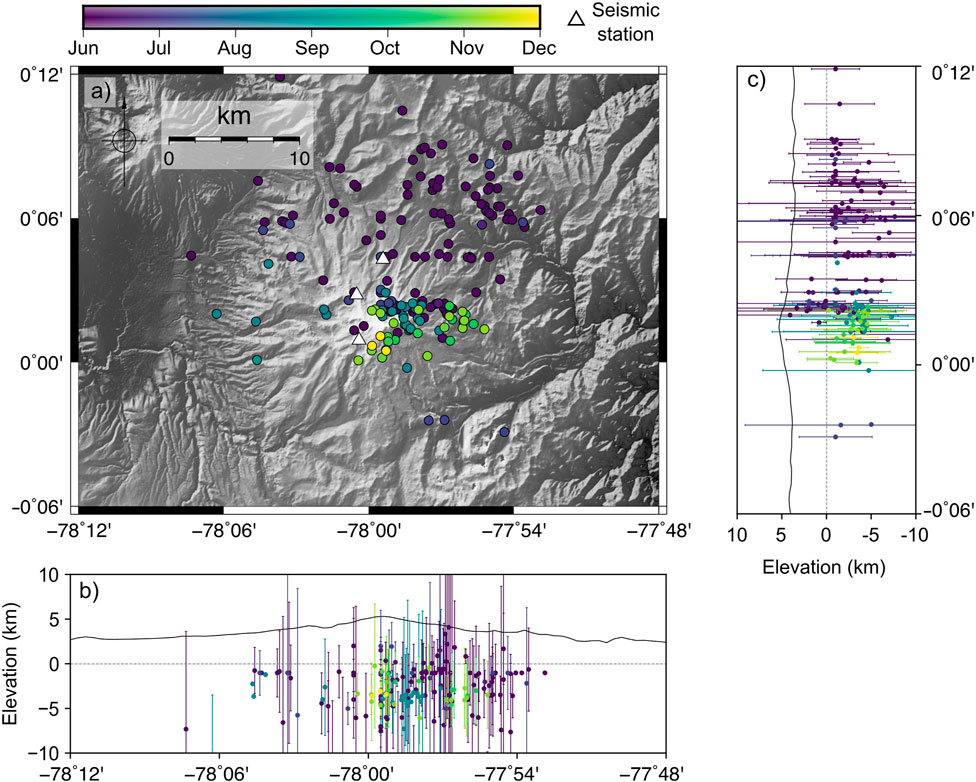
FIGURE 3. Located VT events in the IGEPN catalogue during 2016 showing (A) locations and (B, C) depth uncertainties.
3.2 Catalogue Overview
From the total 11,990 events in the catalogue in 2016, 9,848 events are recorded at station CAYR, of which 46% are labeled as LPs, 48% as VTs, and the remaining 6% as hybrids (HYB) and tectonic events (TECT). This is in stark contrast to 2015 where 98% of events recorded were labeled as LP, although there are significant data gaps. The cross correlation analysis generated 31 unique families of greater than 20 events (Figure 4). Despite the catalogue containing almost an equal split of LP and VT events, only 84 LP events were grouped in two families representing more long term, background LP seismicity spanning the whole year. The remaining 29 families represent 1,545 VTs–seven of which highlight a short VT swarm in June and 21 families span more long term VT seismicity from September to December.

FIGURE 4. Families extracted from cross correlation analysis of the initial 9,484 catalogue picks at CAYR. Individual events colored by their label, red shows LPs, blue shows VTs. Families numbered in order of size largest to smallest.
We use the master events from the 31 families to conduct template matching and identify any events not originally picked in the IGEPN catalogue. An additional 3,853 events are identified by this template matching method, extending the catalogue to 13,683 events in 2016. In particular the template matching identifies 364 new LP events–more than four times as many LPs that were in the original two LP families. The template matching identifies a further 1378 VT events in the June swarm and 2111 VT type events from September to December 2016. The template matching expanded the reach of some VT swarm families but no single family contains events in both June and November, showing a strong distinction between the source processes in each case. We also use the located VT events in the catalogue to verify the master events of the families. The located events in June and July correspond well with families 0, 6, 9, 10, and 23 (Supplementary Figure S1A). Whilst the master event of family 20 shows an XCC > 0.85 and is just 20 min prior to a located VT event (Supplementary Figure S1C). This suggests family 20 represents an isolated repeating source mechanism between the two large swarms in June and November.
Figure 5 shows seismic event characteristics through 2016. All event types have a near exponential distribution of inter-event times (t) (Bell et al., 2017). The periodicity is calculated in fixed windows of 15 events, and so during swarm activity in June and December there are isolated incidents where seismicity is either clustered (periodicity <1) or cyclical (periodicity >1), but at generally low levels.
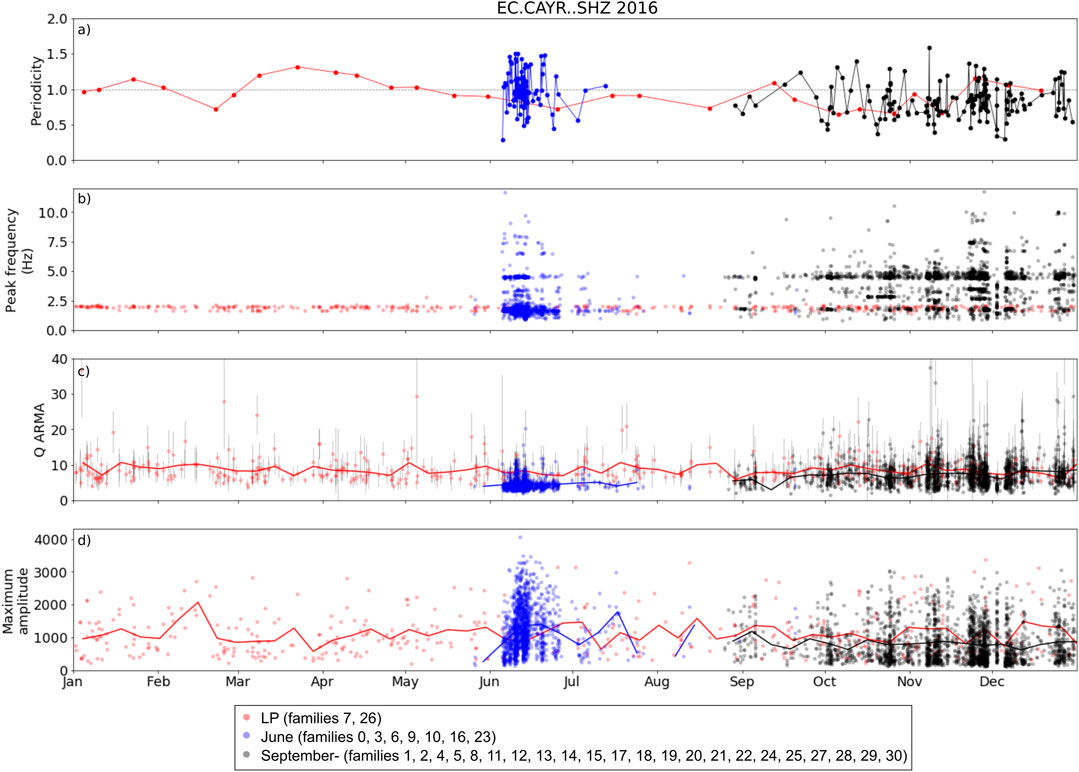
FIGURE 5. Individual event analysis from all catalogue and template matched events on station CAYR that were successfully grouped into families. Red shows year long LP events from families 7 and 26. Blue shows VT swarm events in June from families 0, 3, 6, 9, 10, 16, and 23. Black shows all other VT swarm families from September onwards. Moving averages are calculated for windows of 7 days. (A) Periodicity calculated in fixed bins of 15 events, (B) Peak spectral frequency (Hz), (C) QARMA, (D) Absolute maximum amplitude.
In general the LP events show a consistent peak frequency at 2.1 Hz. As expected this is lower than the VT events, but particularly in October-December when the VT events have a consistent peak frequency at 5 Hz. The June swarm VT events have uncharacteristically low spectral peak frequencies, less than 2 Hz and less than the background LPs. Thorough inspection of the June events show that they have typical spectral contents expected for VTs, between 1.0 and 15.0 Hz. This highlights how using a single peak frequency value as a defining characteristic can be misleading.
The Q values by all three methods return values across multiple orders of magnitude. A comparison for all three methods on the same family is shown in Figure 6. The QARMA values are calculated by an automated clustering algorithm and so the standard error from the clustered poles is used to plot the error bars in Figures 5E, 6F,L. This output from the three separate methods can lead to spurious interpretations and conclusions.
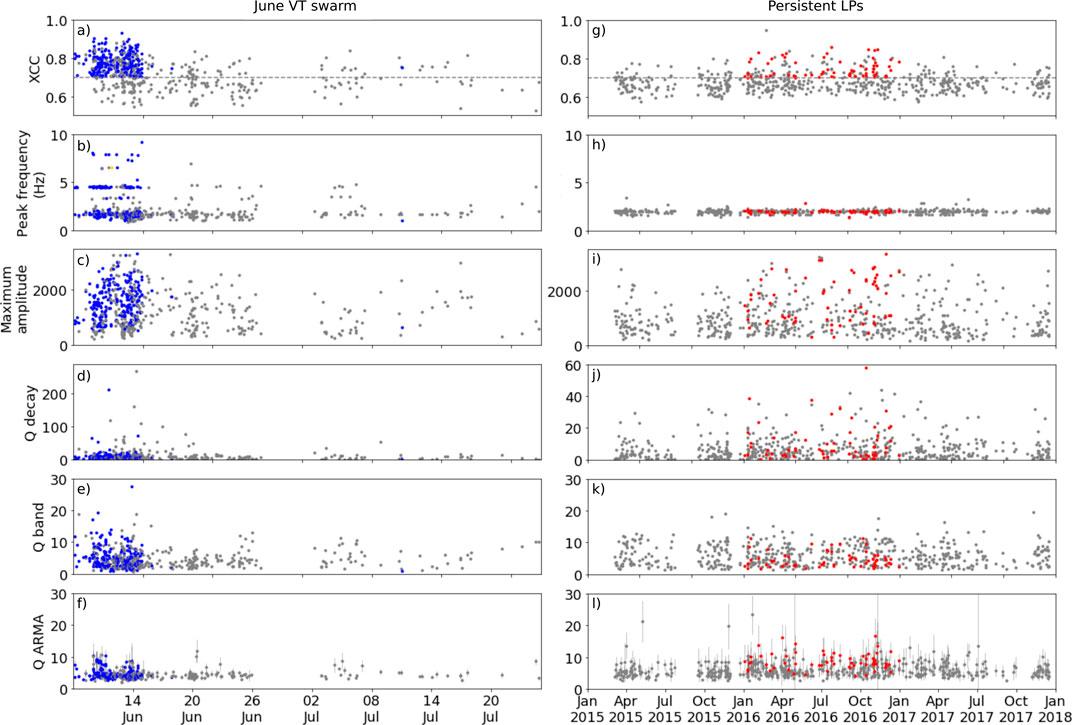
FIGURE 6. Panels (A–F) show individual event analysis for family 0 and panels Panels g) to l) show the results for family 7. Blue markers show VTs, red markers show LPs and gray indicate new unclassified events found by template matching. (A,G) cross correlation coefficient with master event, (B,H) peak spectral frequency, (C,I) maximum amplitude, (D,J) Qdecay, (E,K)) Qband, (F,L) QARMA method.
3.3 Persistent LP Seismicity
The catalogue shows a consistent level of baseline LP seismicity in 2015–2017. In 2016, LPs make up 46% of identified events at CAYR. However, from the cross correlation and family analysis, only two LP families emerge (families 7 and 26, Figure 4). The template matching expands the catalogue of LP picks (Figures 6G–L), an additional 209 events are added to the 64 catalogue events, taking family 7 to 273 events. The XCC values show how each of the LPs are remarkably similar to one another, likely hinged on the dominant monochromatic peak frequency at 2.1 Hz. The family persists across the whole year without any significant interruption, for example during swarm VT activity. The dominant feature of the signal is the single frequency onset at 2.1 Hz. Both the peak frequency and spectrogram (Figures 7B,C) illustrate the uniform spectral signature. Family 7 and 26 are also very similar and likely from the same source.
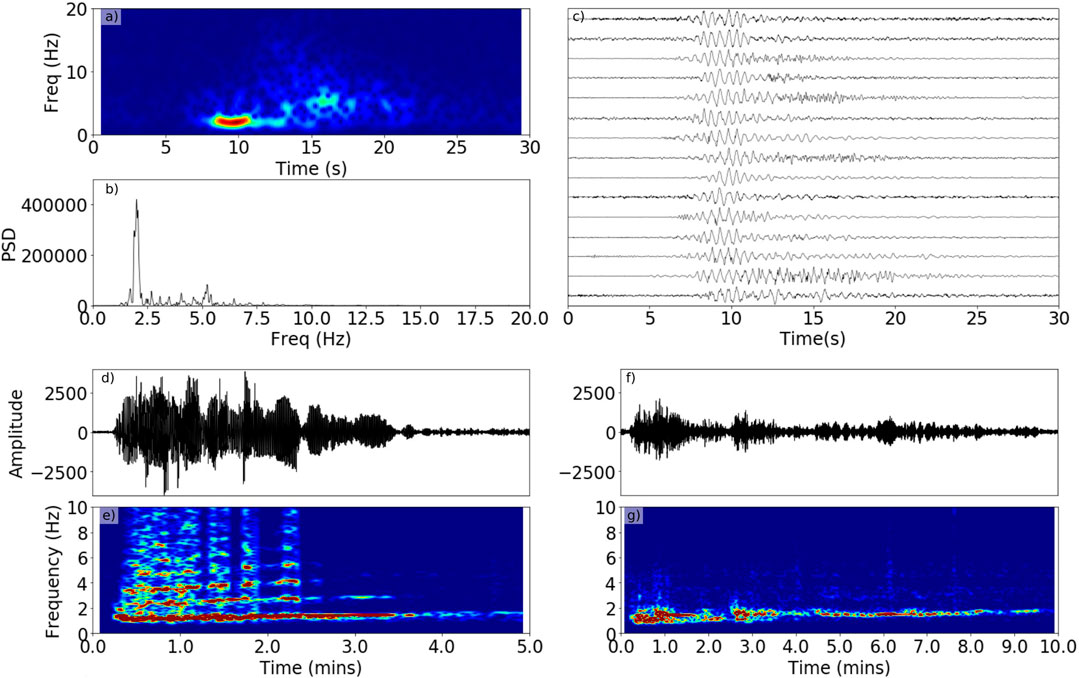
FIGURE 7. Long period seismicity identified at Cayambe. Panels (A–C) show LP seismicity from family 7: (A) spectrogram, (B) power spectral density (PSD), (C) sample of 15 characteristic events. Panels (D–G) show a sample of the harmonic events identified: (D) spectrogram and (E) PSD for an event with integer harmonics and (F) spectrogram and (G) PSD for a long harmonic sequence.
Unlike some of the higher frequency events, these LP events are poorly recorded on stations ANGU and CAYA. In particular the high frequency response from ANGU impedes how well the LP waveform and spectra is recorded (Figure 8C). Given the sensitivity of the cross correlation method, we expand the template matching search for LPs into 2015 and 2017 but only with station CAYR. Even beyond 2016, metrics such as the spectral peak frequency and QARMA show very little variation. The temporal analysis shows these LP families have a periodicity average at 1.1, suggesting an exponential inter-event time (t). Short episodes of clustered or cyclical seismicity are generally artifacts as a result of the chosen window length. The event rate is low compared to VT swarm event counts, just 1–2 events per day.
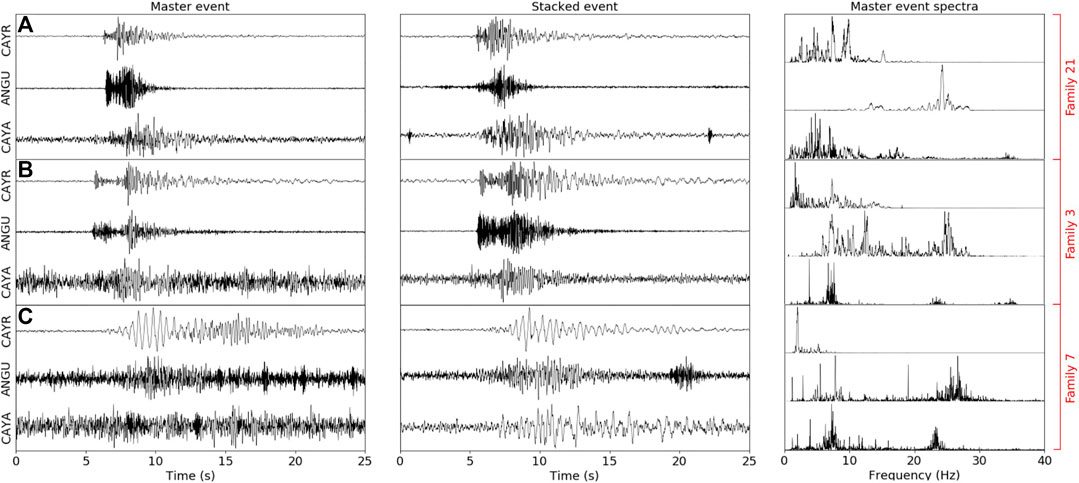
FIGURE 8. Event records across the network. Subplots (A–C) families 21, 3, and 7 are shown at stations CAYR, ANGU and CAYA. The master event as located at CAYR is shown on the other two stations and stacked events are calculated from picks within the respective families.
In addition to the repeating LP seismicity classified by cross correlation, some less consistent low-frequency events were identified in the data. These events are much longer (1–5 min in length) and have highly harmonic frequencies (Figures 7D–G). Due to the varying lengths of these events, they are not classified into families successfully. They are identified throughout the year, although more are located in October and November. Single frequency events with long coda and distinct Hilbert transform envelopes are often referred to as tornillos (Narváez et al., 1997; Fazio et al., 2019). Some of the identified events match this description; however, many show interesting characteristics such strong integer harmonics (Figures 7D,E). Sequences of these tornillo-type events can appear to merge and generate long episodes, which may be considered harmonic tremor (Figures 7F,G). Particularly in Figures 7E,G, when fundamental peak frequency increases through time, this may be an example of a short burst of gliding tremor (Almendros et al., 2014).
3.4 June 2016 Distal Swarm
The cross correlation analysis picks out seven distinct families in June 2016. The largest family found contains 229 events, all occurring between 8th and 17th June (Figures 6A–F). However, applying the template matching method identifies an additional 346 events and extends the duration of the family to 26th July. This family is characterized by short (<15 s), high frequency, VT events. They have a distinct signal envelope, clearly showing P- and S- phase arrivals. Three spectral bands emerge around 1.6, 4.5, and 7.9 Hz and are the peak frequency in 44% of events in the seven families which represent seismicity in June (Figures 6B, 9). When the master and stacked events of each family in the June swarm are cross correlated with one another, they show high correlation values (Figure 10A), suggesting a highly repeatable source and path. QARMA shows very small errors compared to some other swarms and families (Figures 6L, 10). The June swarm events are clear on both CAYR and ANGU, although ANGU shows a particularly high frequency response. These events are harder to see at CAYA but, when stacked, do show an improved signal to noise ratio (Figure 8B).
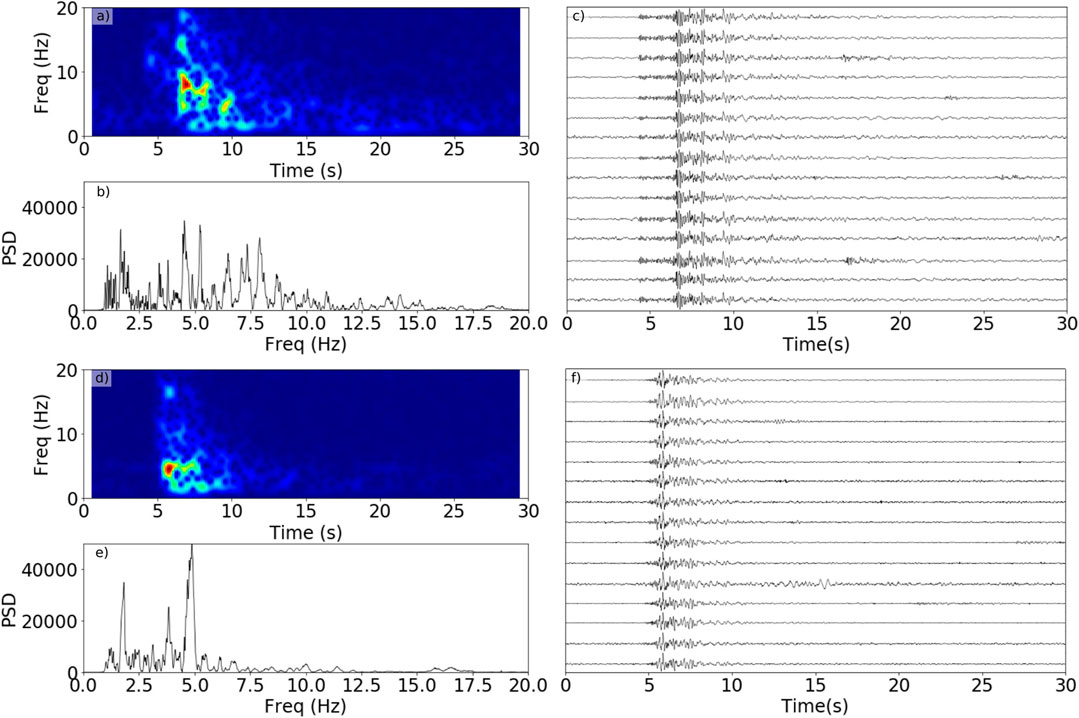
FIGURE 9. VT seismicity identified at Cayambe. Panels (A–C) show VT seismicity from family 0, June 2016: (A) spectrogram, (B) power spectral density (PSD), (C) sample of 15 characteristic events. Panels (D–F) show VT seismicity from family 5, September 2016: (D) spectrogram, (E) power spectral density (PSD), (F) sample of 15 characteristic events.
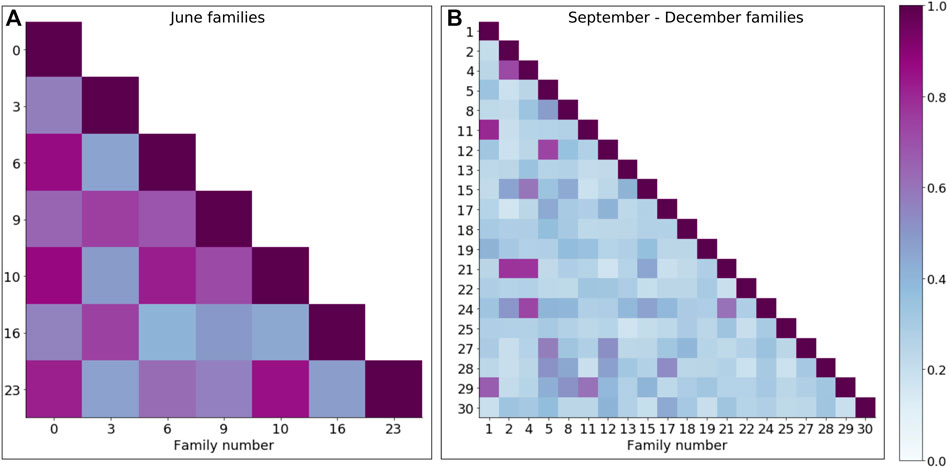
FIGURE 10. Cross correlation matrix of the stacked events for families during (A) June and (B) September-December 2016.
3.5 September 2016- Proximal Swarms
From September onwards, the families extracted from the cross correlation method persist longer than those in June. Some VT swarm families even contain a small number of events identified as LPs by the IGEPN, although in any family these amount to no more than 8% of the total events. These LP events were manually checked and verified to ensure the labeling is correct. These families represent VT events which are more LP-like in their signal properties. They have a more emergent onset, and less distinct P- and S- phase arrivals but a high peak frequency and more broadband spectra (Figure 9). Some families correspond to events which occur exclusively within a single day, whereas others represent more long term recurring events over several months (Figure 4). Unlike the June families in which the families were all very cohesive and self similar with high cross correlation values, the November swarms show very little similarity to one another (Figure 10B). The QARMA values show the events from September onwards have a typically higher QARMA value and peak frequency, than those in the June swarms (Figures 6, 11).
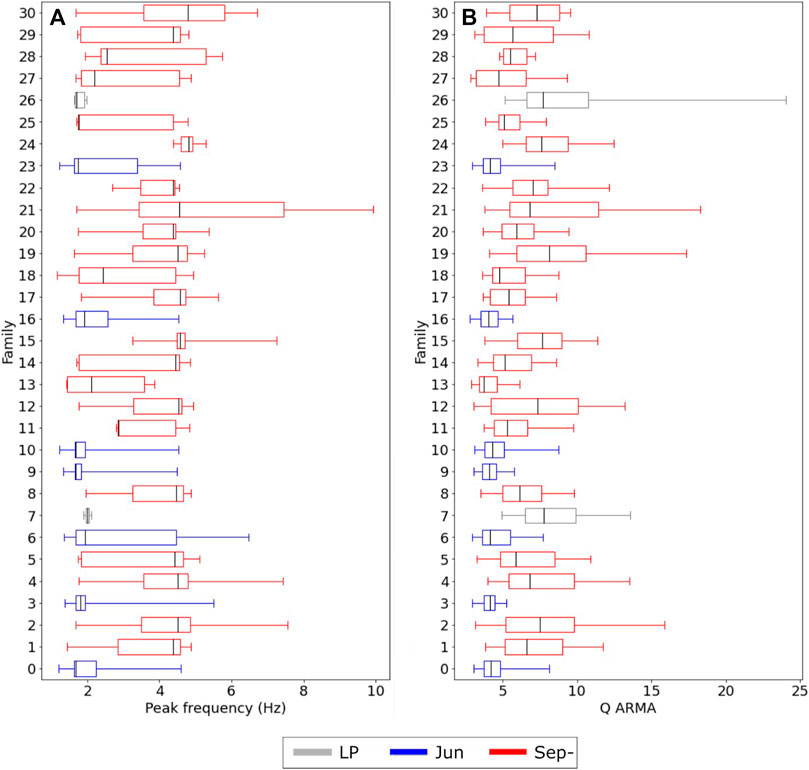
FIGURE 11. Distributions of (A) peak frequency and (B) QARMA in each family. Solid black line shows the mean, box length shows the inter-quartile range and whiskers show 5th and 95th percentile values. Blue indicates families representing the June swarm, red shows families from September onwards and gray shows the two LP swarms.
Two significant located VTs occurred during November–a M3.3 event at 13:32 on 14th November, and a M3.6 event at 22:30 on 27th November. These are the two largest VT events at Cayambe during 2016. We manually pick events immediately before and after each of these M > 3 events to be sure we have an accurate picture of all seismicity which may be associated. We carefully model the rates of events following the M3.6 and M3.3 events; however, there is not a clear mainshock-aftershock pattern that can be modeled by a power (Modified Omori) or exponential relationship (Utsu et al., 1995; Bell et al., 2018). Family 1 groups a number of events around 14th November. However, it is unlikely that Family 1 exclusively represents this slip event as Family 1 spans October to December, indicative of a longer term process. For the slightly larger event on 27th November, however, there was more of a significant visible response in the seismic record. From the cross correlation of events at CAYR, there are a handful of families, which cluster events specifically on the days around 27th November (families 2, 22, and 25), suggesting these are generated by a repeating, similar source. We manually pick events at CAYR between 22:00 27th November and 02:00 28th November. In the hour immediately after the M3.6 event, there are 118 short high-frequency VT type events. Rather than aftershocks, these may be small repeating events from the same source as the M3.6 event. There are similar instances of isolated days, particularly in December, where recurring VTs from the same family show periodicity >1.5.
3.6 Mw7.8 Pedernales Earthquake
The Mw7.8 Pedernales thrust earthquake occurred at 23:58:37 UTC approximately 200 km west of Cayambe, on April 16, 2016. The high amplitude surface wave arrivals can be clearly seen on all three stations after 00:00:00 on April 17, 2016. Within the surface wave arrivals at ANGU, a series of high frequency spikes can be seen in the spectra between 20 and 30 Hz (Supplementary Figure S2). We manually pick these high frequency spikes within the 5 min after 23:58:37UTC. However, station ANGU appears to have a defect and records recurring high frequency response between 20 and 30 Hz even during events known to be predominantly low frequency (Figure 9C). As these events cannot be identified at stations CAYA or CAYR, we rule out any possibility that they are dynamically triggered events.
As well as looking within the surface wave arrivals, we look for changes in average seismicity rate in the 24 h following the Pedernales event, for larger scale changes. We manually picked events as the catalogue only contained five event pick times, but visual observations of the file showed there were likely more. We picked at station CAYR, as this had the best signal to noise ratio. Overall there is a decreasing rate of seismicity through the 24 h period following the earthquake, from 30 events per hour, to less than 15.
4 Discussion
4.1 The Meaning of Q
The Q values returned by all three methods span two orders of magnitude, which raises questions about the suitability of each approach. All methods were developed and tested for the purpose of low frequency seismicity, and specifically LP events generated by a resonating fluid filled crack (Kumagai and Chouet, 1999; Kumagai and Chouet, 2000). These methods are hinged on the spectral peak frequency of a monochromatic or harmonic signal (Lipovsky and Dunham, 2015). As such, the results of the Q analysis on broadband VT seismicity are not meaningful in a physical sense. Particularly in the case of QARMA–a metric based on a single peak frequency in a broadband VT spectra, tells us very little. However, we can use Qdecay as a quantifiable metric to describe the signal envelope. Determining a signal envelope that can be used to distinguish event types is often a subjective matter, as a certain degree of smoothing must be included. One more quantified approach is to define a relationship between the peak amplitude of a signal and a minimum “threshold” (Lees et al., 2008). The Qdecay approach determines how quickly the signal amplitude decreases to
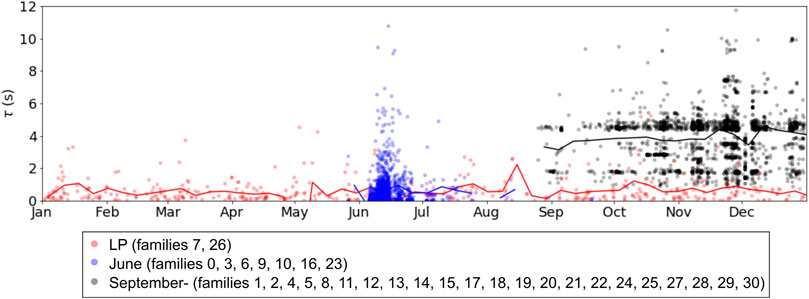
FIGURE 12. Event “durations” defined by the τ parameter in the Qdecay method. Events are separated into three broad populations identified by families: red marks persistent LP seismicity, blue marks the June VT swarm events, and black the VT swarm from September onwards.
The QARMA method is also reliant on quantifying the growth rate (g) of a singular fundamental frequency (f). However, if there are insufficient points clustered at a pole at the peak spectral frequency, a QARMA value is not calculated. This reduces the number of erroneous Q values generated for broadband VTs. With this in mind, we use QARMA as the primary Q metric for interpreting this sequence of seismicity. For the analysis of LP seismicity this brings this study in line with previous efforts to monitor changes in Q across a series of unrest (Métaxian, 2003; Molina et al., 2004). And for VT events, if a QARMA value is calculated it is a function of the most dominant frequency with a broadband signal and used for comparison purposes, but not to interpret a physical process.
4.2 Volcano-Tectonic Swarms in 2016–2017
The temporal and spectral analyses do an excellent job to help quantify the different types of seismicity observed throughout one year at Cayambe. The two swarms in June and September onwards are related to two very distinct processes. The June swarms show clear separation between P- and S- phase arrivals, and have a distinct signal envelope in comparison to other families of VT events, where the signals are more emergent. Whilst there is significant uncertainty in the depth and magnitude estimates, the locations detailed in the IGEPN catalogue all show the June swarm events to be in the northern and eastern flanks of the volcano–quite separate from those later in the year. The high XCC of events in the June swarm, but dissimilarity to the September swarms suggests they have different source mechanisms. The events in June 2016 show a very different spectral signature to those later in the year, with much lower peak frequency and QARMA values. This may be the result of both source and path effects. Unconsolidated or hydrothermally altered flank deposits can act to extend the coda of failure events (Bean et al., 2014), which for proximal VT swarms may generate an increased Q value compared to a distal VTs. The disparity may also be dependent on depth and proximity relative to station CAYR. This June swarm was more likely associated with movement from the regional fault line along “La Sofía-Río Chingual.” The Chingual fault is a major regional fault that extends 70 km from Cayambe, north through the Andes into Colombia (Ferrari and Tibaldi, 1992; Eguez et al., 2003; Alvarado et al., 2016) (Figure 1). As a named fault it is frequently cited in relation to earthquakes and volcanic systems in the region (Samaniego et al., 2005; Guillier and Chatelain, 2006; Yepes et al., 2016). Although it should be noted that the local tectonics in this region are complex and many smaller faults are not well constrained (Tibaldi et al., 1995). The last major tectonic earthquakes to occur in this region were in 1987 (M6.9 and M6.7), however several smaller thrust and right lateral strike slip events have occurred since (Kawakatsu and Cadena, 1991; Guillier and Chatelain, 2006; USGS, 2021). Unlike some of the swarm activity later in the year, these events are well recorded across all three permanent stations. Particularly at station CAYA, which lies closer to the Río Chingual and 5 km north of the Nevado Cayambe central crater.
The seismicity from September onwards, however, is more likely to originate from beneath the Nevado Cayambe central cone. The locations of the events are much closer to the central cone and to the south and west flanks. The events from the catalogue and subsequent template matching search show a more emergent signal envelope than those in June, with no clear separation between P- and S- phase arrivals. These events have higher peak frequencies overall and higher QARMA values. These VT events are quite LP-like in this respect. Whilst some families (15, 17, 22) represent events exclusive to just a few days, the majority span more than 3 months, indicative of a long term source process rather. Expansion of the template matching into 2017 shows a number of these families persist to the end of VT swarm activity in September 2017. However, unlike in June, the families are all quite dissimilar to one another suggesting there are multiple sources or the source is more heterogeneous or changing. The VT families after September 2016 are also less clear at station CAYA unless tens or hundreds of events are stacked, suggesting the origin is perhaps closer to the central cone and stations ANGU and CAYR. We believe these proximal VTs in late 2016 may be associated with progressive magma ascent and the formation of a proto-conduit (Fournier, 2007; White and McCausland, 2019). Whilst some families of events represent seismicity from a single day and perhaps correspond to a single rupture event (Supplementary Figure S1C), more long term persistent proximal VTs indicate an ongoing shallow process.
4.3 Origin of Long-Period Seismicity
The long period seismicity is informative as a baseline measure of day-to-day activity at Cayambe. Each event from both the catalogue and the template matching shows remarkable similarity throughout the year with a strong single peak frequency at 2.1 Hz and no strong additional harmonics. The LP events have typical durations between 10 and 15 s, and so cross correlation calculated in 10 s windows captures a thorough representation of the whole signal for these specific events. The LP seismicity is not well recorded on either ANGU or CAYA, and with no visible distinction between P- and S- phases, locating or magnitude estimating these events is not possible. Given these events are so well captured at only station CAYR, we suggest they are likely of a shallow source very close to CAYR within the Nevado Cayambe cone.
We consider all the possible source mechanisms for the persistent, repeating, LP seismicity in this episode of unrest at Cayambe. Low frequency, and in particular repeating low frequency seismicity have been described and modeled around the world. Minakami et al. (1951) first identified similar repeating events at Usu Volcano by manually measuring and matching peaks in the waveforms. These C-type earthquakes were attributed to a repeating source mechanism. Since these early efforts to categorise and interpret sequences of LP seismicity, a diverse range of LP seismicity has been described, and as such, there are many well established models for source mechanisms. Initial understanding of LP seismicity stemmed from studies of tremor and an idealised monochromatic or harmonic resonance process (Chouet, 1981). LP seismicity is inherently related to fluids and pressure changes and therefore their presence in the record is of interest for volcanic monitoring and forecasting. Generally, it is accepted that LPs are associated with the resonance of a fluid filled crack (Chouet, 1988). This has been extensively modeled by varying the crack media and investigate changes in the resultant waveform (Kumagai and Chouet, 2000). Further theoretical work has sought to model the initial excitation mechanism of the resonance process. For example, with the transportation of magma, flow-induced oscillations may excite a resonance mechanism (Julian, 1994). Whilst other studies have linked LP seismicity with the tensile hydraulic fracturing of rock (Bame and Fehler, 1986; Fournier, 2007; Lipovsky and Dunham, 2015). Due to network limitations at Cayambe, we cannot locate the LP events, but it is important to consider that shallow and deep LP sources may be connected in a volcanic plumbing system and triggered by pressure variations (Shapiro et al., 2017). It is important also to consider that the volcanic edifice is very heterogenous and LP seismicity may be the result of failure in unconsolidated materials rather than fluid presence (Bean et al., 2014). In this particular study we have a relatively small number of events that are captured clearly on just one station, and therefore can only make speculative suggestions around the source mechanism involved. However, if we consider the temporal patterns and rates of the repeating LP seismicity, then previous studies of LPs in volcanic systems have presented models of cyclical, periodic repeating events generated by magma emplacement and conduit processes (Petersen, 2007; Bell et al., 2018). Whereas episodes of LP seismicity from stick-slip glacial sources have shown swarm like behavior correlating with periods of snow fall (Allstadt and Malone, 2014). The LPs at Cayambe demonstrate neither of these extremes, and have an average periodicity ∼1, suggesting a constant average event rate and exponentially distributed inter-event times. The LP event rate is also low compared to observations of seismicity at similar intermediate arc volcanoes. At Tungurahua volcano, hundreds of events per hour were recorded during activity in 2015 (Bell et al., 2017) and prior to explosions at Volcán de Colima, LP seismicity rate was in the range of hundreds of events per day (Varley N. et al., 2010). However, although neighboring and compositionally similar, these are two very active volcanoes. Rates of seismicity in the order of 100–101 per day are more closely aligned with Puracé, Colombia (Arcila and Arcila, 1996) and Kawah Ijen, Indonesia (Caudron et al., 2015) which like Cayambe, have not experienced recent explosive activity. Even in a scenario where LP seismicity is believed to be caused by glacial slip as opposed to volcanic processes, at Cotopaxi volcano, events were recorded at a rate of 60 events per hour (Métaxian, 2003). In the four instances where periodic LPs from the families are detected, the average rate at Cayambe is just one event per day. The LP event distributions in frequency and magnitude are also largely unaffected by the swarms in June and September, and show no change following the Pedernales Mw7.8 earthquake.
A study on Cotopaxi Volcano, Ecuador, used Q values to establish whether LP earthquakes were glacial or volcanic in origin (Métaxian, 2003). Using ARMA methods from the signal waveforms and estimating Q from the impedance contrast of ice and water, Q values 1–3 were identified as being glacial. However, in the records at Cayambe, the LP events generate QARMA values with a mean value 9.9. We use the same procedure (Aki et al., 1977) and consider a water-andesite contact with approximate andesite bulk density and Vp values of 2,800 kg m−3 and 3,000 ms−1 respectively, where Q is approximately 9.5.
If we believe the LPs are associated with a hydrothermal system, then we may anticipate long term trends in the seismicity, and so we extend the template matching to identify LPs in 2015 and 2017 (Figures 6G–L). The rate of seismicity is unaffected by continued VT swarm activity in 2017. Key identifying metrics including QARMA, peak frequency and high XCC values suggest these are from the same source as the 2016 LPs. Studies of Glacier 15α on Antisana volcano note that it is a good analogue for other glaciers in the Eastern Cordillera in Ecuador. This is due to their position on the equator, and direct exposure to the humid winds from the Amazon basin immediately to the East (Manciati et al., 2014). Unlike volcanic glaciers closer to the tropics, that are subject to extremes in climate such as El Niño and La Niña (Ceballos et al., 2006), the equatorial glaciers do not experience extremes of seasonality in precipitation, winds or temperature (Manciati et al., 2014; Basantes-Serrano et al., 2016). As such we might expect sub-glacial hydrothermal systems to be relatively consistent all year, rather than pronounced seasons of glacial unloading and meltwater recharge (Jónsdóttir et al., 2009). If the LP seismicity is related to hydrothermal interactions beneath the glacier, it is important to understand how these react–if at all–to external volcanic or tectonic seismicity.
Very low frequency, harmonic and tornillo-type seismicity was not easily identified and sorted by cross correlation. This is likely due to the duration of the events, and inconsistent peak frequency of these signals. The cross correlation method is applied over a fixed length, 10 s window for all events. This is suitable to capture similarities in VT and LP events that are up to 30 s in length for example, but does little to define events that last several minutes. In the harmonic seismicity, we see some examples of gliding frequencies and sequences of discrete events with different peak spectral frequencies (Figures 7D–F). If a harmonic signal has only one very dominant spectral peak, this frequency can very significantly control the envelope and duration of the signal. This will limit the effectiveness of a simple, sliding window, cross correlation method, even with a very low detection threshold. As such these low frequency harmonic events should be carefully monitored, as they may be missed by automatic classification methods. Processes such as the harmonic product spectrum (HPS) (Roman, 2017) or as simple automated search for strongly peaked frequencies should be used to identify longer episodes of seismicity. Tornillo events and harmonic tremor at active volcanoes can be indicative of very shallow fluid processes and are often indicative of imminent activity (Hellweg, 2000; Hotovec et al., 2013; Arámbula-Mendoza et al., 2016). Highly monochromatic tornillo events at Galeras Volcano, Colombia, showed strong correlation between event duration and the time until eruption (Narváez et al., 1997). Whilst very long period (VLP) and LP events at Cotopaxi and Tungurahua, Ecuador were attributed to resonance of gas and ash filled cracks (Molina et al., 2004; Molina et al., 2008). These observations of tornillos are all quite different to the tornillo and harmonic seismicity documented here at Cayambe. The tornillo signals at Cotopaxi and Tungurahua were generally all very similar to one another, consistent or sequential in their dominant forcing frequency, and occurred during heightened activity or eruptions. The varied character of the harmonic seismicity at Cayambe, however, suggests this is not a stable or well established source process; without locations it is not possible to confirm whether these are from multiple sources. The first documented strong sulphurous smells near Picos Jarrín on the southwestern flanks of Cayambe, are in a Special Report on 1st December (IGEPN, 2016). However, without any quantified constraints on gas flux, we cannot be certain of the origin of this very heterogeneous harmonic seismicity. Due to the duration and pulsed like nature of some of the harmonic signals, they may also be classified as harmonic tremor (Arámbula-Mendoza et al., 2016; Bell et al., 2018). It is important to consider that anthropogenic sources such as nearby helicopters are known to generate harmonic tremor, and must be carefully identified and excluded from analysis - although this is often at much higher frequencies >10 Hz (Eibl et al., 2015).
4.4 Dynamic and Static Triggering
Large tectonic earthquakes cause stress changes in the crust, that may subsequently interact with volcanic systems. The stress change may be large and temporary (dynamic triggering) or small but permanent (static triggering) (Hill et al., 2002b; Manga and Brodsky, 2006). This relationship is complicated and causality versus coincidence is frequently debated (Lemarchand and Grasso, 2007). We use the seismicity rate as an indicator for dynamic triggering, given there is no eruption in this sequence. Following the Pedernales Mw7.8 earthquake, manually picked events at station CAYR do show a decreasing rate overall. It is significant that there is no dramatic increase in LP seismicity, as previous dynamic triggering studies have linked tectonic earthquake surface wave arrivals to instability in shallow magma storage (Lemarchand and Grasso, 2007; Walter et al., 2007; Lin, 2017). Although there are many more contributing factors, it has been shown that often shallow fluid storage does not necessarily make a volcanic system more susceptible to dynamically triggered activity (Prejean and Hill, 2018).
Given the first VT swarm begins at Cayambe just 7 weeks after the Pedernales earthquake, we speculate whether a small static stress change in the crust may have played a role in the resumption of activity. One study by Walter and Amelung (2007) presents a model for triggering of eruptions at arc volcanoes following megathrust earthquakes. Four case studies are presented from Sumatra, Kamchatka, Alaska and Chile, where a subduction earthquakes occurs within 200 km normal to a volcanic arc. Elastic numerical modeling of the volumetric strain demonstrates that each of these volcanic arcs would likely have been in a dilational area of volumetric expansion. This may in turn cause small static changes in the stress field and perhaps promote new eruptions. For example, a magma reservoir in an area of dilation can experience overpressure driven by magma mixing and exsolution of volatiles (Sparks et al., 1977). We believe the geometry of this model is paralleled at Pedernales and Cayambe. Further to this Béjar-Pizarro et al. (2018) model the stress change from the CMT focal mechanism of the Pedernales mainshock, and suggest that Cayambe lies in a region of “high level potential activation” where induced normal stress (
4.5 Re-Awakening Dormant Volcanoes
The sudden increase in seismicity at Cayambe has implications for long term forecasting, particularly given there is no record for recent eruptions. One possible model for the re-awakening of dormant stratovolcanoes presents a 4-stage process (White and McCausland, 2019). Different phases of characteristic seismicity can be attributed to each stage–from deep seismicity, to distal VT events, to vent clearing and then finally shallow repetitive seismicity ahead of an eruption. The study presents this model exemplified on volcanoes across timescales from days to years. Stage 1 including deep seismicity is associated with lower crustal magma storage. As is the case on many volcanoes, the limited three station network on Cayambe, and in turn the uncertainty in depth estimates mean it is not possible to constrain with confidence any VT seismicity between 10 and 40 km depth. However, it is possible that the variety of seismicity recorded at Cayambe in 2016 and 2017 may be indicative of some stage 2 and 3 re-awakening, described in this model.
The VT swarm during June 2016 may be considered distal seismicity and is consistent with the stressing of a regional fault system, described in stage 2 of White and McCausland (2019). We speculate that the Mw7.8 Pedernales earthquake generated a small static change in the stress field at Cayambe (Figure 13). This may have promoted a new pulse of magma to ascend (Walter and Amelung, 2007), or perhaps pressurized local aquifers and allowed slip along a pre-stressed fault (White and McCausland, 2016; Coulon et al., 2017).
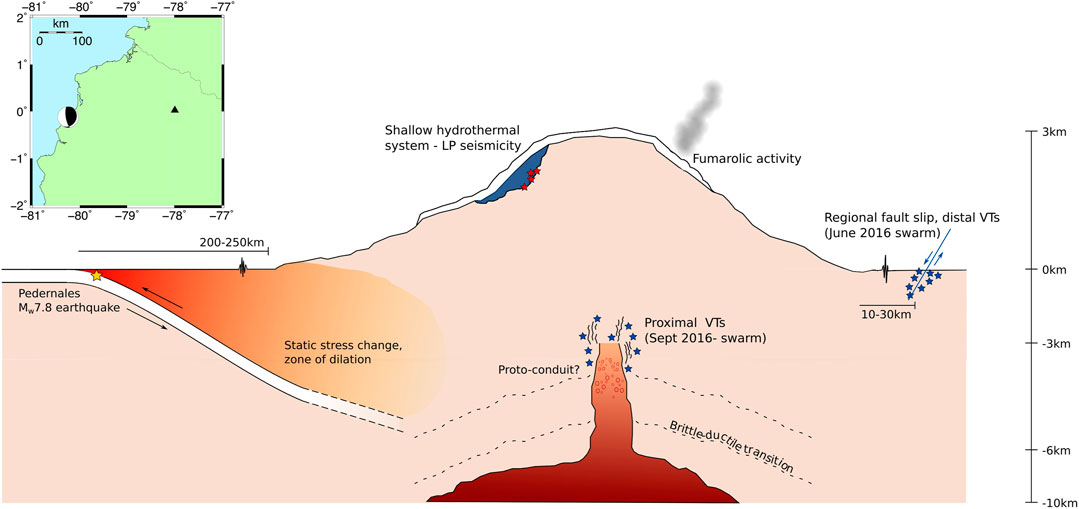
FIGURE 13. Schematic diagram of seismicity at Cayambe in 2016–2017, adapted from the crustal stress model presented in Walter and Amelung (2007). Map inset shows CMT focal mechanism for the Mw7.8 Pedernales earthquake (Dziewonski et al., 1981; Ekström et al., 2012) and relative location to Cayambe. Vertical scale on right, only an indicator of magmatic processes and not applicable for subduction depths.
The subsequent VT swarm from September 2016 onwards recorded events located within the Nevado Cayambe cone, and may be considered proximal VTs. If the distal VTs were associated with a new pulse of magma, then the proximal VTs may document the progression of ascent and possibly the formation of a proto-conduit. Repeated long-term families of VTs may indicate repeated rupture and sealing events of the brittle-ductile transition (Fournier, 2007), whilst isolated families may be indicative of individual rock fracturing episodes to accommodate ascent of magma and gases (Hill et al., 2002b). VT events that could not be classed into families may also be the spasmodic and irregular VT seismicity described in White and McCausland (2019) and associated with rupturing the brittle-ductile seal. We do not see accompanying low frequency seismicity at this stage, although this is possibly due to limitations in the network. The model for new activity at Cayambe is not wholly reliant on a new pulse of magma. It is also possible that a dilational regime in the crust prompted further exsolution of volatiles in pre-existing magma storage (Sparks et al., 1977). This is an option explored in a similar model in Roman and Cashman (2018).
The next stages of the onset are eruption are vent clearing and shallow repeating seismicity, as magma reaches the shallowest point in the conduit and eventually the surface. Evidence from the seismic record, however, does not suggest Cayambe volcano reached this stage in 2016–2017. The LP seismicity in particular is not typical or indicative of these late stages of re-awakening. Empirical calculations of acoustic impedance between magma-rock contacts would suggest Q values for these types of LPs should be an order of magnitude higher (Kumagai and Chouet, 2000; Métaxian, 2003). We also might expect these events to have larger amplitudes and more prominent cyclical trends as magma ascends and interacts with the conduit margins (Iverson, 2008; Bell et al., 2018; Butcher et al., 2020). Whilst we may speculate some harmonic tremor and isolated tornillos are coincident with records of sulphurous smells up on the flanks of Cayambe (IGEPN, 2016), they are not characteristic of rapid magma ascent or gas venting processes in the latter part of stage 3 and stage 4 of the model (Hotovec et al., 2013; Arámbula-Mendoza et al., 2016). During the crisis, IGEPN reported deformation data but neither GPS or tiltmeter readings suggested any change beyond the margin of any error, ±7 mm (IGEPN, 2016). This further supports the idea that whilst there may have been magma ascent, it was not particularly rapid or shallow enough to cause significant flank deformation. The VT swarms show a decreasing rate until the end of 2017 (Figure 2). There has since been no significant increase in the rate of LP seismicity, indicative of further magma ascent and a transition to stage 3 (White and McCausland, 2019). Whilst it is possible that exsolved gases in an ascending magma body will act to increase volumetric expansion, exsolution of water will act to stall ascent as the viscosity of magma increases (Dixon et al., 1995). It is possible that exsolution of water played a role, or simply the static stress field change was not enough for a magma pulse to ascend to the surface at Cayambe.
We suggest the persistent LP baseline seismicity recorded during 2016 and 2017 is of hydrothermal origin (Figure 13). As such any increase in LP seismicity with a significantly different envelope, QARMA or spectral signature; coupled with an increased in volcanic VT type events should be carefully monitored. Harmonic tremor and tornillo events should also be carefully monitored, coupled with DOAS measurements to identify significant changes in degassing. Periodically running cross correlation analyses and updating master event signals is important to trace subtle changes in seismicity and incorporate more recent events into the monitoring and interpretations. The 4-stage process (White and McCausland, 2019) presents observations of the model in action across time scales from 3 to 4 3months at Mt St Helens (Thelen et al., 2011) to nearly 4 years at Mt Sinabung (McCausland et al., 2019). It is therefore not unusual to observe this slow transition across a period of several years. The models for reawakening are not necessarily linear and if the process of reawakening did stall in 2017, then any resumed activity may include stage 2 distal VTs as well as more stage 3 shallow LPs and VTs (Roman and Cashman, 2018).
4.6 Implications for the Future
Low latitude glaciers are rapidly shrinking (Thompson et al., 2011). Evidence from analogue glaciers on Antisana suggests that whilst glacial retreat has been ongoing for over 150 years, this has accelerated in the last 30 years, as a result of anthropogenic climate change (Manciati et al., 2014). Studies in Iceland have shown that unloading effect from ice retreat can impact stress conditions within a volcano (Sigmundsson et al., 2010), and cause long term changes to failure conditions in shallow magma storage. Rapid unloading may then promote further magma ascent and impact pre-stressed faults in the volcanic ediface. Station ANGU, although with it’s defective instrument response, is installed on the very edge of the western reaches of the summit glacier. Carefully monitoring for any changes here may be particularly important. Even very localised slip may have further implications for secondary hazards from the glacier itself. Furthermore, in terms of hazard assessment, there are immediate hazards present from ice retreat and rapid glacier melt, particularly during an eruption (Tuffen, 2010). It is estimated around 4.2 km2 of ice was lost during the 1985 eruption of Nevado del Ruiz, contributing to devastating secondary lahars (Ceballos et al., 2006). In the short term, increased meltwater also has the potential to interact further with hydrothermal systems, increasing pore pressure. If we consider Cayambe Volcano to be re-awakening, where the next stage includes further magma ascent and shallow storage then additional meltwaters could lead to potentially very dangerous phreatic activity. Using the existing network, close monitoring of the LP seismicity could be crucial. Due to the unique positioning of glaciers in the Ecuadorian Andes, Cayambe is not subject to seasonal extremes in climate and so the record of seismicity from the hydrothermal system is consistent all year round. Slight changes in the QARMA value, or spectral signature could then be indicative of a change to what appears to be a very stable hydrothermal system in balance through 2016 and 2017. All of these recommendations for monitoring signal properties, can only be reliably determined from one station. An extended network of seismometers on Cayambe would allow for greater accuracy in locating events, to underpin interpretations from the event characteristics.
5 Conclusion
This study identifies several unique subsets of volcanic seismicity, observed at Cayambe during the seismic crisis of 2016. We explore the potential for re-awakening at a volcano that has been seismically restless for 20 years but last erupted in 1785. The seismic crisis at Cayambe volcano occurred just 3 months after the Mw7.8 earthquake, 200 km west on the Ecuador coastline. We draw comparisons from models of dynamic and static triggering of volcanic eruptions to the seismicity documented in 2016 and 2017. Should the seismicity have been generated by a new pulse of magma beneath Cayambe volcano, then the process of re-awakening is likely ongoing, although slowed or stalled currently. Given the potentially vulnerable state of the glacier, the unknowns around eruption dynamics and significant populations living within the immediate vicinity, Cayambe remains a dangerous volcano. We believe that using the metrics presented in this study, however, it is possible to carefully monitor the seismicity on the existing permanent network, and quickly identify when earthquake signals are evolving.
Data Availability Statement
Seismic data are curated by the IGEPN and available on request (from https://www.igepn.edu.ec/solicitud-de-datos).
Author Contributions
All authors conceptualised the research project. MR and SH provided geophysical monitoring data from Cayambe volcano (curated by IGEPN). AB supervised the research. SB lead the data analysis. All authors contributed to writing the article.
Funding
SB was funded by Edinburgh Earth and Environment Doctoral Training Partnership (E3 DTP) Grant NE/L002558/1. AB was supported by NERC GCRF award NE/S009000/1.
Conflict of Interest
The authors declare that the research was conducted in the absence of any commercial or financial relationships that could be construed as a potential conflict of interest.
Acknowledgments
We gratefully acknowledge Instituto Geofísico de la Escuela Politécnica Nacional (IGEPN) for providing the seismic data from Cayambe. We are also thankful to the monitoring staff at IGEPN for their continued and dedicated work maintaining the monitoring network on Cayambe volcano. SB would also like to thank Ivan Lokmer for providing MATLAB code and helping to pull together the Python implementation for the ARMA Q Factor code. We appreciate the insightful and thoughtful comments from two reviewers, which greatly improved the final manuscript. Also thanks go to the editorial team, including Luca De Siena.
Supplementary Material
The Supplementary Material for this article can be found online at: https://www.frontiersin.org/articles/10.3389/feart.2021.680865/full#supplementary-material
References
Aki, K., Fehler, M., and Das, S. (1977). Source Mechanism of Volcanic Tremor: Fluid-Driven Crack Models and Their Application to the 1963 Kilauea Eruption. J. Volcanol. Geotherm. Res. 2, 259–287. doi:10.1016/0377-0273(77)90003-8
Allstadt, K., and Malone, S. D. (2014). Swarms of Repeating Stick-Slip Icequakes Triggered by Snow Loading at Mount Rainier Volcano. J. Geophys. Res. Earth Surf. 119, 1180–1203. doi:10.1002/2014JF003086
Almendros, J., Abella, R., Mora, M. M., and Lesage, P. (2014). Array Analysis of the Seismic Wavefield of Long-Period Events and Volcanic Tremor at Arenal Volcano, Costa Rica. J. Geophys. Res. Solid Earth 119, 5536–5559. doi:10.1002/2013JB010628
Alvarado, A., Audin, L., Nocquet, J. M., Jaillard, E., Mothes, P., Jarrín, P., et al. (2016). Partitioning of Oblique Convergence in the Northern Andes Subduction Zone: Migration History and the Present-Day Boundary of the north Andean Sliver in ecuador. Tectonics 35, 1048–1065. doi:10.1002/2016tc004117
Arámbula-Mendoza, R., Valdés-González, C., Varley, N., Reyes-Pimentel, T. A., and Juárez-García, B. (2016). Tremor and its Duration-Amplitude Distribution at Popocatépetl Volcano, Mexico. Geophys. Res. Lett. 43, 8994–9001. doi:10.1002/2016GL070227
Arcila, M., and Arcila, M. (1996). Geophysical Monitoring of the Purace Volcano, Colombia. Ann. Geophys. 39, 265–272. doi:10.4401/ag-3970
Bame, D., and Fehler, M. (1986). Observations of Long Period Earthquakes Accompanying Hydraulic Fracturing. Geophys. Res. Lett. 13, 149–152. doi:10.1029/GL013i002p00149
Basantes-Serrano, R., Rabatel, A., Francou, B., Vincent, C., Maisincho, L., Cáceres, B., et al. (2016). Slight Mass Loss Revealed by Reanalyzing Glacier Mass-Balance Observations on Glaciar Antisana 15α (Inner Tropics) During the 1995-2012 Period. J. Glaciol. 62, 124–136. doi:10.1017/jog.2016.17
Bean, C. J., De Barros, L., Lokmer, I., Métaxian, J.-P., O’ Brien, G., and Murphy, S. (2014). Long-Period Seismicity in the Shallow Volcanic Edifice Formed From Slow-Rupture Earthquakes. Nat. Geosci. 7, 71–75. doi:10.1038/ngeo2027
Béjar-Pizarro, M., Álvarez Gómez, J., Staller, A., Luna, M., Pérez-López, R., Monserrat, O., et al. (2018). InSAR-Based Mapping to Support Decision-Making After an Earthquake. Remote Sens. 10, 899. doi:10.3390/rs10060899
Bell, A. F., Hernandez, S., Gaunt, H. E., Mothes, P., Ruiz, M., Sierra, D., et al. (2017). The Rise and Fall of Periodic 'drumbeat' Seismicity at Tungurahua Volcano, Ecuador. Earth Planet. Sci. Lett. 475, 58–70. doi:10.1016/j.epsl.2017.07.030
Bell, A. F., Naylor, M., Hernandez, S., Main, I. G., Gaunt, H. E., Mothes, P., et al. (2018). Volcanic Eruption Forecasts From Accelerating Rates of Drumbeat Long‐Period Earthquakes. Geophys. Res. Lett. 45, 1339–1348. doi:10.1002/2017GL076429
Bernard, B., Battaglia, J., Proaño, A., Hidalgo, S., Vásconez, F., Hernandez, S., et al. (2016). Relationship Between Volcanic Ash Fallouts and Seismic Tremor: Quantitative Assessment of the 2015 Eruptive Period at Cotopaxi Volcano, Ecuador. Bull. Volcanol. 78, 80. doi:10.1007/s00445-016-1077-5
Bernard, B., and Samaniego, P. (2017). “Escenarios eruptivos en el Volcán Cayambe y construcción de un árbol de eventos,” in Sometido a: Jornadas de Ciencias de la Tierra VIII. Quito, Ecuador: Escuela Politécnica Nacional.
Boué, A., Lesage, P., Cortés, G., Valette, B., and Reyes-Dávila, G. (2015). Real-Time Eruption Forecasting Using the Material Failure Forecast Method With a Bayesian Approach. J. Geophys. Res. Solid Earth 120, 2143–2161. doi:10.1002/2014JB011637
Butcher, S., Bell, A. F., Hernandez, S., Calder, E., Ruiz, M., and Mothes, P. (2020). Drumbeat LP “Aftershocks” to a Failed Explosive Eruption at Tungurahua Volcano, Ecuador. Geophys. Res. Lett. 47, e2020GL088301. doi:10.1029/2020GL088301
Buurman, H., West, M. E., and Thompson, G. (2013). The Seismicity of the 2009 Redoubt Eruption. J. Volcanol. Geotherm. Res. 259, 16–30. doi:10.1016/j.jvolgeores.2012.04.024
Carrasco-Núñez, G., Vallance, J. W., and Rose, W. I. (1993). A Voluminous Avalanche-Induced Lahar From Citlaltépetl Volcano, Mexico: Implications for Hazard Assessment. J. Volcanol. Geotherm. Res. 59, 35–46. doi:10.1016/0377-0273(93)90076-4
Caudron, C., Syahbana, D. K., Lecocq, T., Van Hinsberg, V., McCausland, W., Triantafyllou, A., et al. (2015). Kawah Ijen Volcanic Activity: a Review. Bull. Volcanol. 77, 16. doi:10.1007/s00445-014-0885-8
Ceballos, J. L., Euscátegui, C., Ramírez, J., Cañon, M., Huggel, C., Haeberli, W., et al. (2006). “Fast Shrinkage of Tropical Glaciers in Colombia, Ann. Glaciol. Ann. Glaciol. 43, 194–201. doi:10.3189/172756406781812429
Chouet, B. A., and Matoza, R. S. (2013). A Multi-Decadal View of Seismic Methods for Detecting Precursors of Magma Movement and Eruption. J. Volcanol. Geotherm. Res. 252, 108–175. doi:10.1016/j.jvolgeores.2012.11.013
Chouet, B. (1981). Ground Motion in the Near Field of a Fluid-Driven Crack and its Interpretation in the Study of Shallow Volcanic Tremor. J. Geophys. Res. 86, 5985–6016. doi:10.1029/JB086iB07p05985
Chouet, B. (1988). Resonance of a Fluid-Driven Crack: Radiation Properties and Implications for the Source of Long-Period Events and Harmonic Tremor. J. Geophys. Res. 93, 4375–4400. doi:10.1029/JB093iB05p04375
Cogley, G., Kienholz, C., Miles, E., Sharp, M., and Wyatt, F. (2015). GLIMS Glacier Database. Boulder, CO: National Snow and Ice Data Center.
Coulon, C. A., Hsieh, P. A., White, R., Lowenstern, J. B., and Ingebritsen, S. E. (2017). Causes of Distal Volcano-Tectonic Seismicity Inferred From Hydrothermal Modeling. J. Volcanol. Geotherm. Res. 345, 98–108. doi:10.1016/j.jvolgeores.2017.07.011
Cusano, P., Petrosino, S., and Saccorotti, G. (2008). Hydrothermal Origin for Sustained Long-Period (LP) Activity at Campi Flegrei Volcanic Complex, Italy. J. Volcanol. Geotherm. Res. 177, 1035–1044. doi:10.1016/j.jvolgeores.2008.07.019
Del Pezzo, E., Bianco, F., and Borgna, I. (2013). Magnitude Scale for LP Events: A Quantification Scheme for Volcanic Quakes. Geophys. J. Int. 194, 911–919. doi:10.1093/gji/ggt126
Detienne, M., Delmelle, P., Guevara, A., Samaniego, P., Opfergelt, S., and Mothes, P. A. (2017). Contrasting Origin of Two Clay-Rich Debris Flows at Cayambe Volcanic Complex, Ecuador. Bull. Volcanol. 79, 27. doi:10.1007/s00445-017-1111-2
Dixon, J. E., Stolper, E. M., and Holloway, J. R. (1995). An Experimental Study of Water and Carbon Dioxide Solubilities in Mid-ocean ridge Basaltic Liquids. Part I: Calibration and Solubility Models. J. Petrol. 36, 1607–1631. doi:10.1093/oxfordjournals.petrology.a037267
Dziewonski, A. M., Chou, T.-A., and Woodhouse, J. H. (1981). Determination of Earthquake Source Parameters From Waveform Data for Studies of Global and Regional Seismicity. J. Geophys. Res. 86, 2825–2852. doi:10.1029/JB086iB04p02825
Eguez, A., Alvarado, A., Yepes, H., Machette, M. N., Costa, C., Dart, R. L., et al. (2003). Database and Map of Quaternary Faults and Folds of Ecuador and its Offshore Regions. US Geological Survey Open-File Report.
Eibl, E. P. S., Lokmer, I., Bean, C. J., Akerlie, E., and Vogfjörd, K. S. (2015). Helicopter vs. Volcanic Tremor: Characteristic Features of Seismic Harmonic Tremor on Volcanoes. J. Volcanol. Geotherm. Res. 304, 108–117. doi:10.1016/j.jvolgeores.2015.08.002
Ekström, G., Nettles, M., and Dziewoński, A. M. (2012). The Global CMT Project 2004-2010: Centroid-Moment Tensors for 13,017 Earthquakes. Phys. Earth Planet. Inter. 200–201, 1–9. doi:10.1016/j.pepi.2012.04.002
Fazio, M., Alparone, S., Benson, P. M., Cannata, A., and Vinciguerra, S. (2019). Genesis and Mechanisms Controlling Tornillo Seismo-Volcanic Events in Volcanic Areas. Sci. Rep. 9, 7338. doi:10.1038/s41598-019-43842-y
Ferrari, L., and Tibaldi, A. (1992). Recent and Active Tectonics of the North-Eastern Ecuadorian Andes. J. Geodyn. 15, 39–58. doi:10.1016/0264-3707(92)90005-d
Fournier, R. O. (2007). “Hydrothermal Systems and Volcano Geochemistry,” in Volcano Deformation. Editor D. Dzurisin. Berlin/Heidelberg, Germany: Springer, 323–341.
Gibbons, S. J., Bøttger Sørensen, M., Harris, D. B., and Ringdal, F. (2007). The Detection and Location of Low Magnitude Earthquakes in Northern Norway Using Multi-Channel Waveform Correlation at Regional Distances. Phys. Earth Planet. Inter. 160, 285–309. doi:10.1016/j.pepi.2006.11.008
Global Volcanism Program (2013). Cayambe (352006). https://volcano.si.edu/volcano.cfm?vn=352006. (Accessed December 16, 2020).
Guillier, B., and Chatelain, J. L. (2006). Evidence for a Seismic Activity Mainly Constituted of Hybrid Events at Cayambe Volcano, Ecuador. Interpretation in a Iced-Domes Volcano Context. C. R. Geosci. 338, 499–506. doi:10.1016/j.crte.2006.03.004
Guillier, B., Samaniego, P., Ruiz, M., and Chatelain, J.-L. (1999). Steady Long-Period Activity at Cayambe Volcano, Ecuador: Location, Spectral Analysis and Consequences Seismic Microzonation and Risk Assessment of Portoviejo City. Technical Report. https://www.researchgate.net/publication/32968808. (Accessed February 04, 2021).
Hall, M. L., Steele, A. L., Bernard, B., Mothes, P. A., Vallejo, S. X., Douillet, G. A., et al. (2015). Sequential Plug Formation, Disintegration by Vulcanian Explosions, and the Generation of Granular Pyroclastic Density Currents at Tungurahua Volcano (2013-2014), Ecuador. J. Volcanol. Geotherm. Res. 306, 90–103. doi:10.1016/j.jvolgeores.2015.09.009
Heidarzadeh, M., Murotani, S., Satake, K., Takagawa, T., and Saito, T. (2017). Fault Size and Depth Extent of the Ecuador Earthquake (Mw7.8) of 16 April 2016 From Teleseismic and Tsunami Data. Geophys. Res. Lett. 44, 2211–2219. doi:10.1002/2017GL072545
Hellweg, M. (2000). Physical Models for the Source of Lascar’s Harmonic Tremor. J. Volcanol. Geotherm. Res. 101, 183–198. doi:10.1016/S0377-0273(00)00163-3
Hill, D. P., Dawson, P., Johnston, M. J. S., Pitt, A. M., Biasi, G., and Smith, K. (2002a). Very-Long-Period Volcanic Earthquakes Beneath Mammoth Mountain, California. Geophys. Res. Lett. 29, 1370. doi:10.1029/2002GL014833
Hill, D. P., Pollitz, F., and Newhall, C. (2002b). Earthquake-Volcano Interactions. Phys. Today 55, 41–47. doi:10.1063/1.1535006
Hill, D. P., and Prejean, S. G. (2015). “Dynamic Triggering,” in Treatise on Geophysics. 2nd Edn, Editor Schubert, G. (Amsterdam: Elsevier), 273–304.
Hoblitt, R., Walder, J., Driedger, C., Scotf, K., Pringle, P., and Vallance, J. (1998). Volcano Hazards From Mount Rainier, Washington. Revised 1998 Open-File Report 98-428.
Hori, S., Fukao, Y., Kumazawa, M., Furumoto, M., and Yamamoto, A. (1989). A New Method of Spectral Analysis and its Application to the Earth’s Free Oscillations: The ‘Sompi’ Method. J. Geophys. Res. 94, 7535–7553. doi:10.1029/JB094iB06p07535
Hotovec, A. J., Prejean, S. G., Vidale, J. E., and Gomberg, J. (2013). Strongly Gliding Harmonic Tremor During the 2009 Eruption of Redoubt Volcano. J. Volcanol. Geotherm. Res. 259, 89–99. doi:10.1016/j.jvolgeores.2012.01.001
Hotovec-Ellis, A. J., Shelly, D. R., Hill, D. P., Pitt, A. M., Dawson, P. B., and Chouet, B. A. (2018). Deep Fluid Pathways Beneath Mammoth Mountain, California, Illuminated by Migrating Earthquake Swarms. Sci. Adv. 4, eaat5258. doi:10.1126/sciadv.aat5258
Huggel, C., Ceballos, J. L., Pulgarín, B., Ramírez, J., and Thouret, J. C. (2007). Review and Reassessment of Hazards Owing to Volcano-Glacier Interactions in Colombia. Ann. Glaciol. 45, 128–136. doi:10.3189/172756407782282408
IGEPN (2016). Informe Especial N° 5- Volcán Cayambe: Actualización de la actividad. https://www.igepn.edu.ec/cayambe-informes/cay-especiales/cay-e-2016. (Accessed November 20, 2020).
Iverson, R. M. (2008). “Dynamics of Seismogenic Volcanic Extrusion Resisted by a Solid Surface Plug, Mount St. Helens 2004–2005,” in A Volcano Rekindled: The Renewed Eruption of Mount St. Helens, 2004–2006. Editors D. R. Sherrod, W. E. Scott, and P. H. Stauffer. Reston, VA: U.S. Geological Survey, 425–460.
Johnson, J. B., Ruiz, M. C., Ortiz, H. D., Watson, L. M., Viracucha, G., Ramon, P., et al. (2018). Infrasound Tornillos Produced by Volcán Cotopaxi’s Deep Crater. Geophys. Res. Lett. 45, 5436–5444. doi:10.1029/2018GL077766
Jónsdóttir, K., Roberts, R., Pohjola, V., Lund, B., Shomali, Z. H., Tryggvason, A., et al. (2009). Glacial Long Period Seismic Events at Katla Volcano, Iceland. Geophys. Res. Lett. 36, L11402. doi:10.1029/2009GL038234
Jónsdóttir, K., Tryggvason, A., Roberts, R., Lund, B., Soosalu, H., and Bödvarsson, R. (2007). Habits of a Glacier-Covered Volcano: Seismicity Patterns and Velocity Structure of Katla Volcano, Iceland. Ann. Glaciol. 45, 169–177. doi:10.3189/172756407782282499
Julian, B. R. (1994). Volcanic Tremor: Nonlinear Excitation by Fluid Flow. J. Geophys. Res. 99, 11859–11877. doi:10.1029/93jb03129
Kawakatsu, H., and Cadena, G. P. (1991). Focal Mechanisms of the March 6, 1987 Ecuador Earthquakes. CMT Inversion With a First Motion Constraint. J. Phys. Earth 39, 589–597. doi:10.4294/jpe1952.39.589
Krischer, L., Megies, T., Barsch, R., Beyreuther, M., Lecocq, T., Caudron, C., et al. (2015). ObsPy: A Bridge for Seismology into the Scientific Python Ecosystem. Comput. Sci. Discov. 8, 17. doi:10.1088/1749-4699/8/1/014003
Kumagai, H., and Chouet, B. A. (2000). Acoustic Properties of a Crack Containing Magmatic or Hydrothermal Fluids. J. Geophys. Res. Solid Earth 105, 25493–25512. doi:10.1029/2000JB900273
Kumagai, H., and Chouet, B. A. (1999). The Complex Frequencies of Long-Period Seismic Events as Probes of Fluid Composition beneath Volcanoes. Geophys. J. Int. 138, F17–F12. doi:10.1046/j.1365-246X.1999.00911.x
Kumazawa, M., Imanishi, Y., Fukao, Y., Furumoto, M., and Yamamoto, A. (1990). A Theory of Spectral Analysis Based on the Characteristic Property of a Linear Dynamic System. Geophys. J. Int. 101, 613–630. doi:10.1111/j.1365-246X.1990.tb05574.x
Lamb, O., Lees, J., Marin, L. F., Lazo, J., Rivera, A., Shore, M., et al. (2020). Investigating Potential Icequakes at Llaima Volcano, Chile. Volcanica 3, 29–42. doi:10.30909/vol.03.01.2942
Lees, J. M., Johnson, J. B., Ruiz, M., Troncoso, L., and Welsh, M. (2008). Reventador Volcano 2005: Eruptive Activity Inferred from Seismo-Acoustic Observation. J. Volcanol. Geotherm. Res. 176, 179–190. doi:10.1016/j.jvolgeores.2007.10.006
Lehr, J., Eckel, F., Thorwart, M., and Rabbel, W. (2019). Low-Frequency Seismicity at Villarrica Volcano: Source Location and Seismic Velocities. J. Geophys. Res. Solid Earth 124, 11505–11530. doi:10.1029/2018JB017023
Lemarchand, N., and Grasso, J. R. (2007). Interactions Between Earthquakes and Volcano Activity. Geophys. Res. Lett. 34, L24303. doi:10.1029/2007GL031438
Lesage, P. (2008). Automatic Estimation of Optimal Autoregressive Filters for the Analysis of Volcanic Seismic Activity. Nat. Hazards Earth Syst. Sci. 8, 369–376. doi:10.5194/nhess-8-369-2008
Lesage, P. (2009). Interactive Matlab Software for the Analysis of Seismic Volcanic Signals. Comput. Geosci. 35, 2137–2144. doi:10.1016/j.cageo.2009.01.010
Lin, C. H. (2017). Dynamic Triggering of Volcano Drumbeat-Like Seismicity at the Tatun Volcano Group in Taiwan. Geophys. J. Int. 210, 354–359. doi:10.1093/gji/ggx172
Lipovsky, B. P., and Dunham, E. M. (2015). Vibrational Modes of Hydraulic Fractures: Inference of Fracture Geometry From Resonant Frequencies and Attenuation. J. Geophys. Res. Solid Earth 120, 1080–1107. doi:10.1002/2014JB011286
Lokmer, I., Saccorotti, G., Di Lieto, B., and Bean, C. J. (2008). Temporal Evolution of Long-Period Seismicity at Etna Volcano, Italy, and its Relationships With the 2004-2005 Eruption. Earth Planet. Sci. Lett. 266, 205–220. doi:10.1016/j.epsl.2007.11.017
Manciati, C., Villacís, M., Taupin, J.-D., Cadier, E., Galárraga-Sánchez, R., and Cáceres, B. (2014). Empirical Mass Balance Modelling of South American Tropical Glaciers: Case Study of Antisana Volcano, Ecuador. Hydrol. Sci. J. 59, 1519–1535. doi:10.1080/02626667.2014.888490
Manga, M., and Brodsky, E. (2006). Seismic Triggering of Eruptions in the Far Field: Volcanoes and Geysers. Annu. Rev. Earth Planet. Sci. 34, 263–291. doi:10.1146/annurev.earth.34.031405.125125
McCausland, W. A., Gunawan, H., White, R. A., Indrastuti, N., Patria, C., Suparman, Y., et al. (2019). Using a Process-Based Model of Pre-eruptive Seismic Patterns to Forecast Evolving Eruptive Styles at Sinabung Volcano, Indonesia. J. Volcanol. Geotherm. Res. 382, 253–266. doi:10.1016/j.jvolgeores.2017.04.004
McNutt, S. R., and Roman, D. C. (2015). “Volcanic Seismicity,” in The Encyclopedia of Volcanoes. Editor H. Sigurdsson. 2nd Edn. (Cambridge, MA: Academic Press), 1011–1034.
Métaxian, J.-P. (2003). Seismicity Related to the Glacier of Cotopaxi Volcano, Ecuador. Geophys. Res. Lett. 30, 1483. doi:10.1029/2002GL016773
Minakami, T., Ishikawa, T., and Yagi, K. (1951). The 1944 Eruption of Volcano Usu in Hokkaido, Japan: History and Mechanism of Formation of the New Dome “Syowa-Sinzan”. Bull. Volcanol. 11, 45–157. doi:10.1007/BF02596029
Molina, I., Kumagai, H., García-Aristizábal, A., Nakano, M., and Mothes, P. (2008). Source Process of Very-Long-Period Events Accompanying Long-Period Signals at Cotopaxi Volcano, Ecuador. J. Volcanol. Geotherm. Res. 176, 119–133.
Molina, I., Kumagai, H., and Yepes, H. (2004). Resonances of a Volcanic Conduit Triggered by Repetitive Injections of an Ash-Laden Gas. Geophys. Res. Lett. 31, L03603. doi:10.1029/2003GL018934
Narváez, L., Cepeda, H., and Stix, J. (1997). ‘Tornillo’-type Seismic Signals at Galeras Volcano, Colombia, 1992–1993. J. Volcanol. Geotherm. Res. 77, 159–171. doi:10.1016/S0377-0273(96)00092-3
Neuberg, J. W., Tuffen, H., Collier, L., Green, D. N., Powell, T., and Dingwell, D. (2006). The Trigger Mechanism of Low-Frequency Earthquakes on Montserrat. J. Volcanol. Geotherm. Res. 153, 37–50. doi:10.1016/j.jvolgeores.2005.08.008
Nocquet, J. M., Jarrin, P., Vallée, M., Mothes, P. A., Grandin, R., Rolandone, F., et al. (2017). Supercycle at the Ecuadorian Subduction Zone Revealed After the 2016 Pedernales Earthquake. Nat. Geosci. 10, 145–149. doi:10.1038/ngeo2864
Park, I., Jolly, A., Kim, K. Y., and Kennedy, B. (2019). Temporal Variations of Repeating Low Frequency Volcanic Earthquakes at Ngauruhoe Volcano, New Zealand. J. Volcanol. Geotherm. Res. 373, 108–119. doi:10.1016/j.jvolgeores.2019.01.024
Petersen, T. (2007). Swarms of Repeating Long-Period Earthquakes at Shishaldin Volcano, Alaska, 2001-2004. J. Volcanol. Geotherm. Res. 166, 177–192. doi:10.1016/j.jvolgeores.2007.07.014
Prejean, S. G., Hill, D. P., Brodsky, E. E., Hough, S. E., Johnston, M. J., Malone, S. D., et al. (2004). Remotely Triggered Seismicity on the United States West Coast Following the Mw 7.9 Denali Fault Earthquake. Bull. Seismol. Soc. Am. 94, 348–359. doi:10.1785/0120040610
Prejean, S. G., and Hill, D. P. (2018). The Influence of Tectonic Environment on Dynamic Earthquake Triggering: A Review and Case Study on Alaskan Volcanoes. Tectonophysics 745, 293–304. doi:10.1016/j.tecto.2018.08.007
Roman, D. C. (2017). Automated Detection and Characterization of Harmonic Tremor in Continuous Seismic Data. Geophys. Res. Lett. 44, 6065–6073. doi:10.1002/2017GL073715
Roman, D. C., and Cashman, K. V. (2018). Top–Down Precursory Volcanic Seismicity: Implications for ‘Stealth’ Magma Ascent and Long-Term Eruption Forecasting. Front. Earth Sci. 6, 124. doi:10.3389/feart.2018.00124
Rossing, T. D., and Fletcher, N. H. (2004). Principles of Vibrations and Sound. New York: Springer-Verlag.
Samaniego, P., Martin, H., Monzier, M., Robin, C., Fornari, M., Eissen, J. P., et al. (2005). Temporal Evolution of Magmatism in the Northern Volcanic Zone of the Andes: The Geology and Petrology of Cayambe Volcanic Complex (Ecuador). J. Petrol. 46, 2225–2252. doi:10.1093/petrology/egi053
Samaniego, P., Monzier, M., Robin, C., and Hall, M. L. (1998). Late Holocene Eruptive Activity at Nevado Cayambe Volcano, Ecuador. Bull. Volcanol. 59, 451–459. doi:10.1007/s004450050203
Schuster, R. L., Nieto, A. S., O’Rourke, T. D., Crespo, E., and Plaza-Nieto, G. (1996). Mass Wasting Triggered by the 5 March 1987 Ecuador Earthquakes. Eng. Geol. 42, 1–23. doi:10.1016/0013-7952(95)00024-0
Shapiro, N. M., Droznin, D. V., Droznina, S. Y., Senyukov, S. L., Gusev, A. A., and Gordeev, E. I. (2017). Deep and Shallow Long-Period Volcanic Seismicity Linked by Fluid-Pressure Transfer. Nat. Geosci. 10, 442–445. doi:10.1038/ngeo2952
Sigmundsson, F., Pinel, V., Lund, B., Albino, F., Pagli, C., Geirsson, H., et al. (2010). Climate Effects on Volcanism: Influence on Magmatic Systems of Loading and Unloading from Ice Mass Variations, with Examples from Iceland. Phil. Trans. R. Soc. A: Math. Phys. Eng. Sci. 368, 2519–2534. doi:10.1098/rsta.2010.0042
Sparks, S. R. J., Sigurdsson, H., and Wilson, L. (1977). Magma Mixing: a Mechanism for Triggering Acid Explosive Eruptions. Nature 267, 315–318. doi:10.1038/267315a0
Thelen, W., Malone, S., and West, M. (2011). Multiplets: Their Behavior and Utility at Dacitic and Andesitic Volcanic Centers. J. Geophys. Res. Solid Earth 116, B08210. doi:10.1029/2010JB007924
Thompson, L. G., Mosley-Thompson, E., Davis, M. E., and Brecher, H. H. (2011). Tropical Glaciers, Recorders and Indicators of Climate Change, are Disappearing Globally. Ann. Glaciol. 52, 23–34. doi:10.3189/172756411799096231
Tibaldi, A., Ferrari, L., and Pasquarè, G. (1995). Landslides Triggered by Earthquakes and Their Relations With Faults and Mountain Slope Geometry: An Example From Ecuador. Geomorphology 11, 215–226. doi:10.1016/0169-555X(94)00060-5
Tuffen, H. (2010). How Will Melting of Ice Affect Volcanic Hazards in the Twenty-First century? Phil. Trans. R. Soc. A: Math. Phys. Eng. Sci. 368, 2535–2558. doi:10.1098/rsta.2010.0063
USGS (2021). Earthquake Catalog Search. https://earthquake.usgs.gov/earthquakes/search/. (Accessed January 20, 2021).
Utsu, T., Ogata, Y., S, R., and Matsu’ura, (1995). The Centenary of the Omori Formula for a Decay Law of Aftershock Activity. J. Phys. Earth 43, 1–33. doi:10.4294/jpe1952.43.1
Varley, N., Arámbula-Mendoza, R., Reyes-Dávila, G., Sanderson, R., and Stevenson, J. (2010). Generation of Vulcanian Activity and Long-Period Seismicity at Volcán de Colima, Mexico. J. Volcanol. Geotherm. Res. 198, 45–56. doi:10.1016/j.jvolgeores.2010.08.009
Varley, N. R., Arámbula-Mendoza, R., Reyes-Dávila, G., Stevenson, J., and Harwood, R. (2010). Long-Period Seismicity During Magma Movement at Volcán de Colima. Bull. Volcanol. 72, 1093–1107. doi:10.1007/s00445-010-0390-7
Veloza, G., Styron, R., and Taylor, M. (2012). Open-Source Archive of Active Faults for Northwest South America. GSA Today 22, 4–10. doi:10.1130/GSAT-G156A.1
Voight, B. (1988). A Method for Prediction of Volcanic Eruptions. Nature 332, 125. doi:10.1038/332125a0
Waite, G. P., Chouet, B. A., and Dawson, P. B. (2008). Eruption Dynamics at Mount St. Helens Imaged From Broadband Seismic Waveforms: Interaction of the Shallow Magmatic and Hydrothermal Systems. J. Geophys. Res. Solid Earth 113, B02305. doi:10.1029/2007JB005259
Walter, T. R., and Amelung, F. (2007). Volcanic Eruptions Following M > 9 Megathrust Earthquakes: Implications for the Sumatra-Andaman Volcanoes. Geology 35, 539–542. doi:10.1130/G23429A.1
Walter, T. R., Wang, R., Zimmer, M., Grosser, H., Lühr, B., and Ratdomopurbo, A. (2007). Volcanic Activity Influenced by Tectonic Earthquakes: Static and Dynamic Stress Triggering at Mt. Merapi. Geophys. Res. Lett. 34, L05304. doi:10.1029/2006GL028710
White, R. A., and McCausland, W. A. (2019). A Process-Based Model of Pre-Eruption Seismicity Patterns and its Use for Eruption Forecasting at Dormant Stratovolcanoes. J. Volcanol. Geotherm. Res. 382, 267–297. doi:10.1016/j.jvolgeores.2019.03.004
White, R., and McCausland, W. (2016). Volcano-Tectonic Earthquakes: A New Tool for Estimating Intrusive Volumes and Forecasting Eruptions. J. Volcanol. Geotherm. Res. 309, 139–155. doi:10.1016/j.jvolgeores.2015.10.020
Woods, J., Donaldson, C., White, R. S., Caudron, C., Brandsdóttir, B., Hudson, T. S., et al. (2018). Long-Period Seismicity Reveals Magma Pathways Above a Laterally Propagating Dyke during the 2014–15 Bárðarbunga Rifting Event, Iceland. Earth Planet. Sci. Lett. 490, 216–229. doi:10.1016/j.epsl.2018.03.020
Worni, R., Huggel, C., Stoffel, M., and Pulgarín, B. (2012). Challenges of Modeling Current Very Large Lahars at Nevado del Huila Volcano, Colombia. Bull. Volcanol. 74, 309–324. doi:10.1007/s00445-011-0522-8
Yepes, H., Audin, L., Alvarado, A., Beauval, C., Aguilar, J., Font, Y., et al. (2016). A New View for the Geodynamics of Ecuador: Implication in Seismogenic Source Definition and Seismic hazard Assessment. Tectonics 35, 1249–1279. doi:10.1002/2015TC003941
Yoshimoto, M., Kumagai, H., Acero, W., Ponce, G., Vásconez, F., Arrais, S., et al. (2017). Depth–Dependent Rupture Mode Along the Ecuador–Colombia Subduction Zone. Geophys. Res. Lett. 44, 2203–2210. doi:10.1002/2016GL071929
Keywords: long-period seismicity, volcano-seismic swarms, volcano-glacier interactions, volcanic monitoring, volcano-tectonic interactions
Citation: Butcher S, Bell AF, Hernandez S and Ruiz M (2021) Evolution of Seismicity During a Stalled Episode of Reawakening at Cayambe Volcano, Ecuador. Front. Earth Sci. 9:680865. doi: 10.3389/feart.2021.680865
Received: 26 February 2021; Accepted: 14 May 2021;
Published: 15 June 2021.
Edited by:
Luca De Siena, Johannes Gutenberg University Mainz, GermanyReviewed by:
Gregory Waite, Michigan Technological University, United StatesWendy A. McCausland, Volcano Disaster Assistance Program (USGS), United States
Copyright © 2021 Butcher, Bell, Hernandez and Ruiz. This is an open-access article distributed under the terms of the Creative Commons Attribution License (CC BY). The use, distribution or reproduction in other forums is permitted, provided the original author(s) and the copyright owner(s) are credited and that the original publication in this journal is cited, in accordance with accepted academic practice. No use, distribution or reproduction is permitted which does not comply with these terms.
*Correspondence: S. Butcher, c29waGllLmJ1dGNoZXJAZWQuYWMudWs=