 Yu-Min Chou1,2,3*
 Xiaodong Jiang1,2,3
 Li Lo4,5,6*
 Liang-Chi Wang7,8*Teh-Quei Lee9
 Chun-Chieh Wang10
 Yongxin Pan11
 Jianjun Zou12,13
 Fabien Humbert3
 Zhiqiang Liu2,3
- 1Shenzhen Key Laboratory of Marine Archaea Geo-Omics, Department of Ocean Science and Engineering, Southern University of Science and Technology, Shenzhen, China
- 2Southern Marine Science and Engineering Guangdong Laboratory, Guangzhou, China
- 3Department of Ocean Science and Engineering, Southern University of Science and Technology, Shenzhen, China
- 4Department of Geosciences, National Taiwan University, Taipei, Taiwan
- 5Paleoceanography Laboratory, National Taiwan University, Taipei, Taiwan
- 6Research Center for Future Earth, National Taiwan University, Taipei, Taiwan
- 7Department of Earth and Environmental Sciences, National Chung Cheng University, Chiayi, Taiwan
- 8Environment and Disaster Monitoring Center, National Chung Cheng University, Chiayi, Taiwan
- 9Institute of Earth Science, Academia Sinica, Taipei, Taiwan
- 10National Synchrotron Radiation Research Center, Hsinchu, Taiwan
- 11Institute of Geology and Geophysics, Chinese Academy of Sciences, Beijing, China
- 12Key Laboratory of Marine Geology and Metallogeny, First Institute of Oceanography, Ministry of Natural Resources, Qingdao, China
- 13Laboratory for Marine Geology, Pilot National Oceanography Laboratory for Marine Science and Technology, Qingdao, China
The Okhotsk Sea, which connects the high latitude Asian continent and the North Pacific, plays an important role in modern and past climate changes due to seasonal sea ice coverage and as a precursor of the North Pacific Intermediate Water. The long-term glacial-interglacial changes of sea ice coverage and its impacts on terrigenous transport and surface primary productivity in the Okhotsk Sea remain, however, not well constrained. Base on the paleomagnetic, rock magnetic, micropaleontological (diatom), and geochemical studies of the marine sediment core MD01-2414 (53°11.77′N, 149°34.80′E, water depth: 1,123 m) taken in the central Okhotsk Sea, we reconstruct the terrigenous sediment transport and paleoceanographic variations during the past 1550 thousand years (kyr). Seventeen geomagnetic excursions are identified from the paleomagnetic directional record. Close to the bottom of the core, an excursion was observed, which is proposed to be the Gilsa event ∼1550 thousand years ago (ka). During glacial intervals, our records reveal a wide extension of sea ice coverage and low marine productivity. We observed ice-rafted debris from mountain icebergs composed of coarse and high magnetic terrigenous detritus which were derived from the Kamchatka Peninsula to the central Okhotsk basin. Still during glacial intervals, the initiation (i.e., at ∼900 ka) of the Mid-Pleistocene Transition marks the changes to even lower marine productivity, suggesting that sea-ice coverage became larger during the last 900 ka. During interglacial intervals, the central Okhotsk Sea was either devoid of sea-ice or the ice was at best seasonal; resulting in high marine productivity. The weaker formation of Okhotsk Sea Intermediate Water, lower ventilation, and microbial degradation of organic matter depleted the oxygen concentration in the bottom water and created a reduced environment condition in the sea basin. The freshwater supplied by snow or glacier melting from Siberia and Kamchatka delivered fine grain sediments to the Okhotsk Sea. During the stronger interglacial intervals after the Mid-Brunhes Transition (i.e., Marine Isotope Stages 1, 5e, 9, and 11), strong freshwater discharges from Amur River drainage area are in association with intensified East Asian Summer Monsoon. This process may have enhanced the input of fine-grained terrigenous sediments to the central Okhotsk Sea.
Introduction
Marine oxygen isotope data reveal that the Northern Hemisphere glaciation had an onset 3.5 million years (Ma) ago and further intensified around the end of Pliocene when it evolved to alternating glacial and interglacial intervals which dominated the global climate (e.g., Bartoli et al., 2005; Lisiecki and Raymo, 2005; Mudelsee and Raymo, 2005). Complicated oscillating variations such as the “Mid-Pleistocene Transition (MPT)” from 1.25 to 0.7 Ma or the Mid-Brunhes Transition (MBT) from ∼400 to 350 thousand years ago (ka) with an increase in amplitude of 100 kyr glacial-interglacial cycles occurred during the last 2 Myr (e.g., Jansen et al., 1986; Lisiecki and Raymo, 2005; Yin and Berger, 2010; Elderfield et al., 2012; Head and Gibbard, 2015; Cronin et al., 2017; Barth et al., 2018). The high-latitude areas are particularly sensitive to global climatic changes due to the intimate and complex couplings between the cryosphere, the atmosphere, oceans, and continents (e.g., Elderfield et al., 2012; Melles et al., 2012; Campos and Horn, 2018). The Arctic Amplification reveals that the near surface temperature is rising twice faster than the global average in high latitude regions (e.g., Serreze and Francis, 2006; Serreze and Barry, 2011; Cohen et al., 2014). Only few long-term sediment records from terrestrial Arctic and subarctic Pacific provide continuous and high-resolved information of natural climate variation during Quaternary (e.g., Haug et al., 1999; Melles et al., 2012). The lake sediment records from the Arctic show that the forcing (e.g., CO2 concentration, orbital cycles) of super interglacial intervals were complex over the last 2.8 Myr, highlighting the importance of amplifying feedbacks and far field influences (Melles et al., 2012). The marine sediment records from subarctic Pacific Ocean reveal that the subarctic Pacific halocline stratification of surface waters influences the exchange of CO2 between ocean and atmosphere (Haug et al., 1999). The long-term chronology (e.g., magnetostratigraphy) climate variations of interaction between terrestrial Arctic and subarctic Pacific remain to be studied further.
The Okhotsk Sea is a marginal sea of the northwestern North Pacific Ocean, which is a crucial “bridge” that connects the high -latitude Asian continent and North Pacific. It can thus provide crucial information about the glacial–interglacial climate change linked to the interaction between continent and ocean. The environmental proxies of the sediments accumulated in Okhotsk Sea are sensitive to past climate change, reflecting in the erosion of source regions, sea ice coverage, and changes in sea level and land-sea interactions (Gorbarenko et al., 2002, 2010, 2012; Nürnberg and Tiedemann, 2004; Sakamoto et al., 2005, 2006; Liu et al., 2006; Chou et al., 2011; Nürnberg et al., 2011; Seki et al., 2012; Yamazaki et al., 2013; Zou et al., 2015; Jimenez-Espejo et al., 2018; Lo et al., 2018; Lattaud et al., 2019). Some previous work already used the magnetic parameters and environmental data to reconstruct the sea ice condition and climate changes (e.g., Gorbarenko et al., 2002; Chou et al., 2011; Yamazaki et al., 2013); such type of studies remains, however, rare. Most previous studies of Okhotsk Sea paleoceanography focused on sediment records <500 ka, and only few over 1 Ma (e.g., Nürnberg and Tiedemann, 2004; Matul et al., 2009; Chou et al., 2011; Nürnberg et al., 2011; Yamazaki et al., 2013; Lattaud et al., 2019). Core MD01-2414, which was cored from the central Okhotsk Sea in 2001, constitute the longest sediments record in this sea. Chou et al. (2011) reported the paleomagnetic results and paleoenvironmental implications of this core, which proposed a maximum age of about 1800 kyr. Lo et al. (2018) modified the age model by correlating the XRF scanning data with marine isotope LR04 stack (Lisiecki and Raymo, 2005), radiocarbon dating, bio-stratigraphic constrain, and revised the age interval to ∼1550 ka.
In this study, we focus on the interpretation of magnetic records, biogenic and chemical environment proxies to further improve the knowledge of type and provenance of terrigenous magnetic particles and their grain-size/concentration variations in response to environmental change in the central Okhotsk Sea over the last 1550 ka.
Regional Setting
The Okhotsk Sea is surrounded by the Siberian continent (Russian Far East), Sakhalin Island, Hokkaido Island, the Kuril Islands and the Kamchatka Peninsula (Figure 1). The regional current system is mainly driven by the counterclockwise Okhotsk Gyre, which includes the West Kamchatka Current (WKC) in the east and the East Sakhalin Current (ESC) in the west. The water of Pacific flows into Okhotsk Sea from the Krusenstern Strait and flows out from the Bussol Strait, respectively. The Soya Warm Current brings salty-warm water from the Japan Sea into the southern region. The Amur River supplies freshwater input from the Tartar Strait (Figure 1).
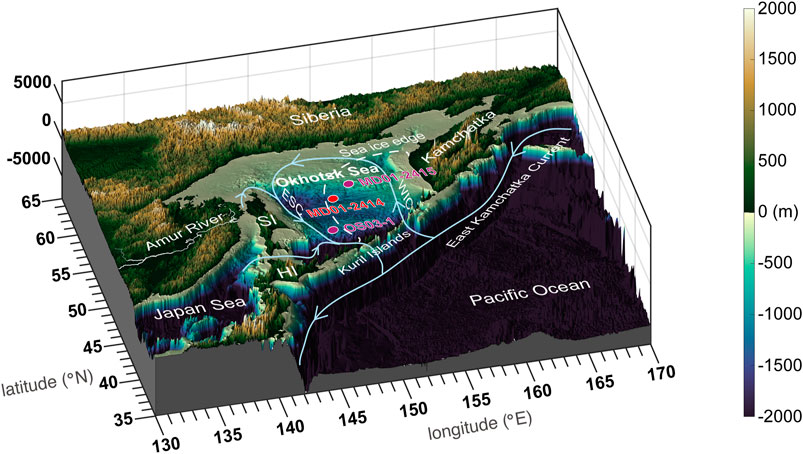
FIGURE 1. Topography map of Okhotsk Sea showing the locations of study core MD01-2414 (red cycle) and reference cores (MD01-2415 from Nürnberg and Tiedemann, 2004; OS03-1 from Zou et al., 2015). Arrows indicate the ocean surface currents in sea (WKC: West Kamchatka Current; ESC: East Sakhalin Current). The present edge of sea-ice limits from March to April is shown by a white dash line (After Shiga and Koizumi, 1999). SI, Sakhalin Island; HI, Hokkaido Island.
The Okhotsk Sea is the southernmost and the largest region in the world of modern seasonal sea ice formation (Kimura and Wakatsuchi, 1999; Harada et al., 2014; Nishioka et al., 2014). In present days, seasonal sea ice cover forms over Okhotsk Sea in both its northern and western parts (e.g., Shiga and Koizumi, 1999) (see Supplementary Figure S1A). During modern-day winters, the development of sea ice over the Okhotsk Sea generates the formation of the Dense Shelf Water (DSW) which will then act as the source of the Okhotsk Sea Intermediate Water (OSIW). OSIW provides water masses enriched in both O2 and Fe2+ to the North Pacific Intermediate Water, which supplies nutrient-enriched and well-ventilated intermediate water into the North Pacific (present day observation; see Supplementary Figure S1). This process influences the biological CO2 drawdowns in the world (Lembke-Jene et al., 2017, 2018; Nishioka et al., 2013; 2020). The variation of both sea surface temperature and sea surface salinity in the Okhotsk Sea are also related to sea ice formation during the winter. High freshwater input from the Amur River decreases the sea surface salinity in the western region of the Okhotsk Sea during summer (e.g., Harada et al., 2008) (present day observation; see Supplementary Figure S1). The sources of terrigenous detrital materials include the Amur river drainage, Ice-Rafted Debris (IRD), eolian dust, and volcanic eruptions (Nürnberg and Tiedemann, 2004; Zou et al., 2015).
Materials, Age Model and Methods
Materials
Core MD01-2414 (53°11.77′N, 149°34.80′E, water depth 1,123 m) was taken from a giant piston corer in 2001 in the Derugin Basin (central Okhotsk Sea) with a total length of 52.76 m (Figure 1). The sediments are dominated by detrital materials (from sand to clayed silts, clays with drop stones and ash layers) with few diatoms and foraminifera (Bassinot and Baltzer, 2002; Lo et al., 2018). The sediment color varies from dark greenish gray to olive gray with spotted dark dots.
Age Model and Updated Magnetostratigraphy
The age model of the study core has been constructed by Lo et al. (2018) based on a combination of various dating methods, including astronomical orbital tuning between LR04 (Figure 3A; Lisiecki and Raymo, 2005) and log (Ba/Ti) ratio (Figure 3B; Lo et al., 2018), and with supports of Accelerator Mass Spectrometry (AMS) 14C dating, paleomagnetic polarity transitions and a biostratigraphic event. Details of tuning please refer to Lo et al. (2018); see next section. Tuning tie points are given in Supplementary Table S1. The average sedimentation rates are ranged from 9.5 cm/kyr (upper 235 cm), which is mainly due to the stretch of piston coring process to 2–4 cm/kyr. The paleomagnetic result presents that the bottom of the core is identified at the Gilsa geomagnetic excursion with the age of 1552 ka (Figure 2). The marine sediments from core MD01-2414 cover centennial to millennial-scale temporal-resolved and continuing paleomagnetic records, as well as, natural climatic and environmental variability of central Okhotsk Sea since 1550 ka. All environmental parameters reported in this study show an apparent glacial/interglacial variability compared with LR04-MISs (Figure 3) (detailed information of the age model is shown in Supplementary Figures S2, S3).
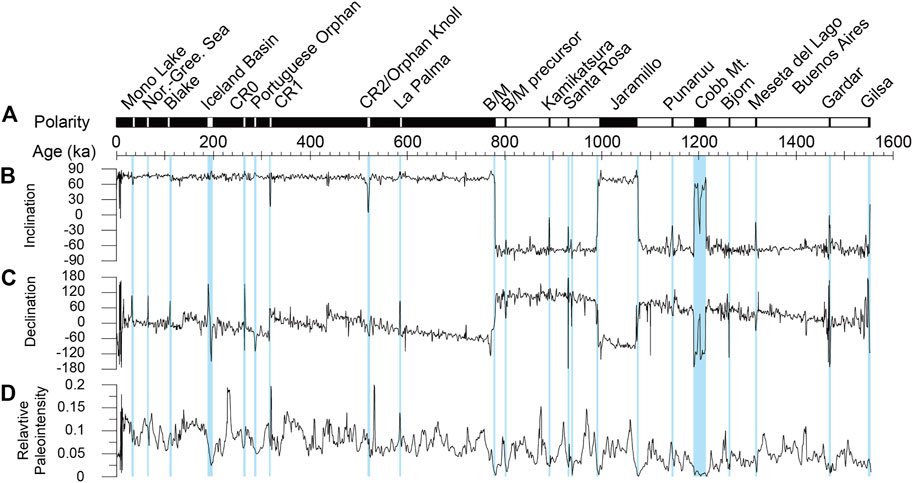
FIGURE 2. Temporal variation trends of (A) magnetostratigraphy, (B) inclination, (C) declination and (D) relative paleointensity of core MD01-2414. The new age model is based on Lo et al. (2018). Field reversal and geomagnetic excursion events were marked by blue bars.
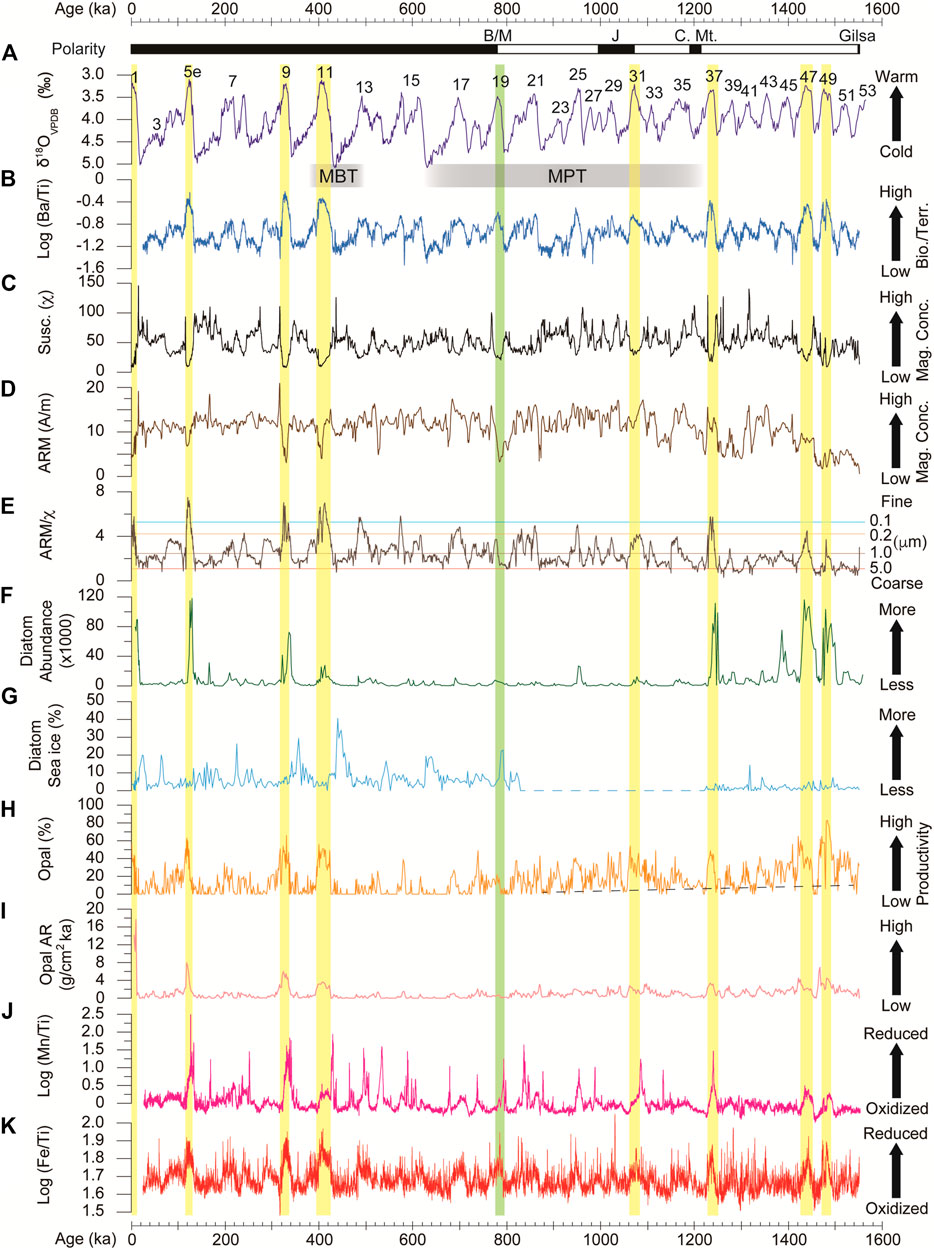
FIGURE 3. Temporal variation of environmental proxy results from marine sediment core MD01-2414 are compared to the marine oxygen isotope record reported by Lisiecki and Raymo (2005) since 1550 ka. Stronger interglacial periods are marked by yellow bars. Mid-Pleistocene Transition (MPT) and Mid-Brunhes Transition (MBT) are marked by Gray bars. MIS 19 is marked by green bar. (A) marine oxygen isotope (B), log (Ba/Ti), (C) magnetic susceptibility (χ), (D) anhysteretic remanent magnetization (ARM), (E) ARM/χ, (F) diatom abundance values, percentage of sea ice diatom assemblages (G) and Opal (H,I) Opal accumulation rate (AR) (J) log (Mn/Ti), and (K) log (Fe/Ti).
We propose here to improve the accuracy of the magnetostratigraphic library of Chou et al. (2011) with a new age model (Figure 2). The Matuyama-Brunhes boundary, Jaramillo subchron, and Cobb Mountain subchron can be characterized from paleomagnetic direction (Figures 2B,C) and relative paleointensity (Figure 2D) records. Despite the very low sedimentation rate in this core (i.e., ∼3.4 cm/kyr in average) making it more difficult to distinguish the geomagnetic excursions (e.g., Channell and Guyodo, 2004; Roberts and Winklhofer, 2004), we identified seventeen geomagnetic excursions. All these excursions were already reported in marine sediment cores from various sites (e.g., Lund et al., 2006; Singer, 2014; Channell et al., 2020). The model of post-depositional remanent magnetization lock-in process shows that no excursions (with 1 kyr duration) were recorded during the periods of low sedimentation rates (<3 cm/kyr) for a lock-in depth of 10 cm (Roberts and Winklhofer, 2004). The excursion records of MD01-2414 may be due to thinner lock-in depth (<10 cm) within the sediments than that had reported in the other studies (e.g., Suganuma et al., 2010, 2011; Horiuchi et al., 2016; Valet et al., 2019). From the youngest to the oldest, those excursions are Mono Lake (32 ka), Norwegian-Greenland Sea (65 ka), Blake (110 ka), Iceland Basin (195–188 ka), CR0/8α (264 ka), Portuguese Orphan (286 ka), CR1/9β (317 ka), CR2/13α or Orphan Knoll (519 ka), La Palma (584 ka), Matuyama-Brunhes precursor (802 ka), Kamikatsura (891 ka), Santa Rosa (two events at 930 and 937 ka), Punaruu (1145 ka), Bjorn (1262 ka), Meseta del Lago Buenos Aires (1317 ka), Gardar (1468 ka), and Gilsa (1552 ka). The revised well-dated result presents a complete paleomagnetic stratigraphy since 1552 ka (Table 1).
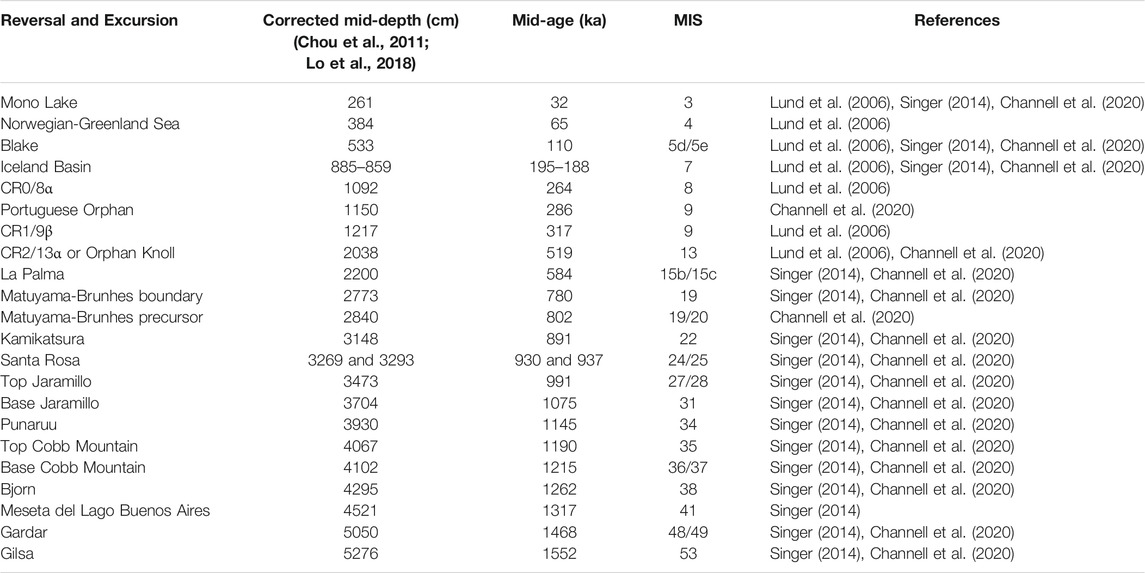
TABLE 1. Age estimates (ka) for field reversals and geomagnetic excursions of MD01-2414 paleomagnetic record.
Methods
Rock Magnetic Analyses
This core was cut into 36 sections with a length of 1.5 m for each section, U-channels were sampled in the central part of each section. Magnetic measurements of U-channel samples were measured by the Bartington MS2 magnetic susceptibility system with an ASC auto-tracking rail and a cryogenic magnetometer (2G 755 SRM) in the shielding room of the paleomagnetic laboratory at the Institute of Earth Sciences, Academia Sinica, Taiwan. The Anhysteretic Remanent Magnetization (ARM) was applied with a DC bias field of 1 Gauss under a 100 mT alternating field. All U-channel measurements are within 1 cm interval.
First-Order Reversal Curve (FORC) diagrams were measured under room temperature by using a Vibrating Sample Magnetometer (Micromag VSM 3900) at the Institute of Geology and Geophysics, Chinese Academy of Sciences. For each sample, a total of 100 FORCs were measured with a positive saturation field of 1 T, an increasing field step (δH) of 1.84 mT, and an averaging time of 500 ms following the protocol as described by Roberts et al. (2000). FORC diagrams were produced using FORCinel version 1.18 software, with a smoothing factor of 4 (Harrison and Feinberg, 2008). In a FORC diagram, coercive field (Bc) and magnetostatic interaction field (Bi) are indicated on the horizontal and vertical axes, respectively.
Micromorphology Observation
Most of the sediment samples of MD01-2414 show the same magnetic mineralogy, the major magnetic mineral is magnetite (Chou et al., 2011). To investigate morphology of the ferromagnetic mineral (i.e., magnetite), we studied in detail the terrigenous detrital materials of one representative sample from one interglacial interval, MIS 5e, which was extracted at depth of 628 cm (118 ka, Marine Isotope Stage, MIS 5e) with a conventional extraction method (Li et al., 2012; Jiang et al., 2020). The origins of these materials include the Amur River drainage, Ice-Rafted Debris (IRD), eolian dust, and volcanic eruptions; note that the input from Amur River drainage decreased during glacial intervals. To observe the “coarse” (i.e., ∼0.1–5 μm) ferromagnetic particles, the synchrotron Transmission X-ray Microscope observation was performed at the BL01B beamline with up to 30 nm resolution of Taiwan Light Source (TLS, beam energy 1.5 GeV, current 360 mA) at the National Synchrotron Radiation Research Center (NSRRC), Hsinchu, Taiwan (Wang et al., 2015). The coarse ferromagnetic extracts were dried on a Kapton tape and images were obtained under phase contrast mode with a 15 μm × 15 μm image frame.
A small drop of ethanol (2 μL) containing ferromagnetic extracts was dried on a carbon-coated copper grid for Transmission Electron Microscope (TEM) observations at the Institute of Geology and Geophysics, Chinese Academy of Sciences, Beijing, China. The samples were examined by TEM (JEOL JEM-2100) with an accelerating voltage of 200 kV. Selected Area Electron Diffraction (SAED) patterns were recorded from a group of fine grained ferromagnetic particles at various camera lengths, and Energy Dispersion Spectrum (EDS) was carried out to detect elemental composition. Digital micrograph software was used for image processing.
Liu et al. (2006) reported the appearance of dolomite at MISs 1, 5, 9, 11, and 13, which is generally associated with a bacterial reduction of sulfate. In this study, three samples from different interglacial intervals (i.e., MISs 5e, 9, and 11) were selected for Scanning Electron Microscope (SEM) analysis. Few freeze-dried sediment powder of each sample was dispersed in ethanol and dried on conducting resin, then observed by a Zeiss SIGMA field-emission SEM with an operation voltage of 15 kV at the Southern University of Science and Technology, Shenzhen, China. The elemental analysis (INCA1, Oxford) was performed with a semi-quantitative Energy-Dispersive X-ray Spectroscopy (EDS) system attached to an SEM operating at 20 kV, with a collection time of 30 s.
Diatom Floral Assemblage and Opal Accumulation Rate
Concerning the characterization of diatom, this whole core was subsampled at a 1 cm interval and analyzed at a 5 cm resolution. One-gram dry weight sediment was chemically treated by 10% HCl and 30% H2O2 to discard calcium carbonate components and organic matter (Wang et al., 2014). Pleurax was used as the mounting medium to make the permanent slide. The diatom valves were counted at magnifications of 1000×; at least 400 valves were counted per sample when possible. Percentages are based on the total diatom sum. Note that only the diatom abundance was estimated for samples with poor diatom preservation (<100 diatom valves); they were not included for the discussions of sea ice diatom percentages. The diatom assemblages in the Okhotsk Sea surface sediments are strongly influenced by oceanic conditions, such as the sea ice coverage (Koizumi et al., 2003). The identification of diatom species and their ecological interpretation is based on the previous research of surface sediments of Okhotsk Sea (Shiga and Koizumi, 1999; Koizumi et al., 2003). Wang and Wang, (2008) characterized 13 dominated diatom species in MD012414 and categorized them into different assemblage to reflect the sea ice condition during the last 50 ka: the sea-ice assemblage (Bacterosira bathyomphalus, Fragilariopsis cylindra, F. oceanica, Thalassiosira antarctica, and T. nordenskioldii), the high-productivity assemblage (Neodenticula seminae, T. latimaginata, and Thalassiothrix longissima), and the open-ocean assemblage (Rhizosolenia hebetata, R. styliformis, and Actinocyclus curvatulus). We used the same categories of diatom species to distinguish the different intervals in this study: sea ice and high-productivity assemblages indicate the perennial ice-cover and seasonal ice-cover, respectively, whereas the open-ocean assemblage is assumed to be coeval to periods in which the Okhotsk Sea is devoid in ice-cover.
We present both opal content and accumulation rate (AR). Opal AR is calculated by opal content (%; Lo et al., 2018) × bulk density (g/cm3; Bassinot and Chen, 2002) × linear sedimentation rates (cm/kyr; Lo et al., 2018).
X-Ray Fluorescence Scanning
Iron and Manganese are abundant transition metals, and their oxides can provide information of redox reactions in natural environments (e.g., Naeher et al., 2013; Huang and Zhang, 2020). Their abundances were estimated by using non-destructive X-ray Fluorescence (XRF) scanning technique. Continuous downcore measurements of element variations were performed in the ITRAX XRF Core Scanner Laboratory, Department of Geosciences, National Taiwan University (Huang et al., 2016). All U-channels were scanned by using the 3 kW Mo source and were analyzed at 30 kV/24 mA, 2 mm resolution with an exposure time of 30 s. The count value of each element was calculated from element peak areas of original XRF spectra by the Q-Spec software provided by COX Analytical Systems.
Results
Environmental Magnetic Parameters
The bulk magnetic susceptibility (labeled as χ) and ARM/χ results of the core MD01-2414 were already presented by Chou et al. (2011) and included in Figure 3; here we added the bulk ARM results in the figure. Magnetite is the dominant magnetic mineral in the marine sediments of Okhotsk Sea (Chou et al., 2011). χ presents the variation of magnetic abundance with values in the range of 20–150 × 10−6 SI; some of the highest values appear to correlate with the occurrence of ash layers. ARM is also a proxy of magnetic abundance which is sensitive to the fine grain (single-domain, SD, <100 nm) magnetite contribution (Thompson and Oldfield, 1986), with value between 1.5 and 20 A/m. ARM/χ ratio is a proxy of relative grain size of magnetite, high/low values refer to fine/coarse grain (King et al., 1982). The variations of χ and ARM/χ of this core show a consistent relationship with global marine oxygen isotope (Figures 3A–C). High χ values with coarse magnetic grains (ARM/χ between 1 and 2, grain size >1.0 μm) are observed at the oxygen isotope stages of the glacial intervals and low χ value with fine magnetic grain (ARM/χ between ∼3 and 7.5, grain size <1 μm) is found at interglacial intervals, respectively (Figure 3E, Supplementary Figure S4). Two main trends characterize the variations of ARM over time: it evolves similarly with oxygen isotope stages before 400 ka and respectively show low/high values at glacial/interglacial intervals, whereas significant decreases of the ARM values mark the interglacial intervals after 400 ka (i.e., MISs 1, 5e, 9, 11).
Diatom and Opal
Results of diatom abundance, sea ice related diatom abundance (%), opal data, and opal accumulation rates of the sediment from core MD01-2414 are detailed in Figures 3F–I. Drastic increase of diatom abundance can be observed during the interglacial intervals MISs 1, 5e, 9, 11, 37, 45, 47, and 49 (Figure 3F). Note that the lack of data for MISs 20–36 are due to poosr occurrence or preservation of diatoms (see Diatom Floral Assemblage and Opal Accumulation Rate section). The percentage of sea ice assemblages dominated during the glacial intervals after MIS 20, but present relatively lower values during the glacial intervals before MIS 36 (Figure 3G). Sedimentary opal concentration is a proxy of marine siliceous bio-productivity (e.g., Keigwin et al., 1992; Keigwin, 1998). In this contribution, we use the diatom abundance, opal data from Lo et al. (2018) together with our opal accumulation rates as the proxies of productivity. Even though the opal contents were quite variable during the glacial intervals, the greatest concentration of opal generally occurs during the interglacial intervals in the central Okhotsk Sea; the highest opal values correspond to the super and stronger interglacial intervals (Figures 3H,I).
Core Scanning Results
Log metric results of elemental counts ratio were normalized by titanium from XRF core scanning in order to prevent the potential signal saturation effect (e.g., Huang et al., 2016; Lo et al., 2018). The variation of manganese- and iron-oxides content can be considered as a proxy of bottom water redox condition (Huang and Zhang, 2020). Mn/Ti ratio ranges from ∼0 to 2.4 in log scale that shows strong variability in glacial/interglacial cycles in the last 1550 ka. The greatest values occurred during the stronger interglacial intervals such as MISs 5e, 9, 11 (Melles et al., 2012; Coletti et al., 2015; Head and Gibbard, 2015; Petrick et al., 2015; Past Interglacials Working Group of PAGES, 2016) (Figure 3J). Fe/Ti ratio shows relatively small variability (i.e., ∼1.6 to ∼1.9) in the whole log scale when compared to log (Mn/Ti) ratio; the latter reveals higher values during the stronger interglacial intervals (Figure 3K).
Magnetic Analyses and Microscopy Observation of Magnetic Particles
We combined the magnetic analysis and microscopy observations results to characterize the type, size, and origin of ferromagnetic particles, as well as their paleoenvironmental implications. Chou et al. (2011) already demonstrated that magnetite is the predominant magnetic carrier in the sediments of core MD01-2414.
Magnetic Analyses
FORC diagrams can provide information of different magnetic components even in the cases of complicated magnetic mineral assemblages (e.g., Roberts et al., 2000). Examples of FORC results of MD01-2414 sediments for one glacial interval (MIS 2; Figure 4A) and two interglacial intervals (MISs 5e and 9; Figures 4B,C) are presented in Figure 4. The three samples show a manifest “central-ridge” signature at Bc between 5 and 60 mT, indicative of SD, and thus fine-grained (i.e., <100 nm), magnetic particles such as biogenic ferromagnetic minerals and/or detrital ferromagnetic grains resulting from the erosion of their silica-host (e.g., Heslop et al., 2014; Chang et al., 2016; Li et al., 2020a). A wide-shape Bi signal in low coercivity (Bc <40 mT) can also be observed in all samples, which indicates grain sizes larger than 100 nm, and thus either grains in the “vortex state” (previously called “pseudo-single domain”) for size in between 100-500 nm or multi-domain (MD) ferromagnetic particles (size >500 nm) (Roberts et al., 2017).
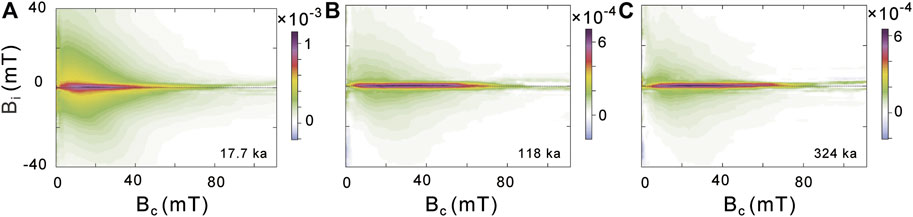
FIGURE 4. The First-order reversal curve (FORC) diagrams of three studied samples at 17.7 ka (MIS 2) (A), 118 ka (MIS 5e) (B), and 324 ka (MIS 9) (C), respectively. All samples show a clear “central-ridge” behavior. Bi, magnetostatic interaction field; Bc, coercive field.
Microscopy Observation
Three types of ferromagnetic particles from the sample of MIS 5e (from depth of 628 cm) were identified from microscopy observation. Synchrotron Transmission X-ray Microscope observations and TEM respectively revealed that the both coarsest ferromagnetic particles (∼500–5000 nm) and those in a size range of ∼50–100 nm are angular in shape (Figures 5A,B). We labelled those angular/irregular shaped ferromagnetic particles as Type-1. Type-2 ferromagnetic particles corresponds to “silicate-hosted” ferromagnetic mineral(s), represented by abundant nano-sized (<15 nm) inclusions of ferromagnetic grains embedded within silicates with angular morphology (Figures 5C,D); both hosts and inclusions (oxides) were characterized through EDS analysis (Figures 5E,F). Some Type-2 grains present crystal defects (Figure 5D). These ferromagnetic inclusions are probably magnetite. Type-3 ferromagnetic particles are nanometer magnetite aggregates (a few nm to ∼50 nm) composed of nano-sized single crystals of magnetite showing significant defects in their lattice (Figures 5G,H).
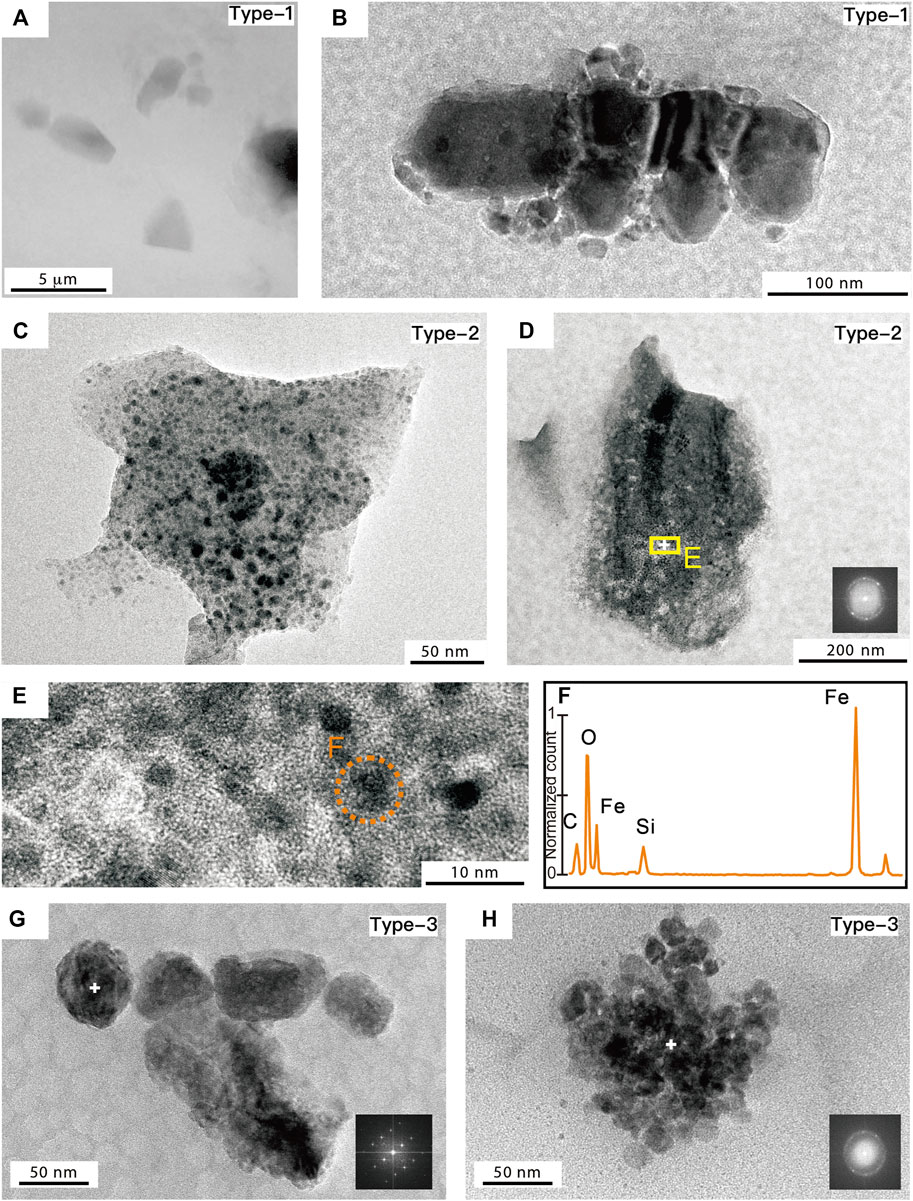
FIGURE 5. Images of microscopy observation of ferromagnetic particles extracted from one sample at depth of 628 cm (118 ka, MIS 5e). (A) Coarser particles (∼0.5–5 μm) can be observed by synchrotron Transmission X-ray Microscope. Those grains are angular in shape. (B) Image of Transmission Electron Microscope (TEM) presents fine extracted-magnetic particles (∼50–100 nm) in irregular shapes. (C–D) Silicate-hosted ferromagnetic minerals, represented by abundant nano-sized (<15 nm) inclusions of ferromagnetic grains embedded within silicates with angular morphology. (E) Enlargement image of (D) presents nano-sized (<10 nm) inclusions. The Selected Area Electron Diffraction (SAED) pattern of those inclusions presents significant crystal defects. (F) Energy-Dispersive X-ray Spectroscopy (EDS) analysis of selected area in (E) reveals that those inclusions contain abundant Fe and O. (G) Image of nanometer ferromagnetic aggregates (∼50–100 nm) showing single crystals with significant crystal defects. (H) Image of smaller nanometer-sized ferromagnetic aggregates (a few nm to ∼20 nm) reveals randomly oriented single crystals. The type of each ferromagnetic particle is specified in each photo; see text for further explanations.
The SEM images of samples from the three recent “strong” interglacial samples (MISs 5e, 9, and 11) present abundant axiolitic/microspheric aggregates with the size ranging from 5 to 30 μm; some are located within diatom frustules (Figures 6A–C). These aggregates are micro-sized crystals composed of Fe and S (Figures 6D–F), and are likely framboidal pyrite. In the EDS analysis in Figures 6D–F, the O and Si signals were also detected due to the small size of the framboids and probably belong to the silicate fragments surrounding the diatom.
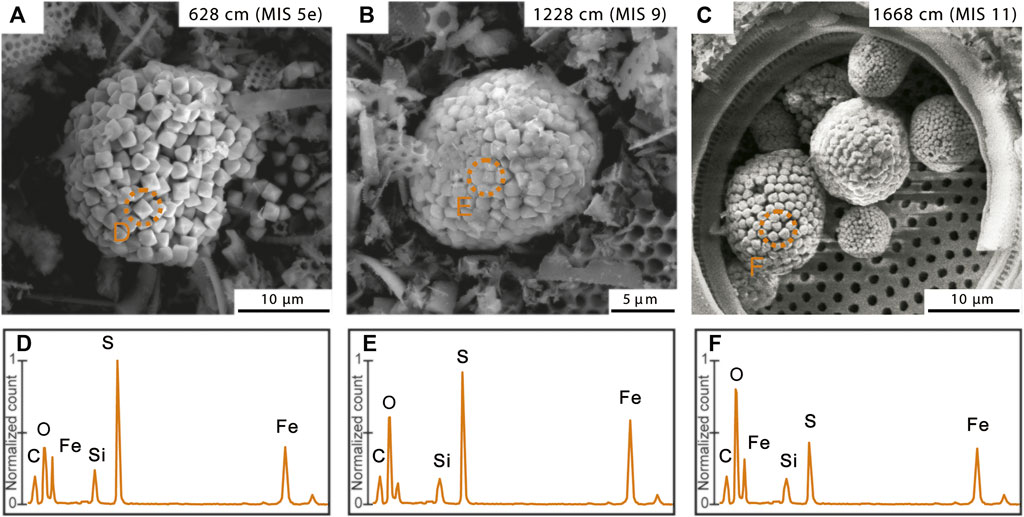
FIGURE 6. Scanning Electron Microscope (SEM) images and related Energy-Dispersive X-ray Spectroscopy (EDS) analyses of three interglacial samples at depth of 628 cm (MIS 5e) (A–D), 1128 cm (MIS 9) (B–E), and 1668 cm (MIS 11) (C–F). Each sample contains various-sized framboidal pyrites within the diatom frustules.
Discussion
Type and Origin of Ferromagnetic Particles in the Sediments of Central Okhotsk Sea
To study the paleoenvironmental variations of the central Okhotsk Sea, the terrigenous sources and the different types of sediments must be characterized. The type of ferromagnetic minerals within sediments is a proxy of these sources and can thus help to trace and identify the origin of the detrital materials. In the selected representative sample, MIS 5e, we identified through microscopic observation three main different main types of ferromagnetic (labelled Type-1 to Type-III), but all correspond to the same unique mineral: magnetite. Previous magnetic study of the sediment core MD01-2414 reported that magnetite is the predominant ferromagnetic mineral whatever the depth (Chou et al., 2011). FORC results of central Okhotsk Sea sediments (Figure 4 in this study; Yamazaki et al., 2013) also show similar magnetic properties at different depths. Note that pyrite (pyrite framboids are discussed in the Core Scanning Results section) is not a ferromagnetic mineral.
Type-1 is represented by angular/irregular particles (Figures 5A,B), with grain sizes larger than ∼50 nm which is in agreement with the FORC results and suggests that these grains are either SD and/or in the vortex state (Figure 4B). They are likely from detrital origin, which is related to erosion of magnetite-bearing igneous rocks from nearby sources (Li et al., 2020a). Type-2 corresponds to scattered nano-sized (<15 nm) magnetite inclusions within a silicate-hosted matrix (Figures 5C,D) showing that these magnetite particles are mainly in a superparamagnetic (SP) state or SD, for the largest ones. These domain states explain, at least partly, the “central-ridge” behavior of FORC results (e.g., Heslop et al., 2014; Chang et al., 2016; Li et al., 2020a). Igneous rocks are assumed to be the protolith of the silicate-hosted magnetite (Chang et al., 2016; Li et al., 2020a).
Type-3 ferromagnetic particles are nanometer (a few nm to ∼50 nm) magnetite aggregates (Figures 5G,H) and thus also either SP or SD. Some large grains (∼50 nm) are arranged into chain structures which resemble magnetosomes (Figure 5G) but are actually not magnetite magnetofossils because they contain crystallographic defects which are untypical of biogenic magnetite (e.g., Li et al., 2020a; 2020b). Though Yamazaki et al. (2013) suggested the presence of biogenic magnetite in the sediments of central Okhotsk Sea based on FORCs data and isothermal remanent magnetization component analysis, we did not find any actual magnetosome through TEM observation. Finally, smaller magnetite aggregates correspond to rounded magnetite aggregates (Figure 5H), with individual grain size from a few nm to ∼20 nm and thus dominantly SP. Li et al. (2020a) observed similar kinds of SP magnetite aggregates from the sediments of the central Pacific Ocean, but their true origin remains unknown. In this study, we observed that the morphologies of Type-3 grains are similar to the magnetite inclusions of Type-2 and likely share the same origin: these magnetite inclusions are probably issued from erosion of their silicate hosts.
To sum up, all ferromagnetic particles within the sediments in the central Okhotsk Sea are from detrital origin, result from the erosion of igneous rocks and thus probably mainly stems from the Kamchatka Peninsula or Okhotsk-Chukotka volcanic belt (e.g., Wang et al., 2021), which are the largest and closest volcanic regions around the Okhotsk Sea. The grain size distribution and concentration of ferromagnetic particles within sediments could reflect the variation of terrigenous transportation processes which were influenced by environmental changes.
Paleoenvironment in the Central Okhotsk Sea During Glacial Intervals
In the southeastern Okhotsk Sea, since 350 ka the marine productivity decreased while the proportion of coarse sediments with a high magnetic susceptibility accumulated during glacial intervals increased (Gorbarenko et al., 2002). Nürnberg et al. (2011) provided a scenario of sea ice coverage and glaciation on the Kamchatka Peninsula during glacial intervals: the highly dynamic sea ice expansion leaded to high accumulation rate of sea-ice supplied ice-rafted debris (sea-ice-IRD) from coastal sources into the sea basin. Glaciers from the west of Kamchatka Peninsula gradually developed until reaching Okhotsk Sea where they split to form icebergs that derived toward the eastern part of the sea and increased the supply of iceberg-rafted debris (iceberg-IRD). Geochemical analyses of marine sediments in the Okhotsk Sea revealed another source of terrigenous materials: the eolian dust from Chinese loess Plateau which especially is substantial during glacial intervals (Nürnberg and Tiedemann, 2004; Zou et al., 2015). Yamazaki et al. (2013) suggested that the sea ice was also dynamic in the central Okhotsk Sea during glacial intervals, and can thus enhance both the IRD accumulation and the input of coarse and high magnetic particles. The magnetic proxies presented in this study conform with these two assumptions; during glacial intervals the dynamic sea ice and icebergs can carry large quantity of sediments until the central part of the sea basin, including the coarse magnetite grains issued from igneous rocks of Kamchatka Peninsula (Figures 3C–E). The stronger “vortex contribution” of glacial period samples (Figure 4A) than the interglacial samples (Figures 4B,C), also support a larger size of ferromagnetic grains during glacial intervals.
The concentration of sea ice diatoms became significant near the beginning of the MPT (∼900 ka), especially during glacial intervals only after MIS 20 (i.e., 814 ka), related to an abrupt increase in Antarctic ice volume (Elderfield et al., 2012); before, they are either in low-concentration or even near-absent (Figure 3G). However, the lack of sea ice diatom during the glacial intervals between ∼1200 ka and ∼900 ka might be due to full coverage of seasonal sea ice (even perennial sea ice from the extent of mountain glaciers on Kamchatka Peninsula during specific glacial intervals) in the central part of Okhotsk Sea (e.g., Nürnberg et al., 2011). Nürnberg and Tiedemann (2004) reported the existence of IRD and drop stones during this period in the sediment core from Okhotsk Sea, evidencing the occurrence of sea ice. Overall, the concentrations of sea ice diatom (Figure 3G) and opal (Figures 3H,I) in the core MD01-2414 show opposite trends; the low opal content/AR during glacial intervals highlights low marine productivity during such intervals. The opal concentration during glacial intervals also globally decreased after the beginning of the MPT; this implies a decrease of marine productivity during the glacial intervals after 900 ka. Those phenomena suggest a shorter duration of sea ice coverage during the pre-MPT glacial intervals, during those periods, the sea-ice-IRD supplied coarser terrigenous material, with a high-χ, into the sea basin.
The sea ice formation produced a large volume of cold brine sea water, which generated the Dense Shelf Water (DSW) as the source of Okhotsk Sea Intermediate Water (OSIW), and further enhanced the deep water ventilation (Iwasaki et al., 2012; Max et al., 2014; Bubenshchikova et al., 2015; Zou et al., 2015). The fresh OSIW flowed to the deepest parts of the basin while carrying high concentrations of dissolved oxygen. The redox index of log (Mn/Ti) and log (Fe/Ti) are low during glacial intervals (Figures 3J,K), which indicate an oxic state of bottom water and conform to the previous interpretation (Iwasaki et al., 2012; Max et al., 2014; Bubenshchikova et al., 2015; Zou et al., 2015).
Based on the results from the literature and this study, we propose in Figure 7 a model of general evolution of Okhotsk Sea during glacial intervals, including oceanographic conditions and terrigenous transportations. During glacial intervals, the northern and western region of Okhotsk Sea was covered by perennial sea ice. Considering the development of sea ice, marine productivity declined. The formation of sea ice, however, enhanced the production of the DSW which carried high dissolved oxygen into the OSIW. Mountain glaciers of the Kamchatka Peninsula could extend to sea level and form icebergs that drifted to the eastern region of Okhotsk Sea. Those mobile icebergs carried many iceberg-IRD, including coarse and high magnetic terrigenous detritus, to the central Okhotsk Sea basin.
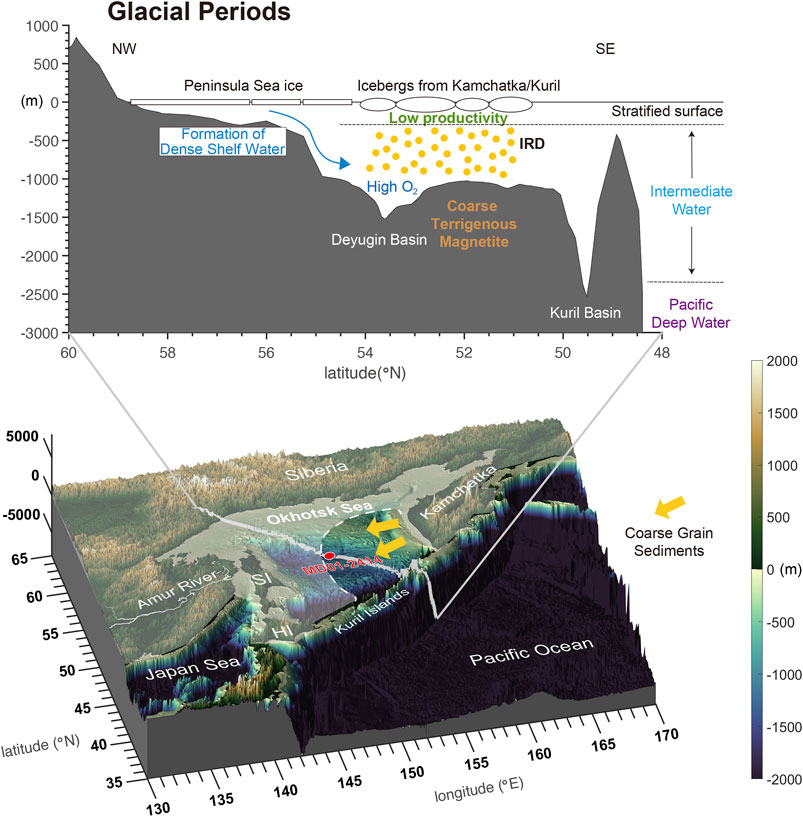
FIGURE 7. Schematic cross-section and view of Okhotsk sea displaying the terrigenous transportations and oceanographic conditions during glacial periods.
Paleoenvironment in the Central Okhotsk Sea During Stronger-Interglacial/Interglacial Intervals
During interglacial intervals, the sea ice from the preceding glacial interval completely melted and development of new sea ice was only seasonal at best. High biogenic productivity and fine sediments with a low IRD content and MS were formed in the interglacial intervals (Gorbarenko et al., 2002, 2012). The proportion of terrigenous sediments from the Siberian continent increased compared to the glacial intervals (Nürnberg et al., 2011; Iwasaki et al., 2012; Khim et al., 2012; Jimenez-Espejo et al., 2018). The proportion of ferromagnetic grains among the fine grained material is, yet, relatively lower. χ, ARM/χ and LR04-MISs evolve similarly; for instance, low χ and fine magnetite grain size (ARM/χ) correlate with low δ18O value (i.e., warmer period). The super-interglacial intervals (e.g., MISs 1, 5e, 11, 31, 47, 49; Melles et al., 2012; Coletti et al., 2015; Head and Gibbard, 2015; Petrick et al., 2015; Past Interglacials Working Group of PAGES, 2016) present relative low abundance and finer ferromagnetic grains (Figures 3A–E). Note that, although MISs 9 and 37 are not super-interglacial intervals, they show a similar behavior as those intervals in the study area (Figure 3).
MIS 19c (green bar in Figure 3) is a peculiar interglacial interval as it shows similar orbital pattern as the present (e.g., Tzedakis et al., 2012; Giaccio et al., 2015; Suganuma et al., 2018). Increase of ferromagnetic particle sizes and sea ice formation and decrease of biogenic productivity occurs at the transition from MIS 20 to MIS 19, suggesting a sudden event. Similar coeval potential cooling event was also observed in the sediment records from Lake Baikal, Lake El’gygytgyn, the Chinese loess–paleosol sequences, and in central Japan as well (e.g., Suganuma et al., 2018).
During most periods, including the glacial intervals, ARM values correlate well with the grain size of magnetite: fine grains are associated with high ARM values in (interglacial intervals) and, reciprocally, coarse grains with low ARM values (glacial intervals). This indicates that smaller ferromagnetic grains (and thus SD) were transported into the central Okhotsk Sea during the warmer periods. However, significant decreases of the ARM values are associated with the last four “strong” interglacial intervals (i.e., MISs 1, 5e, 9, and 11), indicating a diminution of ferromagnetic grains input among the sediments during these periods (Figure 3D). On the other hand, high ARM/χ characterize these four periods (Figure 3E), evidencing that the remanence of these sediments is still dominantly carried by the fine-grained ferromagnetic minerals, which are even much smaller than during other interglacial intervals. Those four strong interglacial intervals, which occurred after the MBE (∼400 ka; e.g., Jansen et al., 1986; Yin and Berger, 2010; Cronin et al., 2017), probably had distinctive environments compared with previous interglacial intervals. Three main reasons may explain the lower input of fine ferromagnetic grains during those post-MBE strong interglacial intervals: 1) the dilution of magnetic concentration by blooming of plankton fossil deposition, 2) the dissolution/alteration of fine grain ferromagnetic particles under anoxic bottom water condition, or 3) a variation of terrigenous sediments input to the central Okhotsk Sea due to environmental change(s).
In the first hypothesis, the high input of siliceous plankton fossils diluted the fine grain ferromagnetic mineral concentration. Result of diatom/opal occurrence from previous studies (e.g., Nürnberg and Tiedemann, 2004; Iwasaki et al., 2012; Khim et al., 2012; Lo et al., 2018) and this study show that high biogenic productivity occurred during deglaciation of strong interglacial intervals (e.g., MISs 1a, 5e, 9c, and 11c; Nürnberg and Tiedemann, 2004). The diatom abundance during super-interglacial intervals can increase tens to hundred times compared to the glacial intervals (Figure 3H). High biogenic fragments can be predominant in the sediments and dilute the magnetic contribution (χ, Figure 3C). However, some high biogenic productivity interglacial intervals such as MISs 31, 37, 47, and 49, are associated with an increasing ARM compared to the result of MISs 1, 5e, 9, and 11 (Figures 3D,F,H,I). Such divergence is in inadequacy with the first hypothesis but yet indicates that multiple environmental mechanisms changed the ferromagnetic input during warm periods.
Regarding the second hypothesis, it is assumed that the finest ferromagnetic grains (i.e., the nano-sized magnetite) were dissolved/altered under anoxic bottom water condition. Through their study of the present water column from northeastern Okhotsk Sea to low latitude northwestern Pacific, Nishioka et al. (2013) revealed that Okhotsk Sea is the important source of dissolved iron to subarctic North Pacific via the OSIW. The sea ice formation on the northwestern continental shelf in winter generates a DSW that disturbs and resuspends the sediments and then provides dissolved iron into the OSIW. Nishioka et al. (2013) also suggested that particles of volcanic origin from the Kamchatka Peninsula might be the source of dissolved iron even though the actual process and mechanism remain unknown. Based on the results presented here, we think that the high biogenic production during interglacial intervals (Figures 3F–I) yielded the elevated contents of organic matter in the sediments (e.g., Iwasaki et al., 2012). The microbial decay reactions therefore led to the exhaustion of dissolved oxygen in bottom water (Wakeham, 2020). The lesser sea ice formation (Figure 3G) also weaken the seawater ventilation, leading to a decrease of the oxygen supply into deep water in the center of Okhotsk Sea (Zou et al., 2015; Lembke-Jene et al., 2017, 2018; Jimenez-Espejo et al., 2018). Both processes may cause the pore water gradient in the sediments changing from suboxic to anoxic condition.
Under anoxic conditions (reducing environments), the redox reactions of manganese- and iron-oxides are favored toward their reduced forms (i.e., Mn2+ and Fe2+), and become more dissolved in the water (e.g., Burdige, 1993; Huang and Zhang, 2020). The mobile Mn2+ could migrate from the pore water of sediments and alter to an oxic state at the oxic/post-oxic boundary, and then precipitate as manganese oxyhydroxides. This process leads to enrichment of manganese content in the sediments. The log (Mn/Ti) ratio of XRF core scanning is relatively high during interglacial intervals (Figure 3J), which inferred a reduced or anoxia condition in bottom water. Liu et al. (2006) made the same interpretation based on the geochemical analysis of core MD01-2414. By contrast, Fe2+ has low solubility and easily transforms to insoluble minerals such as siderite (FeCO3), iron monosulfide (FeS), and pyrite (FeS2) (e.g., Burdige, 1993). Both log (Fe/Ti) and log (Mn/Ti) are relatively high during interglacial intervals (Figure 3K). Interglacial samples contain abundant framboidal pyrite aggregates which lie inside the diatom frustules (Figure 6). Sulfate reducing bacteria, that propagated within the sedimented frustule, may be the source of the sulfide: they digested the diatom organic matter and created microenvironment where both the dissolved Fe2+ and sulfide are put in contacts to form framboidal pyrite aggregates (e.g., Hudson, 1982; Schieber, 2011). The appearance of framboidal pyrite aggregates support the idea that the iron dissolution occurring within the sediments in the central Okhotsk Sea can be considered as the source of dissolved iron in the OSIW during interglacial intervals.
Despite that the anoxic condition and iron dissolution match well with the second hypothesis, those phenomena still fail to explain the significant decrease of ARM values during the last four strong interglacial intervals. Two points remain litigious: 1) The redox indexes, log (Mn/Ti) and log (Fe/Ti) present significant high values during each interglacial interval, which is in inadequacy with the apparent ARM decreasing characterizing these intervals. 2) Three different types of magnetite were characterized within the MIS 5e sediments (see Environmental Magnetic Parameters section). The presence of nanometer-sized magnetite particles indicates that the fine grain magnetite was not totally dissolved during warm periods (Figures 5G,H). The silicate matrix surrounding the nanometer-sized magnetite inclusions (Figures 5C,D) can, furthermore, preserve it from dissolution under reducing conditions.
The third and last hypothesis is that a change(s) among the terrigenous deposits explain the lower SD ferromagnetic grains input into the central Okhotsk Sea. Previous studies reported contemporaneous (i.e., <500 ka) environmental changes during interglacial intervals such as decreasing of IRD (e.g., Nürnberg and Tiedemann, 2004; Gorbarenko et al., 2017) and the increasing of sea level (e.g., Thomas et al., 2009). The latter strongly modified the input of terrigenous sediments in the center of Okhotsk Sea (e.g., Liu et al., 2006; Nürnberg et al., 2011; Jimenez-Espejo et al., 2018). Nürnberg and Tiedemann (2004) pointed out a significant gradual decline of the IRD fraction and an increase of the <63 μm fraction from ∼400 to 600 ka within a sediment record in the central Okhotsk Sea. This offset may be related to the MBT (occurring between MIS 13/11) in which an increase in the amplitude of the 100 kyr climate cycles occurs: post-MBT interglacial intervals show warmer temperature and higher sea level compared to the pre-MBT interglacial intervals (e.g., Jansen et al., 1986; Yin and Berger, 2010; Cronin et al., 2017; Barth et al., 2018).
The paleoclimate records from the Chinese Loess Plateau reveal an extension of East Asian Summer Monsoon (EASM) domain area during interglacial intervals since MBT (Xu et al., 2020). The enhancement of EASM was due to the retreat of the northern hemisphere ice sheet provoking the northward shift of the Intertropical Convergence Zone (ITCZ) and the rise of sea-level (Xu et al., 2020). Meanwhile, coupled with the inhibition of cold air masses from the Arctic region to midlatitude, the northward expansion of EASM may have increased the atmosphere temperature in the region in and around the Okhotsk Sea. Such increase then enhanced the precipitation rate in the Amur River drainage area and, consequently, the freshwater input into the Okhotsk Sea (e.g., Nürnberg and Tiedemann, 2004; Harada et al., 2008; Khim et al., 2012; Lembke-Jene et al., 2017). In summer observation of present days, Amur River supplies large amounts of freshwater into northeastern Okhotsk Sea decreasing the sea surface salinity whose effect extends till the central Okhotsk Sea (see Supplementary Figure S1). Melting of Kamchatka mountain glacier may also be another source of freshwater input (Harada et al., 2008; Nürnberg et al., 2011).
Geochemistry results of marine sediments show that a major source of terrigenous materials and nutrients of the south-central Okhotsk Sea during interglacial intervals is the Amur River (Figure 5A of Zou et al., 2015; Figure 6 of Wang et al., 2021). During such intervals, the increase of water discharge from the Amur River provided greater amounts of terrigenous materials including fine but relatively poorer in ferromagnetic particles as those material comes from drainage areas of the river (Zou et al., 2015), which are dominated by sedimentary rocks (Zhao et al., 2018). Meanwhile the sea ice coverage in Okhotsk Sea was under open water conditions in the western region of the Okhotsk Sea or seasonal ice became shorter in its northeastern region. The ice-sheet retreat reduced both the number and size of icebergs and consequently the supply of coarse and abundant ferromagnetic mineral content (i.e., iceberg-IRD) from the Kamchatka Peninsula. Even though fine ferromagnetic particles were still carried into Okhotsk Sea by melting water from glaciers, their overall input decreased. Thus, the detrital input in the central Okhotsk Sea during the last four strong interglacial intervals is characterized by fine- and low ferromagnetic mineral concentration. All things considered, only the third hypothesis can explain the significantly decreasing ARM value during those strong interglacial intervals.
We propose in Figure 8 a model of general evolution of the terrigenous transportations and oceanographic conditions of Okhotsk Sea during interglacial intervals. In such periods, the sea ice on the central Okhotsk Sea was either seasonal or inexistent. The retreat of both the Kamchatka mountain glacier and the sea ice diminished the IRD accumulation in the central sea basin. The freshwater caused by melting of snow and/or glaciers from Siberia and Kamchatka carried fine grain sediments to the Okhotsk Sea. The sea ice retreat weakened the input of DSW, which in turn decreased the formation of OSIW and the bottom water ventilation, and consequently, reduced the supply of dissolved oxygen into deep water. The open ocean conditions and vertical mixing of intermediate water caused high marine productivity; large amounts of plankton debris were deposited in the sea basin. The microbial decay of organic matters depleted the dissolved oxygen and formed a reduced environment in the bottom water. Coupled with high concentration of dissolved Fe2+, the anoxia conditions generated the formation of framboidal pyrite in the sediments. Finally, during the last four strong interglacial intervals (MISs 1, 5e, 9, and 11), which are post-MBT, the active EASM enhanced 1) the freshwater discharge induced by the high precipitation rates in the Amur River drainage area, and 2) the supply of fine- and poor-ferromagnetic sediments to the central Okhotsk Sea basin.
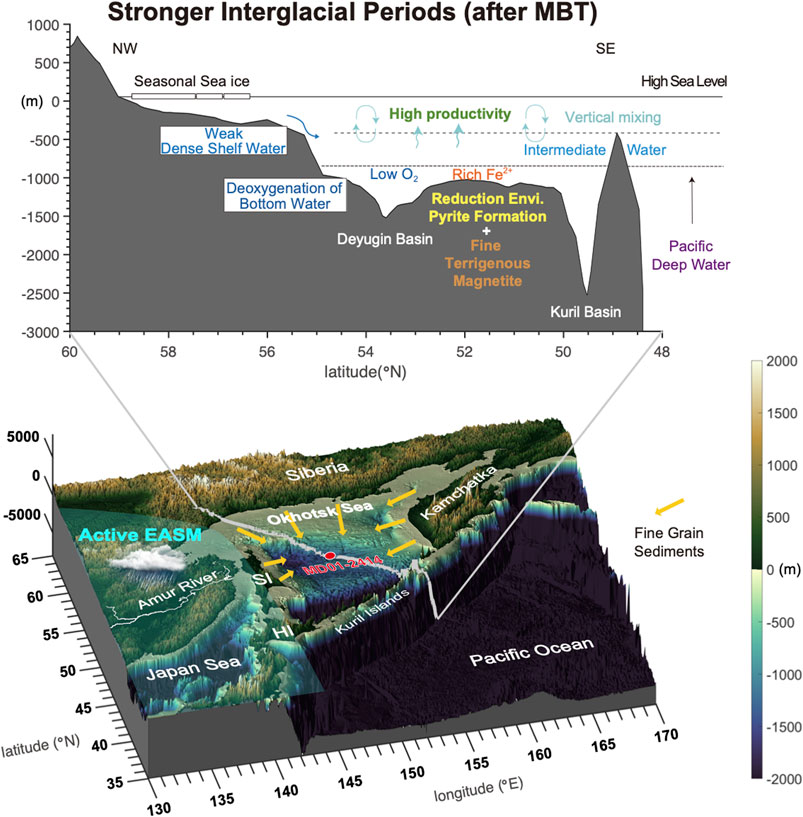
FIGURE 8. Schematic cross-section and view of Okhotsk Sea displaying the terrigenous transportations and oceanographic conditions during stronger interglacial periods (post MBT). EASM: East Asian Summer Monsoon.
Conclusion
In this study we investigated the paleoenvironmental variations in the central Okhotsk Sea since 1550 ka by a combination of environmental magnetic proxies, diatom, opal, geochemical proxies and microscopy observations. The main conclusions are as follows:
1) We present the new magnetostratigraphy of core MD01-2414 with a new age model by Lo et al. (2018); seventeen geomagnetic excursions are identified. This unique record provides a reliable paleomagnetic chronology for regional Earth’s field study and paleoceanography study of marine sediments in the northwest Pacific region.
2) Three types of magnetite are identified from sediments during MIS 5e, 1) detrital origin angular-irregular coarse grains, 2) volcanic origin silicate-hosted nanometer-sized magnetite inclusions, and 3) nanometer-sized magnetite aggregates which were formerly inclusions in silicates. The Kamchatka Peninsula is assumed to be the source of all those particles.
3) During glacial intervals, the perennial sea ice covered the northern and western areas of Okhotsk Sea, which caused low marine productivity and enhanced the formation of Okhotsk Sea Intermediate Water (OSIW) and oxygenation in bottom water. Those mobile icebergs from the Kamchatka Peninsula Glacier carried coarse and abundant ferromagnetic terrigenous detritus to the central Okhotsk Sea basin.
4) Increased abundance of sea ice diatoms and opal suggest a shorter duration of sea ice coverage in the glacial intervals pre-MPT than syn-/post-MPT.
5) During interglacial intervals, the retreat of sea ice coverage decreased the IRD accumulation, the OSIW formation, and the bottom water ventilation. The freshwater from Siberia and Kamchatka exported fine-grained sediments to the Okhotsk Sea. High marine productivity resulted in the deposition of large amounts of plankton debris in the sea basin. Low supply of dissolved oxygen from OSIW and microbial decay caused an oxygen-depleted environment in the bottom water. This condition favors the formation of framboidal pyrite in sediments during these interglacial intervals.
6) During the stronger interglacial intervals after Middle Brunhes Transition (MBT) (i.e., MISs 1, 5e, 9, and 11), active EASM enhanced the precipitation rates in the Amur River drainage area. The strong freshwater supply increased the input of fine- and poor-ferromagnetic sediments to the central Okhotsk Sea basin.
Data Availability Statement
The datasets presented in this study can be found in online repositories. The names of the repository/repositories and accession number(s) can be found below: https://doi.pangaea.de/10.1594/PANGAEA.932399.
Author Contributions
All authors contributed to the article and approved the submitted version. Y‐MC: Managed project, performed most measurements and analysis, and wrote the paper. XJ: Performed magnetic measurements and microscope observation, and edited the paper. LL: Managed project, performed XRF measurements and analysis, and edited the paper. L‐CW: Managed project, performed diatom analysis, and edited the paper. T‐QL: Provided samples, helped with magnetic analysis, and edited the paper. C‐CW: Performed X‐ray microscope observation, and edited the paper. YP: Helped with electron microscope observation, and edited the paper. JZ: Provided discussions, and edited the paper. FH: Provided discussions, and edited the paper. ZL: Provided technical support, and edited the paper.
Funding
This research was supported by grants from the National Natural Science Foundation of China (42074071 to Y-MC and 41876065 to JZ), Shenzhen Science and Technology Program (Grant No. KQTD20170810111725321), Science and Technology Innovation Committee of Shenzhen Municipality (ZDSYS201802081843490), Technology and Innovation Commission of Shenzhen Municipality (20200925154739001), the Southern University of Science and Technology (Y01316111 to Y-MC), Key Special Project for Introduced Talents Team of Southern Marine Science and Engineering Guangdong Laboratory (Guangzhou) (GML2019ZD0210), Ministry of Science and Technology (MOST), Taiwan ROC (109-2116-M-194-011- to L-CW and 110-2636-M-002-011- to LL), Ministry of Education Higher Education SPROUT Project, Taiwan ROC (110L890704 to LL), and National Taiwan University Excellence Research Program (109L892603 to LL). X-ray image acquisition and analysis were supported by the National Synchrotron Radiation Research Center (NSRRC- 2018-3-278-1 to Y-MC), Taiwan ROC.
Conflict of Interest
The authors declare that the research was conducted in the absence of any commercial or financial relationships that could be construed as a potential conflict of interest.
The handling editor declared a past co-authorship with one of the authors, JZ.
Publisher’s Note
All claims expressed in this article are solely those of the authors and do not necessarily represent those of their affiliated organizations, or those of the publisher, the editors and the reviewers. Any product that may be evaluated in this article, or claim that may be made by its manufacturer, is not guaranteed or endorsed by the publisher.
Acknowledgments
The authors appreciate to all the technicians on the RV Marion Dufresne II who helped to raise the cores during the cruise WEPAMA (MD122/IMAGES VII in 2001).
Supplementary Material
The Supplementary Material for this article can be found online at: https://www.frontiersin.org/articles/10.3389/feart.2021.683984/full#supplementary-material
References
Barth, A. M., Clark, P. U., Bill, N. S., He, F., and Pisias, N. G. (2018). Climate Evolution across the Mid-brunhes Transition. Clim. Past 14 (12), 2071–2087. doi:10.5194/cp-14-2071-2018
Bartoli, G., Sarnthein, M., Weinelt, M., Erlenkeuser, H., Garbe-Schönberg, D., and Lea, D. W. (2005). Final Closure of Panama and the Onset of Northern Hemisphere Glaciation. Earth Planet. Sci. Lett. 237 (1), 33–44. doi:10.1016/j.epsl.2005.06.020
Bassinot, F. C., and Baltzer, A. (2002). “WEPAMA, MD122 IMAGES VII Cruise Report, IPEV,” in 1041 Les rapports des campagnes à la mer (Springer), 01. ISSN [1636–8525].
Bassinot, F. C., and Chen, M.-T. (2002). Physical Properties of Sediment Core MD01-2414. Bremen, Germany: PANGAEA. doi:10.1594/PANGAEA.80047
Bubenshchikova, N., Nürnberg, D., and Tiedemann, R. (2015). Variations of Okhotsk Sea Oxygen Minimum Zone: Comparison of Foraminiferal and Sedimentological Records for Latest MIS 12-11c and Latest MIS 2-1. Mar. Micropaleontology 121, 52–69. doi:10.1016/j.marmicro.2015.09.004
Burdige, D. J. (1993). The Biogeochemistry of Manganese and Iron Reduction in marine Sediments. Earth-Science Rev. 35 (3), 249–284. doi:10.1016/0012-8252(93)90040-E
Campos, C., and Horn, M. (2018). The Physical System of the Arctic Ocean and Subarctic Seas in a Changing Climate. Springer International Publishing, 25–40. doi:10.1007/978-3-319-93284-2_3
Chang, L., Roberts, A. P., Heslop, D., Hayashida, A., Li, J., Zhao, X., et al. (2016). Widespread Occurrence of Silicate-Hosted Magnetic mineral Inclusions in marine Sediments and Their Contribution to Paleomagnetic Recording. J. Geophys. Res. Solid Earth 121 (12), 8415–8431. doi:10.1002/2016JB013109
Channell, J. E. T., and Guyodo, Y. (2004). “The Matuyama Chronozone at ODP Site 982 (Rockall Bank): Evidence for Decimeter-Scale Magnetization Lock-In Depths,” in Timescales of the Paleomagnetic Field (Springer), 205–219.
Channell, J. E. T., Singer, B. S., and Jicha, B. R. (2020). Timing of Quaternary Geomagnetic Reversals and Excursions in Volcanic and Sedimentary Archives. Quat. Sci. Rev. 228, 106114. doi:10.1016/j.quascirev.2019.106114
Chou, Y.-M., Lee, T.-Q., Song, S.-R., and Chen, K.-J. (2011). Magnetostratigraphy of marine Sediment Core MD01-2414 from Okhotsk Sea and its Paleoenvironmental Implications. Mar. Geology. 284 (1-4), 149–157. doi:10.1016/j.margeo.2011.03.015
Cohen, J., Screen, J. A., Furtado, J. C., Barlow, M., Whittleston, D., Coumou, D., et al. (2014). Recent Arctic Amplification and Extreme Mid-Latitude Weather. Nat. Geosci. 7 (9), 627–637. doi:10.1038/ngeo2234
Coletti, A. J., DeConto, R. M., Brigham-Grette, J., and Melles, M. (2015). A GCM Comparison of Pleistocene Super-interglacial Periods in Relation to Lake El'gygytgyn, NE Arctic Russia. Clim. Past 11 (7), 979–989. doi:10.5194/cp-11-979-2015
Cronin, T. M., Dwyer, G. S., Caverly, E. K., Farmer, J., DeNinno, L. H., Rodriguez-Lazaro, J., et al. (2017). Enhanced Arctic Amplification Began at the Mid-brunhes Event ∼400,000 Years Ago. Sci. Rep. 7 (1), 14475. doi:10.1038/s41598-017-13821-2
Elderfield, H., Ferretti, P., Greaves, M., Crowhurst, S., McCave, I. N., Hodell, D., et al. (2012). Evolution of Ocean Temperature and Ice Volume through the Mid-pleistocene Climate Transition. Science 337 (6095), 704–709. doi:10.1126/science.1221294
Giaccio, B., Regattieri, E., Zanchetta, G., Nomade, S., Renne, P. R., Sprain, C. J., et al. (2015). Duration and Dynamics of the Best Orbital Analogue to the Present Interglacial. Geology 43 (7), 603–606. doi:10.1130/g36677.1
Gorbarenko, S. A., Harada, N., Malakhov, M. I., Vasilenko, Y. P., Bosin, A. A., and Goldberg, E. L. (2010). Orbital and Millennial-Scale Environmental and Sedimentological Changes in the Okhotsk Sea during the Last 350kyr. Glob. Planet. Change 72 (1), 79–85. doi:10.1016/j.gloplacha.2010.03.002
Gorbarenko, S. A., Harada, N., Malakhov, M. I., Velivetskaya, T. A., Vasilenko, Y. P., Bosin, A. A., et al. (2012). Responses of the Okhotsk Sea Environment and Sedimentology to Global Climate Changes at the Orbital and Millennial Scale during the Last 350kyr. Deep Sea Res. Part Topical Stud. Oceanography 61-64, 73–84. doi:10.1016/j.dsr2.2011.05.016
Gorbarenko, S. A., Nürnberg, D., Derkachev, A. N., Astakhov, A. S., Southon, J. R., and Kaiser, A. (2002). Magnetostratigraphy and Tephrochronology of the Upper Quaternary Sediments in the Okhotsk Sea: Implication of Terrigenous, Volcanogenic and Biogenic Matter Supply. Mar. Geol. 183 (1), 107–129. doi:10.1016/S0025-3227(02)00164-0
Gorbarenko, S. A., Shi, X., Malakhova, G. Y., Bosin, A. A., Zou, J., Liu, Y., et al. (2017). Centennial to Millennial Climate Variability in the Far Northwestern Pacific (Off Kamchatka) and its Linkage to the East Asian Monsoon and North Atlantic from the Last Glacial Maximum to the Early Holocene. Clim. Past 13 (8), 1063–1080. doi:10.5194/cp-13-1063-2017
Harada, N., Katsuki, K., Nakagawa, M., Matsumoto, A., Seki, O., Addison, J. A., et al. (2014). Holocene Sea Surface Temperature and Sea Ice Extent in the Okhotsk and Bering Seas. Prog. Oceanography 126, 242–253. doi:10.1016/j.pocean.2014.04.017
Harada, N., Sato, M., and Sakamoto, T. (2008). Freshwater Impacts Recorded in Tetraunsaturated Alkenones and Alkenone Sea Surface Temperatures from the Okhotsk Sea across Millennial-Scale Cycles. Paleoceanography 23 (3), a–n. doi:10.1029/2006PA001410
Harrison, R. J., and Feinberg, J. M. (2008). FORCinel: An Improved Algorithm for Calculating First-Order Reversal Curve Distributions Using Locally Weighted Regression Smoothing. Geochem. Geophys. Geosyst. 9, a–n. doi:10.1029/2008GC001987
Haug, G. H., Sigman, D. M., Tiedemann, R., Pedersen, T. F., and Sarnthein, M. (1999). Onset of Permanent Stratification in the Subarctic Pacific Ocean. Nature 401 (6755), 779–782. doi:10.1038/44550
Head, M. J., and Gibbard, P. L. (2015). Early-Middle Pleistocene Transitions: Linking Terrestrial and marine Realms. Quat. Int. 389, 7–46. doi:10.1016/j.quaint.2015.09.042
Heslop, D., Roberts, A. P., and Chang, L. (2014). Characterizing Magnetofossils from First-Order Reversal Curve (FORC) central ridge Signatures. Geochem. Geophys. Geosyst. 15 (6), 2170–2179. doi:10.1002/2014GC005291
Horiuchi, K., Kamata, K., Maejima, S., Sasaki, S., Sasaki, N., Yamazaki, T., et al. (2016). Multiple 10 Be Records Revealing the History of Cosmic-ray Variations across the Iceland Basin Excursion. Earth Planet. Sci. Lett. 440, 105–114. doi:10.1016/j.epsl.2016.01.034
Huang, J.-J., Löwemark, L., Chang, Q., Lin, T.-Y., Chen, H.-F., Song, S.-R., et al. (2016). Choosing Optimal Exposure Times for XRF Core-Scanning: Suggestions Based on the Analysis of Geological Reference Materials. Geochem. Geophys. Geosyst. 17 (4), 1558–1566. doi:10.1002/2016GC006256
Huang, J., and Zhang, H. (2020). Redox Reactions of Iron and Manganese Oxides in Complex Systems. Front. Environ. Sci. Eng. 14 (5), 76. doi:10.1007/s11783-020-1255-8
Hudson, J. D. (1982). Pyrite in Ammonite-Bearing Shales from the Jurassic of England and Germany. Sedimentology 29 (5), 639–667. doi:10.1111/j.1365-3091.1982.tb00072.x
Iwasaki, S., Takahashi, K., Maesawa, T., Sakamoto, T., Sakai, S., and Iijima, K. (2012). Paleoceanography of the Last 500kyrs in the central Okhotsk Sea Based on Geochemistry. Deep Sea Res. Part Topical Stud. Oceanography 61-64, 50–62. doi:10.1016/j.dsr2.2011.03.003
Jansen, J. H. F., Kuijpers, A., and Troelstra, S. R. (1986). A Mid-brunhes Climatic Event: Long-Term Changes in Global Atmosphere and Ocean Circulation. Science 232 (4750), 619–622. doi:10.1126/science.232.4750.619
Jiang, X. D., Zhao, X., Chou, Y. M., Liu, Q. S., Roberts, A. P., Ren, J. B., et al. (2020). Characterization and Quantification of Magnetofossils within Abyssal Manganese Nodules from the Western Pacific Ocean and Implications for Nodule Formation. Geochem. Geophys. Geosyst. 21 (3), e2019GC008811. doi:10.1029/2019gc008811
Jimenez-Espejo, F. J., García-Alix, A., Harada, N., Bahr, A., Sakai, S., Iijima, K., et al. (2018). Changes in detrital input, ventilation and productivity in the central Okhotsk Sea during the marine isotope stage 5e, penultimate interglacial period. J. Asian Earth Sci. 156, 189–200. doi:10.1016/j.jseaes.2018.01.032
Keigwin, L. D. (1998). Glacial-age Hydrography of the Far Northwest Pacific Ocean. Paleoceanography 13 (4), 323–339. doi:10.1029/98PA00874
Keigwin, L. D., Jones, G. A., and Froelich, P. N. (1992). A 15,000 Year Paleoenvironmental Record from Meiji Seamount, Far Northwestern Pacific. Earth Planet. Sci. Lett. 111 (2), 425–440. doi:10.1016/0012-821X(92)90194-Z
Khim, B.-K., Sakamoto, T., and Harada, N. (2012). Reconstruction of Surface Water Conditions in the central Region of the Okhotsk Sea during the Last 180kyrs. Deep Sea Res. Part Topical Stud. Oceanography 61-64, 63–72. doi:10.1016/j.dsr2.2011.05.014
Kimura, N., and Wakatsuchi, M. (1999). Processes Controlling the advance and Retreat of Sea Ice in the Sea of Okhotsk. J. Geophys. Res. 104 (C5), 11137–11150. doi:10.1029/1999JC900004
King, J., Banerjee, S. K., Marvin, J., and Özdemir, Ö. (1982). A Comparison of Different Magnetic Methods for Determining the Relative Grain Size of Magnetite in Natural Materials: Some Results from lake Sediments. Earth Planet. Sci. Lett. 59 (2), 404–419. doi:10.1016/0012-821X(82)90142-X
Koizumi, I., Shiga, K., Irino, T., and Ikehara, M. (2003). Diatom Record of the Late Holocene in the Okhotsk Sea. Mar. Micropaleontol. 49 (1-2), 139–156. doi:10.1016/s0377-8398(03)00033-1
Lattaud, J., Lo, L., Zeeden, C., Liu, Y.-J., Song, S.-R., van der Meer, M. T. J., et al. (2019). A Multiproxy Study of Past Environmental Changes in the Sea of Okhotsk during the Last 1.5 Ma. Org. Geochem. 132, 50–61. doi:10.1016/j.orggeochem.2019.04.003
Lembke-Jene, L., Tiedemann, R., Nürnberg, D., Gong, X., and Lohmann, G. (2018). Rapid Shift and Millennial-Scale Variations in Holocene North Pacific Intermediate Water Ventilation. Proc. Natl. Acad. Sci. USA 115 (21), 5365–5370. doi:10.1073/pnas.1714754115
Lembke-Jene, L., Tiedemann, R., Nürnberg, D., Kokfelt, U., Kozdon, R., Max, L., et al. (2017). Deglacial Variability in Okhotsk Sea Intermediate Water Ventilation and Biogeochemistry: Implications for North Pacific Nutrient Supply and Productivity. Quat. Sci. Rev. 160, 116–137. doi:10.1016/j.quascirev.2017.01.016
Li, J., Liu, Y., Liu, S., Roberts, A. P., Pan, H., Xiao, T., et al. (2020a). Classification of a Complexly Mixed Magnetic Mineral Assemblage in Pacific Ocean Surface Sediment by Electron Microscopy and Supervised Magnetic Unmixing. Front. Earth Sci. 8 (648), 1. doi:10.3389/feart.2020.609058
Li, J., Menguy, N., Leroy, E., Roberts, A. P., Liu, P., and Pan, Y. (2020b). Biomineralization and Magnetism of Uncultured Magnetotactic Coccus Strain THC‐1 with Non‐chained Magnetosomal Magnetite Nanoparticles. J. Geophys. Res. Solid Earth 125 (12), e2020JB020853. doi:10.1029/2020JB020853
Li, J., Wu, W., Liu, Q., and Pan, Y. (2012). Magnetic Anisotropy, Magnetostatic Interactions and Identification of Magnetofossils. Geochem. Geophys. Geosyst. 13 (12), 1. doi:10.1029/2012GC004384
Lisiecki, L. E., and Raymo, M. E. (2005). A Pliocene-Pleistocene Stack of 57 Globally Distributed Benthic δ18O Records. Paleoceanography 20, a–n. doi:10.1029/2004PA001071
Liu, Y.-J., Song, S.-R., Lee, T.-Q., Lee, M.-Y., Chen, Y.-L., and Chen, H.-F. (2006). Mineralogical and Geochemical Changes in the Sediments of the Okhotsk Sea during Deglacial Periods in the Past 500 Kyrs. Glob. Planet. Change 53 (1), 47–57. doi:10.1016/j.gloplacha.2006.01.007
Lo, L., Belt, S. T., Lattaud, J., Friedrich, T., Zeeden, C., Schouten, S., et al. (2018). Precession and Atmospheric CO2 Modulated Variability of Sea Ice in the central Okhotsk Sea since 130,000 Years Ago. Earth Planet. Sci. Lett. 488, 36–45. doi:10.1016/j.epsl.2018.02.005
Lund, S., Stoner, J. S., Channell, J. E. T., and Acton, G. (2006). A Summary of Brunhes Paleomagnetic Field Variability Recorded in Ocean Drilling Program Cores. Phys. Earth Planet. Interiors 156 (3), 194–204. doi:10.1016/j.pepi.2005.10.009
Matul, A. G., Abelmann, A., Nürnberg, D., and Tiedemann, R. (2009). Stratigraphy and Major Paleoenvironmental Changes in the Sea of Okhotsk during the Last Million Years Inferred from Radiolarian Data. Oceanology 49 (1), 93–100. doi:10.1134/S0001437009010111
Max, L., Lembke-Jene, L., Riethdorf, J.-R., Tiedemann, R., Nürnberg, D., Kühn, H., et al. (2014). Pulses of Enhanced North Pacific Intermediate Water Ventilation from the Okhotsk Sea and Bering Sea during the Last Deglaciation. Clim. Past 10 (2), 591–605. doi:10.5194/cp-10-591-2014
Melles, M., Brigham-Grette, J., Minyuk, P. S., Nowaczyk, N. R., Wennrich, V., DeConto, R. M., et al. (2012). 2.8 Million Years of Arctic Climate Change from Lake El’gygytgyn, NE Russia. Science 337 (6092), 315–320. doi:10.1126/science.1222135
Mudelsee, M., and Raymo, M. E. (2005). Slow Dynamics of the Northern Hemisphere Glaciation. Paleoceanography 20 (4), 1029. doi:10.1029/2005pa001153
Naeher, S., Gilli, A., North, R. P., Hamann, Y., and Schubert, C. J. (2013). Tracing Bottom Water Oxygenation with Sedimentary Mn/Fe Ratios in Lake Zurich, Switzerland. Chem. Geology. 352, 125–133. doi:10.1016/j.chemgeo.2013.06.006
Nishioka, J., Mitsudera, H., Yasuda, I., Liu, H., Nakatsuka, T., and Volkov, Y. N. (2014). Biogeochemical and Physical Processes in the Sea of Okhotsk and the Linkage to the Pacific Ocean. Prog. Oceanography 126, 1–7. doi:10.1016/j.pocean.2014.04.027
Nishioka, J., Nakatsuka, T., Watanabe, Y. W., Yasuda, I., Kuma, K., Ogawa, H., et al. (2013). Intensive Mixing along an Island Chain Controls Oceanic Biogeochemical Cycles. Glob. Biogeochem. Cycles 27 (3), 920–929. doi:10.1002/gbc.20088
Nishioka, J., Obata, H., Ogawa, H., Ono, K., Yamashita, Y., Lee, K., et al. (2020). Subpolar Marginal Seas Fuel the North Pacific through the Intermediate Water at the Termination of the Global Ocean Circulation. Proc. Natl. Acad. Sci. USA 117 (23), 12665–12673. doi:10.1073/pnas.2000658117
Nürnberg, D., Dethleff, D., Tiedemann, R., Kaiser, A., and Gorbarenko, S. A. (2011). Okhotsk Sea Ice Coverage and Kamchatka Glaciation over the Last 350ka - Evidence from Ice-Rafted Debris and Planktonic δ18O. Palaeogeogr. Palaeoclimatol. Palaeoecol. 310 (3), 191–205. doi:10.1016/j.palaeo.2011.07.011
Nürnberg, D., and Tiedemann, R. (2004). Environmental Change in the Sea of Okhotsk during the Last 1.1 Million Years. Paleoceanography 19 (4), a–n. doi:10.1029/2004PA001023
Past Interglacials Working Group of PAGES (2016). Interglacials of the Last 800,000years. Rev. .Geophys. 54 (1), 162–219. doi:10.1002/2015RG000482
Petrick, B. F., McClymont, E. L., Marret, F., and van der Meer, M. T. J. (2015). Changing Surface Water Conditions for the Last 500 Ka in the Southeast Atlantic: Implications for Variable Influences of Agulhas Leakage and Benguela Upwelling. Paleoceanography 30 (9), 1153–1167. doi:10.1002/2015PA002787
Roberts, A. P., Almeida, T. P., Church, N. S., Harrison, R. J., Heslop, D., Li, Y., et al. (2017). Resolving the Origin of Pseudo‐Single Domain Magnetic Behavior. J. Geophys. Res. Solid Earth 122 (12), 9534–9558. doi:10.1002/2017JB014860
Roberts, A. P., Pike, C. R., and Verosub, K. L. (2000). First-order Reversal Curve Diagrams: A New Tool for Characterizing the Magnetic Properties of Natural Samples. J. Geophys. Res. 105 (B12), 28461–28475. doi:10.1029/2000jb900326
Roberts, A. P., and Winklhofer, M. (2004). Why Are Geomagnetic Excursions Not Always Recorded in Sediments? Constraints from post-depositional Remanent Magnetization Lock-In Modelling. Earth Planet. Sci. Lett. 227 (3), 345–359. doi:10.1016/j.epsl.2004.07.040
Sakamoto, T., Ikehara, M., Aoki, K., Iijima, K., Kimura, N., Nakatsuka, T., et al. (2005). Ice-rafted Debris (IRD)-based Sea-Ice Expansion Events during the Past 100 Kyrs in the Okhotsk Sea. Deep Sea Res. Part Topical Stud. Oceanography 52 (16), 2275–2301. doi:10.1016/j.dsr2.2005.08.007
Sakamoto, T., Ikehara, M., Uchida, M., Aoki, K., Shibata, Y., Kanamatsu, T., et al. (2006). Millennial-scale Variations of Sea-Ice Expansion in the Southwestern Part of the Okhotsk Sea during the Past 120 Kyr: Age Model and Ice-Rafted Debris in IMAGES Core MD01-2412. Glob. Planet. Change 53 (1), 58–77. doi:10.1016/j.gloplacha.2006.01.012
Schieber, J. (2011). “Iron Sulfide Formation,” in Encyclopedia of Geobiology. Editors J. Reitner, and V. Thiel (Dordrecht: Springer Netherlands), 486–502. doi:10.1007/978-1-4020-9212-1_118
Seki, O., Harada, N., Sato, M., Kawamura, K., Ijiri, A., and Nakatsuka, T. (2012). Assessment for Paleoclimatic Utility of Terrestrial Biomarker Records in the Okhotsk Sea Sediments. Deep Sea Res. Part Topical Stud. Oceanography 61-64, 85–92. doi:10.1016/j.dsr2.2011.03.008
Serreze, M. C., and Barry, R. G. (2011). Processes and Impacts of Arctic Amplification: A Research Synthesis. Glob. Planet. Change 77 (1), 85–96. doi:10.1016/j.gloplacha.2011.03.004
Serreze, M. C., and Francis, J. A. (2006). The Arctic Amplification Debate. Climatic Change 76 (3), 241–264. doi:10.1007/s10584-005-9017-y
Shiga, K., and Koizumi, I. (1999). Latest Quaternary Oceanographic Changes in the Okhotsk Sea Based on Diatom Records. Mar. Micropaleontology 38 (2), 91–117. doi:10.1016/S0377-8398(99)00041-9
Singer, B. S. (2014). A Quaternary Geomagnetic Instability Time Scale. Quat. Geochronol. 21, 29–52. doi:10.1016/j.quageo.2013.10.003
Suganuma, Y., Haneda, Y., Kameo, K., Kubota, Y., Hayashi, H., Itaki, T., et al. (2018). Paleoclimatic and Paleoceanographic Records through Marine Isotope Stage 19 at the Chiba Composite Section, central Japan: A Key Reference for the Early-Middle Pleistocene Subseries Boundary. Quat. Sci. Rev. 191, 406–430. doi:10.1016/j.quascirev.2018.04.022
Suganuma, Y., Okuno, J. I., Heslop, D., Roberts, A. P., Yamazaki, T., and Yokoyama, Y. (2011). Post-depositional Remanent Magnetization Lock-In for marine Sediments Deduced from 10Be and Paleomagnetic Records through the Matuyama-Brunhes Boundary. Earth Planet. Sci. Lett. 311 (1), 39–52. doi:10.1016/j.epsl.2011.08.038
Suganuma, Y., Yokoyama, Y., Yamazaki, T., Kawamura, K., Horng, C.-S., and Matsuzaki, H. (2010). 10Be Evidence for Delayed Acquisition of Remanent Magnetization in marine Sediments: Implication for a New Age for the Matuyama-Brunhes Boundary. Earth Planet. Sci. Lett. 296 (3), 443–450. doi:10.1016/j.epsl.2010.05.031
Thomas, A. L., Henderson, G. M., Deschamps, P., Yokoyama, Y., Mason, A. J., Bard, E., et al. (2009). Penultimate Deglacial Sea-Level Timing from Uranium/Thorium Dating of Tahitian Corals. Science 324 (5931), 1186–1189. doi:10.1126/science.1168754
Thompson, R., and Oldfield, F. (1986). Environmental Magnetism. London: Allen & Unwin. doi:10.1007/978-94-011-8036-8
Tzedakis, P. C., Channell, J. E. T., Hodell, D. A., Kleiven, H. F., and Skinner, L. C. (2012). Determining the Natural Length of the Current Interglacial. Nat. Geosci 5 (2), 138–141. doi:10.1038/ngeo1358
Valet, J.-P., Bassinot, F., Simon, Q., Savranskaia, T., Thouveny, N., Bourlés, D. L., et al. (2019). Constraining the Age of the Last Geomagnetic Reversal from Geochemical and Magnetic Analyses of Atlantic, Indian, and Pacific Ocean Sediments. Earth Planet. Sci. Lett. 506, 323–331. doi:10.1016/j.epsl.2018.11.012
Wakeham, S. G. (2020). Organic Biogeochemistry in the Oxygen-Deficient Ocean: A Review. Org. Geochem. 149, 104096. doi:10.1016/j.orggeochem.2020.104096
Wang, C.-C., Song, Y.-F., Song, S.-R., Ji, Q., Chiang, C.-C., Meng, Q., et al. (2015). Evolution and Function of Dinosaur Teeth at Ultramicrostructural Level Revealed Using Synchrotron Transmission X-ray Microscopy. Sci. Rep. 5 (1), 15202. doi:10.1038/srep15202
Wang, K., Shi, X., Zou, J., Liu, Y., Yao, Z., and Gorbarenko, S. A. (2021). Spatial Distribution and Provenance of Detrital Minerals of Surface Sediment in the Okhotsk Sea. Front. Earth Sci. 9 (330), 1. doi:10.3389/feart.2021.636850
Wang, L.-C., Behling, H., Lee, T.-Q., Li, H.-C., Huh, C.-A., Shiau, L.-J., et al. (2014). Late Holocene Environmental Reconstructions and Their Implications on Flood Events, Typhoon, and Agricultural Activities in NE Taiwan. Clim. Past 10 (5), 1857–1869. doi:10.5194/cp-10-1857-2014
Wang, W.-L., and Wang, L.-C. (2008). Reconstruction of Oceanographic Changes Based on the Diatom Records of the central Okhotsk Sea over the Last 500000 Years. Terr. Atmos. Ocean. Sci. 19, 403–411. doi:10.3319/TAO.2008.19.4.403(IMAGES)
Xu, X., Qiang, X., Hu, S., Zhao, H., Fu, C., and Zhao, Q. (2020). Records of the Mid-Brunhes Event in Chinese Loess-Paleosol Sequences. Palaeogeogr. Palaeoclimatol. Palaeoecol. 543, 109596. doi:10.1016/j.palaeo.2020.109596
Yamazaki, T., Inoue, S., Shimono, T., Sakamoto, T., and Sakai, S. (2013). Sea-ice Conditions in the Okhotsk Sea during the Last 550 Kyr Deduced from Environmental Magnetism. Geochem. Geophys. Geosyst. 14 (12), 5026–5040. doi:10.1002/2013GC004959
Yin, Q. Z., and Berger, A. (2010). Insolation and CO2 Contribution to the Interglacial Climate before and after the Mid-brunhes Event. Nat. Geosci 3 (4), 243–246. doi:10.1038/ngeo771
Zhao, P., Alexandrov, I., Jahn, B.-M., and Ivin, V. (2018). Timing of Okhotsk Sea Plate Collision with Eurasia Plate: Zircon U-Pb Age Constraints from the Sakhalin Island, Russian Far East. J. Geophys. Res. Solid Earth 123 (9), 8279–8293. doi:10.1029/2018JB015800
Keywords: Okhotsk Sea, paleomagnetism, paleoenvironment, mid-pleistocene transition, mid-brunhes transition
Citation: Chou Y-M, Jiang X, Lo L, Wang L-C, Lee T-Q, Wang C-C, Pan Y, Zou J, Humbert F and Liu Z (2021) Controls on Terrigenous Detritus Deposition and Oceanography Changes in the Central Okhotsk Sea Over the Past 1550 ka. Front. Earth Sci. 9:683984. doi: 10.3389/feart.2021.683984
Received: 22 March 2021; Accepted: 08 October 2021;
Published: 29 October 2021.
Edited by:
Lester Lembke-Jene, Alfred Wegener Institute Helmholtz Centre for Polar and Marine Research (AWI), GermanyReviewed by:
Dirk Nürnberg, GEOMAR Helmholtz Center for Ocean Research Kiel, GermanyYusuke Suganuma, National Institute of Polar Research, Japan
Alexander Matul, P.P. Shirshov Institute of Oceanology (RAS), Russia
Copyright © 2021 Chou, Jiang, Lo, Wang, Lee, Wang, Pan, Zou, Humbert and Liu. This is an open-access article distributed under the terms of the Creative Commons Attribution License (CC BY). The use, distribution or reproduction in other forums is permitted, provided the original author(s) and the copyright owner(s) are credited and that the original publication in this journal is cited, in accordance with accepted academic practice. No use, distribution or reproduction is permitted which does not comply with these terms.
*Correspondence: Yu-Min Chou, Y2hvdXltQHN1c3RlY2guZWR1LmNu; Li Lo, bGlsbzExNUBudHUuZWR1LnR3; Liang-Chi Wang, bGN3YW5nQGNjdS5lZHUudHc=