 Jingjing Li†
 Hua Chen
- State Key Laboratory of Water Resources and Hydropower Engineering Science, Wuhan University, Wuhan, China
This study assesses the improvement of the latest Coupled Model Intercomparison Project Phase 6 (CMIP6) over Coupled Model Intercomparison Project Phase 5 (CMIP5) for precipitation simulation. Precipitation simulations under different future climate scenarios are also compared in this work. The results show that: 1) CMIP6 has no overall advantage over CMIP5 in simulating total precipitation (PRCPTOT) and maximum consecutive dry days (CDD). The performance of CMIP6 increases or decreases regionally in PRCPTOT and consecutive dry days. But it is slightly worse than CMIP5 in simulating very wet days (R95pTOT). 2) Comparing the trend test results of CMIP5 and CMIP6 in the future, there are more areas with significant trend based on Mann–Kendall test in CMIP6 compared with that of CMIP5. The differences in PRCPTOT are mainly found in Amazon Basin and Western Africa. The differences between the R95pTOT trends mainly noticeable in South America and Western Africa, and the differences in CDD are mainly reflected in Central Asia, Sahara Desert and central South America. 3) In Southern South America and Western North America, the PRCPTOT changing rate of CMIP6 in the future under various scenarios is always greater than that of CMIP5; in Alaska, Western Africa, Southern Africa, the PRCPTOT changing rate of CMIP6 in the future under various scenarios is always less than that of CMIP5. In Southern South America, the R95pTOT changing rate of CMIP6 in the future under various scenarios is always greater than that of CMIP5; in Alaska, East Asia, North Asia, the R95pTOT changing rate of CMIP6 in the future under various scenarios is always less than that of CMIP5. In almost half of the regions, the CDD changing rate of CMIP6 is less than that of CMIP5 under all scenarios, namely Australia, Amazon Basin, Southern South America, Central America, Western North America, Central North America, Eastern North America, Central Asia, Tibet.
Introduction
To analyze the impact of future climate change, the World Climate Research Program (WCRP) initiated the Coupled Model Intercomparison Project (CMIP) in 1995 (Meehl et al., 2000). With scientific development and the gradually improved understanding of climate change mechanisms, the CMIP has evolved from CMIP Phase 1 (CMIP1), Phase 2 (CMIP2), Phase 3 (CMIP3), and Phase 5 (CMIP5) to the latest Phase 6 model (CMIP6). CMIP formulates climate model test standards, and the mechanism for sharing simulated climate data promotes model development and improvement. Therefore, it has gradually developed and become an indispensable element of climate science. Many studies based on CMIP data provided support for the Intergovernmental Panel on Climate Change (IPCC) assessment reports (IPCC 2007; IPCC 2013). CMIP6 will provide data support for climate change research in the next five to ten years.
CMIP6 newly proposed shared socioeconomic pathways (SSPs) (Moss et al., 2010), which describe different socioeconomic reference assumptions. The SSPs and RCPs (representative concentration pathways) were combined to provide an integrated scenario in CMIP6 (Van Vuuren et al., 2014). In addition to the new future scenario, a new generation of general circulation models (GCMs) is used in CMIP6 (Veronika et al., 2016). The GCM is an indispensable tool for exploring the interaction of climate systems, future climate change predictions, and climate change research. It has been proven to behave well in simulating climate change and can be used to predict future precipitation under climate change (Li et al., 2019; Khan et al., 2020).
Climate change significantly affects the water cycle (Madsen et al., 2014; Zobel et al., 2018; Ortiz-Gómez et al., 2020). Obtaining high-quality water resource forecast data under climate change is critical for sustainable water resource development. In addition to the total amount of water resources, the temporal and spatial distribution of precipitation, especially extreme precipitation events, is worthy of attention. Extreme precipitation can lead to drought and flood events (Ulbrich et al., 2003; Wang et al., 2016; Funk et al., 2018; Funk et al., 2019; Lal et al., 2020), which in turn will cause enormous societal, economic, and ecological losses (Kundzewicz et al., 2014; Gao et al., 2019). To manage the hidden dangers of water security caused by global climate change and deploy adaptive countermeasures in advance, it is crucial to study the total precipitation and extreme precipitation events under climate change (Birkmann 2011; Forestieri et al., 2018; Rahmani and Harrington 2019; Hosseinzadehtalaei et al., 2020; Ukkola et al., 2020). CMIP result data provide a meaningful way to analyze the temporal and spatial distribution of future precipitation.
With the further development of CMIP, studying the difference between CMIP5 and CMIP6 has received critical attention. Several studies have assessed CMIP6 by comparing the historical simulation data of CMIP5 and CMIP6 with the observed data (Gusain et al., 2020; Yuanhai et al., 2020; Zamani et al., 2020; Zhu et al., 2020; Zhu and Yang 2020). When CMIP5 and CMIP6 are compared, the multi-model mean result (Xin et al., 2020; Yuanhai et al., 2020) rather than a specific GCM (Wyser et al., 2020) is used in most cases. Gusain et al. (2020) compared CMIP6 and CMIP5 when simulating Indian summer monsoon precipitation. The results showed that CMIP6 performed better than CMIP5, as the model deviation in CMIP6 was significantly reduced. Thus, CMIP6 could better simulate the Indian monsoon characteristics. Zhu et al. (2020) compared CMIP5 and CMIP6 in China based on a daily observational dataset. They found that CMIP6 behaved better in the simulation of total precipitation, precipitation intensity, heavy precipitation, and extremely heavy rain days, except for consecutive dry days (CDD). For precipitation, the simulation of precipitation intensity was better in CMIP6, although the simulation of precipitation frequency was comparable to that in CMIP5. Overall, most studies have focused on a specific region (Bracegirdle et al., 2020; Davy and Outten 2020; Jiang et al., 2020) rather than the world when assessing historical precipitation in CMIP6 (Fan et al., 2020; Ukkola et al., 2020). Compared to research that evaluated historical data in CMIP5 and CMIP6, those with further analysis of future climate change in CMIP5 and CMIP6 (Chen et al., 2020; Ukkola et al., 2020) are sparse. Ukkola et al. (2020) found that drought changes in the future (2051–2100) in CMIP6 are more considerable and more consistent than those in CMIP5. The results also showed that mean precipitation and variability influenced drought duration and frequency. Chen et al. (2020) studied precipitation and temperature extremes in the future after a historical data assessment. The work highlighted the changing rate of climate indicators in the last 2 decades of this century compared with the historical record. The results suggested that extreme climate changes are more pronounced in CMIP6 than in CMIP5. Davy and Outten (2020) investigated the model distributions of surface air temperature and sea ice extent and volume in the Arctic until 2100 and compared CMIP6 with CMIP5. The results showed that under SSP126, the Arctic climate will stabilize by 2060. Most research only consider several decades at the end of the 21st century when analyzing the future, without a detailed analysis of the near future. Very little work has been devoted to the analysis of future precipitation projected by CMIP6 worldwide after comparing it with CMIP5.
More work is needed to analyze worldwide precipitation based on CMIP6 and CMIP5 in detail. This study has two objectives: 1) to compare the historical precipitation simulation capability between CMIP6 and CMIP5; and 2) analyze the differences in the temporal and spatial distributions of precipitation in the future in CMIP6 and CMIP5. In the middle of this century and at the end of this century, the impact of climate change will be very different. Therefore, when analyzing future changes in precipitation, this study divides the future into near-future and far-future periods. Three indicators are used in this study: total precipitation (PRCPTOT), very wet days (R95pTOT) and CDD.
The remainder of this paper is organized as follows. Methods and Materials describes the methods and materials used in this study. Results and Discussions presents the study results, focusing on four key themes. Evaluation of CMIP5 and CMIP6 Historical Precipitation Simulation Capabilities presents the evaluation of historical precipitation simulation capabilities. Then, trend analysis and comparison of long series precipitation are presented in Trend analysis and comparison of long series precipitation in CMIP5 and CMIP6, followed by a comparison of the changing rates of CMIP5 and CMIP6 precipitation in the future compared with history in Changing rate comparison of precipitation in the future over the history. Finally, the model uncertainties in CMIP5 and CMIP6 are compared in Comparison of Model uncertainty in CMIP5 and CMIP6 precipitation. Conclusions are drawn in Conclusion.
Methods and Materials
Data
In this study, the Global Precipitation Climatology Center (GPCC) V 2018 grid daily precipitation data were used as the observation data (1982–2005) (Fuchs et al., 2009), with a resolution of 0.5° × 0.5°. Eight GCMs of CMIP6 and eight corresponding GCMs in CMIP5 were adopted for the modeled data. The specific GCM information is presented in Table 1. We selected paired GCMs in CMIP5 and CMIP6. For example, the FGOALS-g3 in CMIP6 and FGOALS-g2 in CMIP5. It can reflect the difference between CMIP6 and CMIP5.
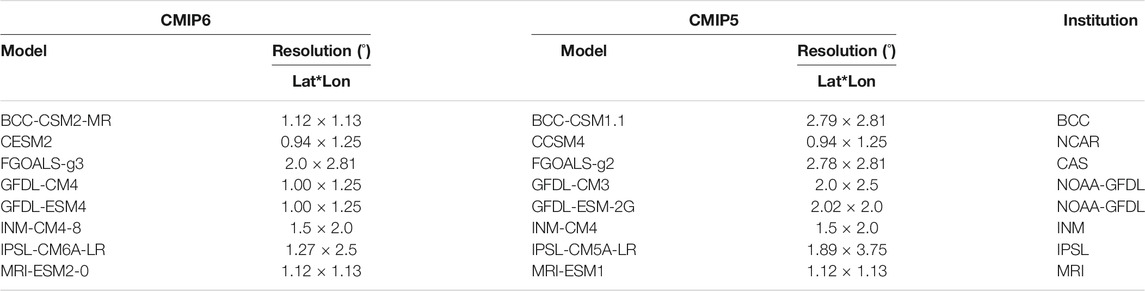
TABLE 1. List of general circulation models (GCMs) in the Coupled Model Intercomparison Project phases 5 and 6 (CMIP5 and CMIP6).
Three corresponding future scenarios from CMIP6 and CMIP5 were used to explore how forcing level and socioeconomic development affect the temporal and spatial distribution of precipitation. Those scenarios are SSP126 (RCP26), SSP245 (RCP45), and SSP585 (RCP85), where radiative forcing stabilizes at approximately 2.6 W/m2, 4.5 W/m2, and 8.5 W/m2 in 2100, respectively. Due to historical simulation data limitations, the historical period was from 1982 to 2005 (24 years). The future is divided into near-future period (2037–2060, 24 years), and far-future period (2077–2100, 24 years) in this study.
Because the resolution of each GCM is different, all GCM and observation data were interpolated into 1° × 1° grid data sets using the bilinear interpolation method.
Indicators
Three precipitation indices were selected to describe the precipitation characteristics from the 27 climate change indicators recommended by the World Meteorological Organization (WMO) and the Expert Team on Climate Change Detection, Monitoring Indices (ETCCDMI) (Zhang et al., 2011): PRCPTOT, R95pTOT, and CDD (Table 2). It helps to understand the total amount of water resources and the risks of drought and flooding.
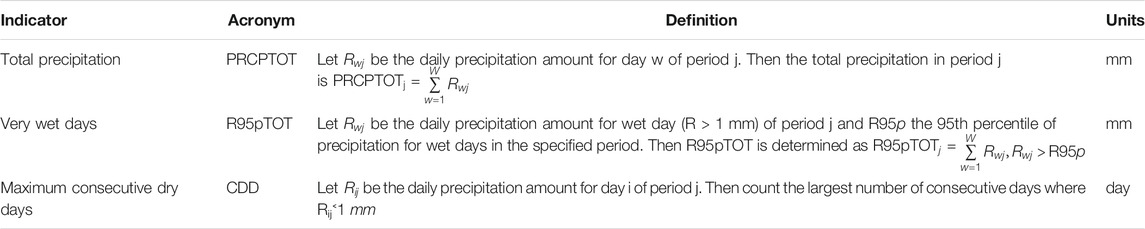
TABLE 2. Indicators used in this study.
In this study, the root mean square error (RMSE) was used as the criterion for evaluating modeled precipitation.
where X represents the GCM precipitation, Y represents the observation value, and n represents the series length, i represents the number of the variable.
The Mann—Kendall (MK) Trend Test Method
MK trend test method is used to analyze hydrological series trends. The MK trend test method is widely used because of its simplicity (Mann 1945; Kendall 1990; Hamed 2008). When the standard normal statistics Z is beyond the threshold of [−2.32, 2.32], the hydrological series has a significance changing rate at the 99% confidence level. The standard normal statistics Z is calculated as follow:
where S is a statistic,
where n represents the series length, i, j represents the number of the variable, sgn is calculated as:
Sen’s Slope Estimator Test
We use Sen’s slope estimator (Swain 2014; Verma et al., 2016) to detect the linear trend of precipitation in this study. The size of the trend is given as:
where
Regions
There are considerable differences in the climate and geographical characteristics across the world. Therefore, regional assessments are more meaningful for practical guidance. The following factors should be considered when choosing regions (Giorgi and Francisco 2000): 1) the shape of the regions should be simple; 2) within a region, the climate and geographical characteristics should be similar; and 3) the regions should cover all the land except Antarctica. Based on the above standards, the world can be divided into 21 regions (Giorgi and Francisco 2000) (Figure 1). The 21 regions include Australia (AUS), Amazon Basin (AMZ), Southern South America (SSA), Central America (CAM), Western North America (WNA), Central North America (CAN), Eastern North America (ENA), Alaska (ALA), Greenland (GRL), Mediterranean Basin (MED), Northern Europe (NEU), Western Africa (WAF), Eastern Africa (EAF), Southern Africa (SAF), Sahara (SAH), Southeast Asia (SEA), East Asia (EAS), South Asia (SAS), Central Asia (CAS), Tibet (TIB), and North Asia (NAS). Table 3 provides detailed information on the 21 regions.
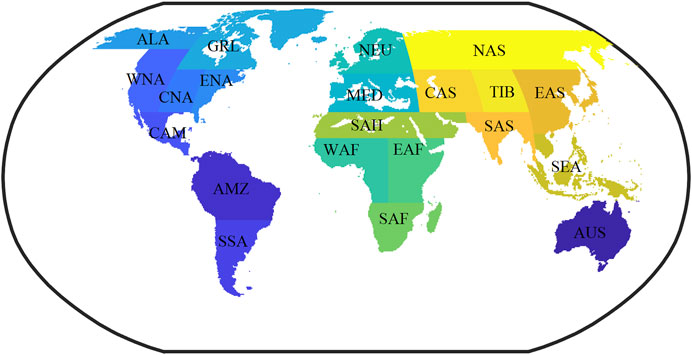
FIGURE 1. Regions used in this study.
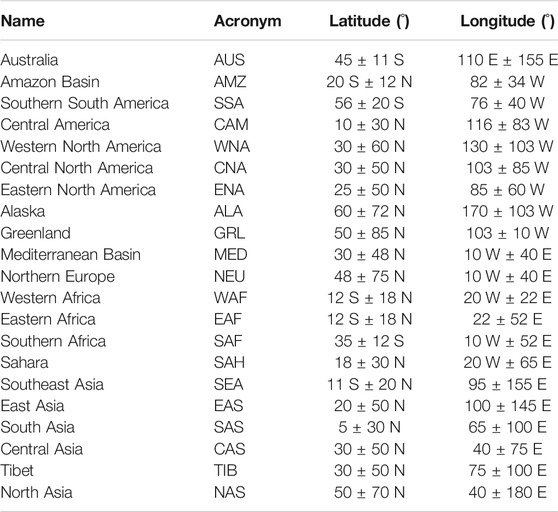
TABLE 3. List of regions used in this study. Only land grid points are used in the analysis.
Results and Discussions
Evaluation of CMIP5 and CMIP6 Historical Precipitation Simulation Capabilities
PRCPTOT, R95pTOT, and CDD were selected to evaluate the agreement between the simulated GCMs and the observed data in the historical period. The RMSE was used to characterize the simulation capability; the lower the RMSE, the better the simulation capability. The global distribution maps of the multi-model mean RMSE of the three indicators in the historical period for CMIP5 and CMIP6 are shown in Supplementary Figures S1–S3. Global distribution maps of the RMSE difference between CMIP5 and CMIP6 are shown in Figure 2, calculated by the RMSE of CMIP5 minus the RMSE of CMIP6.
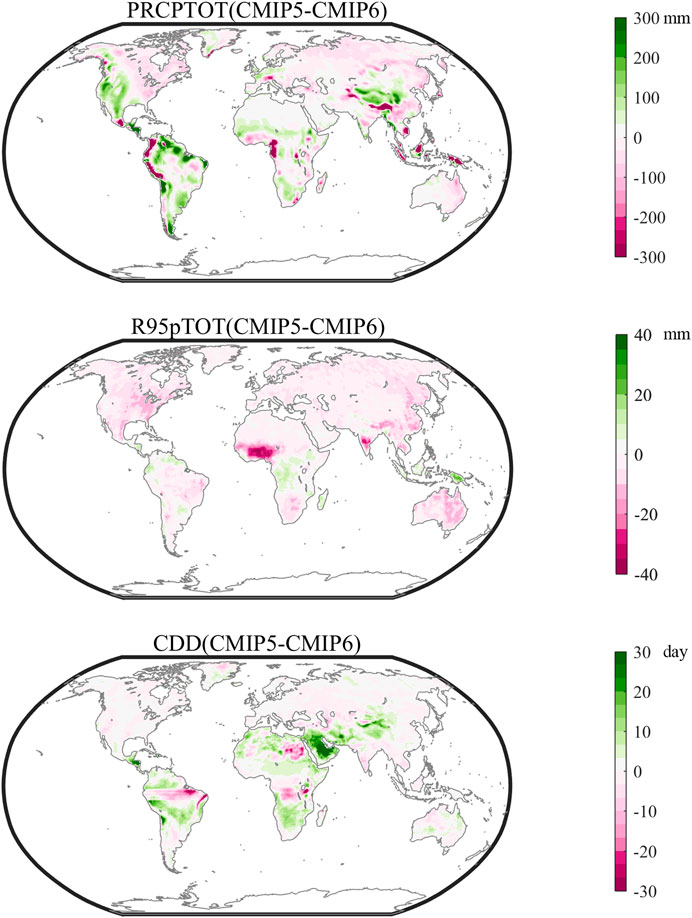
FIGURE 2. Global distribution maps of root-mean-square error (RMSE) difference between CMIP5 and CMIP6. The multi-model mean RMSE of PCRPTOT, R95pTOT, CDD is calculated based on the data in the historical period (1982–2005). When the RMSE of CMIP5 is bigger than that of CMIP6 (green color), it means that CMIP6 has better simulation performance than CMIP5. When the RMSE of CMIP5 is small than that of CMIP6 (red color), it means that CMIP6 has worse simulation performance than CMIP5.
Figure 2 shows the following: 1) for PRCPTOT, the simulation ability of CMIP6 improved in CAM, WNA, SAH, TIB, the east coast of AMZ, the coastal areas of SAF and SSA. However, the simulation effect of CMIP6 in SAS the west coast of AMZ and WAF is slightly worse than in CMIP5. Overall, CMIP6 has no advantage over CMIP5. 2) For R95pTOT, the overall simulation effect of CMIP6 decreases, especially in WAF. 3) For CDD, the simulation ability of CMIP6 improved in eastern SAH, SAF, and central South America. However, the simulation ability of CMIP6 is weakened in Northeastern Brazil, central Africa, and central SAH. The areas with large differences between CMIP5 and CMIP6 are mainly concentrated at low latitudes. Same as PRCPTOT, CMIP6 has no advantage over CMIP5 in CDD simulation.
The land-average RMSE values of the sixteen GCMs are listed in Supplementary Table S1 and drawn in Figure 3. Comparing the land-average RMSE of the GCM, which participates in both CMIP5 and CMIP6, the precipitation indicator simulation capability of a single GCM in CMIP6 is not enhanced compared to that of CMIP5.
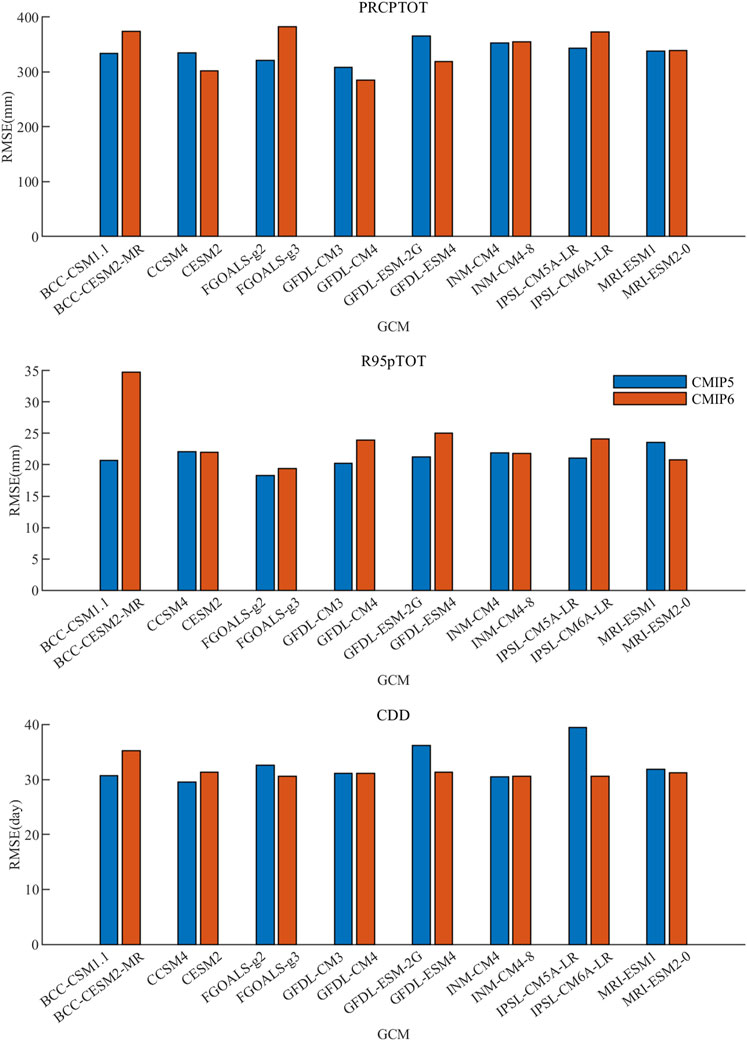
FIGURE 3. The land-average RMSE of the PCRPTOT, R95pTOT, CDD in the historical period (1982–2005) of each General Circulation Model (GCM) in CMIP5 and CMIP6.
In general, CMIP6 has no overall advantage over CMIP5 in the simulation of PRCPTOT and CDD. The performance of CMIP6 increases or decreases regionally in PRCPTOT and CDD. But it is slightly worse than CMIP5 in the simulation of R95pTOT.
Trend Analysis and Comparison of Long Series Precipitation in CMIP5 and CMIP6
The Mann—Kendall (MK) trend test method is used to analyze precipitation series trends. The spatial distributions of the Sen’s slope estimator test (β) for multi-model mean PRCPTOT, R95pTOT, and CDD are shown in Figures 4–6, which show β values of the long series precipitation (1982–2100) under different future scenarios in CMIP5 and CMIP6. And the positive β values mean the increasing trend of precipitation indices and vice versa. In addition, the points in Figures 4–6 represent non-significant trend at the 99% confidence level based on the MK test. Besides, the global distribution maps of β without showing the significant areas are shown in Supplementary Figures S4–S6. And global distribution maps of β difference between CMIP5 and CMIP6 are also shown in Supplementary Figures S7–S9.
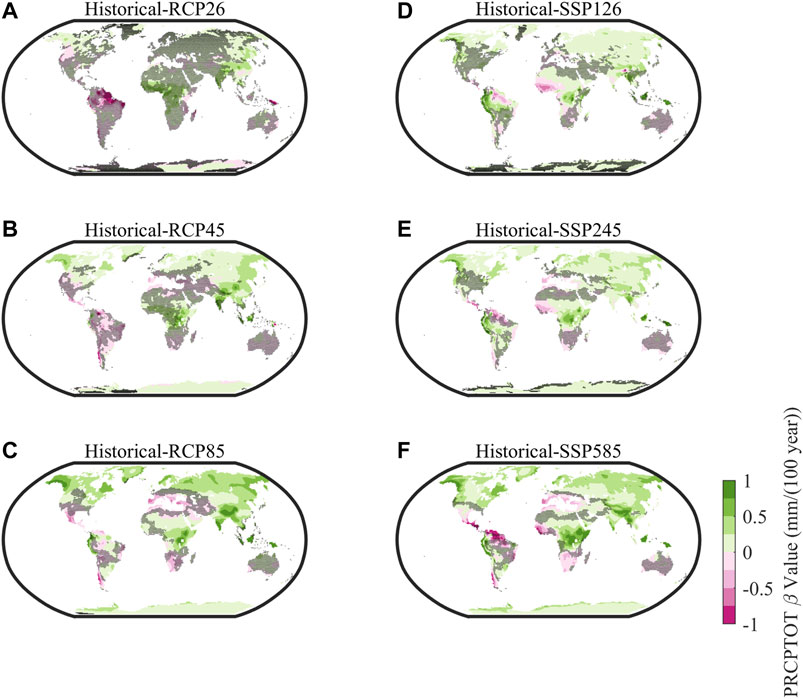
FIGURE 4. The spatial distributions of the Sen’s slope estimator test (β) for multi-model mean PRCPTOT. It shows β values of the long series precipitation (1982–2100) under different future scenarios in CMIP5 (A–C) and CMIP6 (D–F). The points represent non-significant trend at the 99% confidence level based on the MK test.
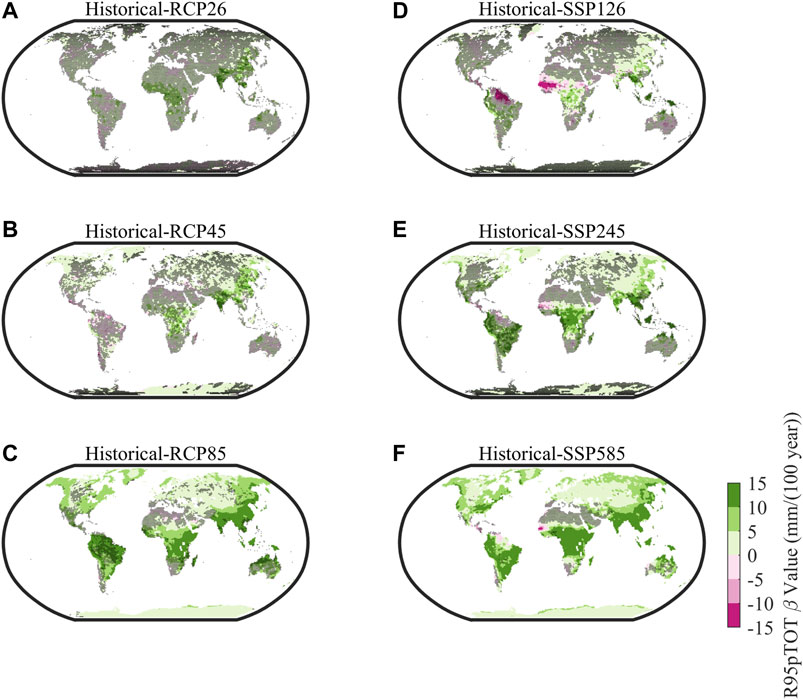
FIGURE 5. The spatial distributions of the Sen’s slope estimator test (β) for multi-model mean R95pTOT. It shows β values of the long series precipitation (1982–2100) under different future scenarios in CMIP5 (A–C) and CMIP6 (D–F). The points represent non-significant trend at the 99% confidence level based on the MK test.
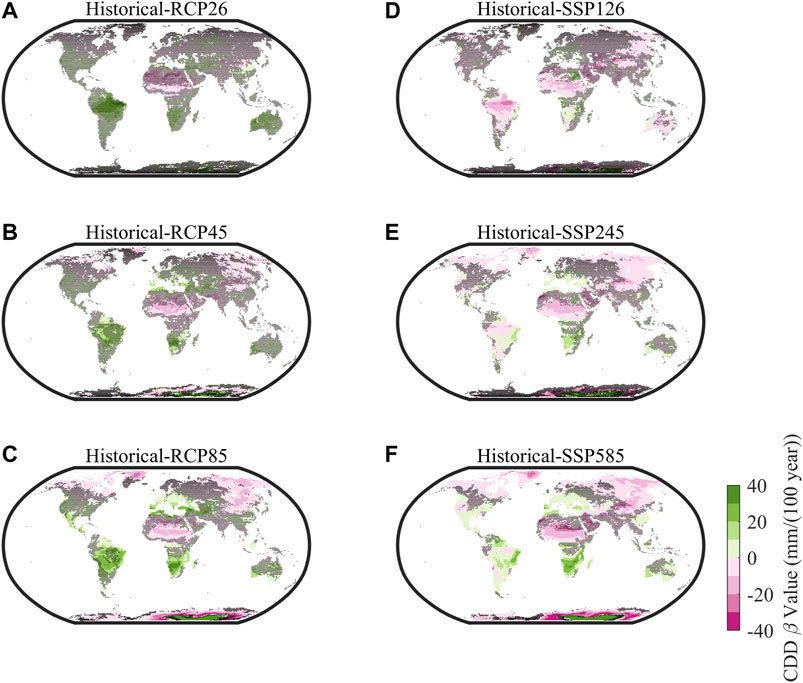
FIGURE 6. The spatial distributions of the Sen’s slope estimator test (β) for multi-model mean CDD. It shows β values of the long series precipitation (1982–2100) under different future scenarios in CMIP5 (A–C) and CMIP6 (D–F). The points represent non-significant trend at the 99% confidence level based on the MK test.
Figure 4 shows that: 1) PRCPTOT shows an increasing trend from the historical period to the future in many parts of the world under three future scenarios, especially for SSP585 (RCP85) scenarios with significant increase for most areas. Specifically, for SSP245 (RCP45) and SSP585 (RCP85) scenarios, there is a significant increasing trend for PRCPTOT in most regions of ALA, GRL, WNA, ENA, NEU, EAF, and the whole Asia. And the results of MK test show a significant decreasing trend in most parts of CAM and SAF; 2) Comparing the trend from the historical period to the future of CMIP5 and CMIP6, the β values in CMIP5 and CMIP6 show roughly similar spatial distributions in most land areas. There are, however, some exceptions, such as the fact that there is an opposite trend in some areas of AMZ and WAF for CMIP5 and CMIP6. In addition, the differences also exist in the degree of increasing/decreasing trend and coverage area; 3) We can also see more regions with significant trend based on MK test in CMIP6 compared with that of CMIP5. And as the level of radiative forcing increases (RCP26/SSP126---RCP45/SSP245----RCP85/SSP585), there are more regions showing significant change from the historical period to the future.
Figure 5 shows that: 1) all of the CMIP5 and CMIP6 GCMs indicate that R95pTOT will most likely increase across most of World from the historical period to the future under three future scenarios. That is to say, in general R95pTOT increases over wider and decreases over smaller areas than PRCPTOT. For example, under the scenarios of SSP585 (RCP85), except for a few regions in WAF and SAF, the R95pTOT for almost all land areas (with black dots) shows a significant increasing trend. This may lead to more extreme flooding in the world under global warming scenarios based on the CMIP5 and CMIP6 simulations; 2) for the average extreme precipitation indices (R95pTOT) shown in Figure 4, we can also see that the trends from the historical period to the future from all CMIP5 and CMIP6 GCMs display same directions (increase or decrease) compared with PRCPTOT for many regions, which is helpful to discern uniform trend for a particular region. However, in some regions of AMZ and SSA where PRCPTOT decreases, there is a statistically signi?cant increase in R95pTOT for all CMIP5 and CMIP6 future scenarios.
Figure 6 shows that: 1) more regions in the world for CDD show a significant decreasing trend. Specifically, CDD shows a significant decreasing trend mainly in several regions of NAS and EAS, WAF and EAF, and SAH. Under the three future scenarios, the area with the decreasing trend is larger than the area with an increasing trend, indicating that the probability of drought shows a decreasing trend in the future. 2) Comparing the results of CMIP5 and CMIP6 from the historical period to and the future, the CDD of the two projects is different in some regions. For example, some areas in AMZ and SSA show an increasing trend for CMIP5 and a decreasing trend in CMIP6; 3) similar spatial patterns are shown for CMIP5/CMIP6 future scenarios. In addition, there are larger areas showing stronger decrease trend for CDD from SSP126 (RCP26) scenario to SSP585 (RCP85) scenario.
Changing Rate Comparison of Precipitation in the Future Over the History
Calculates the multi-model changing rates in each 1° × 1° land grid in the near-future (2028–2060) and far-future periods (2068–2100) with respect to the historical period (1982–2014) in CMIP5 and CMIP6. Box plots for PRCPTOT multi-model mean changing rates over 21 regions (Table 3) in the near-future and far-future periods are shown in Figures 7, 8, respectively. Box plots for R95pTOT are shown in Figures 9, 10. Box plots for CDD are shown in Figures 11, 12.
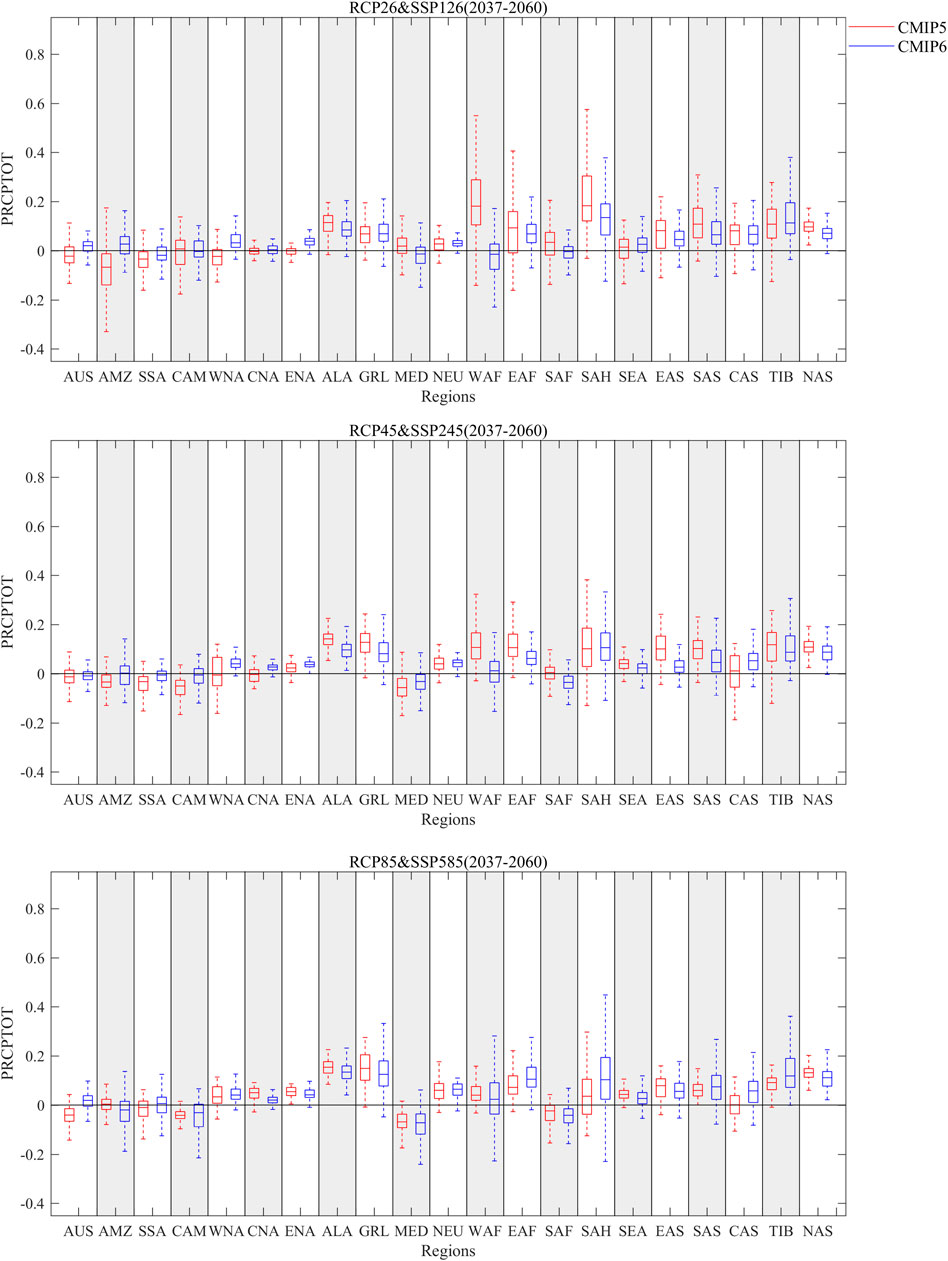
FIGURE 7. Box plots for PRCPTOT multi-model mean changing rates in 21 regions in near-future period (2028–2060) over the historical period (1982–2005) in CMIP5 and CMIP6. CMIP5 is presented in red and CMIP6 is presented in blue.
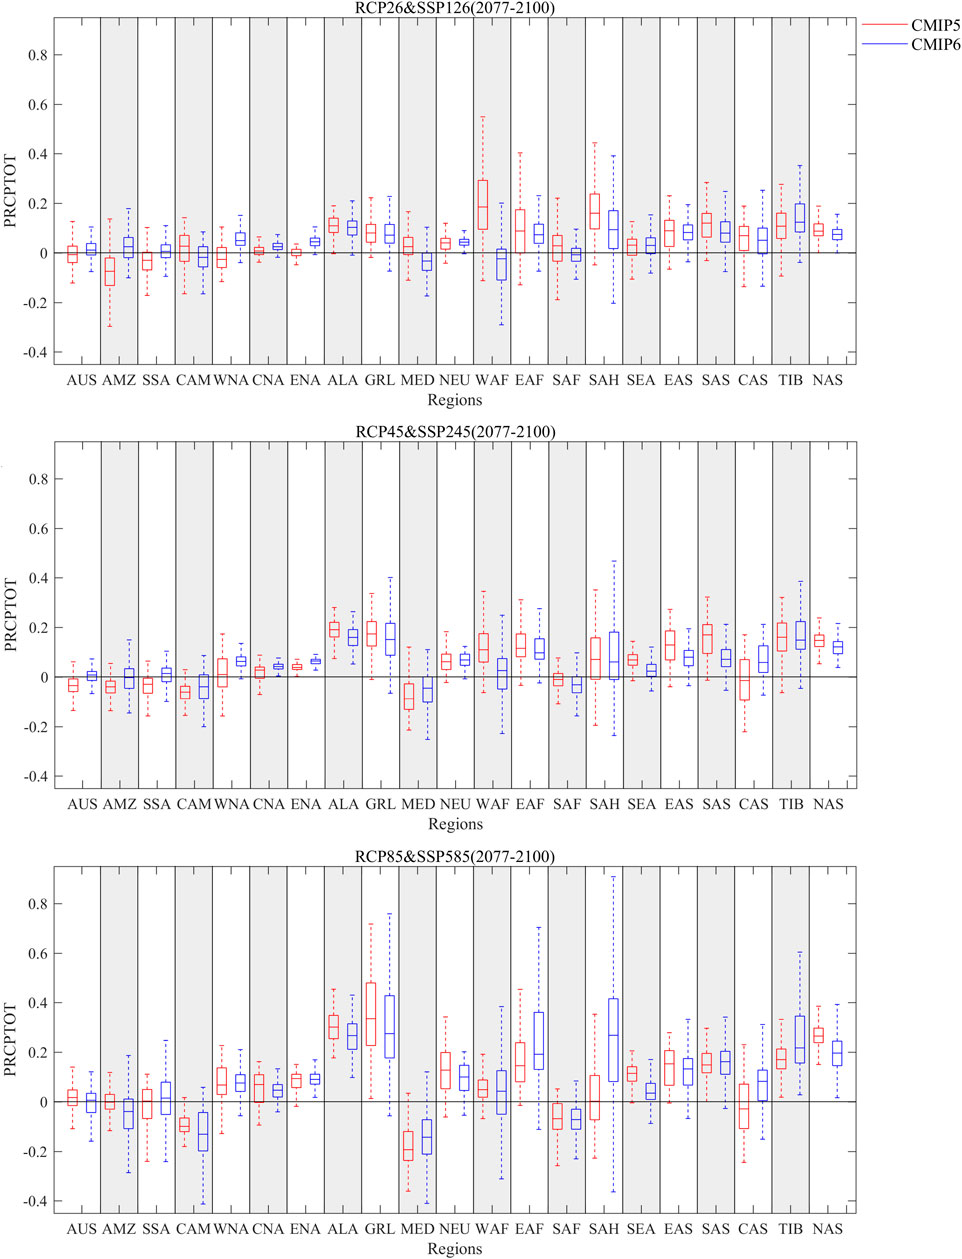
FIGURE 8. Box plots for PRCPTOT multi-model mean changing rates in 21 regions in far-future period (2068–2100) over the historical period (1982–2005) in CMIP5 and CMIP6. CMIP5 is presented in red and CMIP6 is presented in blue.
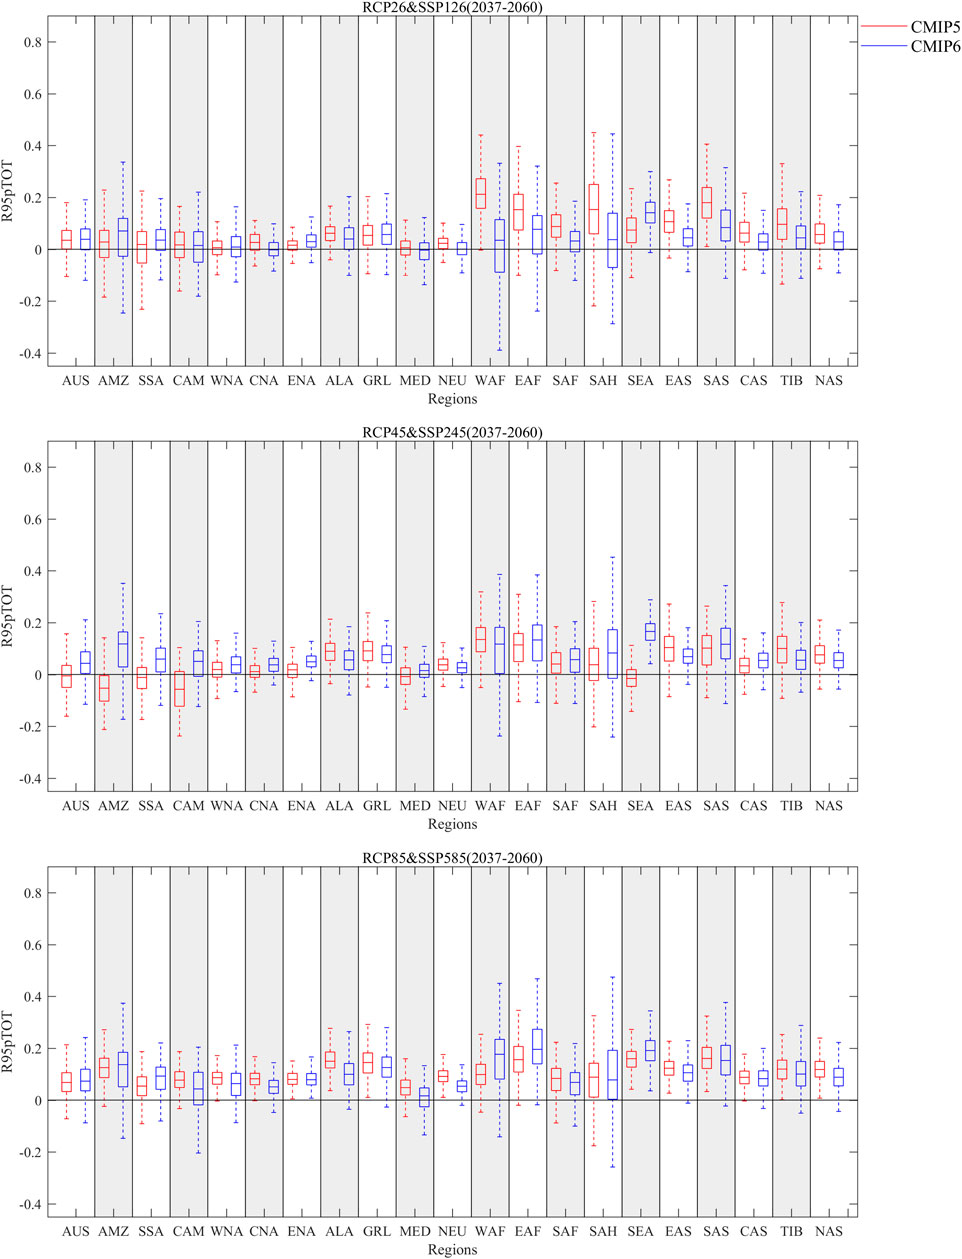
FIGURE 9. Box plots for R95pTOT multi-model mean changing rates in 21 regions in near-future period (2028–2060) over the historical period (1982–2005) in CMIP5 and CMIP6. CMIP5 is presented in red and CMIP6 is presented in blue.

FIGURE 10. Box plots for R95pTOT multi-model mean changing rates in 21 regions in far-future period (2068–2100) over the historical period (1982–2005) in CMIP5 and CMIP6. CMIP5 is presented in red and CMIP6 is presented in blue.
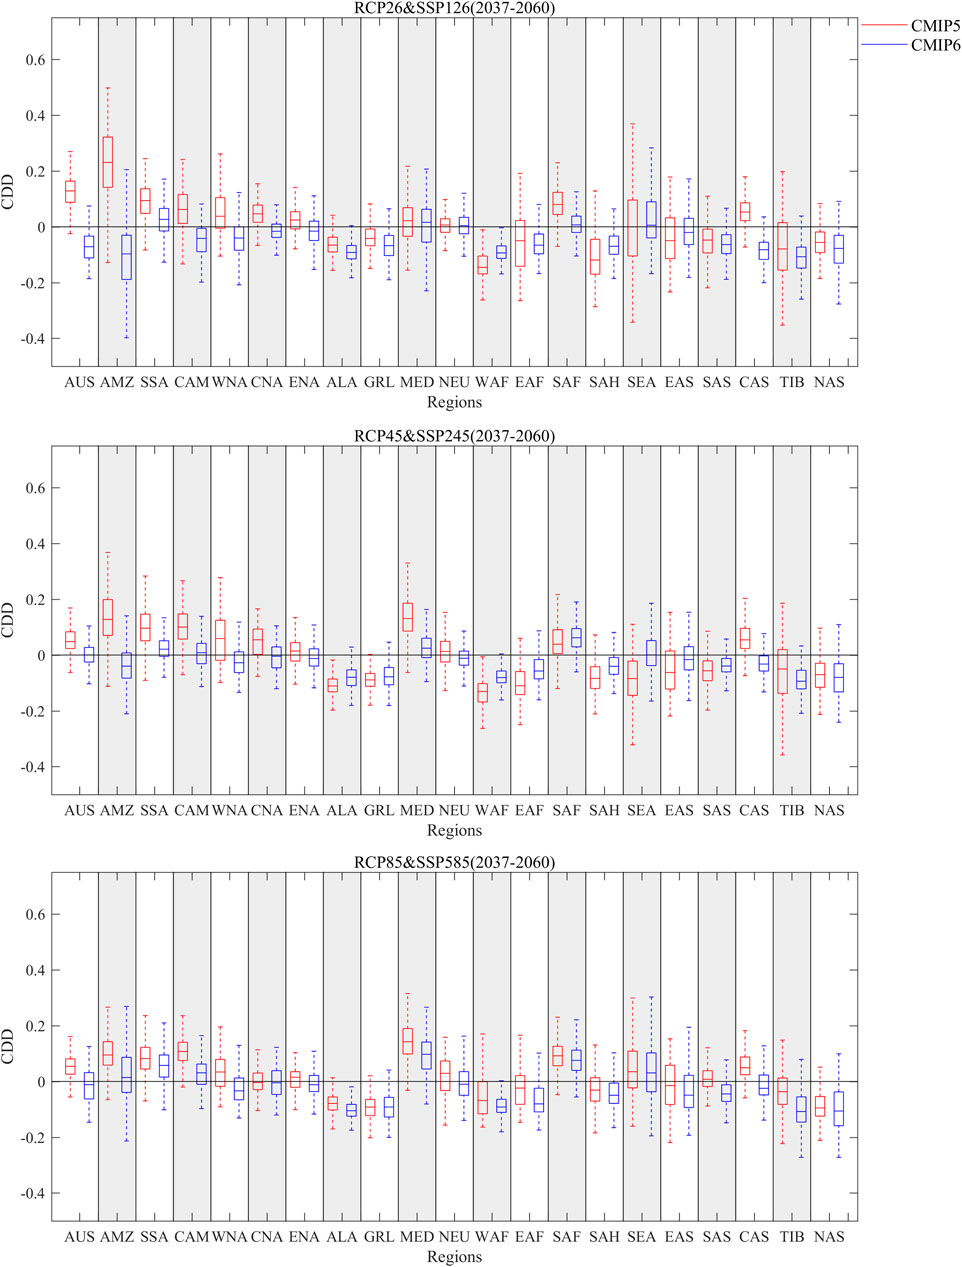
FIGURE 11. Box plots for CDD multi-model mean changing rates in 21 regions in near-future period (2028–2060) over the historical period (1982–2005) in CMIP5 and CMIP6. CMIP5 is presented in red and CMIP6 is presented in blue.
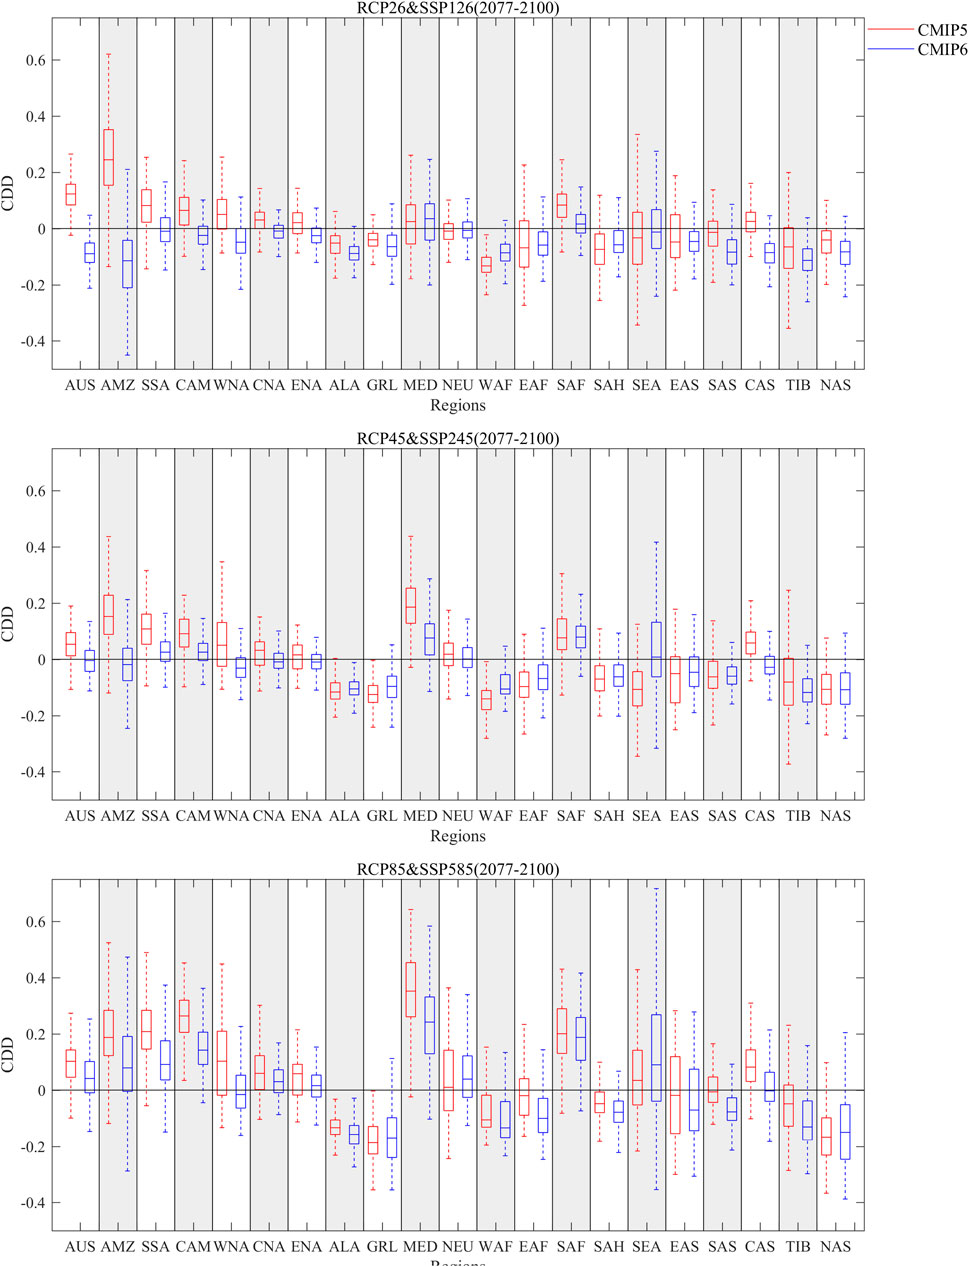
FIGURE 12. Box plots for CDD multi-model mean changing rates in 21 regions in far-future period (2068–2100) over the historical period (1982–2005) in CMIP5 and CMIP6. CMIP5 is presented in red and CMIP6 is presented in blue.
Figures 7, 8 shows that for PRCPTOT, the agreement between CMIP5 and CMIP6 is good because there are few regions where the changing rates simulated by CMIP5 and CMIP6 diverge. Under SSP126 (RCP26) and SSP245 (RCP45), the far future changes slightly compared with the near future. However, for SSP585 (RCP85), the far future changes significantly compared to the near future. PRCPTOT will inevitably increase in the future under the three scenarios, especially in ALA, GRL, NEU, EAF, SAH, EAS, TIB, NAS. However, not all regions of the world will show an increase in PRCPTOT. Compared with CMIP5, CMIP6 changing rate does not show an overall increase or decrease trend. In some regions, the changing rate of CMIP6 is greater; in some regions, the changing rate of CMIP6 is less. In the SSA and WNA regions, the changing rate of CMIP6 in the future under various scenarios is always greater than that of CMIP5; in the ALA, WAF, SAF regions, the changing rate of CMIP6 in the future under various scenarios is always less than that of CMIP5. The difference between land-grids is relatively large in WAF and SAH; the difference between land-grids is also large in GRL under SSP585(RCP85). In EAS, the difference between land-grids of CMIP6 is always significantly smaller than that of CMIP5 under various scenarios.
Figures 9, 10 shows that for R95pTOT, the trends of CMIP6 and CMIP5 are similar. As the radiative forcing level increases (from RCP26/SSP126, and RCP45/SSP245 to RCP85/SSP585), the overall changing rate of R95pTOT indicators increases, and the number of regions with a changing rate that is greater than 0 increases for both projects. Under the SSP585 (RCP85) scenario, R95pTOT in all regions increase. For SSP126 (RCP26) and SSP245 (RCP45), the far future changes slightly compared with the near future. However, for SSP585 (RCP85), the far future changes significantly compared to the near future. In the SSA region, the changing rate of CMIP6 in the future under various scenarios is always greater than that of CMIP5; in the region ALA, EAS, NAS regions, the changing rate of CMIP6 in the future under various scenarios is always less than that of CMIP5. The difference between land-grids is relatively large in WAF, EAF, and SAH. In the AMZ, WNA, ALA, WAF, SAH regions, the difference between land-grids of CMIP6 is always bigger than that of CMIP5 under various scenarios.
Figures 11, 12 shows that for CDD, the changing rates between the 21 regions differ significantly. Nearly half of the regions experience a future decline in CDD, and other regions show a future increase in CDD. Under SSP126 (RCP26) and SSP245 (RCP45), the far future changes slightly compared with the near future. However, under SSP585 (RCP85), the far future changes significantly compared to the near future. In almost half of the regions, the changing rate of CMIP6 is less than that of CMIP5 under all scenarios, namely AUS, AMZ, SSA, CAM, WNA, CNA, ENA, CAS, TIB. The difference between land-grids is relatively large in the AMZ and SEA regions. In the WNA, EAF, SAH, EAS, TIB regions, the difference between land-grids of CMIP6 is always significantly smaller than that of CMIP5 under various scenarios. In the GRL, NAS regions, the difference between land-grids of CMIP6 is always significantly bigger than that of CMIP5 under various scenarios.
Comparison of Model Uncertainty in CMIP5 and CMIP6 Precipitation
Figures 13–15 show the data series of land-average PRCPTOT, R95pTOT, and CDD from 1982 to 2100, respectively. The orange and purple solid lines represent the multi-model mean results of CMIP5 and CMIP6, respectively. The upper and lower limits of the orange and purple uncertainty intervals represent the 75 and 25% quantiles, respectively.
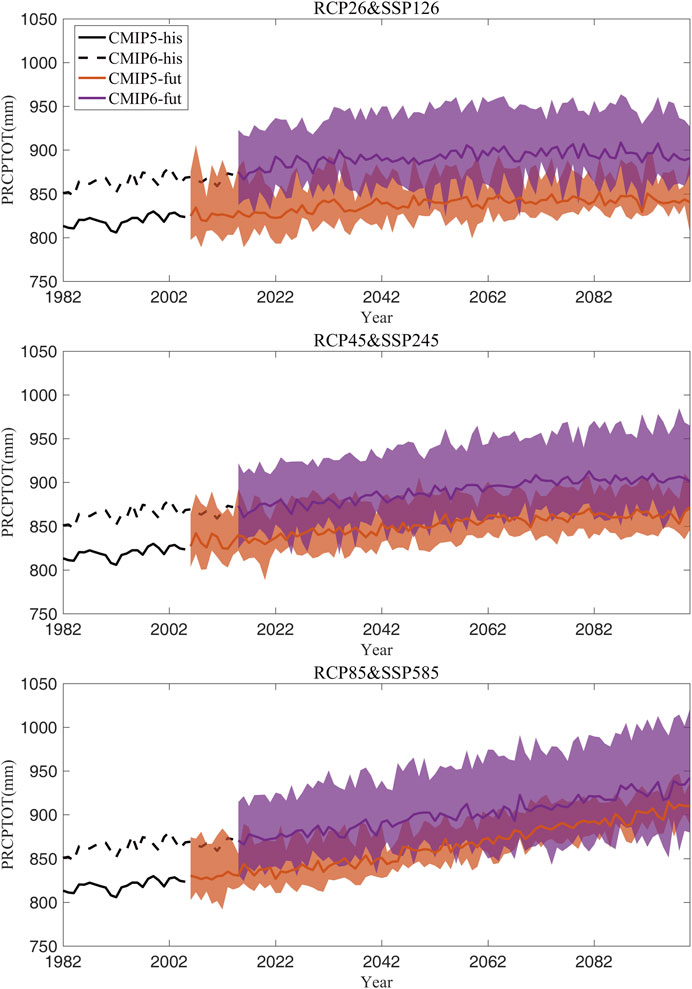
FIGURE 13. Global land-average multi-model mean PRCPTOT during 1982–2100 in CMIP5 and CMIP6. The shaded region shows the uncertainty range (between the 25 quantiles and the 75 quantiles).
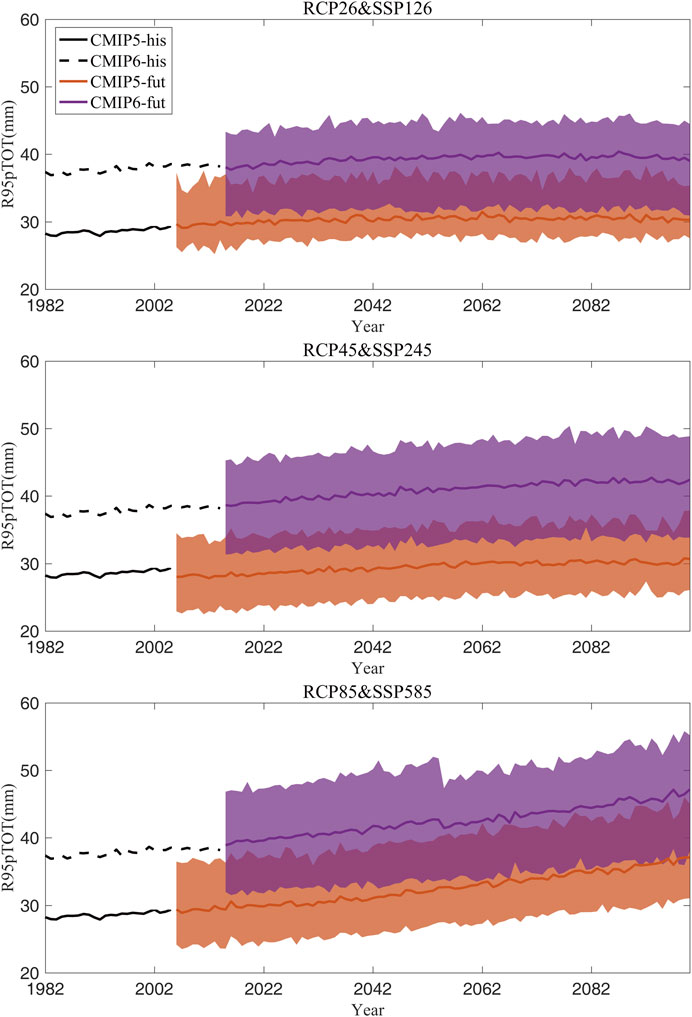
FIGURE 14. Global land-average multi-model mean R95pTOT during 1982–2100 in CMIP5 and CMIP6. The shaded region shows the uncertainty range (between the 25 quantiles and the 75 quantiles).
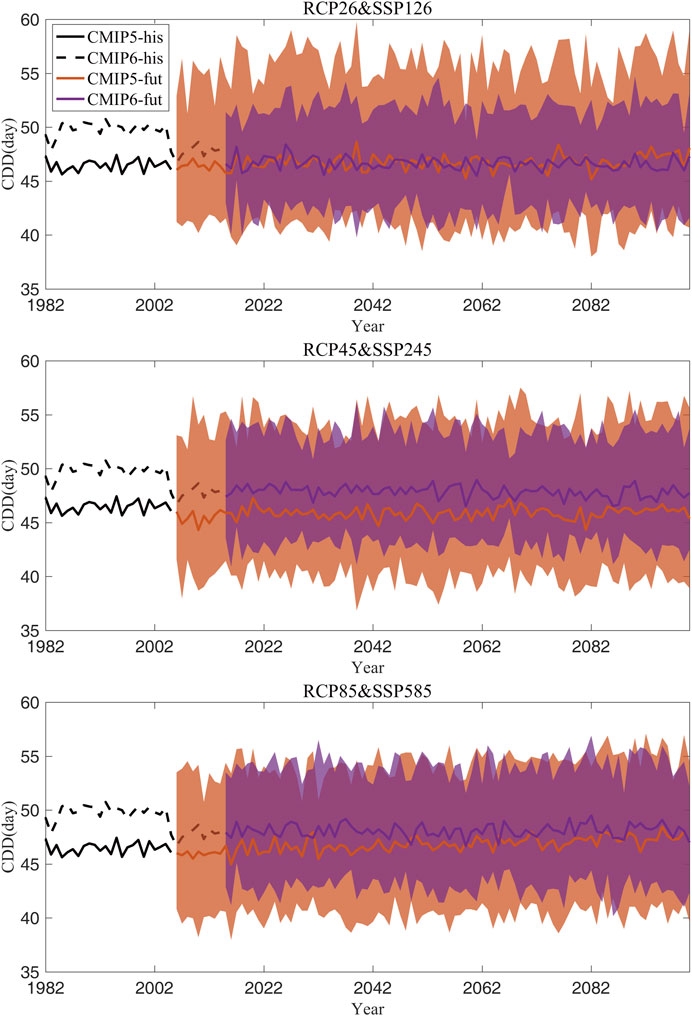
FIGURE 15. Global land-average multi-model mean CDD during 1982–2100 in CMIP5 and CMIP6. The shaded region shows the uncertainty range (between the 25 quantiles and the 75 quantiles).
For PRCPTOT and R95pTOT, both CMIP5 and CMIP6 show a significant increasing trend from the historical period to the end of the 21st century. There are similar fluctuations and trends under the corresponding future scenarios (RCP26 and SSP126; RCP45 and SSP245; RCP85 and SSP585) for CMIP5 and CMIP6. As the level of radiative forcing increases (RCP26/SSP126---RCP45/SSP245----RCP85/SSP585), the increasing trend becomes more apparent. The increase in PRCPTOT is greater than that in R95pTOT. The multi-mode mean PRCPTOT and R95pTOT of CMIP6 are significantly higher than those of CMIP5. The model uncertainty range of PRCPTOT and R95pTOT in CMIP6 is larger than that in CMIP5, with a small overlap area (Figures 13, 14).
However, CDD shows a slight decreasing trend from the historical period to the end of the 21st century in both CMIP5 and CMIP6. The multi-mode mean CDD of CMIP6 is slightly higher than that of CMIP5. The model uncertainty range of CDD in CMIP6 is smaller than that in CMIP5 (Figure 15).
Conclusion
(1) CMIP6 has no overall advantage over CMIP5 in the simulation of PRCPTOT. The performance of CMIP6 of PRCPTOT increases or decreases regionally. For the simulation of R95pTOT, the overall effect of CMIP6 is weaker than that of CMIP5, especially in WAF. Same as PRCPTOT, CMIP6 has no advantage over CMIP5 in CDD simulation. The areas with large differences of CDD between CMIP5 and CMIP6 are mainly concentrated at low latitudes.
(2) The MK trend test method and Sen’s slope estimator test is used to analyze the trends of long series precipitation. Overall, there are more areas with significant trend based on MK test in CMIP6 compared with that of CMIP5. The β values of PRCPTOT in CMIP5 and CMIP6 show roughly similar spatial distributions in most land areas. There are, however, some exceptions, such as the fact that there is an opposite trend in some areas of AMZ and WAF for CMIP5 and CMIP6. The differences between the R95pTOT trends mainly noticeable in South America and WAF. The CDD trend of the two projects is different in some regions. For example, some areas in AMZ and SSA show an increasing trend for CMIP5 and a decreasing trend in CMIP6.
(3) Analyzing the changing rates of the 21 regions in the near-future period and far-future period over the historical period, it can be found that in most regions, the simulated changing rates of CMIP6 have no obvious change direction compared with CMIP5. However, in some regions, CMIP6 has a steady upward or decreasing trend compared to CMIP5. In the SSA and WNA regions, the PRCPTOT changing rate of CMIP6 in the future under various scenarios is always greater than that of CMIP5; in the ALA, WAF, SAF regions, the PRCPTOT changing rate of CMIP6 in the future under various scenarios is always less than that of CMIP5. In the SSA region, the R95pTOT changing rate of CMIP6 in the future under various scenarios is always greater than that of CMIP5; in the ALA, EAS, NAS regions, the R95pTOT changing rate of CMIP6 in the future under various scenarios is always less than that of CMIP5. In almost half of the regions, the changing rate of CMIP6 is less than that of CMIP5 under all scenarios, namely AUS, AMZ, SSA, CAM, WNA, CAN, ENA, CAS, TIB.
(4) For PRCPTOT and R95pTOT, the uncertainty of CMIP6 is larger than that of CMIP5; for CDD, the uncertainty of CMIP6 is smaller than that of CMIP5.
Data Availability Statement
Publicly available datasets were analyzed in this study. This data can be found here GPCC: https://climatedataguide.ucar.edu/climate-data/gpcc-global-precipitation-climatology-centre CMIP5: https://esgf-node.llnl.gov/search/cmip5/ CMIP6: https://esgf-node.llnl.gov/search/cmip6.
Author Contributions
JL, RH, and HC carried out the study design. YZ and TZ download the CMIP5 CMIP6, and GPCC data. JL, RH, TZ, and YZ carried out the calculation. HC was responsible for supervision, project administration and funding acquisition. JL and RH checked the data processing progress. RH and HC reviewed and edited the manuscript after JL wrote the original draft. All authors contributed to the article and approved the final manuscript.
Funding
This work was supported by the National Key Research and Development Program (No. 2017YFA0603702)
Conflict of Interest
The authors declare that the research was conducted in the absence of any commercial or financial relationships that could be construed as a potential conflict of interest.
Supplementary Material
The Supplementary Material for this article can be found online at: https://www.frontiersin.org/articles/10.3389/feart.2021.687976/full#supplementary-material
References
Birkmann, J. (2011). “Regulation and Coupling of Society and Nature in the Context of Natural Hazards,” in Coping with Global Environmental Change, Disasters and Security Berlin, Heidelberg: Springer, 1103–1127. doi:10.1007/978-3-642-17776-7_68
Bracegirdle, T. J., Holmes, C. R., Hosking, J. S., Marshall, G. J., Osman, M., Patterson, M., et al. (2020). Improvements in Circumpolar Southern Hemisphere Extratropical Atmospheric Circulation in CMIP6 Compared to CMIP5. Earth Space Sci. 7 (6), 1065. doi:10.1029/2019EA001065
Chen, H., Sun, J., Lin, W., and Xu, H. (2020). Comparison of CMIP6 and CMIP5 Models in Simulating Climate Extremes. Sci. Bull. 65 (17), 1415–1418. doi:10.1016/j.scib.2020.05.015
Davy, R., and Outten, S. (2020). The Arctic Surface Climate in CMIP6: Status and Developments since CMIP5. J. Clim. 33 (18), 8047–8068. doi:10.1175/JCLI-D-19-0990.1
Fan, X., Miao, C., Duan, Q., Shen, C., and Wu, Y. (2020). The Performance of CMIP6 versus CMIP5 in Simulating Temperature Extremes over the Global Land Surface. J. Geophys. Res. Atmos. 125 (18), 33031. doi:10.1029/2020JD033031
Forestieri, A., Arnone, E., Blenkinsop, S., Candela, A., Fowler, H., and Noto, L. V. (2018). The Impact of Climate Change on Extreme Precipitation in Sicily, Italy. Hydrological Process. 32 (3), 332–348. doi:10.1002/hyp.11421
Fuchs, T., Schneider, U., and Rudolf, B. (2009). The Global Precipitation Climatology Centre (GPCC)-In Situ Observation Based Precipitation Climatology on Regional and Global Scale. EGUGA 11, 10519.
Funk, C., Davenport, F., Eilerts, G., Nourey, N., and Galu, G. (2018). Contrasting Kenyan Resilience to Drought: 2011 and 2017. USAID Special Rep.
Funk, C., Shukla, S., Thiaw, W. M., Rowland, J., Hoell, A., McNally, A., et al. (2019). Recognizing the Famine Early Warning Systems Network: Over 30 Years of Drought Early Warning Science Advances and Partnerships Promoting Global Food Security. Bull. Am. Meteorol. Soc. 100 (6), 1011–1027. doi:10.1175/BAMS-D-17-0233.1
Gao, L., Tao, B., Miao, Y., Zhang, L., Song, X., Ren, W., et al. (2019). A Global Dataset for Economic Losses of Extreme Hydrological Events during 1960‐2014. Water Resour. Res. 55 (6), 5165–5175. doi:10.1029/2019WR025135
Giorgi, F., and Francisco, R. (2000). Uncertainties in Regional Climate Change Prediction: A Regional Analysis of Ensemble Simulations with the HADCM2 Coupled AOGCM. Clim. Dyn. 16 (2), 169–182. doi:10.1007/PL00013733
Gusain, A., Ghosh, S., and Karmakar, S. (2020). Added Value of CMIP6 over CMIP5 Models in Simulating Indian Summer Monsoon Rainfall. Atmos. Res. 232, 104680. doi:10.1016/j.atmosres.2019.104680
Hamed, K. H. (2008). Trend Detection in Hydrologic Data: The Mann-Kendall Trend Test under the Scaling Hypothesis. J. Hydrol. 349 (3-4), 350–363. doi:10.1016/j.jhydrol.2007.11.009
Hosseinzadehtalaei, P., Tabari, H., and Willems, P. (2020). Climate Change Impact on Short-Duration Extreme Precipitation and Intensity-Duration-Frequency Curves over Europe. J. Hydrol. 590, 125249. doi:10.1016/j.jhydrol.2020.125249
IPCC (2007). IPCC Fourth Assessment Report: Working Group II Report "Impacts, Adaptation and Vulnerability. Cambridge: Cambridge University Press.
IPCC (2013). Summary for Policymakers Climate Change 2013: The Physical Science Basis. Contribution of Working Group I to the Fifth Assessment Report of the Intergovernmental Panel on Climate Change. Cambridge: Cambridge University Press.
Jiang, D., Hu, D., Tian, Z., and lang, X. (2020). Differences between CMIP6 and CMIP5 Models in Simulating Climate over China and the East Asian Monsoon. Adv. Atmos. Sci. 37 (10), 1102–1118. doi:10.1007/s00376-020-2034-y
Kendall, M. G. (1990). Rank Correlation Methods. Br. J. Psychol. 25 (1), 86–91. doi:10.1111/j.2044-8295.1934.tb00727.x
Khan, A., Koch, M., and Tahir, A. (2020). Impacts of Climate Change on the Water Availability, Seasonality and Extremes in the Upper Indus Basin (UIB). Sustainability 12 (4), 1283. doi:10.3390/su12041283
Kundzewicz, Z. W., Kanae, S., Seneviratne, S. I., Handmer, J., Nicholls, N., Peduzzi, P., et al. (2014). Flood Risk and Climate Change: Global and Regional Perspectives. Hydrological Sci. J. 59 (1), 1–28. doi:10.1080/02626667.2013.857411
Lal, P., Prakash, A., Kumar, A., Srivastava, P. K., Saikia, P., Pandey, A. C., et al. (2020). Evaluating the 2018 Extreme Flood hazard Events in Kerala, India. Remote Sensing Lett. 11 (5), 436–445. doi:10.1080/2150704X.2020.1730468
Li, L., Shen, M., Hou, Y., Xu, C.-Y., Lutz, A. F., Chen, J., et al. (2019). Twenty-first-century Glacio-Hydrological Changes in the Himalayan Headwater Beas River basin. Hydrol. Earth Syst. Sci. 23 (3), 1483–1503. doi:10.5194/hess-23-1483-2019
Madsen, H., Lawrence, D., Lang, M., Martinkova, M., and Kjeldsen, T. R. (2014). Review of Trend Analysis and Climate Change Projections of Extreme Precipitation and Floods in Europe. J. Hydrol. 519, 3634–3650. doi:10.1016/j.jhydrol.2014.11.003
Mann, H. B. (1945). Nonparametric Tests Against Trend. Econometrica 13, 245–259. doi:10.2307/1907187
Meehl, G. A., Boer, G. J., Covey, C., Latif, M., and Stouffer, R. J. (2000). The Coupled Model Intercomparison Project (CMIP). Bull. Amer. Meteorol. Soc. 81 (2), 313–318. doi:10.1175/1520-0477(2000)081<0313:tcmipc>2.3.co;2
Moss, R. H., Edmonds, J. A., Hibbard, K. A., Manning, M. R., Rose, S. K., Van Vuuren, D. P., et al. (2010). The Next Generation of Scenarios for Climate Change Research and Assessment. Nature 463 (7282), 747–756. doi:10.1038/nature08823
Ortiz-Gómez, R., Muro-Hernández, L. J., and Flowers-Cano, R. S. (2020). Assessment of Extreme Precipitation through Climate Change Indices in Zacatecas, Mexico. Theor. Appl. Climatol 141 (3), 1541–1557. doi:10.1007/s00704-020-03293-2
Rahmani, V., and Harrington, J. (2019). Assessment of Climate Change for Extreme Precipitation Indices: A Case Study from the central United States. Int. J. Climatol 39 (2), 1013–1025. doi:10.1002/joc.5858
Swain, S. (2014). Impact of Climate Variability over Mahanadi River Basin. Int. J. Eng. Res. Tech. 3 (7), 938–943. doi:10.1109/INSS.2009.5409957
Ukkola, A. M., De Kauwe, M. G., Roderick, M. L., Abramowitz, G., and Pitman, A. J. (2020). Robust Future Changes in Meteorological Drought in CMIP6 Projections Despite Uncertainty in Precipitation. Geophys. Res. Lett. 47 (11), 820. doi:10.1029/2020GL087820
Ulbrich, U., Brücher, T., Fink, A. H., Leckebusch, G. C., Krüger, A., and Pinto, J. G. (2003). The central European Floods of August 2002: Part 1 - Rainfall Periods and Flood Development. Weather 58 (10), 371–377. doi:10.1256/wea.61.03A
Van Vuuren, D. P., Kriegler, E., O’Neill, B. C., Ebi, K. L., Riahi, K., Carter, T. R., et al. (2014). A New Scenario Framework for Climate Change Research: Scenario Matrix Architecture. Climatic Change 122 (3), 373–386. doi:10.1007/s10584-013-0906-1
Verma, M. K., Verma, M. K., and Swain, S. (2016). Statistical Analysis of Precipitation over Seonath River Basin, Chhattisgarh, India. Int. J. Appl. Eng. Res. 11 (4), 2417–2423.
Veronika, E., Sandrine, B., Meehl, G. A., Senior, C. A., Bjorn, S., Stouffer, R. J., et al. (2016). Overview of the Coupled Model Intercomparison Project Phase 6 (CMIP6) Experimental Design and Organization. Geoentific Model. Dev. 9 (5), 1937–1958. doi:10.5194/gmd-9-1937-2016
Wang, Y., Xu, Y., Lei, C., Li, G., Han, L., Song, S., et al. (2016). Spatio-temporal Characteristics of Precipitation and Dryness/wetness in Yangtze River Delta, Eastern China, during 1960-2012. Atmos. Res. 172–173, 196–205. doi:10.1016/j.atmosres.2016.01.008
Wyser, K., van Noije, T., Yang, S., von Hardenberg, J., O'Donnell, D., and Döscher, R. (2020). On the Increased Climate Sensitivity in the EC-Earth Model from CMIP5 to CMIP6. Geosci. Model. Dev. 13 (8), 3465–3474. doi:10.5194/gmd-13-3465-2020
Xin, X., Wu, T., Zhang, J., Yao, J., and Fang, Y. (2020). Comparison of CMIP6 and CMIP5 Simulations of Precipitation in China and the East Asian Summer Monsoon. Int. J. Climatol 40, 6423–6440. doi:10.1002/joc.6590
Yuanhai, F. U., Lin, Z., and Guo, D. (2020). Improvement of the Simulation of the Summer East Asian westerly Jet from CMIP5 to CMIP6. Atmos. Oceanic Ence Lett. 13 (6), 1–9. doi:10.1080/16742834.2020.1746175
Zamani, Y., Hashemi Monfared, S. A., Azhdari moghaddam, M., and Hamidianpour, M. (2020). A Comparison of CMIP6 and CMIP5 Projections for Precipitation to Observational Data: the Case of Northeastern Iran. Theor. Appl. Climatol 142 (3–4), 1613–1623. doi:10.1007/s00704-020-03406-x
Zhang, X., Alexander, L., Hegerl, G. C., Jones, P., Tank, A. K., Peterson, T. C., et al. (2011). Indices for Monitoring Changes in Extremes Based on Daily Temperature and Precipitation Data. Wires Clim. Change 2 (6), 851–870. doi:10.1002/wcc.147
Zhu, H., Jiang, Z., Li, J., Li, W., Sun, C., and Li, L. (2020). Does CMIP6 Inspire More Confidence in Simulating Climate Extremes over China?. Adv. Atmos. Sci. 37 (10), 1119–1132. doi:10.1007/s00376-020-9289-1
Zhu, Y.-Y., and Yang, S. (2020). Evaluation of CMIP6 for Historical Temperature and Precipitation over the Tibetan Plateau and its Comparison with CMIP5. Adv. Clim. Change Res. 11 (3), 239–251. doi:10.1016/j.accre.2020.08.001
Keywords: CMIP6, precipitation, worldwide, general circulation models, regions
Citation: Li J, Huo R, Chen H, Zhao Y and Zhao T (2021) Comparative Assessment and Future Prediction Using CMIP6 and CMIP5 for Annual Precipitation and Extreme Precipitation Simulation. Front. Earth Sci. 9:687976. doi: 10.3389/feart.2021.687976
Received: 30 March 2021; Accepted: 14 May 2021;
Published: 24 June 2021.
Edited by:
Alexandre M. Ramos, University of Lisbon, PortugalReviewed by:
Shoji Kusunoki, Meteorological Research Institute, JapanRenata Goncalves Tedeschi, Vale Technological Institute (ITV), Brazil
Copyright © 2021 Li, Huo, Chen, Zhao and Zhao. This is an open-access article distributed under the terms of the Creative Commons Attribution License (CC BY). The use, distribution or reproduction in other forums is permitted, provided the original author(s) and the copyright owner(s) are credited and that the original publication in this journal is cited, in accordance with accepted academic practice. No use, distribution or reproduction is permitted which does not comply with these terms.
*Correspondence: Hua Chen, Y2h1YUB3aHUuZWR1LmNu
†These authors have contributed equally to this work