 Matthew M. Haney
 Helena Buurman2
 Stephen R. McNutt
- 1United States Geological Survey Alaska Volcano Observatory, Anchorage, AK, United States
- 2Geophysical Institute, University of Alaska Fairbanks, Fairbanks, AK, United States
- 3School of Geosciences, University of South Florida, Tampa, FL, United States
Detection of the earliest stages of unrest is one of the most challenging and yet critically needed aspects of volcano monitoring. We investigate a sequence of five unusual long-period (LP) earthquakes that occurred in the days prior to the onset of a months-long volcano-tectonic (VT) earthquake swarm beneath Little Sitkin volcano in the Aleutian Islands during late 2012. The long-period earthquakes had two distinctive characteristics: their signals were dominated by a monochromatic spectral peak at approximately 0.57 Hz and they had impulsive P and S-wave arrivals on a seismometer located on Amchitka Island 80 km to the southeast of the volcano. In each case, the monochromatic earthquakes ended with a higher-frequency event after approximately 2 min of duration. We find evidence that the five monochromatic LP earthquakes resulted from the resonance of a tabular magma body at middle crustal depths (15 km) on the western side of Little Sitkin. Based on the resonant frequency and quality factor of the monochromatic LP earthquakes, we infer the magma body to have a lateral extent of 500 m and a thickness of 9 m. We interpret that a magmatic intrusion excited the monochromatic LP earthquakes and subsequently increased the stress beneath the volcano, leading to the onset of the shallow (<10 km depth) VT swarm five days later.
Introduction
The occurrence of long-period (LP) seismicity at volcanoes is linked to fluid movement within magmatic and hydrothermal systems in the subsurface (Chouet, 1996). As such, it is tracked closely by volcano observatories and certain types of LP seismicity have been observed to precede eruptions (Chouet et al., 1994). The LP frequency band formally extends from 0.5 to 5 Hz (Ohminato et al., 1998) and, as a result, LP seismicity can be measured on both short-period and broadband seismometers. Given that seismic scattering becomes particularly pronounced for seismic waves above approximately 1 Hz, there is generally a question whether the signature of LP events is primarily controlled by path and site effects (Bean et al., 2014) or the underlying source process.
Volcanologists are especially interested in deep (>10 km) long-period seismicity since it offers a window into the middle and lower crustal portions of the magmatic system, portions which are difficult to constrain with geophysical measurements. Deep long period (DLP) earthquakes have been observed as part of the background seismicity at volcanoes (Power et al., 2004; Aso and Tsai, 2014) but can also occur more frequently in the lead-up to an eruption (Power et al., 2013), thus providing some of the earliest indications of developing volcanic unrest. White (1996) observed DLP earthquakes in the weeks prior to the 1991 eruption of Pinatubo and correlated their timing with a deep intrusion of basalt beneath the volcano. DLPs have been observed globally (White and McCausland, 2019) including volcanoes in Japan (Ukawa and Ohtake, 1987), Kamchatka (Shapiro et al., 2017), and Hawaii (Wech et al., 2020). Physical models have been proposed for DLPs (Aso and Tsai, 2014) and hold promise for improving the understanding of their underlying causes and the physical conditions near their source region.
Here we report on a sequence of unusual LP earthquakes that occurred in the days prior to a months-long shallow volcano-tectonic (VT) earthquake swarm at Little Sitkin volcano in the Aleutian Islands (Figure 1). Little Sitkin is a primarily andesitic stratovolcano with no confirmed historical eruptions, although lava flows on the southern and western sides of the island indicate that the most recent activity must have occurred within the last two hundred years (Miller et al., 1998). Current activity consists of fumaroles located on the northwest side of the island. Geologic evidence suggests there were two caldera-forming eruptions in the late Pleistocene (Miller et al., 1998). A local seismic network was installed at the volcano in summer 2005 and, prior to 2012, the most significant activity was a minor swarm in September 2007 that had a total of 108 earthquakes (Dixon et al., 2008; Buurman et al., 2014). The earthquake swarm in 2012 lasted from August 30 through early December, consisted of larger earthquakes up to M2.7, and had a total of 1,221 events (Figure 2). In Figure 2B, we indicate the timing of the precursory LP earthquakes at Little Sitkin with vertical red lines. These precursory LP earthquakes were unusual for at least two reasons: they were dominated by a monochromatic spectral peak at about 0.57 Hz (Figure 3) and had impulsive P and S-wave arrivals on a regional seismometer 80 km away on Amchitka Island (Figure 1). The 0.57 Hz frequency places these events on the low end of the LP band that formally extends from 0.5–5 Hz (Ohminato et al., 1998) and, given the monochromatic nature of the signals, we refer to these events as monochromatic LP earthquakes. Preliminary observations of these unusual events have been summarized by Dixon et al. (2013) and Herrick et al. (2014). In all, there were five monochromatic LP earthquakes between August 23 and 25 and, five days after the final one, a months-long VT swarm began. Results show that these events originated from the resonance of a large tabular magma body at middle crustal depths beneath the western side of Little Sitkin. The monochromatic LP earthquakes represent a rarely observed but important type of DLP seismicity preceding shallow volcanic unrest.
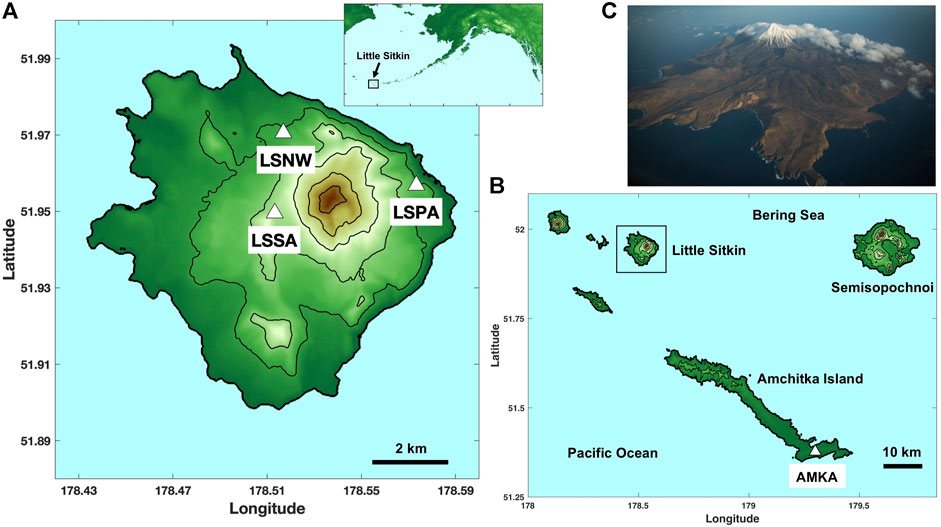
FIGURE 1. (A) Local map of Little Sitkin, with inset showing where the volcano is located along the Aleutian arc. Three short period stations located on the volcano are labeled in the local map. LSSA and LSNW are single-component vertical seismometers, whereas LSPA is three-component. Contour interval is 200 m. (B) Regional map of Little Sitkin showing its location with respect to the neighboring islands in the eastern hemisphere. Regional broadband station AMKA is shown on Amchitka Island. (C) Aerial photograph of Little Sitkin from November 2012 courtesy of Roger Clifford. View is toward the southeast.
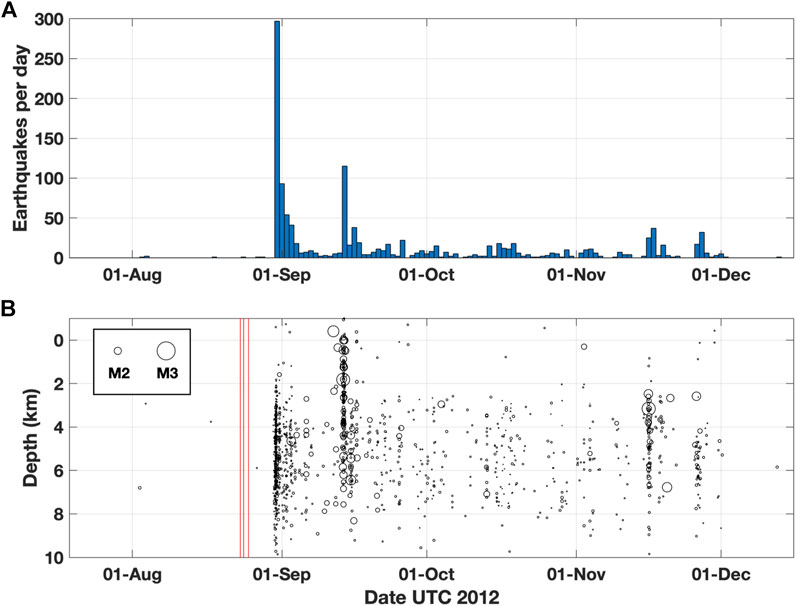
FIGURE 2. (A) Daily rate of earthquakes within 20 km of Little Sitkin in late 2012, taken from the catalog by Power et al. (2019). The earthquake swarm began on August 30 and most of the swarm earthquakes were located within 5 km of the summit. The swarm effectively ended by early December. (B) Depths of the earthquakes at Little Sitkin with magnitude indicated by size of the symbol. Negative depths correspond to locations above sea level. Most of the earthquakes were in the upper 10 km and ranged in magnitude from −1.1 to 2.7. In total, the swarm consisted of 1,221 earthquakes with a cumulative magnitude of 3.4. The times of occurrence of the precursory monochromatic LP earthquakes are shown by the three vertical red lines.
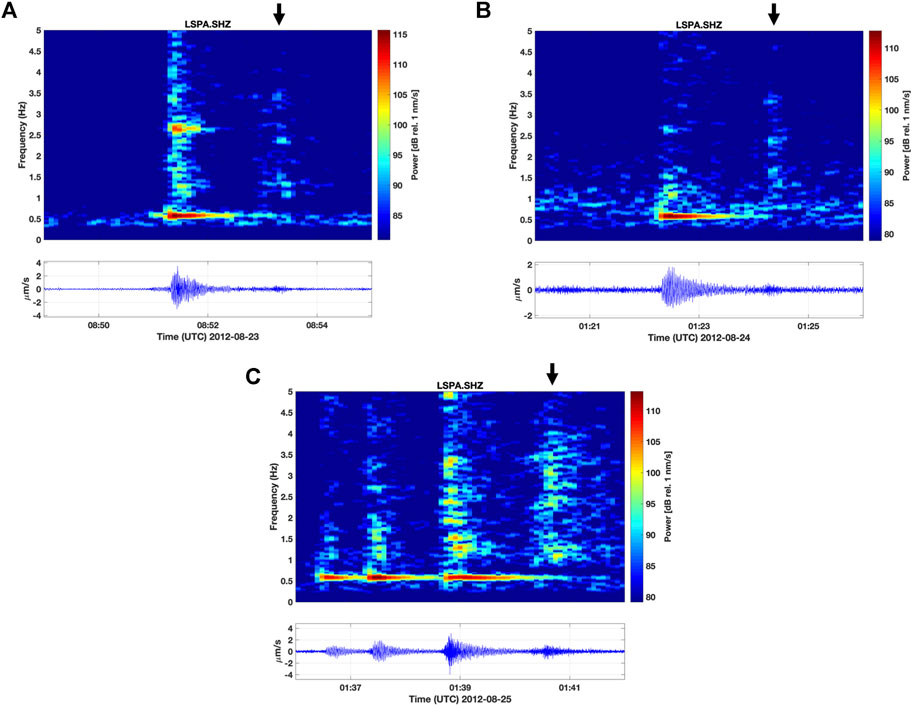
FIGURE 3. Spectrograms of the five monochromatic LP earthquakes at Little Sitkin with seismograms plotted beneath. The events on August 23 and 24 are shown in panels (A, B), respectively. Panel (C) shows the three events that occurred in close succession on August 25. Black arrows in all panels indicate higher frequency radiation observed approximately 2 min after the beginning of the monochromatic LP earthquake. For the three successive events on August 25, this higher frequency signal occurred after the last event. Time and frequency scales are the same for all panels; power and amplitude vary slightly depending on their maximum values.
Data
We analyze seismic data from three short-period seismic stations at Little Sitkin and one broadband seismometer on Amchitka Island (Figure 1). The stations are operated by the Alaska Volcano Observatory (AVO), a cooperative program between the University of Alaska Fairbanks Geophysical Institute, the Alaska Division of Geological and Geophysical Surveys, and the United States Geological Survey. AVO maintains the stations as part of the AV network, which consists of over 200 geophysical sites along the Aleutian arc (Power et al., 2020). The three short-period stations are Mark Products L4 seismometers, with one of the stations (LSPA) being a three-component version of the instrument. The other two stations on Little Sitkin have only a vertical-component L4 sensor. A fourth seismic station named LSSE exists on Little Sitkin (Dixon et al., 2013) but was not functioning properly during the time period of the earthquake swarm in 2012. Data from the Little Sitkin stations are telemetered via radio transmission to a receive facility on Amchitka Island where they are digitized at 50 Hz and sent to a satellite uplink. A seismic station is operated at the receive facility on Amchitka to provide regional monitoring and its sensor is a broadband, three-component Nanometrics Trillium 40 seismometer sampled at 50 Hz. Short-period seismic stations also exist on nearby Semisopochnoi Island (Figure 1); however, they proved not to be useful for the analysis of the monochromatic LP earthquakes since they had a considerably lower signal-to-noize ratio than the regional station at Amchitka.
Methods
Conventional seismic methods in volcano seismology involve first identifying P and S-wave phase arrivals from earthquakes on a local seismic network and then using them to determine the location and origin time of the event with a known velocity model. Once located, the magnitudes of the earthquakes can also be estimated. This type of analysis has been done routinely at volcanoes monitored by AVO since 1989 (Dixon et al., 2013; Power et al., 2019). Such an approach works well for VT earthquakes but is often not optimal for LP events. This is due to the lower-frequency and more emergent signals that are commonly associated with LPs.
Given this limitation, we apply beamforming (Smith and Bean, 2020) to the vertical components of the three local stations to gain insight into where the monochromatic LP earthquakes originate at Little Sitkin. We therefore use the three stations as a tripartite array. An advantage of beamforming is that it can be applied in principle to any type of signal, including emergent ones for which phase arrivals are unclear. A disadvantage is that the wavefield must be coherent across the array. Scattering of seismic waves decreases the coherency of a wavefield measured at different stations and, in practice, this means beamforming is best suited for low frequency seismic waves. For example, Haney et al. (2020) applied a least-squares beamforming method to low frequency (0.05–0.15 Hz) tremor during an eruption from Bogoslof volcano in 2017. The beamforming was performed using six stations from the local seismic network on nearby Makushin Volcano some 80 km away from Bogoslof. Haney et al. (2020) found the tremor wavefield in this low frequency band was composed of seismic surface waves. Using a related stacking method, Haney (2014) imaged the source of tremor during the 2008 eruption of Okmok Volcano in the 0.2–0.3 Hz frequency band using local seismic stations.
In contrast to Haney et al. (2020), here we apply frequency-wavenumber (F-K) instead of least-squares beamforming. The difference between these two methods is that, in the least-squares approach, a single time delay is measured from the cross-correlation between a pair of seismic stations. Such time delays from all combinations of seismic station pairs are subsequently inverted for a single best-fitting plane wave. F-K beamforming, on the other hand, scans over a range of possible plane waves and plots the stacked power for each candidate plane wave in slowness (inverse apparent velocity) space. F-K beamforming (Smith and Bean, 2020) is better suited for analyzing the monochromatic LP earthquakes at Little Sitkin since, by virtue of their narrow frequency band, cross-correlation can lead to an ambiguous time delay for a single station pair. This issue can be understood by considering perfectly monochromatic signals: in that case, cross-correlation between two stations would result in a series of maxima with equal peak values equally spaced in time over multiples of the period. The single maximum associated with the propagation time between the stations would in that case be ambiguous. For this reason, we apply F-K beamforming and the implementation we use is given by:
where the summation is over N stations located at lateral coordinates xn and yn and the stacked power B is evaluated on a grid of horizontal slownesses, sx and sy, at a particular angular frequency ω. The complex-valued displacement seismogram in the Fourier domain for the n-th station is denoted by u(xn, yn, ω). As mentioned previously, at Little Sitkin N = 3. There is also the option to take the average of the stacked power B over a range of angular frequencies if the signal has an appreciable bandwidth.
In addition to beamforming, we also utilize methods to measure and interpret the spectral properties of the monochromatic LP earthquakes. We measure both the dominant frequency and the Q, or quality factor, of the resonance. Measuring both of these parameters is advantageous because, as Lipovsky and Dunham (2015) have pointed out, the length and thickness of a tabular fracture, crack, dike, or sill can be inferred from these two values. Although we use the term length here, as in Lipovsky and Dunham (2015), it can be understood to be the diameter in the case of a circular fracture, crack, dike, or sill. Note that Lipovsky and Dunham (2015) use the term width to refer to the thickness or opening of the fracture, crack, dike, or sill. They do not use width to mean a second lateral dimension, as in the length and width of a rectangular-shaped crack. In the long wavelength limit, Lipovsky and Dunham (2015) show that, for purely viscous dissipation and narrow boundary layers along the crack walls, the length of a fracture, crack, dike, or sill is given by:
where ν is the dynamic viscosity of the fluid, G* is the elastic plane strain modulus of the solid, ρ0 is the density of the fluid, Q1 is the observed quality factor of the fundamental resonant mode, and f1 is the resonant frequency. Note that G* is given in terms of the shear modulus G and Poisson’s ratio σ of the solid as G* = G/(1−σ). The thickness or opening of the fracture, crack, dike, or sill is given by Lipovsky and Dunham (2015) as twice the half-width w0:
in terms of the previously defined quantities. From Eqs 2, 3, the geometry of the fracture, crack, dike, or sill can be obtained from measurements of Q1 and f1 given estimates of the fluid and solid material properties ρ0, ν, and G*. We take the same values for these quantities as used by Lipovsky and Dunham (2015) to describe basalt melt: ρ0 given by 2,500 kg/m3, ν computed from a kinematic viscosity of 100 (units of Pa seconds) divided by the fluid density ρ0, and a value for G* corresponding to a P-wave velocity of 5 km/s, a Poisson’s ratio of 0.25, and a solid density of 2,700 kg/m3. Lipovsky and Dunham (2015) also considered water as a possibility for the fluid and this could be the case for shallow LPs. However, as we show later, the monochromatic LP earthquakes at Little Sitkin originate in the mid-crust and thus basalt is a more likely fluid constituent than water.
To measure the resonant frequency and its quality factor, we fit the observed power spectra of the monochromatic LP earthquakes with a Lorentzian since this function is commonly used to describe resonant spectra (Bourbie et al., 1987). The form of this function is given by:
where P is the modeled power spectrum as a function of frequency f and the three fitting parameters are A (peak value), f1 (resonant frequency), and w (full-width of power spectrum at half peak value). For the fitting, we use the Nelder-Mead simplex (direct search) method. Once the three fitting parameters have been estimated, the quality factor Q1 can be obtained from f1 and w using the relation Q1 = f1/w (Bourbie et al., 1987). Thus, a narrow resonant mode would have a small width at half its maximum value and a high value for quality factor. An alternative but equally applicable method for estimating the quality factor of LP events is called the Sompi method as utilized by Kumagai and Chouet (1999).
Observations
We show a time history of the VT earthquake swarm at Little Sitkin in Figure 2 in terms of daily earthquake counts (Figure 2A) along with a plot of time vs. depth in which symbol size is proportional to earthquake magnitude (Figure 2B). The earthquake locations and magnitudes are extracted from the 1989–2018 AVO earthquake catalog of Power et al. (2019) by selecting earthquakes laterally within 20 km of the summit of Little Sitkin. Dixon et al. (2013) report that the magnitude of completeness at Little Sitkin in 2012 was equal to M0.0. We note that most of the earthquakes shown in Figure 2 are laterally within 5 km of the summit and, as seen in Figure 2B, the events were generally located in the upper 10 km of the crust. After starting on August 30, the swarm waxed and waned over the course of three months and produced a total of 1,221 located earthquakes. The peak earthquake rate occurred on the first day of the swarm when approximately 300 events were located. The largest earthquake (M2.7) did not occur until November 15 and there were 22 earthquakes with magnitude greater than two; however, none of those happened on the first two days of the swarm, when the rate was highest. The rates, magnitudes, and durations of the swarm at Little Sitkin are similar to other recent non-eruptive swarms at nearby Semisopochnoi volcano (DeGrandpre et al., 2019).
In Figure 2B, we indicate the occurrence times of the unusual monochromatic LP earthquakes by red vertical lines. These happened between 5 and 7 days prior to the onset of the VT swarm: one on August 23, another on August 24, and finally three in close succession on August 25. We illustrate the spectral properties of these events by showing their spectrograms in Figure 3; their seismograms are also plotted for reference. The spectrograms are computed using 20-second-long running time windows with 75% overlap and a Hanning taper applied to reduce edge effects. For each of the events, the resonance at 0.57 Hz is clear and, for the first event in Figure 3A, the resonance even starts at a low level before the onset of the highest amplitude burst of energy. Although the events have some frequency content above 1 Hz, the highest amplitude and most consistent signal is the resonance at approximately 0.57 Hz. For example, there is a relatively strong secondary resonance at about 2.7 Hz for the first monochromatic LP earthquake shown in Figure 3A; however, its amplitude is reduced for the subsequent events while the fundamental resonance remains. That said, there is higher frequency energy at the beginning of each of the five monochromatic LP earthquakes and this may mean that brittle failure near the source zone serves as the proximal trigger of the resonance. Interestingly, there is also higher frequency energy near the end of some of the events as well. This observation only applies to the first, second, and fifth monochromatic LP earthquakes since the third and fourth events did not end before the fourth and fifth events, respectively, had started (Figure 3C). As shown by the black arrows in Figure 3, higher frequencies are consistently radiated about 2 min after the start of the first, second, and fifth monochromatic LP earthquakes, near the end of the 0.57 Hz fundamental resonance signal. In the case of the first two monochromatic LP earthquakes shown in Figures 3A,B, the spectral signature of the higher frequency radiation at the end of the events is similar. There is less similarity observed with the higher frequencies at the end of the fifth event, although it again occurs about 2 min after the start of the event. The presence and timing of these higher frequencies suggests a complex source process taking at least 2 min to complete. Although we focus on the unusual 0.57 Hz resonance in this work, these other aspects of the monochromatic LP earthquakes are remarkable and worth keeping in mind.
Five days after the last of the five monochromatic LP earthquakes (on August 30), the VT swarm developed at Little Sitkin as detailed in Figure 4. During those five intervening days, the most notable seismic activity at the volcano was the occurrence of a deep VT earthquake (M = −0.3) on August 27, at a depth of 20 km and beneath the western side of the island. The delay of five days between the monochromatic LP earthquakes and the onset of the swarm could be interpreted as the result of stress transfer or advection processes within the magmatic system (Jolly et al., 2018). As shown in Figure 4, the VT swarm slowly developed over the course of several hours on August 30 and AVO raised the Volcano Alert Level/Aviation Color Code for Little Sitkin to ADVISORY/YELLOW a few hours into the swarm (Herrick et al., 2014). The volcano remained at this elevated alert level and color code until January 9, 2013, when AVO lowered the Volcano Alert Level/Aviation Color Code for Little Sitkin due to a decline in earthquake activity. Thus, the 2012 earthquake swarm at Little Sitkin did not culminate in an eruption.
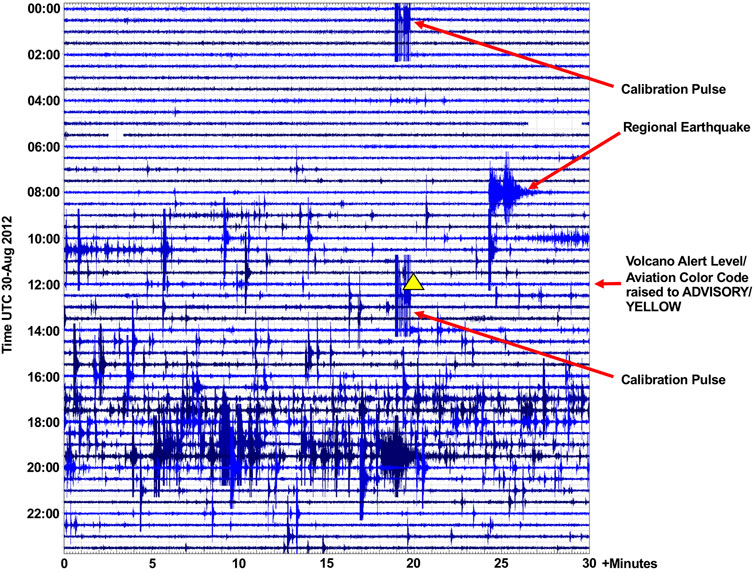
FIGURE 4. Helicorder plot for the vertical component of station LSPA showing the onset of the VT swarm on August 30. AVO raised the Volcano Alert Level/Aviation Color Code for Little Sitkin at 12:20 UTC, as indicated by the yellow triangle. A regional earthquake and calibration pulses for the short period instrument are labeled with most other events being swarm earthquakes. The onset of the swarm occurred between 4:00–10:00 UTC.
We further investigate the properties of the monochromatic LP earthquakes by analyzing the three-component broadband station AMKA on Amchitka Island (Figure 1), 80 km to the southeast of Little Sitkin. The monochromatic LP earthquakes were large enough that they registered above the noise level at this distance and in Figure 5 we show the signal for the first monochromatic LP earthquake that occurred on August 23. Based on a relationship between the distance to the farthest picked P-wave arrivals and earthquake magnitude in the AVO catalog (Dixon et al., 2019), the observation of clear P-waves at 80 km distance already suggests the monochromatic LP earthquakes had magnitudes in the range of 1.0–1.5. Marked on the vertical and north components of AMKA in Figure 5 are P and S-wave arrival times. At this distance, the P- and S-wave arrivals have separated in time such that their onsets are clear and this shows that the monochromatic LP earthquakes generated S-waves in addition to P-waves. The existence of S-waves for a monochromatic earthquake in Japan beneath Izu-Ooshima Volcano has been reported previously by Ukawa and Ohtake (1987). The relative amplitude of the S-wave being approximately twice as large as the P-wave is consistent with the monochromatic LP earthquake being produced by a tensile crack mechanism (see Figure 10 from Ukawa and Ohtake). In contrast to a normal earthquake with broad frequency content, the signal from the monochromatic LP earthquake in Figure 5 continues in a sinusoidal pattern with a period corresponding to the dominant frequency of 0.57 Hz after the initial arrival. The interesting aspect of the P and S-wave arrivals is that, although the overall signal is monochromatic, the onset on the vertical and north components is fairly impulsive. This impulsive arrival requires that there are higher frequencies near the start of the signal, in order to represent the sharp onset. Another aspect to note is that, because the 0.57 Hz signal is so low in frequency, seismic scattering effects are minimized and thus scattered energy from the 0.57 Hz P-wave does not appear on the horizontal components. This does not hold for the higher frequency portions of the signal, and indeed some scattered energy from the higher frequency portions of the P-wave appear on the horizontal components prior to the S-wave arrival. We finally note that for this first monochromatic LP earthquake, there was a relatively strong secondary resonance at 2.7 Hz (Figure 3) and that portion of the signal dominates the east component of AMKA. The apparent S-wave arrival on the east component for this 2.7 Hz portion of the signal is slightly later than for the 0.57 Hz portion of the signal on the north component. We do not go into more detail about this timing difference since our focus is on the low frequency 0.57 Hz signals.
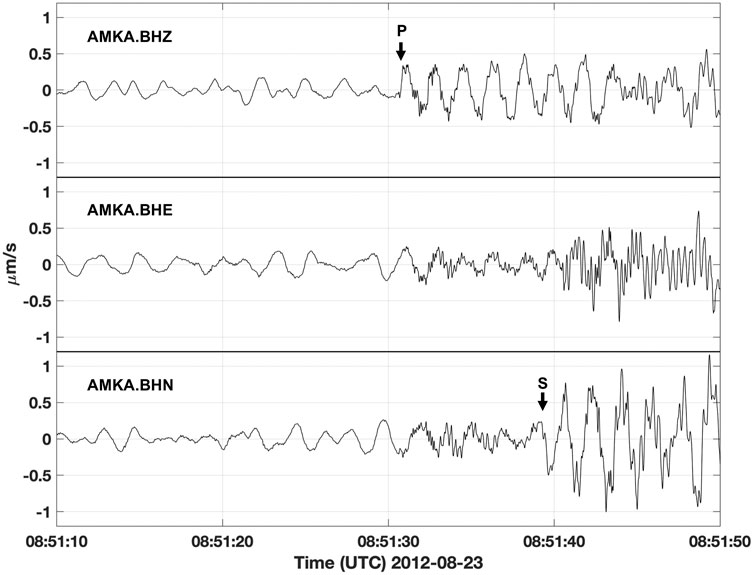
FIGURE 5. Three component recording of the monochromatic LP earthquake on August 23 at broadband station AMKA on Amchitka Island, 80 km to the southeast of Little Sitkin. The P- and S-wave trains exhibit the dominant lower frequency resonance at about 0.6 Hz and have a similar frequency content as the pre-event ocean noise. Although the arrivals are monochromatic and low frequency, the first motions are relatively impulsive.
Results
We now apply the quantitative methods described by Eqs 1 through 4 to further analyze details of the monochromatic LP earthquakes. To gain insight into the location of these events, we show the result of beamforming with the vertical components of the three local stations at Little Sitkin in Figure 6. The beamforming in Figure 6 is done for the second monochromatic LP earthquake that occurred on August 24. We beamform over four discrete frequencies between 0.55–0.59 Hz and take the mean of the four individual stacked power plots. The stacked power shown in Figure 6 is normalized in the sense that if the three local stations had identical seismic recordings, but were only shifted in time, the maximum value would be equal to 1. The peak value in Figure 6 is shown by the white triangle and is greater than 0.9, attesting to the similarity and coherence of the signals between the three local stations at Little Sitkin. This is to be expected given the minimization of scattering and path effects at these low frequencies. The stacked power in Figure 6 is plotted in slowness space and circles are overlain on the plot to indicate the corresponding apparent velocities across the tripartite array. The peak value shown by the white triangle suggests the monochromatic LP earthquake originated to the west of the tripartite array’s centroid location (260° backazimuth) and had an apparent velocity of approximately 9 km/s. We note that the centroid of the tripartite array virtually coincides with the summit of the volcano. Given the dominance of P-waves on the vertical component of the seismometers and taking a common value of 5 km/s for the P-wave velocity, the apparent velocity of 9 km/s can be understood to mean the seismic waves were propagating upward at an angle of about 56° with respect to the horizontal direction (i.e., 5/cos(56°) = 9).
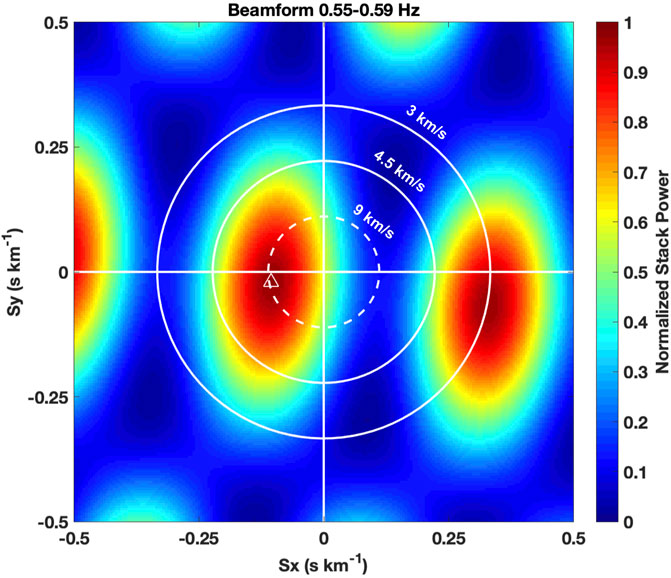
FIGURE 6. Normalized stack power from frequency-slowness beamforming of the vertical components of the three local stations on Little Sitkin for the monochromatic LP earthquake on August 24, 2012. The location of the peak is indicated by an open white triangle and yields an apparent velocity across the tripartite array of approximately 9 km/s and an azimuth of 260°. The sidelobe at an azimuth of 110° corresponds to an apparent velocity of 3 km/s, which is slower than expected for upcoming P-waves.
Due to the limited number of stations comprising the tripartite array and the nearly monochromatic signal, the sidelobes of the stacked power in Figure 6 have significant amplitude. However, by considering realistic values for apparent velocity, we argue the peak value corresponding to an arrival from the west at 9 km/s apparent velocity is the most plausible solution. Take for example, the sidelobe to the east of the array at a backazimuth of 110° that would correspond to an arrival with an apparent velocity of 3 km/s. Even if the bulk P-wave velocity beneath Little Sitkin were as low as 3 km/s, such an arrival would correspond to a horizontally propagating wave, i.e., a source at the surface. Regional velocity models used for earthquake location in the Aleutian Islands and at Little Sitkin in particular have an average value of 5 km/s and higher within the upper crust near sea level (Dixon et al., 2013). Note that by bulk P-wave velocity, we mean that a P-wave of 0.57 Hz propagates with a speed that represents an average over the spatial scale of its wavelength. A P-wave of 0.57 Hz propagating at 5 km/s has a wavelength of roughly 9 km and thus any unknown small-scale variations and site effects are effectively averaged out. We finally point out that elevation differences between the three local stations at Little Sitkin are on the order of 100–200 m and therefore do not greatly affect the beamforming, which assumes a horizontally flat array, given that the aperture of the tripartite array is on the order of 3 km.
With the beamforming results in hand, we turn to an analysis of a three-component recording of a monochromatic LP earthquake on the local station LSPA (Figure 1), the only three-component station on Little Sitkin. Shown in Figure 7 is a 0.1–1 Hz bandpassed version of the seismogram at LSPA for the second monochromatic LP earthquake on August 24. This choice of frequency band is intended to highlight the 0.57 Hz signal. The beamforming in Figure 6 suggests the location of the monochromatic LP earthquakes is laterally to the west of the Little Sitkin stations and this means SH-wave motion should appear dominantly on the transverse north component of LSPA. In contrast, coupled P-SV motion should appear dominantly on the vertical and east components. Marked on the vertical and north components of LSPA in Figure 7 are the inferred P and S-wave arrival times and we note that the initial motion of the P-wave on the vertical component is weakly downward. We interpret the P-wave motion appearing on the east horizontal component to be the result of the P-wave encountering the free surface at non-normal incidence (Ben-Menahem and Singh, 1981). Note that the motion of the early-arriving portion of the P-wave in Figure 7 is upwards and to the east or downwards and to the west. This sense of motion is again consistent with a source region for the monochromatic LP earthquakes to the west of the summit at Little Sitkin. We also note that, after the arrival of the S-wave, the east component represents the interference between the monochromatic P and S-waves. Finally, the time delay between the P and S-wave arrivals is approximately 2.4 s and, given common values for P-wave velocity (5 km/s) and S-wave velocity (3 km/s), this means the earthquake is roughly 18 km away from station LSPA. With the incidence angle derived from beamforming, this places the depth of the event at roughly 15 km (i.e., 18 × sin(56°) = 15), within the middle crust beneath Little Sitkin. Given the uncertainties in subsurface velocity at Little Sitkin, for which a local velocity model has not been determined, we surmise that the depth of the event could reasonably fall within the range of 12–18 km.
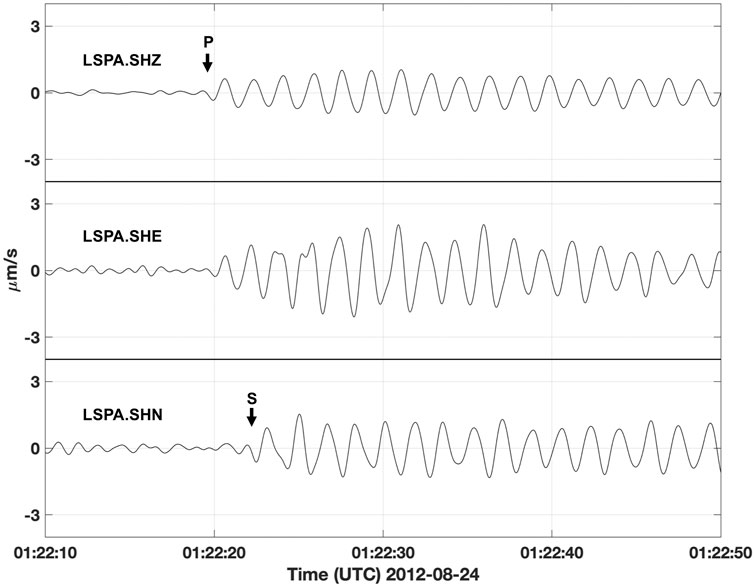
FIGURE 7. Three-component recording of the monochromatic LP earthquake on August 24 at short-period station LSPA on Little Sitkin, bandpassed between 0.1–1 Hz. Interpreted P- and S-wave arrivals are shown and the time delay between them is roughly 2.4 s, suggesting that the depth of the monochromatic LP earthquake is in the middle crust (12–18 km depth).
We now have a fairly clear picture of the general location of the monochromatic LP earthquakes from the beamforming and three-component analysis. The last question we address regards the spatial extent of the source region generating the 0.57 Hz signals. For this, we apply recent findings by Lipovsky and Dunham (2015) on the relation between the fundamental frequency and quality factor of a resonating tabular body (e.g., fracture, crack, dike, or sill) and its geometry as summarized in Eqs 2 and 3. Tabular magma bodies are often invoked at volcanoes and lead to more realistic sizes of resonators for observed frequencies and quality factors compared to other source geometries, such as a spherical magma body (Kumugai and Chouet, 1999). Conceptual models of transcrustal magma systems also envision interconnected, tabular magma bodies beneath volcanoes within a zone of crystal mush (Magee et al., 2018). We first fit the power spectrum of the monochromatic LP earthquakes with the Lorentzian function given by Eq. 4. Shown in Figure 8A are the power spectra for the monochromatic LP earthquakes on August 23 and 24, with the best fit Lorentzian for the August 24 event plotted in Figure 8B. We cannot perform this analysis for the three monochromatic LP earthquakes on August 25 since they were not isolated in time and their signals overlapped. For the August 24 event, we find the best fitting Lorentzian using a Nelder-Mead simplex method and obtain a resonant frequency f1 of 0.569 Hz and a full-width at half-maximum value w equal to 0.0097 Hz. Together these estimates yield a quality factor Q1 of 58.7 (=0.569/0.0097). The Q estimate we obtain for the analysis of the August 23 event is similar.
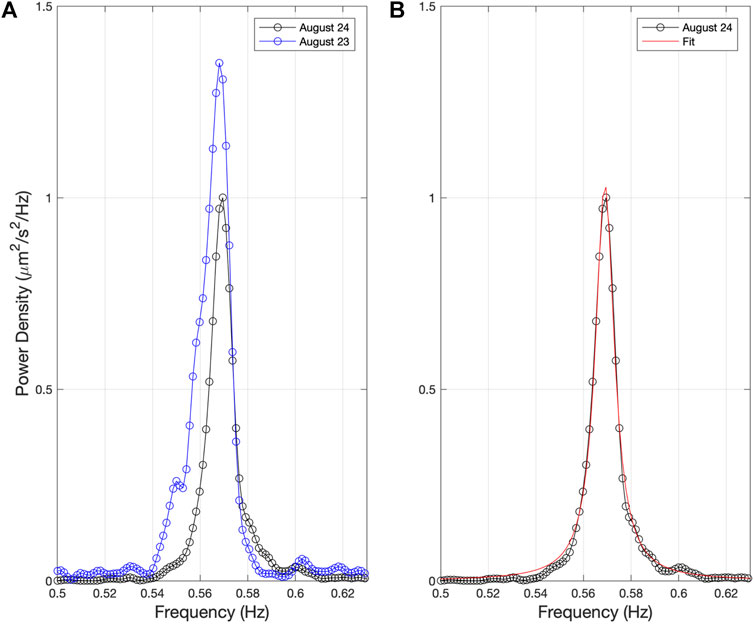
FIGURE 8. (A) Spectra for two of the monochromatic LP earthquakes at Little Sitkin that occurred on August 23 and 24. (B) Spectrum for the August 24 event plotted with a best-fitting Lorentzian function. The fitting yields a peak frequency of 0.569 Hz and a full-width at half-maximum value of 0.0097 Hz, corresponding to a Q value of 0.569/0.0097 = 58.7.
Using Eqs 2 and 3 from Lipovsky and Dunham (2015), and the values for fluid (basalt) and solid discussed earlier and also used by Lipovsky and Dunham (2015), we plot the inferred geometry of the tabular magma body at Little Sitkin in Figure 9A. Note that, in the absence of data constraints on its orientation, we assume the tabular magma body at Little Sitkin is described by an approximately horizontally-oriented sill. This is because we do not observe any notable azimuthal variations in the seismic wavefield as is expected for an axisymmetric source such as a sill, although the data at Little Sitkin are limited. The source of deep monochromatic events at Mayotte has also been interpreted as due to a dipping sill-like source (Cesca et al., 2020). In any case, the orientation of the tabular magma body does not change our results for its size in terms of its length and half-width. Shown in Figure 9A are inferred geometries of cracks at other volcanoes worldwide as discussed in Lipovsky and Dunham (2015) for comparison. In fact, Figure 9A is an adaptation of Figure 6A from Lipovsky and Dunham (2015) with the addition of our estimate for Little Sitkin. We find that the resonant frequency and quality factor of the observed resonance can be explained by a sill with a spatial length scale (i.e., diameter for a circular sill) of 500 m and a thickness of 9 m. Since the resonance frequency was lower than the resonance frequencies for the other four examples in Lipovsky and Dunham (2015), it is not surprising that the length scale of the sill is the largest plotted in Figure 9A. Assuming a circular sill of diameter 500 m and a thickness of 9 m corresponds to a volume of 1.8 million cubic meters. We note that Lipovsky and Dunham (2015) in their Figure 6B also considered the same resonance examples but using the properties of water for the fluid instead of basaltic magma. Water may be applicable for shallow LPs, but given the inferred depth of the monochromatic LP earthquakes at Little Sitkin (12–18 km), we do not consider water to be viable option for the material filling the sill.
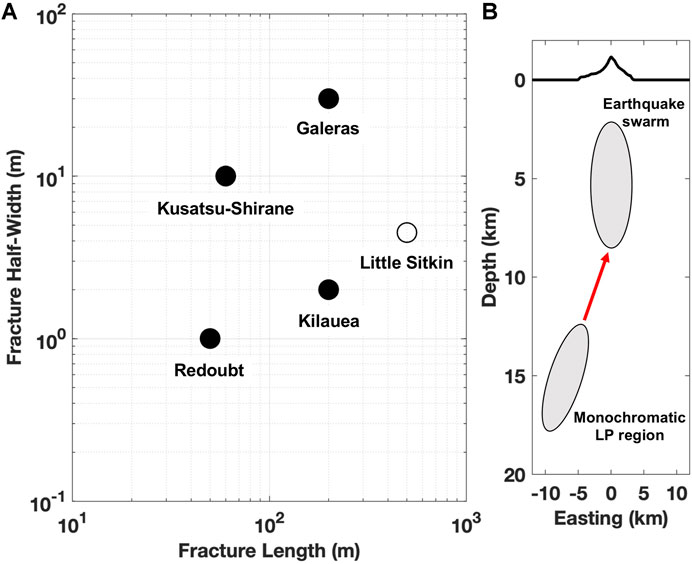
FIGURE 9. (A) Comparison of the geometry of the tabular magma body at Little Sitkin (open circle) inferred using the method of Lipovsky and Dunham (2015) with other inferred geometries of fractures, cracks, dikes, or sills (filled circles) analyzed in Lipovsky and Dunham (2015). The low frequency resonance at Little Sitkin can be explained by a sill with a length of 500 m and a half-width of 4.5 m. (B) Conceptual sketch of an east-west cross-section for the relative locations of the monochromatic LP earthquakes and VT earthquake swarm at Little Sitkin. Vertical exaggeration is a factor of 3. The source zone of the monochromatic LPs is given as a gray region reflecting the uncertainty in location. The VT earthquake swarm is also shown as a gray region mainly between 2–8 km below sea level beneath the volcano. The red arrow highlights the separation between the two regions over which a disturbance due to the intrusion in the monochromatic LP region likely propagated, generating the subsequent brittle swarm response in the shallower portion of system 5 days later.
Discussion
The monochromatic LP earthquakes at Little Sitkin share many similarities with the monochromatic earthquake reported by Ukawa and Ohtake (1987) at Izu-Ooshima. For this reason, we have adopted their terminology and refer to the events as monochromatic LP earthquakes. The similarities between the events include the presence of P- and S-waves, the observation of the events on stations on the order of 100 km away, and the low frequency of the resonance (0.57 Hz at Little Sitkin and 1.0 Hz at Izu-Ooshima). It would be interesting to be able to plot the case of Izu-Ooshima in Figure 9; however, it is not possible since Ukawa and Ohtake (1987) did not give an estimate for the quality factor in addition to the resonant frequency. Although the monochromatic LP earthquakes at Izu-Ooshima and Little Sitkin are similar, they differ in the following three respects: 1) the Izu-Ooshima event was larger (M2.7) than our estimates for the Little Sitkin events (M1.0–1.5), 2) Ukawa and Ohtake (1987) located the Izu-Ooshima event at greater depth (30 km) than what we have estimated for the Little Sitkin monochromatic earthquakes (12–18 km), and 3) the Izo-Ooshima event was a single event whereas the Little Sitkin monochromatic LP earthquakes occurred in a sequence of five events, with the final three happening closely in time. A final difference is that the Izu-Ooshima event occurred about one year prior to an eruption at the volcano (Ukawa and Ohtake, 1987). The Little Sitkin monochromatic LP earthquakes, on the other hand, happened 5–7 days before swarm activity began at the volcano, and ultimately the swarm did not culminate in eruptive activity. However, in both cases the monochromatic LP earthquakes appear to be linked to the intrusion of new magma deep beneath Izu-Ooshima and Little Sitkin volcanoes.
Other examples of deep (25–35 km) monochromatic earthquakes happened along with volcanic unrest near Mayotte in 2018 (Cesca et al., 2020). The Mayotte events registered on seismometers globally and were technically very-long-period (VLP) earthquakes due to their low frequency resonance reported at 0.065 Hz (15.4 s period), instead of LPs as observed at Little Sitkin and Izu-Ooshima. Cesca et al. (2020) further reported the quality factor Q of the events to be 72 ± 6. As suggested by their low frequency content, the monochromatic VLPs near Mayotte resulted from the resonance of a large magma reservoir (10–15 km length), much larger than the one we have inferred at Little Sitkin. In spite of this difference, the Mayotte events essentially represent a scaled-up version of a similar resonance phenomenon within a deep magma reservoir.
The association of the five monochromatic LP earthquakes at Little Sitkin with the subsequent VT swarm begs the question of whether the monochromatic LP earthquakes are actually unusual or whether they are part of the background seismicity at Little Sitkin. Manual seismic checks are performed twice a day at AVO on all seismic networks and a search of the internal logging system in which the checks are entered did not show any prior observations of low frequency (<1 Hz) monochromatic events at Little Sitkin. To address the question more quantitatively, we took the first monochromatic LP earthquake on August 23 and used it as a template for a multichannel matched-filter search (Holtkamp et al., 2015) over 8 years of continuous seismic data from the Little Sitkin region, spanning 2007–2015. The multichannel filter utilized all three functional stations on Little Sitkin (5 channels), the three-component broadband at Amchitka (3 channels), and three vertical-component short period stations on Semisopochnoi Island (3 channels). We measured the strength of the detections in terms of a quantity called the correlation sum. When the multichannel template is scanned on the same time period as itself, it detects itself with a value for the correlation sum of 11 (i.e., the number of channels used). The multichannel matched filter detected the other two time periods with monochromatic LP earthquakes on August 24 and 25 with correlation sums of 5.2 and 4.8. In the scan over continuous data from the 11 channels between 2007–2015, no other detections exceeded a correlation sum of 4. One detection on June 12, 2009 exceeded a correlation sum of three; however, it was considerably lower amplitude than the monochromatic LP earthquakes from August 2012 and did not register on the Amchitka broadband station. Furthermore, the monochromatic LP earthquakes from August 2012 occurred in a sequence of five events over three consecutive days, with three of the events happening in close succession. Thus, the occurrence of a sequence of such monochromatic LP earthquakes is unusual at Little Sitkin. Future efforts to automatically identify monochromatic LP earthquakes with resonant frequencies whose value is not known a priori could benefit from the general harmonic signal detector developed by Roman (2017).
The timing and unusual character of the sequence of five monochromatic LP earthquakes in the days prior to the onset of the 2012 VT swarm at Little Sitkin strongly suggest the events were related. We interpret the monochromatic LP earthquakes to reflect resonance excited by the intrusion of magma into a sill at approximately 12–18 km depth on the western side of Little Sitkin. The subsequent VT swarm would then represent the brittle response of the shallow crust (<10 km depth) to the intrusion, which lasted for several months until the state of stress had relaxed beneath the volcano.
Conclusion
We have described the characteristics of five monochromatic LP earthquakes with a dominant frequency of 0.57 Hz that preceded the onset of a months-long earthquake swarm at Little Sitkin in late 2012. Using a combination of beamforming, three-component analysis, and spectral analysis of the 0.57 Hz resonance peak, we have obtained a general picture of where the earthquakes were located and the geometry of the tabular magma body that gave rise to the 0.57 Hz resonance and that we infer to be a sill. The combination of resonant frequency and quality factor measurements allowed for the estimation of the geometry of the tabular magma body (500 m diameter and 9 m thickness) based on recent theoretical results for fluid-solid interaction within a fracture, crack, dike, or sill. The observation of the monochromatic LP earthquakes in routine seismic checks at AVO in 2012 during August 23–25 caused there to be increased attention on the volcano in real-time and led ultimately to the rapid manual detection of the swarm onset. This resulted in the Volcano Alert Level/Aviation Color Code being raised to ADVISORY/YELLOW for Little Sitkin in the early morning hours local time of August 30, 2012 (12:20 UTC). Future challenges include the automated detection of such unusual, low-frequency monochromatic earthquakes in continuous real-time data and improved measurements of the seismic wavefield of such earthquakes on more extensive networks of broadband seismometers. The monochromatic LP earthquakes at Little Sitkin represent a rarely observed type of DLP seismicity linked to the process of intrusion into the mid-crustal magmatic system.
Data Availability Statement
The datasets presented in this study can be found in online repositories. The names of the repository/repositories and accession number(s) can be found below: Seismic data used in this study are available from the Incorporated Research Institutions for Seismology Data Management Center (https://ds.iris.edu/ds/nodes/dmc/) under network code AV.
Author Contributions
MH led the analysis and writing of the manuscript in collaboration with HB, SH, and SM. SH implemented the matched-filter search of continuous seismic data. All authors contributed to the interpretations and provided feedback on the conclusions.
Funding
The authors acknowledge support from the Alaska Volcano Observatory through the United States Geological Survey Volcano Hazards Program.
Disclaimer
Any use of trade, firm, or product names is for descriptive purposes only and does not imply endorsement by the United States Government.
Conflict of Interest
The authors declare that the research was conducted in the absence of any commercial or financial relationships that could be construed as a potential conflict of interest.
Acknowledgments
We thank two reviewers, the editor Valerio Acocella, and Art Jolly (United States Geological Survey/Hawaiian Volcano Observatory) for comments that helped improve the manuscript.
References
Aso, N., and Tsai, V. C. (2014). Cooling Magma Model for Deep Volcanic Long-Period Earthquakes. J. Geophys. Res. Solid Earth 119, 8442–8456. doi:10.1002/2014jb011180
Bean, C. J., De Barros, L., Lokmer, I., Métaxian, J.-P., O’ Brien, G., and Murphy, S. (2014). Long-period Seismicity in the Shallow Volcanic Edifice Formed from Slow-Rupture Earthquakes. Nat. Geosci 7, 71–75. doi:10.1038/ngeo2027
Ben-Menahem, A., and Singh, S. J. (1981). Seismic Waves and Sources. New York: Springer-Verlag. doi:10.1007/978-1-4612-5856-8
Bourbie, T., Coussy, O., and Zinszner, B. (1987). Acoustics of Porous Media. Paris: Edition Technip.
Buurman, H., Nye, C. J., West, M. E., and Cameron, C. (2014). Regional Controls on Volcano Seismicity along the Aleutian Arc. Geochem. Geophys. Geosyst. 15, 1147–1163. doi:10.1002/2013gc005101
Cesca, S., Letort, J., Razafindrakoto, H. N. T., Heimann, S., Rivalta, E., Isken, M. P., et al. (2020). Drainage of a Deep Magma Reservoir Near Mayotte Inferred from Seismicity and Deformation. Nat. Geosci. 13 (1), 87–93. doi:10.1038/s41561-019-0505-5
Chouet, B. A. (1996). Long-period Volcano Seismicity: Its Source and Use in Eruption Forecasting. Nature 380, 309–316. doi:10.1038/380309a0
Chouet, B. A., Page, R. A., Stephens, C. D., Lahr, J. C., and Power, J. A. (1994). Precursory Swarms of Long-Period Events at Redoubt Volcano (1989-1990), Alaska: Their Origin and Use as a Forecasting Tool. J. Volcanology Geothermal Res. 62, 95–135. doi:10.1016/0377-0273(94)90030-2
DeGrandpre, K. G., Pesicek, J. D., Lu, Z., DeShon, H. R., and Roman, D. C. (2019). High Rates of Inflation during a Noneruptive Episode of Seismic Unrest at Semisopochnoi Volcano, Alaska in 2014-2015. Geochem. Geophys. Geosyst. 20, 6163–6186. doi:10.1029/2019GC008720
Dixon, J. P., Stihler, S. D., Haney, M. M., Lyons, J. J., Ketner, D. M., Mulliken, K. M., et al. (2019). Catalog of Earthquake Parameters and Description of Seismograph and Infrasound Stations at Alaskan Volcanoes-January 1, 2013, through December 31, 2017. U.S. Geol. Surv. Data Ser. 1115, 92 p., doi:10.3133/ds1115
Dixon, J. P., Stihler, S. D., and Power, J. A. (2008). Catalog of Earthquake Hypocenters at Alaskan Volcanoes: January 1 through December 31, 2007. U.S. Geol. Surv. Data Ser. 367, 82 p., doi:10.3133/ds367
Dixon, J. P., Stihler, S. D., Power, J. A., Haney, M. M., Parker, T., Searcy, C., et al. (2013). Catalog of Earthquake Hypocenters at Alaskan Volcanoes: January 1 through December 31, 2012. U.S. Geol. Surv. Data Ser. 789, 84 p., doi:10.3133/ds789
Haney, M. M. (2014). Backprojection of Volcanic Tremor. Geophys. Res. Lett. 41, 1923–1928. doi:10.1002/2013gl058836
Haney, M. M., Fee, D., McKee, K. F., Lyons, J. J., Matoza, R. S., Wech, A. G., et al. (2020). Co-eruptive Tremor from Bogoslof Volcano: Seismic Wavefield Composition at Regional Distances. Bull. Volcanol. 82, 18. doi:10.1007/s00445-019-1347-0
Herrick, J. A., Neal, C. A., Cameron, C. E., Dixon, J. P., and McGimsey, R. G. (2014). 2012 Volcanic Activity in Alaska: Summary of Events and Response of the Alaska Volcano Observatory. U. S. Geol. Surv. Scientific Invest. Report 2014-5160, 82 p., doi:10.3133/sir20145160
Holtkamp, S. G., Brudzinski, M. R., and Currie, B. S. (2015). Regional Detection and Monitoring of Injection-Induced Seismicity: Application to the 2010-2012 Youngstown, Ohio, Seismic Sequence. Bulletin 99, 1671–1688. doi:10.1306/03311513194
Jolly, A., Lokmer, I., Christenson, B., and Thun, J. (2018). Relating Gas Ascent to Eruption Triggering for the April 27, 2016, White Island (Whakaari), New Zealand Eruption Sequence. Earth Planets Space 70, 177. doi:10.1186/s40623-018-0948-8
Kumagai, H., and Chouet, B. A. (1999). The Complex Frequencies of Long-Period Seismic Events as Probes of Fluid Composition beneath Volcanoes. Geophys. J. Int. 138, F7–F12. doi:10.1046/j.1365-246X.1999.00911.x
Lipovsky, B. P., and Dunham, E. M. (2015). Vibrational Modes of Hydraulic Fractures: Inference of Fracture Geometry from Resonant Frequencies and Attenuation. J. Geophys. Res. Solid Earth 120, 1080–1107. doi:10.1002/2014JB011286
Magee, C., Stevenson, C. T. E., Ebmeier, S. K., Keir, D., Hammond, J. O. S., Gottsmann, J. H., et al. (2018). Magma Plumbing Systems: A Geophysical Perspective. J. Petrology 59, 1217–1251. doi:10.1093/petrology/egy064
Miller, T. P., McGimsey, R. G., Richter, D. H., Riehle, J. R., Nye, C. J., Yount, M. E., et al. (1998). Catalog of the Historically Active Volcanoes of Alaska. U.S. Geol. Surv. Open-File Rep. 98-582, 104. doi:10.3133/ofr98582
Ohminato, T., Chouet, B. A., Dawson, P., and Kedar, S. (1998). Waveform Inversion of Very Long Period Impulsive Signals Associated with Magmatic Injection beneath Kilauea Volcano, Hawaii. J. Geophys. Res. Solid Earth 103, 23839–23862. doi:10.1029/98jb01122
Power, J. A., Friberg, P. A., Haney, M. M., Parker, T., Stihler, S. D., and Dixon, J. P. (2019). A Unified Catalog of Earthquake Hypocenters and Magnitudes at Volcanoes in Alaska-1989 to 2018. U.S. Geol. Surv. Scientific Invest. Report 2019-5037, 17 p., doi:10.3133/sir20195037
Power, J. A., Haney, M. M., Botnick, S. M., Dixon, J. P., Fee, D., Kaufman, A. M., et al. (2020). Goals and Development of the Alaska Volcano Observatory Seismic Network and Application to Forecasting and Detecting Volcanic Eruptions. Seismol. Res. Lett. 91, 647–659. doi:10.1785/0220190216
Power, J. A., Stihler, S. D., Chouet, B. A., Haney, M. M., and Ketner, D. M. (2013). Seismic Observations of Redoubt Volcano, Alaska - 1989-2010 and a Conceptual Model of the Redoubt Magmatic System. J. Volcanology Geothermal Res. 259, 31–44. doi:10.1016/j.jvolgeores.2012.09.014
Power, J. A., Stihler, S. D., White, R. A., and Moran, S. C. (2004). Observations of Deep Long-Period (DLP) Seismic Events beneath Aleutian Arc Volcanoes; 1989-2002. J. Volcanology Geothermal Res. 138, 243–266. doi:10.1016/j.jvolgeores.2004.07.005
Roman, D. C. (2017). Automated Detection and Characterization of Harmonic Tremor in Continuous Seismic Data. Geophys. Res. Lett. 44, 6065–6073. doi:10.1002/2017GL073715
Shapiro, N. M., Droznin, D. V., Droznina, S. Y., Senyukov, S. L., Gusev, A. A., and Gordeev, E. I. (2017). Deep and Shallow Long-Period Volcanic Seismicity Linked by Fluid-Pressure Transfer. Nat. Geosci 10, 442–445. doi:10.1038/ngeo2952
Smith, P. J., and Bean, C. J. (2020). RETREAT: A Real-Time TREmor Analysis Tool for Seismic Arrays, with Applications for Volcano Monitoring. Front. Earth Sci. 8, 586955. doi:10.3389/feart.2020.586955
Ukawa, M., and Ohtake, M. (1987). A Monochromatic Earthquake Suggesting Deep-Seated Magmatic Activity beneath the Izu-Ooshima Volcano, Japan. J. Geophys. Res. 92, 12649–12663. doi:10.1029/jb092ib12p12649
Wech, A. G., Thelen, W. A., and Thomas, A. M. (2020). Deep Long-Period Earthquakes Generated by Second Boiling beneath Mauna Kea Volcano. Science 368, 775–779. doi:10.1126/science.aba4798
White, R. A., and McCausland, W. A. (2019). A Process-Based Model of Pre-eruption Seismicity Patterns and its Use for Eruption Forecasting at Dormant Stratovolcanoes. J. Volcanology Geothermal Res. 382, 267–297. doi:10.1016/j.jvolgeores.2019.03.004
Keywords: volcano seismology, earthquake swarm, long-period earthquake, resonance, precursory seismicity
Citation: Haney MM, Buurman H, Holtkamp S and McNutt SR (2021) Monochromatic Long-Period Seismicity Prior to the 2012 Earthquake Swarm at Little Sitkin Volcano, Alaska. Front. Earth Sci. 9:689651. doi: 10.3389/feart.2021.689651
Received: 01 April 2021; Accepted: 14 June 2021;
Published: 30 June 2021.
Edited by:
Luca De Siena, Johannes Gutenberg University Mainz, GermanyReviewed by:
Elena Russo, University of Milano-Bicocca, ItalySimone Cesca, German Research Center for Geosciences, Germany
Copyright © 2021 Haney, Buurman, Holtkamp and McNutt. This is an open-access article distributed under the terms of the Creative Commons Attribution License (CC BY). The use, distribution or reproduction in other forums is permitted, provided the original author(s) and the copyright owner(s) are credited and that the original publication in this journal is cited, in accordance with accepted academic practice. No use, distribution or reproduction is permitted which does not comply with these terms.
*Correspondence: Matthew M. Haney, bWhhbmV5QHVzZ3MuZ292