 Micol Todesco
- Istituto Nazionale di Geofisica e Vulcanologia, Sezione di Bologna, Bologna, Italy
Ground deformation at Campi Flegrei has fuelled a long-term scientific debate about its driving mechanism and its significance in hazard assessment. In an active volcanic system hosting a wide hydrothermal circulation, both magmatic and hydrothermal fluids could be responsible, to variable degrees, for the observed ground displacement. Fast and large uplifts are commonly interpreted in terms of pressure or volume changes associated with magma intrusion, while minor, slower displacement can be related to shallower sources. This work focuses on the deformation history of the last 35 years and shows that ground deformation measured at Campi Flegrei since 1985 is consistent with a poroelastic response of a shallow hydrothermal system to changes in pore pressure and fluid content. The extensive literature available for Campi Flegrei allows constraining system geometry, properties, and conditions. Changes in pore pressure and fluid content necessary to cause the observed deformation can then be calculated based on the linear theory of poroelasticity. The predicted pore pressure evolution and fluid fluxes are plausible and consistent with available measurements and independent estimates.
1 Introduction
Caldera deformation easily stirs scientific debates about the actual source driving ground displacement and the crucial implications for hazard assessment. The Campi Flegrei caldera is a unique case history, with an impressive data set that describes ground deformation over a century, including three significant uplift phases starting in 1950, 1969, and 1982 (Del Gaudio et al., 2010). Each uplift episode lasted a couple of years or less and together totaled more than 3.5 m of ground displacement (Figure 1A). After 1985, a prolonged subsidence phase began, interrupted by occasional, minor, and short-lasting uplift events in 1989, 1994, and 2000. Uplift resumed after 2005 (De Martino et al., 2014) initially at a slow rate, which then increased in 2012 (Figure 1B), causing a shift in alert level from green to yellow (Attention). This uplift phase is still going on, uninterrupted, at the time of writing (2021). Ground deformation data have been interpreted as the product of shallow magmatic sources (Berrino et al., 1984; Amoruso and Crescentini, 2011; Trasatti et al., 2011; D’Auria et al., 2015), with the possible contribution of hydrothermal or aqueous fluids (Casertano et al., 1976; Bonafede, 1991; Chiodini et al., 2003; Amoruso and Crescentini, 2011). Numerical modeling showed that hydrothermal circulation could cause some deformation, but without justifying the order of magnitude of the large uplift phases observed in the 50’s, 70’s, and 80’s (Todesco et al., 2004; Rinaldi et al., 2010). On the other hand, subsidence is often explained in terms of poroelastic relaxation, considering the extensive degassing that characterizes the caldera. Many authors have interpreted the subsequent uplift phase in terms of heating and pressurization of the hydrothermal system (Chiodini et al., 2011; Aiuppa et al., 2013; Chiodini et al., 2015; Moretti et al., 2017). The ongoing uplift phase proceeds at a rate that is similar to the rate of subsidence, and, according to some authors, this implies that deformation mechanism and mechanical properties remained unchanged (Moretti et al., 2018). According to Amoruso et al. (2014), both a deeper (magmatic) source and a shallower (hydrothermal) one contributed to the deformation history of the caldera. Modeling of magma sill intrusion confirmed that subsidence might also arise from magma emplacement (Macedonio et al., 2014), but without ruling out the role of hydrothermal fluids, which may enhance sill propagation by hindering magma cooling (Amoruso and Crescentini, 2019) and contribute to both uplift and subsidence phases (D’Auria et al., 2015).
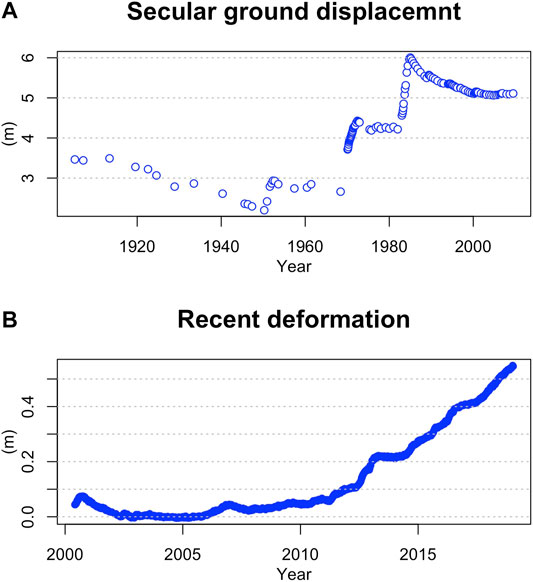
FIGURE 1. (A) Secular ground displacement recorded at Pozzuoli harbour, after Del Gaudio et al. (2010); (B) Post-2000 ground deformation at the same location, based on GPS data, after De Martino et al. (2014) and data from INGV–Osservatorio Vesuviano.
The potential involvement of the hydrothermal system in the recent unrest phases is also suggested by the significant gas discharge that characterizes the caldera. It mostly occurs through soil and fumaroles within the Solfatara crater, roughly at the caldera center, and its eastern flank (Pisciarelli). The presence of fumaroles at this location has been known for centuries, and measurements of gas temperature begun as early as the end of the 19th century (Figure 2) (Sicardi, 1941). Temperature values recorded during this entire time span (shown in Figure 2) display an average of 154.17°C, with a standard deviation of 8.27°C. Extreme values were recorded at the beginning of the period when both minimum and maximum values were measured (122°C, in 1899, and 215°C, in 1935). These first measurements may be unreliable, as we cannot establish the measurement method or the exact location of the measurements. However, even considering only data collected after 1980, the average temperature and standard deviation do not change significantly (154.21 and 7.71°C, respectively). An histogram of the data (Figure 3) reveals two modes at 162°C and 148°C. These values correspond to the average temperature recorded at the two main fumaroles within the Solfatara crater (BG and BN, respectively). The temperature difference between the two fumarolic vents was recently explained in terms of a very shallow cooling effect associated with condensed steam flowing from BG into BN fumarolic conduit (Gresse et al., 2018). All these considerations suggest that the large hydrothermal system feeding the fumaroles acts as a buffer, preventing large temperature fluctuations.
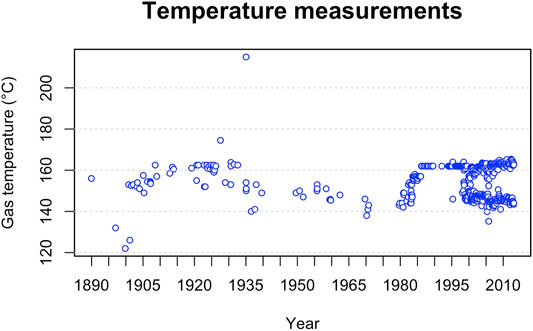
FIGURE 2. Gas temperature measurements carried out within the Solfatara crater since the end of the 19th century as reported by Sicardi (1941); Sicardi (1970); Dall’Aglio et al. (1972); Cioni et al. (1984); Martini (1986); Caliro et al. (2014). Data and references for older measurements, described by Sicardi and published in Italian jounals, are provided as Supplementary Materials.
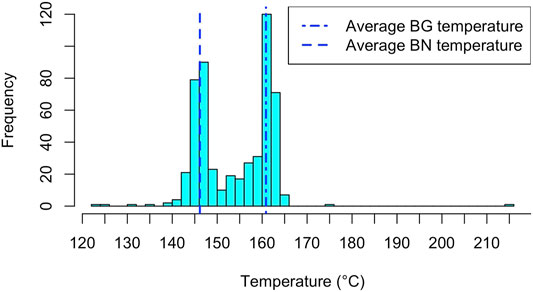
FIGURE 3. Histogram of temperature data collected in Solfatara since 1889. Dashed-dotted line and dashed line refer to the average temperature value measured since 1980 at the fumarolic vents of Bocca Grande (BG) and Bocca Nuova (BN), respectively (Caliro et al., 2014). Data and references for older measurements, described by Sicardi and published in Italian jounals, are provided as Supplementary Materials.
Discharged gases are mostly steam and carbon dioxide. Data on gas composition are available since the 80’s and can be expressed in terms of CO2/H2O ratio. The evolution of gas composition was exhaustively described and discussed by Caliro et al. (2014) and more recently by Chiodini et al. (2021). After a first period characterized by fluctuating behavior, a steady increasing trend has begun in 2000 and continues today, leading to the maximum observed values. Estimates of gas discharge rate became available in 1998 (Cardellini et al., 2017). Measurements of diffuse degassing through the ground of the Solfatara crater revealed for the first time the magnitude of gas discharge at Campi Flegrei, where more than a thousand tonnes of carbon dioxide are released every day. CO2 degassing also displays some fluctuation through time, associated with changes in the size of the degassing area. The measurements constrain only a fraction of the actual gas discharge in the area, as they only refer to carbon dioxide, neglecting other gas components, and do not account for the gas discharged at the fumaroles. The first available estimates of fumaroles contribution (Aiuppa et al., 2013) suggests that fumaroles could contribute an additional 40%.
Aim of this work is to test the hypothesis that the post-1985 deformation is a poroelastic response to change in pore pressure and fluid content within the hydrothermal reservoir. Literature data are used to constrain the position, size, geometry, and properties of the rock volume undergoing poroelastic deformation. As the Campi Flegrei caldera has been extensively studied for decades, a large amount of information is available to build a solid conceptual model, that will be described in the following sections, together with the choice of rock properties and system conditions applied here (Table 1). Once the conceptual model is established, it is possible to calculate the changes in pore pressure and fluid content required to justify the observed ground displacement as a poroelastic response. Results confirm that poroelastic deformation is a plausible mechanism to explain the ongoing unrest phase and that calculated pressure history and fluids fluxes are consistent with independent evidence and the system’s current understanding.
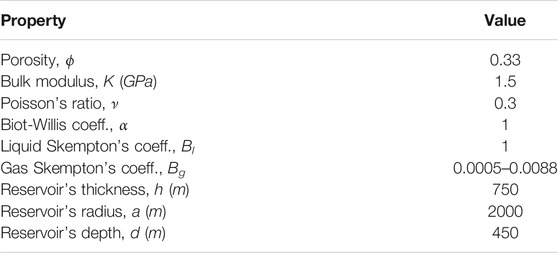
TABLE 1. Rock properties and reservoir geometry used to compute changes in pore pressure and fluid content. See text for further discussion.
2 Conceptual Model
The linear theory of poroelasticity relates the deformation of fluid-saturated rocks to pore pressure and fluid content through a set of parameters that include the properties of both the porous rocks and the fluid. Some simplifying assumptions allow for an analytical solution: the poroelastic source is assumed to have a simple, cylindrical geometry, and to correspond to a very permeable (∼10−13m2) volume of rocks, where pressure changes propagate quickly and can be considered uniform over the source volume. The crude simplification is partially justified by the impressive gas discharge that has been measured in the caldera over the past 20 years. While this approach certainly prevents a detailed description of the system evolution through time, it allows us to explore the orders of magnitude of pressure changes and fluid discharge that would be involved in case of poro-elastic deformation. In the following, available literature data are used to define such volume and its properties. Once the poroelastic source is defined, it can be used to compute the changes in pore pressure and fluid content required to justify the observed vertical displacement.
2.1 The Hydrothermal Reservoir and Its Fluids
The reconstruction of the subsurface structures is based on geological considerations, constrained by data and samples from geothermal wells drilled in the area. The collapsed caldera is characterized by alternating layers of tuff and marine sediments, intersected by lava and overlaying thermo-metamorphic rocks (Piochi et al., 2014). Further information is retrieved from inversion of seismic data, showing that the seismogenic region is confined between a high-velocity basement at 3 km depth, and a shallower cap-rock found at depths between 1 and 2 km (Vanorio et al., 2005). Vanorio and Kanitpanyacharoen (2015) showed that this shallow layer is characterized by high values of the elastic moduli (as determined from seismic velocity data), and ascribed this effect to metamorphic decarbonation of marine sediments, causing a particular hardening of the rocks at these depths. The presence of this seismic horizon was later confirmed by Calò and Tramelli (2018) who identify a 500 m thick layer separating the deeper portion of the system, where magma may be present, from the shallower part. Similar conclusions were reached by Akande et al. (2019), who identified a shallow domain, where aquifers surround a hydrothermal reservoir, that is separated from a deeper domain by a cap-rock that these authors locate at a slightly shallower depth. Joint analyses of seismic velocity, quality factors and scattering provided information on the nature of fluid saturating the rocks, suggesting the presence of shallow aquifers (at depths <800 m) and of a two-phase reservoir extending to the cap-rock (Calò and Tramelli, 2018). According to these authors, the cap-rock is extensively fractured, allowing magmatic volatiles to reach the hydrothermal reservoir and mix with meteoric water. Similar attenuation anomalies were also identified by Akande et al. (2019). The presence of a widespread hydrothermal reservoir where magmatic volatiles mix with meteoric waters is consistent with geochemical evidences, such as the lack of acid species (Chiodini et al., 2021) or the rather constant emission temperature. The observed changes in gas composition have been interpreted in terms of a variable contribution of magmatic volatiles through time (Chiodini et al., 2003). As the systems evolves through periods of increased or reduced magmatic input, distribution of fluid phases may change, due to steam condensation or water evaporation (Todesco, 2009). Numerical modelling of hydrothermal circulation showed that the presence, size and position of gas-dominated, liquid-dominated or two-phase regions depends on the combination of several features, each of whom may change through time. Rock anisotropy, and in particular the distribution of permeability were shown to affect significantly the phase distribution of the system (Todesco et al., 2010). But any process affecting the pressure and temperature distribution within the hydrothermal system may shift the relative proportions of gas and liquid.
Phase distribution has critical implications for geochemical modelling, a technique used to infer pressure and temperature conditions based on the composition of gases discharged at the surface (Chiodini et al., 2021). The assumption of liquid water coexisting with steam implies a trend of increasing of equilibrium pressure and temperature (Chiodini et al., 2015, 2021), whereas the relaxation of such assumption leads opposite result (Moretti et al., 2017).
The relative proportion of gas and liquid within the system also bears important consequences in terms of poroelastic behavior of the fluid saturated rocks.
Further information to constrain phase distribution derives from magnetotelluric data, collected along a 5.6 km long profile by Siniscalchi et al. (2019). These authors developed a large scale resistivity model that highlights the presence of a shallow conductive, water-saturated layer above a high resistivity anomaly (100–300 Ω ⋅ m) underneath the Solfatara crater, extending to a depth of 3,000 m. The anomaly was interpreted as the well developed gas plume that feeds fumarole emissions.
Figure 4 illustrates a conceptual model that summarises the evidences described above: the hydrothermal reservoir is simplified as a vertical cylinder 1,500 m thick and 1,000 m wide, whose top is located at a depth of 500 m. While consistent with the caldera setting, where horizontal layers of pyroclastic materials are limited by ring faults, this basic geometry allows a simple mathematical description of the poroelastic problem, described in the Method section. The shallow hydrothermal reservoir is fed by hot magmatic gases that separate from melt at depth and rise through fractures in the cap-rock layer. Meteoric water permeates the shallower layer, while a gas-dominated region likely occupies the inner portion of the reservoir, where magmatic volatiles and steam of meteoric origin may mix. In this conceptual model, the deformation observed at the surface (observation point O) is due to changes in pore pressure associated with the fluids entering or leaving the hydrothermal reservoir.
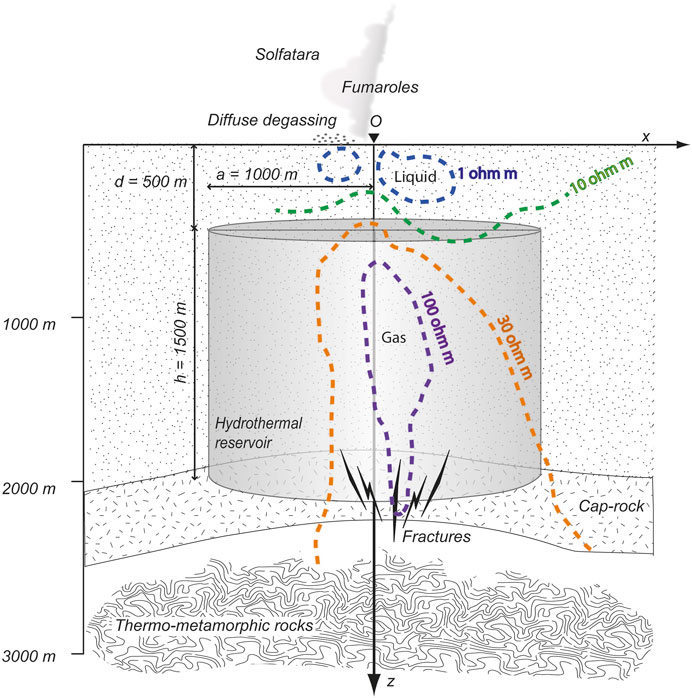
FIGURE 4. Conceptual model for Campi Flegrei. A shallow, gas-dominated hydrothermal reservoir is identified by magnetotelluric data (Siniscalchi et al., 2019), above a caprock revealed by seismic data (Vanorio and Kanitpanyacharoen, 2015; Calò and Tramelli, 2018; Akande et al., 2019). Dashed lines refer to resistivity measurements and are redrawn after Siniscalchi et al. (2019). Ground deformation measured at the surface (at the origin point O) is used to compute the corresponding changes in pore pressure and fluid content in the reservoir.
2.2 Rock Properties
The poroelastic response to fluid and pressure changes largely depends on the choice of rock properties. Various estimates exists in the literature, for different rock types at Campi Flegrei, based on measurements of both on outcropping rocks and on core samples from geothermal wells (Vanorio et al., 2002; Giberti et al., 2006; Heap et al., 2014; Vanorio and Kanitpanyacharoen, 2015). Elastic properties change with lithology, in situ conditions (depth, thus confining pressure, temperature, water content), and may be affected by compaction and mineral alteration (Heap et al., 2014; Vanorio and Kanitpanyacharoen, 2015). Even though a detailed description of the spatial and temporal evolution of rock properties goes beyond the aim of the present work, a choice of reasonable values can be guided by available data.
Large porosity and shallow depth favour low values of the bulk modulus. Temperature may also lower the bulk modulus, depending on specific rock fabric and state of alteration. Vanorio et al. (2002) published data on samples of Neapolitan Yellow Tuff (NYT) and Campanian Ignimbrite tuff (CI). For samples with higher porosity, ϕ = 0.46, measurements yielded bulk modulus, K = 5 GPa and Poisson’s ratio, ν ≈ 0.3. The sample with lower porosity (ϕ = 0.33) showed a higher bulk modulus (K = 10 GPa) and lower Poisson’s ratio (ν = 0.25). Estimates given by Giberti et al. (2006) include: rock porosity, ranging from ϕ = 0.48, for samples at or near the surface, to ϕ = 0.1 or lower, for samples at depths greater than 1,000 m) (saturated) bulk modulus ranges from K = 6.3 GPa, at the surface to K = 47.3 GPa at depths. Dry values are lower, ranging from 1.60 to 29 GPa; Dry Poisson’s ratio ranges from 0.28 (at surface) to 0.14 (at depths). Wet values are higher, spanning from 0.43 to 0.27, with increasing depths. According to Manconi et al. (2010), the shear modulus in the area may vary from 2 to 14 GPa, with a Poisson’s ratio ranging from 0.2 to 0.4. The corresponding bulk modulus ranges from 2.7 to 65.3 GPa.
Heap and coworkers (Heap et al., 2014) highlighted the difference between dynamic estimates of elastic moduli, based on seismic data, and static ones, obtained from stress-strain relations. These authors suggest that static values (typically lower than dynamic ones) are more appropriate to describe the mechanical behaviour of rocks undergoing volcanic deformation. According to their measurements, dynamic values of Poisson’s ratio range from 0.28 to 0.33 (lower value for dry conditions) and shear modulus ranging from 1.97 to 3.20 GPa (lower values for dry conditions). These values correspond to a bulk modulus K ranging from 4.27 to 6.93 GPa. Static values yield lower values of shear modulus (from 0.66 to 0.81 GPa, under an effective pressure of 5 MPa). Considering a Poisson’s ratio of ν = 0.3, the corresponding static bulk modulus reaches even smaller values, from 1.43 to 1.75 GPa. More recently, a detailed compilation of laboratory measurements carried out on volcanic rock samples was published by Heap et al. (2020), who highlighted the importance of porosity in determining the value of Young’s modulus. These authors used experimental data to constrain an empirical relation that allows to upscale laboratory estimates of elastic moduli to larger length scales, where macroscopic fractures and heterogeneities are expected to lower their values. According to this approach, tuffs characterized by large porosity (ϕ = 0.45) and with a Poisson’s ratio of ν = 0.3 are expected to have a bulk modulus as low as K = 0.6 GPa. This value increases to K = 4.5 GPa if porosity drops to 0.15. Porosity data from core samples collected during deep drilling at Campi Flegrei provide a guide to porosity changes with depth, with values of ϕ = 0.33 and 0.22 at depths of 810 and 1,420 m, respectively (Giberti et al., 2006). The corresponding values of the bulk modulus range from K = 1.4 to K = 2.9 GPa (Heap et al., 2020).
Based on these data, rock properties are chosen as follows (Table 1): porosity is set to the value observed in a core sample taken at 810 m (ϕ = 0.33); the bulk modulus K = 1.5 GPa, the Poisson’s ratio ν = 0.3. The Biot-Willis coefficient, α, is set equal to 1, implying that the deformation is entirely due to change in pore volume, while the solid grains do not deform.
3 Methods
Given the conceptual model in Figure 4, the post-1985 observed ground deformation can be considered as an unbounded problem domain, where the poroelastic displacement at the free surface is generated by changes in pore pressure or fluid content within a cylinder, placed at shallow depth. As a first order approximation, we neglect the role of temperature changes. The solution can be borrowed from the analogous gravitational problem (Wang, 2000, p. 109).
Considering a cylinder of thickness h and radius a, located at a depth d (Figure 4), the vertical displacement uz at the surface, expected at the origin point O due to a uniform pressure change p0 can be expressed as (Wang, 2000):
where ν is the Poisson’s coefficient and cm is the uniaxial poroelastic coefficient. Under conditions of uniaxial strain, this coefficient is the ratio of axial strain to pore pressure changes and can be expressed as a function of the Biot-Willis coefficient α, the bulk modulus K and the drained Poisson’s coefficient ν:
Pressure change p0 can therefore be obtained from the observed vertical displacement uz:
Displacement can also be expressed in terms of the uniform change of fluid content ζ0:
where γ is the loading efficiency. γ can be expressed as a function of the Skempton’s parameter B, relating the pore pressure changes to the change in applied stress under undrained conditions, and the undrained Poisson’s ratio νu:
The undrained Poisson’s ratio νu can be expressed as a function of drained Poisson’s ratio ν, the Biot-Willis coefficient and the Skempton’s parameter:
The change in fluid content ζ0 can be therefore computed as:
4 Pore Pressure Changes
Changes in ground elevation (Figure 1, measured at the Pozzuoli harbour at different times since 1985 (Del Gaudio et al., 2010; De Martino et al., 2014), are used here to compute the corresponding changes in pore pressure, according to Eq. 2. Recent deformation is described by GPS data (De Martino et al., 2014), which provide a more detailed temporal representation of ground displacement. Being interested in the general trend, this time series was sampled in order to keep the time interval between subsequent measurement comparable to the average time interval (≈154 days) that characterized the older data set, based on levelling measurements. Higher sampling rates do not alter the general outcome, but produce noisier results. The two data sets overlap over the period from 2000 to 2010, when they show comparable trends. In the following, values from the most recent GPS data set are considered after the year 2000.
Results are plotted in Figure 5 where pressure changes corresponding to each measured displacement are shown in green (Figure 5A), while the overall pressure evolution is shown in blue (Figure 5B). Open symbols refer to the data set published by Del Gaudio et al. (2010), while solid symbols are based on De Martino et al. (2014). During the considered time period, pressure declines, with only minor increments corresponding to the mini-uplifts (Gaeta et al., 2003). The maximum pressure drop since 1985 is −4.26 MPa and is achieved in November 2004. The following uplift was associated with a continuous pressure build up, leading to a pore pressure increment of 2.38 MPa in September 2018.
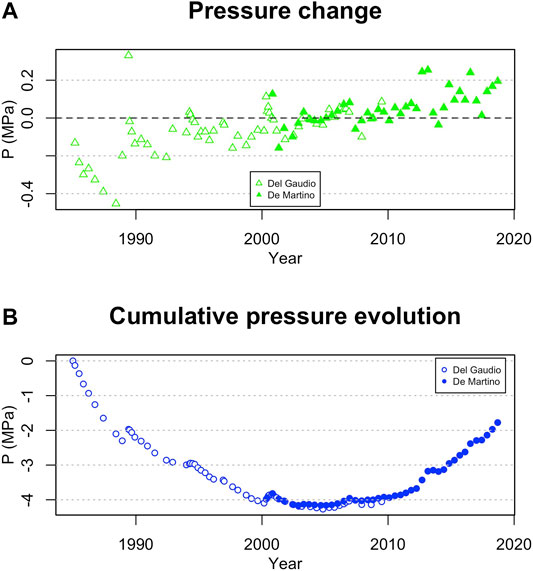
FIGURE 5. (A) Pore pressure changes (green) calculated from post-1985 displacement data, assuming the system geometry shown in Figure 4 and (B) the corresponding pressure evolution (blue). Open symbols refer to the dataset by Del Gaudio et al. (2010), while solid symbols are based on data by De Martino et al. (2014).
The choice of system geometry may affect this result. Figure 6 compares the pressure evolution computed with different choices of reservoir size and position. Larger reservoirs require smaller pressure changes. The depth of the reservoir’s top also affects the pressure change necessary to produce the observed displacement, with deeper reservoirs requiring greater pressure variations. The estimates for overall pressure drop associated with the post-1985 subsidence vary from −2 to 7 MPa. Only in the case of a very thin vertical cylinder with a radius of 500 m, the pressure drop required to achieve the observed displacement reaches −11 MPa.
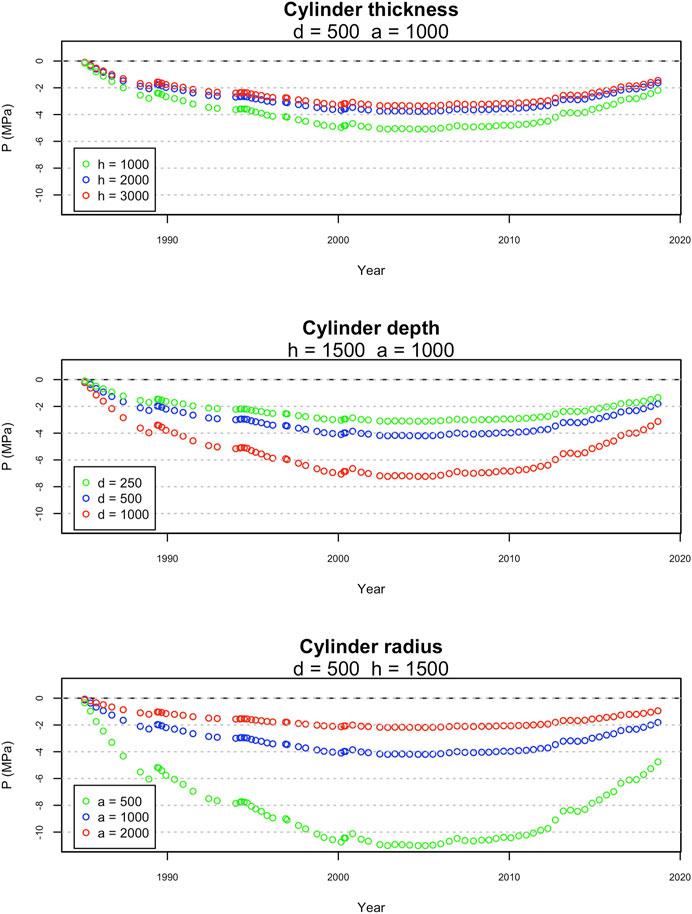
FIGURE 6. Effects of hydrothermal reservoir geometry on pressure changes. Plots compare pressure evolution considering different reservoir thicknesses (A), depths (B), and radiuses (C).
5 Changes in Fluid Content
Under the same assumptions described above, displacement data can be used to compute the corresponding changes in fluid content (Eq. 4). In this case, we need to define the value of the Skempton’s coefficient B, relating the pore pressure changes to the change in applied stress, under undrained conditions. Most applications of the linear theory of poroelasticity describe systems where the pore fluid is incompressible (typically, liquid water), for which Bl = 1 is a reasonable approximation. If we consider liquid water as the fluid filling the reservoir pores, the change in fluid content corresponding to the observed deformation range from −2.6 × 10⁻⁴ to 1.9 × 10⁻⁴. Negative values refer to water leaving the reservoir, during caldera subsidence, while positive values refer to water entering the hydrothermal system, causing its inflation. The change in fluid content is a dimensionless quantity, normalized with respect to a reference volume. If we consider the reference volume to be the initial pore volume available in the hydrothermal reservoir, we can compute the corresponding changes in fluid volume that range from −4 × 10⁵ to 3 × 10⁵ m3, with an average value of −1.7 × 10⁴ m3. Knowing the fluid density and the time intervals separating two consecutive measurements, we can then transform these changes in fluid volumes into flow rates (Figure 7A). Values are computed considering a constant liquid density of 960 kg/m3 (corresponding to near-boiling temperature at atmospheric pressure), the liquid flow rates required to cause the observed displacement range from −24.27 to 45.23 kg/s.
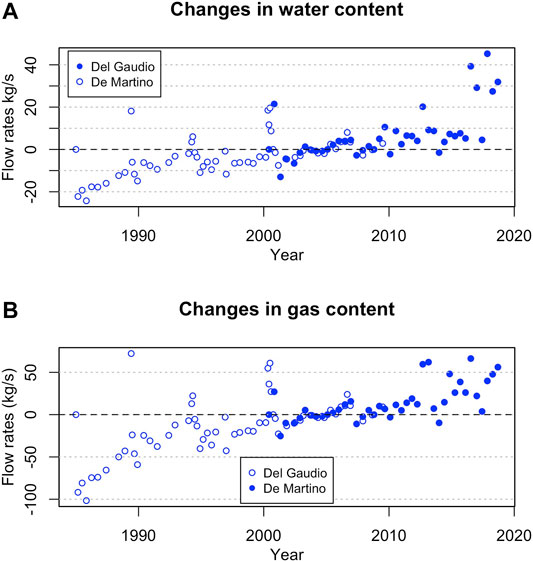
FIGURE 7. Fluid flow rates leaving (negative values) or entering (positive values) the hydrothermal reservoir required to justify the observed displacement in the case of (A) liquid water and (B) gas. Values are computed based on the observed displacement published by Del Gaudio et al. (2010) (open dots) and De Martino et al. (2014) (solid dots). See text for further discussion.
In the case of Campi Flegrei, however, evidence suggests that a significant portion of the hydrothermal reservoir is occupied by gas. To compute the change in fluid content for a gas-saturated system, we need to define the Skempton’s coefficient and the fluid density, which are both depending on the reservoir evolving pressure. Considering the pressure evolution depicted in Figure 5, we can arbitrarily set the initial reservoir pressure at 4.5 MPa and apply the computed pressure changes to reconstruct the pressure history. Following Wang (2000), the value of the Skempton’s coefficient for highly compressible fluids can be approximated as:
where α is the Biot-Willis poroelastic expansion coefficient, Kf and K are the fluid and rock bulk moduli, respectively, and ϕ is rock porosity. For highly compressible fluid Kf ≪ K and, under isothermal conditions, Kf corresponds to the reservoir evolving pressure. The Bg values corresponding to the computed pressure evolution range from 4.7 × 10⁻⁴ to 8.83 × 10⁻³, with smaller values corresponding to lower reservoir pressures. The corresponding changes in fluid content ranges from −0.1 to 0.075. Again, we can convert these dimensionless quantities into volumes by considering the initial pore volume available in the hydrothermal reservoir. The fluid volume change in case of a gas-saturated rock ranges from −1.56 × 10⁸ to 1.17 × 10⁸ m3. To compute the corresponding mass flow rates we need to introduce the time interval among different measurements and to specify the gas density.
The density of the gas mixture depends on both evolving reservoir conditions and gas composition. As a first order approximation, we are considering a constant reservoir temperature that we can set at 250°C. Pressure history is based on the evolution shown in Figure 5, and considering an initial value of 4.5 MPa. We can consider the gas as a mixture of steam and carbon dioxide, whose densities at the considered system conditions can be computed based on data from the NIST Chemistry Webbook (Linstrom and Mallard, 2020). Gas composition (Caliro et al., 2014) is then used to set the relative proportion of steam and carbon dioxide at different times and to compute the corresponding density of the gas mixture. Obtained values range from 0.70 to 30.36 kg/m3, with lower values corresponding to the minimum pressure (0.24 MPa reached in November 2004). The corresponding gas flow rates range from −101.64 to 66.30 kg/s (Figure 7B). The mini-uplifts observed after 1985 are clearly marked by positive increments in fluid before the year 2000. As expected, a gas-dominated system requires higher discharge rates than a liquid-dominated system.
As discussed in previous sections, it is reasonable to assume that at least in some portions of the hydrothermal reservoir underneath Solfatara both gas and liquid phases coexist.
The change in fluid content in a two-phase system depends on the relative proportion of gas and liquid that can be expressed in terms of gas volume fraction, or gas saturation (Sg). For a two-phase mixture (where gas and liquid move together), we can compute the Skempton’s parameter and the fluid density as a function of Sg, based on their values for the single phases:
Figure 8 shows the effect of the increasing the amount of gas in the mixture on the corresponding flow rates. When liquid water dominates (Sg < 0.5), a smaller change in fluid content is required to achieve the observed deformation, with computed flow values that almost correspond to those obtained with a complete liquid saturation. However, as the gas fraction in the reservoir increases, the amount of fluid that needs to leave or enter the reservoir to justify the deformation changes significantly, with the maximum absolute value ranging from 44.56 kg/s with Sg = 0.95, to 69.73 kg/s when Sg = 0.99, to 121.17 kg/s, when the system is gas saturated.
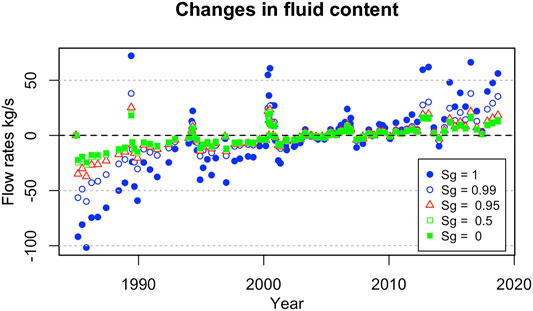
FIGURE 8. Flow rates of a two-phase fluid mixture required to cause the observed deformation. Symbols of different shape and size refer to different gas fractions (Sg). Flow rates obtained with single-phase gas or liquid are also reported (solid symbols) for comparison. Values are computed based on the observed displacement published by Del Gaudio et al. (2010) and De Martino et al. (2014). See text for further discussion.
This comparison shows that even a small fraction of water almost halves the flow rate required to cause a given deformation. It should be noted that the gas fraction values indicated in Figure 8 refers to the proportion of gas and liquid in the fluid mixture that leaves or enter the reservoir. Such proportion does not necessarily reflect the phase distribution within the reservoir. Even when both phases are present, gas and liquid are easily separated by their different density, viscosity, relative permeability, and by the effects of capillary forces. Generally speaking, gas is more mobile and more likely to move than liquid. When this is the case, the poroelastic response only depends on the properties of the phase that moves in or out from the reservoir (and on the volume available to that phase).
Computed changes in gas content can be used to estimate the overall amount of gas that transited through the reservoir since 1985. Open dots in Figure 9 show the total mass of fluid leaving the reservoir at different times. Solid dots illustrate the gas increment that is being stored inside the same reservoir, during uplift.
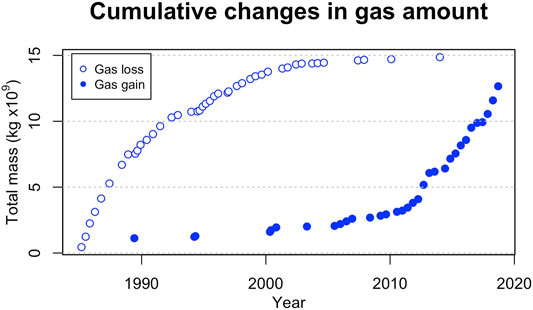
FIGURE 9. Mass of gas leaving the hydrothermal reservoir since 1985 (open symbols) compared to the total amount of gas entering the reservoir (solid symbols) during the same time interval.
Considering the fumarole gas composition as representative of the ratio between steam and gas everywhere in the system, we can compute the total amount of carbon dioxide that passed through the reservoir. The total mass of carbon dioxide is shown in Figure 10, where the total mass of gases is also shown. Over the time interval considered, the total amount of carbon dioxide transited through the system is 10.99 × 10⁹ kg while the total mass of gas is equal to 27.52 × 10⁹ kg.
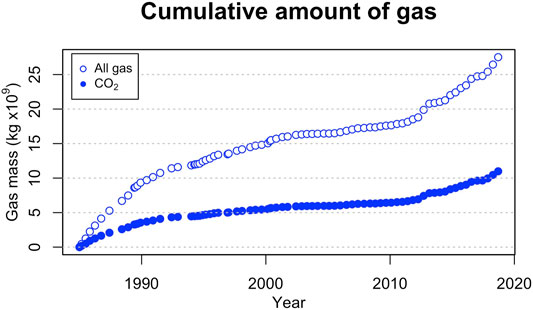
FIGURE 10. Cumulative amount of gas transited through the hydrothermal system since 1985 (both leaving and entering the reservoir). Open symbols refer to all gas, solid symbol to CO2.
6 Discussion
The post-1985 ground displacement observed at Campi Flegrei include a 20-years-long subsidence phase followed by a 15-years-long uplift. Unlike previous uplift episodes, this deformation history could be entirely due to changes in pore pressure and fluid content in a shallow hydrothermal reservoir. This work tested this hypothesis, by introducing some simplifying assumption about the poroelastic source of deformation. Data available from recent scientific literature was used to constrain the size, geometry, depth, and properties of the shallow hydrothermal reservoir. Observed ground displacement was then used to infer the driving changes in pore pressure and fluid content. Despite the simplifications (in particular, the uniform pressure changes throughout the source) the calculations presented here provide a first order estimate of quantities involved and allows some interesting considerations. In the following, results are compared with available data; then the role of temperature changes is examined; and finally the implications of a shallow, poroelastic source are discussed.
6.1 Comparison With Available Data
According to the calculation presented above, the observed subsidence phase corresponds to an overall pore pressure drop of −4.26 MPa, while the subsequent uplift phase requires a pressure build up of about 2.4 MPa (Figure 5). An independent assessment of the conditions of the hydrothermal reservoir is based on geochemical equilibria of the CO2 − CO − CH4 − H20 − H2 system. Based on fumarole gas composition, inferred equilibrium pressure range from 3 MPa, during the 1982-84 unrest (Cioni et al., 1984; Chiodini et al., 2001), to 0.3–0.7 MPa, at the end of the subsidence (Chiodini et al., 2001). Further data for the subsequent period led to equilibrium values ranging from 1.7 to 3.7 MPa (Chiodini et al., 2011), with higher values corresponding to periods of uplift. More recently, Chiodini et al. (2021) extended the range from 2.7 to 6 MPa (or from 3.7 to 7.8 MPa, depending on the choice of redox buffer). The order of magnitude of these independent estimates is comparable with the pore pressure variations depicted in Figure 5. Equilibrium pressure values do not represent the conditions of the entire reservoir, but only those of a shallow equilibration zone (Chiodini et al., 2021). The comparison with these data however shows how the estimated pressure history (Figure 5) is plausible and spans over a similar range. Different choices of reservoir geometry may account for slightly higher values of equilibration pressure (up to almost 8 MPa), with greater pressure changes being favoured by a thinner, smaller, or deeper reservoir.
Measured ground displacement were also used to compute the corresponding changes in fluid content. Such changes depend on the choice of fluid phase and properties. Maximum changes in fluid volume during the subsidence range from −4 × 10⁵ m3 (for liquid water) to −1.56 × 10⁸ m3 (for dry gas). Slightly lower values characterize the subsequent uplift phase, ranging from 2.9 × 10⁵ m3, in case of liquid, to 1.17 × 10⁸ m3, in case of gas. If the pore fluid is liquid water, the post-1985 subsidence requires a maximum discharge rate of 25 kg/s of water, whereas a greater maximum flow rate (45 kg/s) is needed to justify the ongoing uplift phase. These are small values compared to the shallow groundwater fluxes estimated for the nearby city of Naples, where discharge rate toward the sea is quantified in approximately 300 kg/s and aquifer recharge is of the order of 500 kg/s (Ducci and Sellerino, 2015).
When a gas phase permeates the reservoir, greater quantities are involved: when a mixture of steam and carbon dioxide is considered, the maximum flow rate required to justify the post-1985 subsidence is as high as 102 kg/s, while the uplift corresponds to a fluid injection rate of 66 kg/s. Contrary to the case of a liquid saturated system, in this case greater flow rates are required during the subsidence than during the uplift, reflecting the strong dependence of gas density on evolving pore pressure.
Calculated gas flow rates can be compared with available measurements of CO2 diffuse degassing (Cardellini et al., 2017). CO2 flow rates can be obtained from the calculated total gas flux (Figure 7B), based on gas composition at different times (Caliro et al., 2014). In Figure 11, red symbols refer to measured value (Cardellini et al., 2017) while the absolute values of computed fluxes are shown in blue: open symbols refer to carbon dioxide leaving the reservoir, while solid symbols indicate CO2 entering the reservoir. Measured CO2 discharge rate ranges from 8.62 (on July 2003) to 32.58 kg/s (on January 2015), with an average value of 15.15 kg/s. Computed values cover a wider range within the same order of magnitude, with values ranging from 0.27 to 42 kg/s, and an average value of 10.85 kg/s. Observations do not cover the initial phase of intense discharge corresponding to the fast post-1985 subsidence. However, after 1990 maximum computed values are consistent with measurements and follow a similar, increasing trend after 2010. Figure 11 shows the ongoing uplift phase can be generated by flow rate of the same order of magnitude of measured fluxes. These figures depend on the choice of fluid phase, and even minor fraction of liquid water may significantly reduce the fluid change required to cause the observed displacement (Figure 8). The comparison between calculated and observed flow rate suggest that the fluid change required to justify the observed deformation is reasonable within the Campi Flegrei volcanic system, and is consistent with available information.
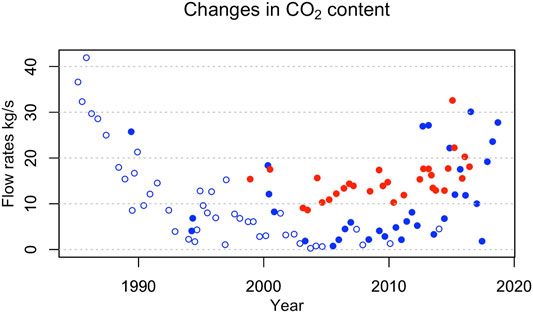
FIGURE 11. Comparison between the absolute value of simulated flow rates (blue) and measured CO2 diffuse degassing (red) (Cardellini et al., 2017). Open symbols refer to fluid leaving the reservoir, while the solid dots refer to the fluid entering the reservoir.
6.2 Temperature Effects
Presented results do not account for temperature changes. Chiodini et al. (2021) inferred a temperature increment of almost 50°C in 10 years since 2010, based on geochemical equilibria and under the assumption of a two-phase system. We can make a rough estimate of the effects of such a temperature change on the deformation of the porous matrix. Considering a coefficient of thermal expansion of the order of 10–5, such a temperature increment would result in a volumetric strain of 5 × 10⁻⁴. If we consider the hydrothermal reservoir in Figure 4 as the the initial deforming volume, the corresponding volume change would be of the order of 7.85 × 10⁵ m3. Assuming that the entire deformation takes place only along the vertical direction, the resulting vertical displacement would be of the order of 0.25 m, i.e., approximately half of the deformation observed at Campi Flegrei since 2010. Temperature changes also affect fluid properties, with higher temperatures lowering the fluid density and the corresponding flow rates. In a dry gas system at the condition of interest, a temperature increment of 50°C would reduce the flow rate by 15%. Greater effects are expected if phase changes are involved. Temperature changes are also going to affect rock hydraulic and mechanical properties, modifying the way in which both the porous medium and the fluid would respond to changes in pore pressure. A full description of the entire phenomenon requires the use of a fully coupled thermo-fluid-mechanical model (Rinaldi et al., 2010; Akande et al., 2021; Nespoli et al., 2021).
Regardless to the exact magnitude of the displacement caused by thermal expansion, heating during uplift is certainly responsible for a fraction of the ongoing deformation, reducing the pressure build up and fluid change necessary to obtain a given displacement. The pressure history and flow rates computed neglecting temperature effects are already comparable with independent estimates and can be considered plausible for the hydrothermal reservoir at Campi Flegrei. Accounting for thermal effects would require even smaller changes to explain the observed deformation, leaving the poroelastic deformation a very reasonable candidate to explain the post-1985 deformation history at Campi Flegrei.
6.3 Implications of a Poroelastic Source of Deformation
The role of hydrothermal fluids as potential drivers of poroelastic deformation is not new and was proposed in the past to explain ground deformation observed at Campi Flegrei (Casertano et al., 1976; Bonafede, 1991; Todesco et al., 2004; Battaglia et al., 2006; Rinaldi et al., 2010; Akande et al., 2021; Nespoli et al., 2021) and in different contextes (Hurwitz et al., 2007; Currenti et al., 2017; Mittal and Richards, 2019). The simple calculation presented above shows that poroelastic deformation is a feasible mechanism to explain both subsidence and uplift observed at Campi Flegrei during the last 35 years. Unlike previous unrest episodes, characterized by fast and large ground displacement, the post-1985 deformation is consistent with the inflation and deflation of a shallow hydrothermal system, changing pore pressure and fluid content. The idea was already proposed by several authors (Chiodini et al., 2011; Aiuppa et al., 2013; Chiodini et al., 2015; Moretti et al., 2017, 2018), but the hypothesis was not tested before. This mechanism is simple, plausible, and consistent with available information on the caldera volcanic system.
In the simplest configuration, the hydrothermal reservoir is fed by volatiles of magmatic origin and releases fluids at the surface through fumaroles and diffuse degassing. Even in such a simple system, the pressure history of the reservoir does not simply depend on the actual amount of gases available (i.e., on the size and conditions of magma degassing at depth). The overall evolution is controlled by the balance between gas entering the hydrothermal reservoir and gas discharged at the surface. Even in the presence of a constant gas supply, deflation or inflation may occur depending on how fast gas is discharged at the surface. After 1985, deflation may have occurred because magmatic gas recharge declined or stopped altogether, while discharge continued. However, subsidence could also have occurred with a steady, or even increasing, magmatic input, provided it was accompanied by a faster fluid removal from the reservoir.
The implications of ongoing unrest at Campi Flegrei depend on the source that drives the deformation, causing the switch between subsidence and uplift. Many processes operate within the magma chamber, influencing the exsolution process and affecting the rate, amount, and composition of released volatiles. However, the widespread hydrothermal system that lies between the degassing magma body and the surface is an active interface that controls and modulates the transit of fluids toward the surface (Mittal and Richards, 2019). Here, the interaction with liquid water may influence the upward propagation of magmatic volatiles, because of phase interference (related to relative permeability and capillary pressure effects) and the possible dissolution of gas species. Fluid-rock interaction may also intervene to modify the porosity and permeability of the porous medium. These shallow features affect the ascent of magmatic volatiles, thereby controlling the pressure history and the amounts of fluids within the hydrothermal reservoir.
The pattern defined by gas leaving and entering the reservoir well describes a deflation-inflation cycle (Figure 9) that seems to be related to the total amount of fluids that can be stored within the reservoir: the rate at which the gas enters the reservoir (solid dots) only increases after fluid discharge (open symbols) stops growing. At this time, the reservoir has reached its maximum deflation and lowest pore pressure, and more fluid can enter the reservoir. As the figure shows, the total gas input has been approaching the total mass discharged in the last few years since 1985. The gradual shift toward conditions existing in 1984 was already highlighted with concern, as long-term stress and damage accumulation may favor crust failure and the onset of eruptions (Kilburn et al., 2017). We do not know the actual pressure within the magmatic system and the amounts of fluids available to feed the reservoir at this time, as we do not know the actual state of the rock and the maximum pore pressure it can withstand, so there is no way to predict how the system will evolve. However, if fracturing does not occur, the hydrothermal reservoir could act as a valve, allowing fluid entrance and inflation only as long as its pore pressure is lower than the pressure of external fluids (magmatic volatiles or shallower meteoric fluids). If the displacement reached in 1985 represents an upper limit for reservoir inflation, the corresponding pore pressure might have been high enough to prevent further input into the reservoir. Under these conditions, a subsidence phase began, thanks to a fast fluid discharge at the surface and high pressure in the reservoir. As fluids are progressively removed, reservoir pressure drops, and a minor but increasing fluid input modulates its decline. Both the rate of fluid injection and fluid discharge change through time, governed by the evolving pressure, until they reach similar values, and the deformation pauses, as occurred between 2000 and 2005. From this time on, fluid input is enhanced by low reservoir pressure. Eventually, the rate at which fluids enter the system overcomes the rate at which they are discharged at the surface and uplift resumes. Once pore pressure inside the reservoir overcomes that of surrounding rocks, no more fluid cans enter, and subsidence could begin once again. The results presented here do not exclude the possible involvement of magma in driving the recent deformation at Campi Flegrei. Magmatic and hydrothemal fludis could both participate, to variable extents, in determining the evolution of past and ongoing unrest. The present study however shows that hydrothermal fluids alone can be responsible for significant ground deformation. Repeated cycles of uplift and subsidence without eruption already happened in the caldera history (Morhange et al., 2006; Isaia et al., 2009; Todesco et al., 2014), yet without conclusive explanations. A mechanism of this sort could work on different spatial and temporal scales, providing a plausible justification for these observations.
Performed calculations and available data also provide some clues on the amount of carbon dioxide that entered the hydrothermal reservoir during the considered period. When calculated changes in fluid content are close to zero, the amount of gas that enters equals the amount of gas that leaves the reservoir and corresponds to the measured discharge (Figure 11). The CO2 input from 2000 to 2005 must have been of the order of 12 kg/s. In the following years, uplift resumed and, toward the end of 2006, the calculated fluid input in the reservoir reaches 5.6 kg/s, accompanied by an observed fluid discharge of 14.4 kg/s. To sustain both surface degassing and the increment in fluid content within the reservoir, at least 20 kg/s of carbon dioxide must have entered the reservoir. Later on, the measured flux exceeds 32 kg/s, while computed fluid increment reaches a maximum of 30 kg/s: more than 60 kg/s of carbon dioxide (corresponding to 5,184 tonnes per day) must have entered the reservoir. The increasing amount of carbon dioxide points toward an increased magmatic degassing or increased efficiency of decarbonation reactions in the cap-rock.
In total, more than 27 million tonnes of gas passed through the hydrothermal reservoir, modulating the ground displacement (Figure 10). Approximately 11 of these were carbon dioxide. Assuming that all gas has a magmatic origin, these amounts can be used to constrain the size of the magma body degassing at depth. Considering a magma with a density of 2,700 kg/m3 and initial content of total dissolved volatiles of 2.5% and a CO2 content of 1%, the volume of magma necessary to exsolve the calculated amounts of gases is slightly less than half cubic km (4.07 × 10⁸ m3). Considering a higher initial gas content (5% total gas, 2% of CO2) the corresponding magma volume halves (0.20 × 10⁸ m3). These values are reasonable for a volcanic system like Campi Flegrei, where similar volumes were estimated for magma intrusions before the Monte Nuovo eruption (Di Vito et al., 2016). Smaller magma volumes would be obtained considering a two-phase scenario (that would reduce the amounts of fluids involved) or accounting for the presence of a non-magmatic source of fluids.
The simple calculations presented above showed that reasonable changes in pore pressure and fluid content might cause ground deformation of the same order of magnitude of the observed displacement. Pressure history and fluid content may be affected by phase transition, chemical reactions, or changes in rock porosity and permeability that control the available pore volume and the rate at which fluid can propagate and exchange heat with the porous rock. A detailed description of all these effects requires a more sophisticated approach, accounting for the coupled thermo-hydro-mechanical processes in the natural system, from the magma chamber level to the surface (Mittal and Richards, 2019). Indeed, all these changes may generate measurable signals, including ground displacement and changes in gas flow rate and composition. These signals bear very different implications than those associated with an increased magmatic degassing due to a shallow intrusion. The analysis of recent seismicity at Campi Flegrei confirmed the connection between deformation, shallow seismicity, and hydrothermal activity (Giudicepietro et al., 2020). On the contrary, geophysical signals do not appear to reflect magma movement. The possibility that the ongoing unrest is related to a shallow poroelastic deformation should be taken into account and carefully examined.
7 Conclusion
The results and considerations described above allow us to draw some conclusions:
• The post-1985 ground deformation at Campi Flegrei can be described as a poroelastic response to changes in fluid content and pore pressure in a shallow hydrothermal reservoir
• The subsidence phase is consistent with an overall pressure drop within the reservoir of −4.26 MPa, while the following uplift required a pore pressure build-up of 2.38 MPa;
• Corresponding changes in fluid content were transformed into flow rates that reached maximum values at the beginning of the subsidence (−102 kg/s) and the end of the studied period (66.30 kg/s).
• Computed changes in pore pressure and fluid content are plausible, comparable with independent estimates and observations, and describe a system evolution that is consistent with the well-established conceptual model of the caldera.
• During the last two decades, surface degassing increased during uplift periods implying a growing input sustaining both reservoir inflation and gas discharge.
• A shallow hydrothermal origin for the ongoing deformation may explain non-eruptive cycles of subsidence and uplift, driven by the balance between magmatic input and fluid discharge at the surface.
This work shows that, unlike previous unrest episodes, poroelastic deformation alone may provide a simple and plausible explanation for the volcanic unrest after 1985 that is not accompanied by significant evidence of magma movement. Further studies are necessary to address temperature effects, constrain the role of phase changes, and account for the rock’s heterogeneous and evolving properties. Results presented above highlight the role of the hydrothermal system as a potential source of significant unrest episodes. A comprehensive volcanic hazard assessment should account for this possibility. This study confirms once again the importance of careful and continuous monitoring of the hydrothermal fluid circulation.
Data Availability Statement
All datasets analyzed in this study can be found in the references cited in the text. Older temperature data that appear on Italian documents are provided as Supplementary Material.
Author Contributions
MT confirms being the sole contributor of this work and approved it for publication.
Funding
This research was supported by INGV, Sezione di Bologna.
Conflict of Interest
The author declares that the research was conducted in the absence of any commercial or financial relationships that could be construed as a potential conflict of interest.
Publisher’s Note
All claims expressed in this article are solely those of the authors and do not necessarily represent those of their affiliated organizations, or those of the publisher, the editors and the reviewers. Any product that may be evaluated in this article, or claim that may be made by its manufacturer, is not guaranteed or endorsed by the publisher.
Acknowledgments
I wish to thank both reviewers for their careful reading of the original manuscript and for the useful suggestions provided.
Supplementary Material
The Supplementary Material for this article can be found online at: https://www.frontiersin.org/articles/10.3389/feart.2021.702665/full#supplementary-material
References
Aiuppa, A., Tamburello, G., Di Napoli, R., Cardellini, C., Chiodini, G., Giudice, G., et al. (2013). First Observations of the Fumarolic Gas Output from a Restless Caldera: Implications for the Current Period of Unrest (2005-2013) at Campi Flegrei. Geochem. Geophys. Geosyst. 14, 4153–4169. doi:10.1002/ggge.20261
Akande, W. G., Gan, Q., Cornwell, D. G., and De Siena, L. (2021). Thermo‐Hydro‐Mechanical Model and Caprock Deformation Explain the Onset of an Ongoing Seismo‐Volcanic Unrest. J. Geophys. Res. Solid Earth 126, 1–26. doi:10.1029/2020JB020449
Akande, W. G., Siena, L. D., and Gan, Q. (2019). Three-dimensional Kernel-Based Coda Attenuation Imaging of Caldera Structures Controlling the 1982-84 Campi Flegrei Unrest. J. Volcanology Geothermal Res. 381, 273–283. doi:10.1016/j.jvolgeores.2019.06.007
Amoruso, A., and Crescentini, L. (2019). An Approximate Approach to Nonisothermal Emplacement of Kilometer‐Sized Kilometer‐Deep Sills at Calderas. J. Geophys. Res. Solid Earth 124, 1236–1253. doi:10.1029/2018JB016254
Amoruso, A., and Crescentini, L. (2011). Modelling Deformation Due to a Pressurized Ellipsoidal Cavity, with Reference to the Campi Flegrei Caldera, italy. Geophys. Res. Lett. 38, a–n. doi:10.1029/2010GL046030
Amoruso, A., Crescentini, L., Sabbetta, I., De Martino, P., Obrizzo, F., and Tammaro, U. (2014). Clues to the Cause of the 2011-2013 Campi Flegrei Caldera Unrest, Italy, from Continuous GPS Data. Geophys. Res. Lett. 41, 3081–3088. doi:10.1002/2014gl059539
Battaglia, M., Troise, C., Obrizzo, F., Pingue, F., and De Natale, G. (2006). Evidence for Fluid Migration as the Source of Deformation at Campi Flegrei Caldera (Italy). Geophys. Res. Lett. 33, a–n. doi:10.1029/2005GL024904
Berrino, G., Corrado, G., Luongo, G., and Toro, B. (1984). Ground Deformation and Gravity Changes Accompanying the 1982 Pozzuoli Uplift. Bull. Volcanol 47, 187–200. doi:10.1007/BF01961548
Bonafede, M. (1991). Hot Fluid Migration: an Efficient Source of Ground Deformation: Application to the 1982-1985 Crisis at Campi Flegrei-Italy. J. Volcanology Geothermal Res. 48, 187–198. doi:10.1016/0377-0273(91)90042-X
Caliro, S., Chiodini, G., and Paonita, A. (2014). Geochemical Evidences of Magma Dynamics at Campi Flegrei (Italy). Geochimica et Cosmochimica Acta 132, 1–15. doi:10.1016/j.gca.2014.01.021
Calò, M., and Tramelli, A. (2018). Anatomy of the Campi Flegrei Caldera Using Enhanced Seismic Tomography Models. Sci. Rep. 8, 16254. doi:10.1038/s41598-018-34456-x
Cardellini, C., Chiodini, G., Frondini, F., Avino, R., Bagnato, E., Caliro, S., et al. (2017). Monitoring Diffuse Volcanic Degassing during Volcanic Unrests: The Case of Campi Flegrei (Italy). Sci. Rep. 7, 1–15. doi:10.1038/s41598-017-06941-2
Casertano, L., Del Castillo, A. O., and Quagliariello, M. T. (1976). Hydrodynamics and Geodynamics in the Phlegraean fields Area of Italy. Nature 264, 161–164. doi:10.1038/264161a0
Chiodini, G., Caliro, S., Avino, R., Bini, G., Giudicepietro, F., De Cesare, W., et al. (2021). Hydrothermal Pressure-Temperature Control on CO2 Emissions and Seismicity at Campi Flegrei (Italy). J. Volcanology Geothermal Res. 414, 107245. doi:10.1016/j.jvolgeores.2021.107245
Chiodini, G., Frondini, F., Cardellini, C., Granieri, D., Marini, L., and Ventura, G. (2001). CO2degassing and Energy Release at Solfatara Volcano, Campi Flegrei, Italy. J. Geophys. Res. 106, 16213–16221. doi:10.1029/2001jb000246
Chiodini, G., Todesco, M., Caliro, S., Del Gaudio, C., Macedonio, G., and Russo, M. (2003). Magma Degassing as a Trigger of Bradyseismic Events: The Case of Phlegrean Fields (Italy). Geophys. Res. Lett. doi:10.1029/2002gl016790
Chiodini, G., Vandemeulebrouck, J., Caliro, S., D'Auria, L., De Martino, P., Mangiacapra, A., et al. (2015). Evidence of thermal-driven Processes Triggering the 2005-2014 Unrest at Campi Flegrei Caldera. Earth Planet. Sci. Lett. 414, 58–67. doi:10.1016/j.epsl.2015.01.012
Cioni, R., Corazza, E., and Marini, L. (1984). The Gas/steam Ratio as Indicator of Heat Transfer at the Solfatara Fumaroles, Phlegraean Fields (Italy). Bull. Volcanol 47, 295–302. doi:10.1007/bf01961560
Currenti, G., Napoli, R., Coco, A., and Privitera, E. (2017). Effects of Hydrothermal Unrest on Stress and Deformation: Insights from Numerical Modeling and Application to Vulcano Island (Italy). Bull. Volcanol 79, 28. doi:10.1007/s00445-017-1110-3
Dall’Aglio, M., Martini, M., and Tonani, F. (1972). Rilevamento geochimico delle emanazioni vulcaniche dei Campi Flegrei. Quaderni de La Ricerca Scientifica 83, 152–181.
D’Auria, L., Pepe, S., Castaldo, R., Giudicepietro, F., Macedonio, G., Ricciolino, P., et al. (2015). Magma Injection beneath the Urban Area of Naples: A New Mechanism for the 2012-2013 Volcanic Unrest at Campi Flegrei Caldera. Sci. Rep. 5, 1–11. doi:10.1038/srep13100
Del Gaudio, C., Aquino, I., Ricciardi, G. P., Ricco, C., and Scandone, R. (2010). Unrest Episodes at Campi Flegrei: A Reconstruction of Vertical Ground Movements during 1905-2009. J. Volcanology Geothermal Res. 195, 48–56. doi:10.1016/j.jvolgeores.2010.05.014
Di Vito, M. A., Acocella, V., Aiello, G., Barra, D., Battaglia, M., Carandente, A., et al. (2016). Magma Transfer at Campi Flegrei Caldera (Italy) before the 1538 AD Eruption. Sci. Rep. 6, 32245. doi:10.1038/srep32245
Ducci, D., and Sellerino, M. (2015). Groundwater Mass Balance in Urbanized Areas Estimated by a Groundwater Flow Model Based on a 3D Hydrostratigraphical Model: the Case Study of the Eastern Plain of Naples (Italy). Water Resour. Manage. 29, 4319–4333. doi:10.1007/s11269-015-1062-3
Gaeta, F. S., Peluso, F., Arienzo, I., Castagnolo, D., De Natale, G., Milano, G., et al. (2003). A Physical Appraisal of a New Aspect of Bradyseism: The Miniuplifts. J. Geophys. Res. 108, 2363. doi:10.1029/2002JB001913
Giberti, G., Yven, B., Zamora, M., and Vanorio, T. (2006). “Geophysical Exploration of the Campi Flegrei (Southern Italy) Caldera’ Interiors: Data, Methods and Results (DoppiaVoce), Chap,” in Database on Laboratory Measured Data on Physical Properties of Rocks of Campi Flegrei Volcanic Area (Italy). Editor Doppiavoce (GNV), 179–192.
Giovanni Chiodini, G., Rosario Avino, R., Stefano Caliro, S., and Carmine Minopoli, C. (2011). Temperature and Pressure Gas Geoindicators at the Solfatara Fumaroles (Campi Flegrei). Ann. Geophys. 54, 151–160. doi:10.4401/ag-5002
Giudicepietro, F., Chiodini, G., Avino, R., Brandi, G., Caliro, S., De Cesare, W., et al. (2020). Tracking Episodes of Seismicity and Gas Transport in Campi Flegrei Caldera through Seismic, Geophysical, and Geochemical Measurements. Seismological Res. Lett. 92, 965–975. doi:10.1785/0220200223
Gresse, M., Vandemeulebrouck, J., Byrdina, S., Chiodini, G., Roux, P., Rinaldi, A. P., et al. (2018). Anatomy of a Fumarolic System Inferred from a Multiphysics Approach. Sci. Rep. 8, 7580–7611. doi:10.1038/s41598-018-25448-y
Heap, M. J., Baud, P., Meredith, P. G., Vinciguerra, S., and Reuschlé, T. (2014). The Permeability and Elastic Moduli of Tuff from Campi Flegrei, Italy: Implications for Ground Deformation Modelling. Solid Earth 5, 25–44. doi:10.5194/se-5-25-2014
Heap, M. J., Villeneuve, M., Albino, F., Farquharson, J. I., Brothelande, E., Amelung, F., et al. (2020). Towards More Realistic Values of Elastic Moduli for Volcano Modelling. J. Volcanology Geothermal Res. 390, 106684. doi:10.1016/j.jvolgeores.2019.106684
Hurwitz, S., Christiansen, L. B., and Hsieh, P. A. (2007). Hydrothermal Fluid Flow and Deformation in Large Calderas: Inferences from Numerical Simulations. J. Geophys. Res. 112, 1–16. doi:10.1029/2006JB004689
Isaia, R., Marianelli, P., and Sbrana, A. (2009). Caldera Unrest Prior to Intense Volcanism in Campi Flegrei (Italy) at 4.0 Ka B.P.: Implications for Caldera Dynamics and Future Eruptive Scenarios. Geophys. Res. Lett. 36, L21303. doi:10.1029/2009gl040513
Kilburn, C. R. J., De Natale, G., and Carlino, S. (2017). Progressive Approach to Eruption at Campi Flegrei Caldera in Southern Italy. Nat. Commun. 8, 15312. doi:10.1038/ncomms15312
Linstrom, P., and Mallard, W. (2020). NIST Chemistry WebBook, NIST Standard Reference Database Number 69. National Institute of Standards and Technology. doi:10.18434/T4D303
Macedonio, G., Giudicepietro, F., D'Auria, L., and Martini, M. (2014). Sill Intrusion as a Source Mechanism of Unrest at Volcanic Calderas. J. Geophys. Res. Solid Earth 119, 3986–4000. doi:10.1002/2013JB010868
Manconi, A., Walter, T. R., Manzo, M., Zeni, G., Tizzani, P., Sansosti, E., et al. (2010). On the Effects of 3-d Mechanical Heterogeneities at Campi Flegrei Caldera, Southern italy. J. Geophys. Res. Solid Earth 115, B08405. doi:10.1029/2009JB007099
Martini, M. (1986). Thermal Activity and Ground Deformation at Phlegrean Fields, Italy: Precursors of Eruptions or Fluctuations of Quiescent Volcanism? A Contribution of Geochemical Studies. J. Geophys. Res. 91, 12255–12260. doi:10.1029/jb091ib12p12255
Mittal, T., and Richards, M. A. (2019). Volatile Degassing from Magma Chambers as a Control on Volcanic Eruptions. J. Geophys. Res. Solid Earth 124, 7869–7901. doi:10.1029/2018JB016983
Moretti, R., De Natale, G., and Troise, C. (2017). A Geochemical and Geophysical Reappraisal to the Significance of the Recent Unrest at Campi Flegrei Caldera (Southern Italy). Geochem. Geophys. Geosyst. 18, 1244–1269. doi:10.1002/2016GC006569
Moretti, R., Troise, C., Sarno, F., and De Natale, G. (2018). Caldera Unrest Driven by CO2-induced Drying of the Deep Hydrothermal System. Sci. Rep. 8, 8309. doi:10.1038/s41598-018-26610-2
Morhange, C., Marriner, N., Laborel, J., Todesco, M., and Oberlin, C. (2006). Rapid Sea-Level Movements and Noneruptive Crustal Deformations in the Phlegrean Fields Caldera, Italy. Geol 34, 93–96. doi:10.1130/G21894.1
Nespoli, M., Belardinelli, M. E., and Bonafede, M. (2021), Stress and Deformation Induced in Layered media by Cylindrical Thermo-Poro-Elastic Sources: An Application to Campi Flegrei (Italy), J. Volcanology Geothermal Res., 415, 107269. doi:10.1016/j.jvolgeores.2021.107269
Piochi, M., Kilburn, C. R. J., Di Vito, M. A., Mormone, A., Tramelli, A., Troise, C., et al. (2014). The Volcanic and Geothermally Active Campi Flegrei Caldera: an Integrated Multidisciplinary Image of its Buried Structure. Int. J. Earth Sci. (Geol Rundsch) 103, 401–421. doi:10.1007/s00531-013-0972-7
Prospero De Martino, P., Umberto Tammaro, U., and Francesco Obrizzo, F. (2014). GPS Time Series at Campi Flegrei Caldera (2000-2013). Ann. Geophys. 57, S0213. doi:10.4401/ag-6431
Rinaldi, A. P., Todesco, M., and Bonafede, M. (2010). Hydrothermal Instability and Ground Displacement at the Campi Flegrei Caldera. Phys. Earth Planet. Interiors 178, 155–161. doi:10.1016/j.pepi.2009.09.005
Sicardi, L. (1970). Recenti misure termiche alla Solfatara di Pozzuoli e qualche ancora necessaria osservazione. Boll. Società Dei Naturalisti 79, 137–144.
Sicardi, L. (1941). Sulle manifestazioni dell’attività fumarolica della Solfatara di Pozzuoli nell’ultimo ottantennio (1856-1939). Rivista di Scienze Naturali ”Natura” XXXII, 53–74.
Siniscalchi, A., Tripaldi, S., Romano, G., Chiodini, G., Improta, L., Petrillo, Z., et al. (2019). Reservoir Structure and Hydraulic Properties of the Campi Flegrei Geothermal System Inferred by Audiomagnetotelluric, Geochemical, and Seismicity Study. J. Geophys. Res. Solid Earth 124, 5336–5356. doi:10.1029/2018JB016514
Todesco, M., Costa, A., Comastri, A., Colleoni, F., Spada, G., and Quareni, F. (2014). Vertical Ground Displacement at Campi Flegrei (Italy) in the Fifth century: Rapid Subsidence Driven by Pore Pressure Drop. Geophys. Res. Lett. 41, 1471–1478. doi:10.1002/2013GL059083
Todesco, M., Rinaldi, A. P., and Bonafede, M. (2010). Modeling of Unrest Signals in Heterogeneous Hydrothermal Systems. J. Geophys. Res. 115, B09213. doi:10.1029/2010JB007474
Todesco, M., Rutqvist, J., Chiodini, G., Pruess, K., and Oldenburg, C. M. (2004). Modeling of Recent Volcanic Episodes at Phlegrean Fields (Italy): Geochemical Variations and Ground Deformation. Geothermics, 531–547. doi:10.1016/j.geothermics.2003.08.014
Todesco, M. (2009). Signals from the Campi Flegrei Hydrothermal System: Role of a “Magmatic” Source of Fluids. J. Geophys. Res. 114, B05201. doi:10.1029/2008JB006134
Trasatti, E., Bonafede, M., Ferrari, C., Giunchi, C., and Berrino, G. (2011). On Deformation Sources in Volcanic Areas: Modeling the Campi Flegrei (Italy) 1982-84 Unrest. Earth Planet. Sci. Lett. 306, 175–185. doi:10.1016/j.epsl.2011.03.033
Vanorio, T., and Kanitpanyacharoen, W. (2015). Rock Physics of Fibrous Rocks Akin to Roman concrete Explains Uplifts at Campi Flegrei Caldera. Science 349, 617–621. doi:10.1126/science.aab1292
Vanorio, T., Prasad, M., Patella, D., and Nur, A. (2002). Ultrasonic Velocity Measurements in Volcanic Rocks: Correlation with Microtexture. Geophys. J. Int. 149, 22–36. doi:10.1046/j.0956-540x.2001.01580.x
Keywords: Campi Flegrei, poroelastic ground deformation, hydrothermal system, poroelasticity, pore pressure, fluid content
Citation: Todesco M (2021) Caldera’s Breathing: Poroelastic Ground Deformation at Campi Flegrei (Italy). Front. Earth Sci. 9:702665. doi: 10.3389/feart.2021.702665
Received: 29 April 2021; Accepted: 29 July 2021;
Published: 11 August 2021.
Edited by:
Agust Gudmundsson, University of London, United KingdomReviewed by:
Tushar Mittal, Massachusetts Institute of Technology, United StatesThomas R. Walter, German Research Centre for Geosciences, Germany
Copyright © 2021 Todesco. This is an open-access article distributed under the terms of the Creative Commons Attribution License (CC BY). The use, distribution or reproduction in other forums is permitted, provided the original author(s) and the copyright owner(s) are credited and that the original publication in this journal is cited, in accordance with accepted academic practice. No use, distribution or reproduction is permitted which does not comply with these terms.
*Correspondence: Micol Todesco, bWljb2wudG9kZXNjb0Bpbmd2Lml0