 Ziyan Zheng1*
 Zhongwei Yan1,2Jing Chen3*Jiarui Han4Jiangjiang Xia1Xiaohong Zhang5
 Siyu Cai6Xiaolin Liu7,8
- 1Key Laboratory of Regional Climate-Environment Research for East Asia, Institute of Atmospheric Physics, Chinese Academy of Sciences, Beijing, China
- 2College of Earth and Planetary Sciences, University of Chinese Academy of Sciences, Beijing, China
- 3National Meteorological Center, China Meteorological Administration, Beijing, China
- 4Training Centre, China Meteorological Administration Training, Beijing, China
- 5Meteorological Center of Huaihe River Basin, Bengbu, China
- 6State Key Laboratory of Simulation and Regulation of Water Cycle in River Basin, China Institute of Water Resources and Hydropower Research, Beijing, China
- 7State Key Laboratory of Operation and Control of Renewable Energy and Storage Systems, China Electric Power Research Institute, Beijing, China
- 8Electric Power Meteorology State Grid Corporation Joint Laboratory, Beijing, China
Specific users play a key role in interactive forecast systems through user-oriented information (UOI). For hydrological users, a key component of the user-oriented forecast system (UOFS) is to determine the threshold of flood-leading precipitation (TFLP) as a target of the forecast by considering the decision-making information at the user end. This study demonstrates a novel way of simulating TFLP via the inverse simulation of a hydrological model, combined with the flood hazard assessment in the upper reaches of the Huai River Basin controlled by the Wang Jiaba (WJB) hydrological station. The flood hazard, defined as the probability of precipitation beyond the daily evolving TFLP for the next day, was evaluated by using the THORPEX Interactive Global Grand Ensemble (TIGGE) datasets, including 162 members retrieved from 5 TIGGE archive centers. Having integrated the real-time monitored water level (as the UOI) into the UOFS, we applied it to the flood season of 2008 as a case study to evaluate the flood hazard generated by the UOFS for the WJB sub-basin. The simulated TFLP corresponded well with the gap between the monitored and warning water level. The predicted flood hazard probability showed good agreement with the first two flood peaks at 100% accuracy, while exceeding 60% accuracy for the third flood event in that season. Thus, the flood hazard could be better quantified via integration of the forecasted flood-leading precipitation. Overall, this study highlights the usefulness of a UOFS coupled with interactive UOI of real-time water level to determine the dynamical TFLP for flood hazard evaluation with ensemble precipitation forecast. The early flood warning which resulted from such integrated UOFS is directly applicable to operational flood prevention and mitigation.
1 Introduction
The main purpose of weather forecast is to help people in decision-making under the uncertainty and risk of possible upcoming weather and climate events. With ever-deepening understanding of the atmospheric physics and rapid development of numerical modeling techniques, the performance of weather forecast has well been improved over the past decades. However, further improvement in traditional deterministic forecast tends to be limited due to inherent uncertainty of the chaotic system, especially for local extreme events such as flood-leading rains (Thorpe, 2004; Yan et al., 2012; Sagar et al., 2017; Ye et al., 2017). Obviously, there is no perfect, 100% accurate forecasting provision for users in need of predicting extreme events, and thus most decisions should be made in the context of making the best use of forecast information. Due to the inherent uncertainties, the forecast products are often useless if without consideration of the user-end information. In particular cases, the lack of user-end context could cause underestimating or even missing the early warning of disastrous rain and flood, leading to catastrophic consequences (Piekle, 1999; Demuth et al., 2007). The demands of specific users vary widely across different industries and hence should be integrated into specific operational weather forecast systems in order to provide useful products for decision-making in the context of disaster prevention and mitigation.
From a different perspective, users are an important component of the whole forecasting system, rather than simply being individual, passive receivers of forecasting information (Morss et al., 2005; Morgan et al., 2007; Argyle et al., 2017). Stewart et al. (2003) indicated the importance of specific user demands by highlighting that they can effectively improve the forecast skill from another perspective by closing the gap between the forecast information and the needs of various users, something that has not yet been considered in depth in terms of forecast systems. Therefore, an “excellent forecast product” not only requires an accurate and robust performance but must be available and serviceable to users in order to satisfy their demands when it comes to the forecast of extreme weather and climate events (Murphy, 1993; Yan et al., 2012). Ye et al. (2006) proposed a conceptual framework of user-oriented forecast system (UOFS) by coupling the forecast system and specific users to integrate user-oriented information (UOI) dynamically during the forecast process, within which the user-end information should be an interactive component that can adjust the forecasting process and ultimately improve the forecast (Ye et al., 2006). Once the forecast system and users have been integrated, the UOI can also enhance the forecast performance through optimization from user-end feedback. These ideas have greatly enriched the applicability of the UOFS in previous studies (Thorpe, 2004; Golding et al., 2017; Bett et al., 2020).
The value of the weather forecast products will increase if the uncertain information is properly utilized by the specific users, especially in hazard and risk assessment. The ensemble forecast approach, which has been developed and improved rapidly in recent years, is now applied routinely in operational precipitation and hydrological forecast, as well as ocean prediction and flood warning systems (Cloke and Pappenberger, 2009; Bougeault et al., 2010; Yuan et al., 2012; Weerts et al., 2014; Zheng and Zhu, 2016). The recently implemented TIGGE [THORPEX (The Observing System Research and Predictability Experiment) Interactive Grand Global Ensemble] project collected ensemble forecasting products from all major operational weather prediction agencies worldwide and included a full range of uncertainties in weather forecasts in order to help improve the accuracy of 1-day to 2-week high-impact weather forecasts (Pappenberger et al., 2008; Bougeault et al., 2010; Swinbank et al., 2016). TIGGE is aimed to provide a collaborative platform for improving the development and understanding of ensemble weather predictions (Cloke and Pappenberger, 2009; Sagar et al., 2017). Currently, the TIGGE network covers large parts of the world in real time in databases operated by three archive centers (CMA: China Meteorological Administration; ECMWF: European Centre for Medium-Range Weather Forecasts; and NCEP: National Centers for Environmental Prediction) and supports a wide range of investigations and products for forecasting severe weather and climate events (Bougeault et al., 2010; Swinbank et al., 2016). Numerous studies have demonstrated a strong performance of the TIGGE datasets in forecasting torrential rainfall and streamflow (Liu et al., 2013; Louvet et al., 2016; Sagar et al., 2017; Aminyavari et al., 2018), forecasting and providing early flood warnings (He et al., 2010; Bao and Zhao, 2012a; Xu et al., 2012a; Liu S. et al., 2018), predicting tropical cyclones (Qi et al., 2014), forecasting polar weather (Jung and Matsueda, 2016), and monitoring drought (Zhao et al., 2016).
In fact, the parameter calibration for traditional hydrological modeling based upon user-end observed streamflow has also been another kind of interactive approach in a broader sense but is lacking in terms of real-time updates and interaction within the dynamic forecast system. In recent years, the construction and establishment of the UOFS concept and framework has driven advances in many aspects, especially in flood prediction and warnings (Morgan et al., 2007; Rabier et al., 2008; Casati et al., 2010; Yan et al., 2012; Shi et al., 2015). For example, Zhang, (2002) developed a comprehensive flood forecast system by combining forecast models, an interactive software framework, experienced forecaster analysis modules, and reported improved flood forecast performance in several basins in China. However, experience of UOFS in developing regions is still limited, and the flashflood early-warning system has still not been fully established and verified due to the insufficient knowledge and data input (Liu C. et al., 2018). Fully coupled numerical models were also used for flood warning system construction. With the help of refined initialization from user-end involvement, Yuan et al. (2011) developed a forecast system based on a fully coupled model for seasonal hydrological forecast and reported an increased predictive skill for monthly air temperature and precipitation at the global scale. Bao and Zhao (2012b) developed an atmospheric–hydrological–hydraulic model system based on the Xin’anjiang hydrological model for flood forecasting. This model system integrated with the fixed split ratio of the channel streamflow discharge from the user end was driven by TIGGE ensemble forecasts and showed potential for improving the forecast lead time in the Huaihe River Basin for flood management and preparedness. As a fully coupled atmosphere-hydrology platform, the widely used Weather Research and Forecasting (WRF) model was used to produce streamflow forecast and flood warning in typical case studies combined with the ensemble experimental design to provide the uncertainty range, and the results allowed for estimation of both the predictability of the flood event and the uncertainty for risk assessment (Rogelis and Micha, 2018; Ferretti et al., 2020).
However, the previous studies above were mainly focused on the forecast accuracy, and the UOI were static or without feedback and update during the forecasting process. To overcome this limitation, Han et al. (2010) and Yan et al. (2012) developed a self-improving forecast system by taking advantage of incorporating the hydrological user into a conceptual model with reservoir managers in a sub-basin of the Huaihe River Basin (Han, 2010). The user feedback module changed the threshold for flood-leading rainfall depending on previous weather and hydrological conditions. Shi et al. (2015) proposed a framework of a service-oriented technique for ensemble flood forecast based on numerical weather prediction, by which users could acquire information of the clients and make decisions for possible flood prevention. These works emphasized the identification of flood warning for reservoir managers, which was optimized by a clear feedback chain from the user end to the forecast system.
Although the UOFS has developed and progressed well based on the findings of previous studies, there are still several crucial issues that need to improve. First, Yan et al. (2012) pointed out that it is still unclear as to what kind of information from users should be incorporated into the system and how concrete feedback from the user end should be established. The selection, determination, and interaction of UOI remain as challenges in the UOFS development and improvement (Weerts et al., 2014; Adams and Pagano, 2016). Indeed, the UOI and dynamical numerical model system were not integrated comprehensively in the previous studies, while the dynamic real-time feedback between users and forecast systems remains a big challenge in operational meteorological and flood forecast. Secondly, in extreme precipitation and flood events, the skill of numerical model configurations is largely unknown (Lin et al., 2018). Therefore, the response to flood hazard will not be timely and clear if we focus only on the forecast accuracy without the context of specific users.
The present study is to provide a direct and intuitive indicator to the specific users for flood response and prevention actions by establishing a UOFS. We specifically address two questions: (1) Which variable can provide the reasonable and suitable UOI to realize the real-time feedback and effective interaction between forecast system and users? (2) How can UOI be effectively coupled with the forecast system? To answer the questions, we developed a UOFS by using a hydrological model via an inverse simulation structure. The threshold of flood-leading precipitation (TFLP) was taken as the forecast target for flood-prevention users, and the UOI was the daily real-time-monitored water level in the river channel. We incorporated the UOI into the UOFS to simulate the daily TFLP of the upper Huaihe River Basin in summer 2008. Then, the precipitation forecast products derived from the TIGGE datasets were applied to calculate the flood hazard in the study basin for hydrological users. Section 2 describes the framework, data, model, and experimental design. Section 3, 4 present the results and discussion, respectively. Section 5 summarizes the key findings and conclusions with further prospect.
2 Study Basin, Data, and Methods
2.1 Study Basin and Study Case
The study basin is located in the upper Huaihe River Basin, controlled by the Wang Jiaba (WJB) hydrological station situated on the mainstream of Huai River (Figure 1) (WJB sub-basin hereafter). The WJB sub-basin has a slope of 0.49% and covers a catchment area of 30,672 km2. Influenced by the monsoon climate, flashflood occurs frequently in the flood season (1 May to 31 September in official) in the WJB sub-basin, especially in summer. According to the topography in the basin, rainfall can be rapidly routed from upstream to downstream through the WJB station to low-lying flood plains toward the northeast (Supplementary Figure S1). Therefore, as the first key flood control gate of the Huaihe River Basin, the WJB station makes great sense in flood and disaster prevention in the Huaihe River Basin, and the water level at the WJB station is a key indicator known to locals as the Huaihe “barometer” (He et al., 2010).
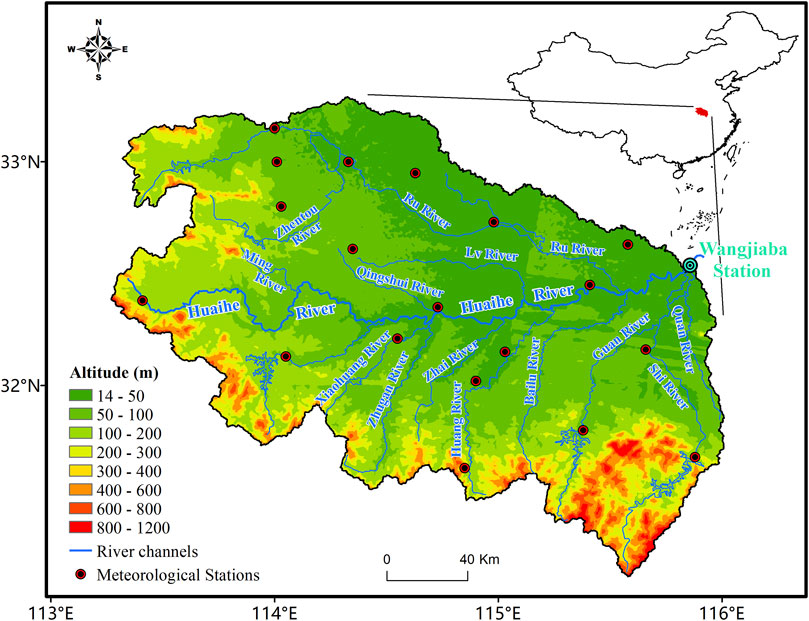
FIGURE 1. Spatial distributions of altitude, WJB hydrological station, and meteorological stations in the WJB sub-basin.
Thus, the WJB sub-basin is a typical area for summer precipitation and flood investigation. However, flood forecast and warnings in the WJB sub-basin are challenging because of the complex weather–climate–hydrology conditions and the urgent needs of specific users like the flood prevention department and decision-making department.
The study period is the flood season of 2008 from June to September. In the summer of 2008, there were 3 main flood events in the WJB sub-basin, which made threats to the operational flood prevention and challenges in early flood warning. During the study period, according to the observation, the water level showed a good consistency, thus helpful for us to establish “water level–streamflow” regression. The well-validated streamflow data and effective UOI were provided by the local hydrological department of the WJB sub-basin. These facilitated us to choose such a case for the construction, modeling, and application test of the UOFS in this study.
2.2 Dataset Description
The daily observational precipitation data used as the input for the hydrological calibration were collected from 19 meteorological stations in the WJB sub-basin (Figure 1). The daily monitored water level and observed streamflow at the WJB hydrological station during the study period were provided by the China Institute of Water Resources and Hydropower Research and Meteorological Center of Huai River Basin. Generally, the water level and streamflow are monitored by the “Walking Acoustic Doppler Current Profiler (ADCP) Automatic Flow Measurement,” which is the latest measurement technology used in the current hydrological station. The ADCP equipment is installed on a motor boat, and the sensors can transfer the real-time monitored information to the hydrological data system when the boat sails on the river.
The TIGGE datasets used in this study were retrieved from five centers: CMA, ECMWF, NCEP, Japanese Meteorological Agency (JMA), and the United Kingdom Met Office (UKMO). In total, we collected 162 members (including one control member for each center) for the probability calculation and flood risk evaluation (Table 1). We used the 24-h-lead daily precipitation, relative humidity, wind speed, and air temperature at 2-m forecasts at a horizontal resolution of 0.5° in the WJB sub-basin. These four variables selected in the TIGGE datasets represent the outputs of the physical prediction of the meteorological component for this study. The daily precipitation from TIGGE 24-h forecast products agrees well with the daily observational precipitation at the scale of the WJB sub-basin from 2007 to 2010 in summer (Supplementary Figure S2).
TABLE 1. Basic information on the TIGGE datasets used in this study.
2.3 Method Description
2.3.1 Useroriented Forecast System Framework
The general conceptual framework of the UOFS is shown in Figure 2. In this study, the UOFS has five major components: the user-end information module; the meteorological prediction module; the professional module; the forecast target; and the user-oriented assessment module. There are two components in which specific users can give real-time feedback to forecasters, resulting in a forecast system with real-time updated UOI.

FIGURE 2. Schematic framework of the UOFS.
2.3.2 Forecast Target
The forecast target in this study is the TFLP, which is dynamically calculated by the UOFS. Because of its great indicating significance, the TFLP makes great sense to flood prevention managers as well as subsequent decision-makers and has widely been used in operational flood warnings (Zhang et al., 2020; Filho et al., 2021). Generally, the process of flood is highly nonlinear and influenced by numerous factors (the weather, topography, land-use conditions, etc.). As the dominant factor in summertime flashflood, precipitation should be paid most attention in weather and hydrological forecasts. In operational flood prevention, managers are concerned not only with the typical precipitation forecast from meteorological services but also with the possibility of precipitation that can lead to a flood event. Finally, the TFLP can provide the probability of flood hazard assessment information by combining ensemble precipitation forecast products derived from the TIGGE dataset.
In this study, the TFLP is not traditionally defined by the statistical method based on historical data, but combined with the real hydrological components derived from the real-time updated UOI and hydrological model. Details of the TFLP calculation scheme are listed in section 2.3.5.
2.3.3 Hydrological Model
We used a semi-distributed hydrological model in this study that was developed based on two classical hydrological models (the Xin’anjiang model and TOPMODEL) by optimizing the formulation of the soil moisture storage capacity curve. This hydrological model has been well calibrated in basins throughout China with different climates and has been shown to perform well in both offline and coupled online simulations. A detailed description of the model and its numerical results can be found in previous publications (Xu et al., 2012b; Zheng et al., 2012) and supplementary file.
2.3.4 User-Oriented Information
Because the water level at WJB is a key flood warning indicator, in this study, the real-time daily monitored water level at GMT + 8 in the Huai River channel was chosen as the UOI in the UOFS. As a key flood indicator for the entire basin, the water level is highly correlated with the streamflow, which can be directly simulated by the hydrological model. According to the Meteorological Center of the Huaihe River Basin, the warning water level at the WJB station is 27.5 m, and there will be a flood in the WJB sub-basin if the water level exceeds this warning value.
2.3.5 Experimental Design
In this study, we used the hydrological model with an inverse simulation to calculate the minimum quantity of precipitation to cause a flood event. This critical precipitation amount is the TFLP, and any tiny increase in the TFLP will bring a threat to the reservoir and downstream area. The TFLP can be divided into three components—evapotranspiration (ET), change in soil water content (SMC), and runoff (R):
Here, the ET was calculated by the Penman Formula, and the SMC was calculated by subtracting the soil water deficit of the previous time from the current time through the hydrological model. The R was calculated by the “water level–streamflow” regression equation based on the gap between the real-time monitored water level (UOI) and the warning water level. Thus, in this study, the TFLP is dynamically linked with the UOI and would update every time step during the simulation process of UOFS.
Before the hydrological simulation started, the hydrological model was calibrated based on the observed daily precipitation, temperature, and streamflow. A random number algorithm was used in the calibration, and the target function was the Nash–Sutcliffe efficiency coefficient (NSE), and we also evaluated the calibrated results by the Pearson’s correlation coefficient (Pearson’s r), the Spearman’s correlation coefficient (rho), and the root mean square error (RMSE).
After completing the TFLP calculation, the flood hazard in the next 24 h can be derived from the TIGGE precipitation forecast products as follows:
where “Exceeded Members” denotes the number of TIGGE members whose precipitation forecast exceeds the TFLP, and “Total Members” refers to the total 162 TIGGE members used in this study.
3 Results
3.1 Model Calibration and Validation
Figure 3 shows the observed and calibrated daily streamflow in the WJB sub-basin from June to September 2008. This physics-based hydrological model has seven parameters (Xu et al., 2012a, b). After calibration, Figure 3 shows a good agreement between the calibrated streamflow and the observed streamflow of the WJB station during the flood season in 2008. The relative errors of the three flood peaks were generally within 15%, and the NSE was as high as 0.91. This indicates that the simulated streamflow was basically identical to the observational series, with a Pearson’s r of 0.97, a rho of 0.88, and a RMSE of 190.67 m3/ s. Thus, we were able to obtain reasonable model parameters of the WJB sub-basin for further simulation in this study. In the model validation based upon the TIGGE 24-h ensemble precipitation forecast, 78 members got reasonable streamflow simulation with NSE over 0.5 (Supplementary Figure S3). The grand ensemble streamflow can generally capture the main flood peaks in the study period with lower peak values, and the uncertainty interval can cover the observed flood peaks (Supplementary Figure S4). This can provide useful information to the flood prediction and risk assessment.
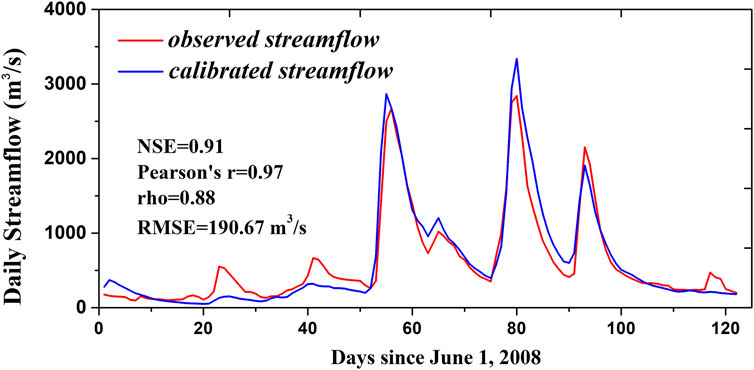
FIGURE 3. Comparison of the observed and calibrated streamflow in the WJB sub-basin from June to September 2008.
3.2 Water Level–Streamflow Relationship
The water level in the channel and the streamflow are two important and highly correlated variables in both hydrological research and operations. In the present case, there was a significant correlation between the daily water level and streamflow (Figure 4A), with the Pearson’s r and rho being 0.95 and 0.98 at the significance level of p = 0.01, respectively.
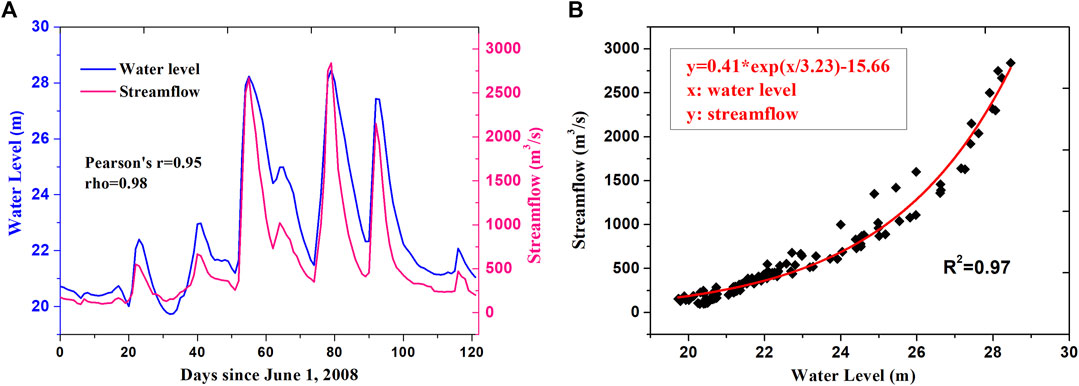
FIGURE 4. Observed daily water level and streamflow (A) and the exponential fitting between water level and streamflow (B) in the flood season of 2008 in the WJB sub-basin.
Based on the significant correlation between the monitored water level and the observed streamflow at the WJB hydrological station, the water level–streamflow regression equation in the WJB sub-basin could be generated through exponential fitting with the ordinary least-square method (Figure 4B), wherein the R2 was 0.97. The regression equation can be written as
where x is the water level and y is the river streamflow.
3.3 TFLP
After generating the UOFS, we applied it to a case study in the WJB sub-basin from June to September 2008. First, we collected the real-time monitored water level at 08:00 GMT+8 on the daily time scale as the UOI to obtain the gap between the monitored and warning water level. Then, the runoff component of TFLP R in Eq. 1 could be calculated through the water level gap based on Eq. 3. After simulating the SMC and ET via hydrological simulation, the TFLP during the study period in the WJB sub-basin could be calculated by Eq. 1 (Figure 5).
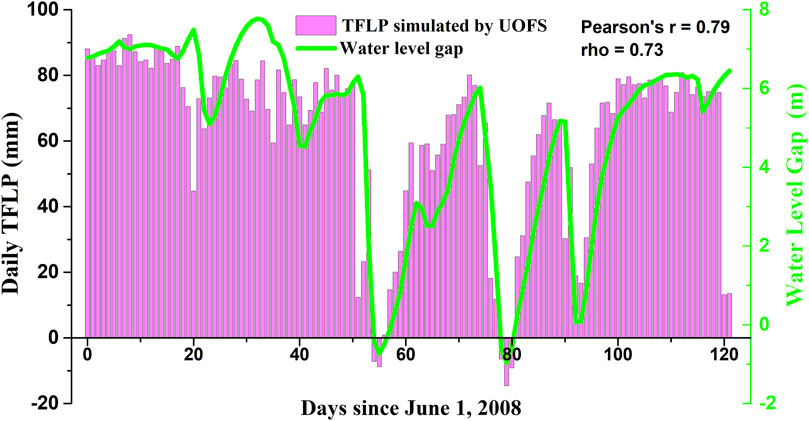
FIGURE 5. Simulated daily TFLP and monitored water level gap in the WJB sub-basin during June to September 2008.
Figure 5 shows the daily simulated TFLP and monitored water level gap in the WJB sub-basin. We can see that the temporal evolution of the two variables agrees well with each other with significant correlation (Pearson’s r = 0.79 and rho = 0.73 at 0.01 significance level). The smaller the water level gap, the closer the monitored water level to the warning value, which leads to a lower TFLP and greater possibility of flooding. When the TFLP is close to zero, the current water level is high, and the previous water storage is large enough to cause serious floods if there is even only a slight amount of additional precipitation. A negative TFLP corresponds to a negative water level gap, which means that the monitored water level has already exceeded the warning value (27.5 m in this study), and a flood has occurred already.
In the flood season of 2008 in the WJB sub-basin, there were three major flood events in July, August, and September, respectively (Figure 3). The three flood peaks also matched the lowest TFLP and water level gap well with a certain time lag, and the largest flood event in August is clearly reflected by the lowest TFLP in Figure 5. This means that the TFLP has strong significance of instructions and warnings of flood events. In other words, the TFLP itself can be regarded as the probability and hazard of the occurrence of future flood.
3.4 Flood Hazard Evaluation
Based on the calculated daily TFLP, we used the TIGGE 24-h-lead precipitation forecast products to evaluate the flood hazard in the WJB sub-basin. Time series of the calculated flood hazard are shown in Figure 6 (the purple histogram), together with the observed streamflow. Among the precipitation forecast products of the 162 members from the TIGGE datasets, we mainly focused on those members whose precipitation amount exceeded the TFLP on the forecast day. According to Eq. 2, as the extent of the precipitation forecast, the flood risk can effectively and timely predict the occurrence of the three major flood events in this study. As shown in Figure 6, before or on the day of the flood, the predicted flood hazard for several consecutive days exceeded 80%, or even reached 100%, especially during the flood events in July and August. These results also serve as a robust validation of the suggestion that most TIGGE forecast members have a reliable precipitation forecast ability in the WJB sub-basin.
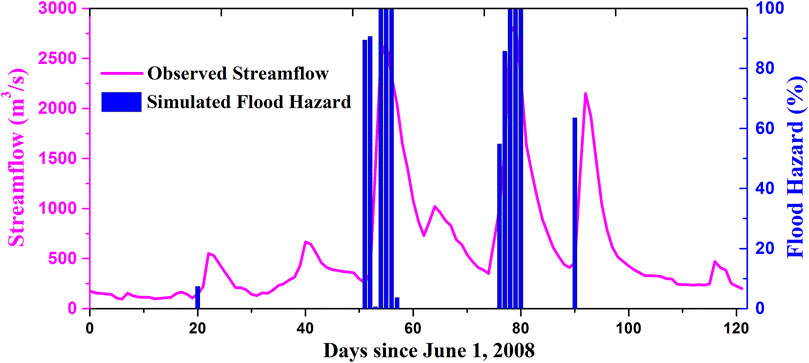
FIGURE 6. Predicted flood hazard based on TFLP and TIGGE products in the WJB sub-basin during the study period.
To further explore the flood hazard information comprehensively, we integrated the extreme precipitation information predicted by the TIGGE member with the largest precipitation amount on the forecast day with the flood hazard evaluated above and generated a 3D diagram (Figure 7). In addition to the calculated flood hazard information, we added the extreme precipitation forecast on the vertical z-axis. Each point indicates the flood hazard and extreme precipitation on a particular day. In operational flood hazard assessment and management, the points in the red rectangle should most likely correspond to high-hazard and high-intensity flood disasters, which requires the most attention when generating and issuing flood warnings.
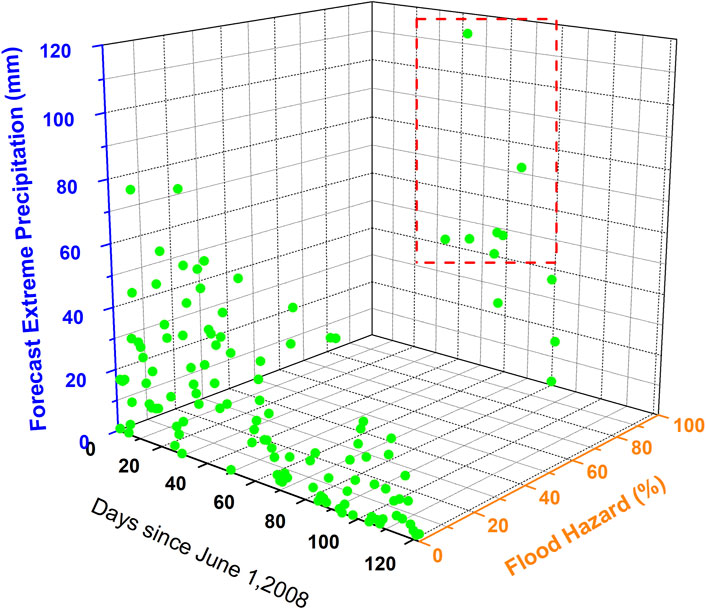
FIGURE 7. Combination of the flood hazard and extreme precipitation information (the points in the red rectangle indicate the days with high precipitation amount and flood hazard).
4 Discussion
By introducing the real-time monitored water level as UOI, we took the flood season of 2008 in the WJB sub-basin as a case study, combined with the ensemble precipitation forecast products, to preliminarily verify the feasibility and applicability of the established UOFS in operational flood warning through the key variable of TFLP. The results are encouraging with good application and promotion prospects.
Different from the traditional flood warning which mainly focused on the streamflow process and flood peak prediction, this study connects the forecast system and hydrological users by coupling the UOI to the UOFS and finds an efficient indicator for early flood warning. As the main driver of summer flood in the Huaihe River Basin, the precipitation can be closely integrated with the new indicator TFLP. At the same time, the real-time status at the hydrological user end is effectively considered and updated in the UOFS. Thus, the occurrence of future flood could be reflected by the TFLP value which negatively correlated with streamflow. Moreover, the flood hazard can be obtained by combining the TFLP with the ensemble precipitation products. Users can make further decisions of response measurement for flood prevention based on the information of flood occurrence probability from the calculated flood hazard. The results of this case study have shown us the good agreement between the warning information and real flood processes. Compared with the traditional quantitative precipitation and streamflow prediction, this probabilistic early flood warning framework can provide more useful and targeted information for specific users.
However, this preliminary investigation still has some limitation. For example, three small flood peaks at the 20th, 40th, and 120th days of the study period were missed by the UOFS. We considered the following three aspects. First, there are biases in the physical processes and parameters of the hydrological model in comparison with the real hydrological processes, as already reflected in the model calibration result in Figure 3. Second, TIGGE products also have a bias in the forecast of precipitation leading to minor flood peaks. Finally, several reservoirs, dams, and flood retention zones (e.g., Mengwa flood retention zone: 181 km2 with a design capacity of 750 million m3 and the design maximum discharge up to 1,626 m3/ s) in the basin affect small flood peaks by regulation and storage processes, which are not effectively considered in the current version of UOFS.
Moreover, the historical hydrological observed data (e.g., streamflow, water level, groundwater table depth) are very difficult to obtain. For the WJB station, the lack of historical water-level monitoring data is serious, thus making limitation for in-depth research. The observed water-level and streamflow data for the summer of 2008 are the most complete quarterly we have now; this is why we chose this season as the study period. One seasonal case is not sufficient for testing the performance of the UOFS. The “water level–streamflow” relationship differs in different regions and even in different years in the same basin, and the parameters of hydrological model also need to be calibrated in different basins. Nevertheless, the calibrated UOFS in this study should be applicable to other sub-basins in the Huaihe River Basin or with similar climatic and hydrological conditions by updating the “water level–streamflow” relationship.
According to the limited simulation ability of the hydrological model for semiarid regions, it is difficult to apply this UOFS to the transition zones. We assume that the hydrological model can reproduce the true flood process at the daily scale in WJB sub-basin (Supplementary Figures S3–S4), and the optimized parameters can reflect the spatial characteristics of the WJB sub-basin in the study case based on the consistency of calibrated streamflow results. Generally, the model performance and parameter uncertainties would be larger in the transition zones. In the next step, as the compilation of the hydrological model and data quality are improved rapidly in recent years, the verification and application of the UOFS could be carried out on long periods and large-scale basins in different climatic zones, in order to develop its potential of applicability.
5 Conclusions and Summary
To improve the hydrometeorological forecast for specific users and make full use of the available forecast information, this study developed a UOFS based upon a hydrological model with its inverse simulation module and incorporated real-time daily monitored water level data as the UOI. Then, the UOFS was used to predict the TFLP to assess the flood hazard by combining the 24-h meteorological forecast products from TIGGE datasets. We took the flood season in 2008 in the WJB sub-basin as a case study for applying the UOFS in an operational flood warning setting. The conclusions can be summarized as follows:
1) The real-time monitored water level was effective as the UOI incorporated into the UOFS in this study. Based on an inverse hydrological simulation and the real-time updated UOI, the UOFS was able to forecast the TFLP as a dynamical target during the study period. The TFLP corresponded well with the water level gap between the monitored and warning values and made great sense for assessment of the flood hazard. From a specific user’s perspective, the TFLP can be used as an important basis for detecting the flooding threat caused by additional precipitation.
2) The flood hazard calculated based on the TFLP and 24-h TIGGE forecast products could quantify the possibility of flooding in the next 24 h in the WJB basin. The results gave timely and accurate early warning information of the three main flood events during the summer of 2008, which showed reliable applicability and good prospect of the UOFS. Taking the forecasted extreme precipitation into consideration, the UOFS was able to provide more detailed and comprehensive flood hazard information. The feedbacks of the UOI to the forecast system provides an effective way to produce high-quality and practical forecast products, reduces the uncertainty brought in by meteorological forecast, and helps toward flood prevention decision-making throughout the summer flood season.
The advantages of the UOFS in an operational early warning system stretch far beyond what we have seen just in this study; i.e., the system is not limited to satisfying specific users’ need. For hydrological modeling and forecast, an accurate UOI can reduce the uncertainties involved in routine parameter calibration. The flood hazard and risk can also be evaluated as detailed spatiotemporal images if we construct a fully distributed UOFS rather than carrying out a hydrological simulation as a lumped model scheme. The UOI can also help improve the hydrological simulation via optimizing the initial model conditions. For early flood warnings, the previous precipitation and soil water content are extremely important factors but are generally difficult for a physically based model to parameterization. However, these factors can be easily reflected and obtained from the UOI, which has great significance for model optimization and for reducing uncertainty.
Although the UOFS established in this study exhibits reliable applicability and good prospect in the study case, the result for only one flood season is insufficient for general conclusions. For application in other basins, the accurate model parameters, informative observational data, and effective UOI are extremely important. Thus, it will be beneficial to continue to validate and optimize the UOFS framework, improve the physical modules, and make the interactive scheme of the UOI and UOFS effective to different users in order to improve forecasts from multiple perspectives and ultimately toward practical applications in hydrometeorology and beyond.
Data Availability Statement
The original contributions presented in the study are included in the article/Supplementary Material; further inquiries can be directed to the corresponding authors.
Author Contributions
ZZ, ZY, and JC conceived and designed this study; ZZ wrote the main program code of the hydrological model; JH and JX processed relevant datasets, conducted the simulations, and performed the analyses; XZ and SC provided the user-end information, the observed streamflow, and water level, respectively; XL gave suggestions and comments on flood hazard assessment; and ZZ and ZY wrote the paper.
Funding
This work was jointly supported by the National Key R and D Program of China (2018YFA0606002), the Natural Science Foundation of China (42175178 and 41875131), and the China Meteorological Administration Special Public Welfare Research Fund (GYHY200906007).
Conflict of Interest
The authors declare that the research was conducted in the absence of any commercial or financial relationships that could be construed as a potential conflict of interest.
Publisher’s Note
All claims expressed in this article are solely those of the authors and do not necessarily represent those of their affiliated organizations, or those of the publisher, the editors, and the reviewers. Any product that may be evaluated in this article, or claim that may be made by its manufacturer, is not guaranteed or endorsed by the publisher.
Acknowledgments
The authors would like to thank the TIGGE data archives for providing the 24-h forecast products from the CMA, ECMWF, NCEP, JMA, and UKMO. The observational streamflow and water level data were collected from the Hydrological Bureau of Anhui Province and Institute of Water Resources and Hydropower Research. The authors also thank the reviewers for their thoughtful and detailed comments, which helped to improve the manuscript a lot.
Supplementary Material
The Supplementary Material for this article can be found online at: https://www.frontiersin.org/articles/10.3389/feart.2021.703024/full#supplementary-material
References
Adams, T., and Pagano, T. C. (2016). “Flood Forecasting: A Global Perspective,” in Flood Forecasting (Boston, xxiii-xlix: Academic Press). doi:10.1016/b978-0-12-801884-2.09999-0
Aminyavari, S., Saghafian, B., and Delavar, M. (2018). Evaluation of TIGGE Ensemble Forecasts of Precipitation in Distinct Climate Regions in Iran. Adv. Atmos. Sci. 35 (4), 457–468. doi:10.1007/s00376-017-7082-6
Argyle, E., Gourley, J., Flamig, Z., Hansen, T., and Manross, K. (2017). Toward a User-Centered Design of a Weather Forecasting Decision-Support Tool. Bulletin of the American Meteorological Society. BAMS-D-16-0031.1.
Bao, H., and Zhao, L. (2012b). Development and Application of an Atmospheric-Hydrologic-Hydraulic Flood Forecasting Model Driven by TIGGE Ensemble Forecasts. Acta Meteorol. Sin 26, 93–102. doi:10.1007/s13351-012-0109-0
Bao, H., and Zhao, L. (2012a). Flood Forecast of Huaihe River Based on TIGGE Ensemble Predictions. J. Hydraulic Eng. (in Chinese) 43 (2), 216–224. doi:10.13243/j.cnki.slxb.2012.02.001
Bett, P. E., Martin, N., Scaife, A. A., Dunstone, N., Martin, G. M., Golding, N., et al. (2020). Seasonal Rainfall Forecasts for the Yangtze River Basin of China in Summer 2019 from an Improved Climate Service. J. Meteorol. Res. 34, 904–916. doi:10.1007/s13351-020-0049-z
Bougeault, P., Toth, Z., Bishop, C., Brown, B., Burridge, D., Chen, D. H., et al. (2010). The Thorpex Interactive Grand Global Ensemble. Bull. Amer. Meteorol. Soc. 91 (8), 1059–1072. doi:10.1175/2010bams2853.1
Casati, B., Wilson, L. J., Stephenson, D. B., Nurmi, P., Ghelli, A., Pocernich, M., et al. (2010). Forecast Verification: Current Status and Future Directions. Meteorol. Appl. 15 (1), 3–18. doi:10.1002/met.52
Cloke, H. L., and Pappenberger, F. (2009). Ensemble Flood Forecasting: A Review. J. Hydrol. 375 (3-4), 613–626. doi:10.1016/j.jhydrol.2009.06.005
Demuth, J. L., Gruntfest, E., Morss, R. E., Drobot, S., and Lazo, J. K. (2007). WAS*IS: Building a Community for Integrating Meteorology and Social Science. Bull. Amer. Meteorol. Soc. 88, 1729–1738. doi:10.1175/bams-88-11-1729
Ferretti, R., Lombardi, A., Tomassetti, B., Sangelantoni, L., Colaiuda, V., Mazzarella, V., et al. (2020). A Meteorological-Hydrological Regional Ensemble Forecast for an Early-Warning System over Small Apennine Catchments in Central Italy. Hydrol. Earth Syst. Sci. 24 (6), 3135–3156. doi:10.5194/hess-24-3135-2020
Golding, N., Hewitt, C., Zhang, P., Bett, P., Fang, X., Hu, H., et al. (2017). Improving User Engagement and Uptake of Climate Services in China. Clim. Serv. 5, 39–45. doi:10.1016/j.cliser.2017.03.004
Han, J. R. (2010). User-oriented Interactive Forecasting System. Ph. D. dissertation. Beijing, China: Institute of Atmospheric Physics, Chinese Academy of Sciences. (in Chinese).
Han, J., Ye, Q., Yan, Z., Jiao, M., and Xia, J. (2010). Conceptual Study on Incorporating User Information into Forecasting Systems. Front. Environ. Sci. Eng. China 5 (4), 533–542. doi:10.1007/s11783-010-0246-6
He, Y., Wetterhall, F., Bao, H., Cloke, H., Li, Z., Pappenberger, F., et al. (2010). Ensemble Forecasting Using TIGGE for the July-September 2008 Floods in the Upper Huai Catchment: a Case Study. Atmosph. Sci. Lett. 11 (2), 132–138. doi:10.1002/asl.270
Jung, T., and Matsueda, M. (2016). Verification of Global Numerical Weather Forecasting Systems in Polar Regions Using TIGGE Data. Q.J.R. Meteorol. Soc. 142 (695), 574–582. doi:10.1002/qj.2437
Karuna Sagar, S., Rajeevan, M., Vijaya Bhaskara Rao, S., and Mitra, A. K. (2017). Prediction Skill of Rainstorm Events over India in the TIGGE Weather Prediction Models. Atmos. Res. 198, 194–204. doi:10.1016/j.atmosres.2017.08.017
Lin, P., Hopper, L. J., Yang, Z.-L., Lenz, M., and Zeitler, J. W. (2018). Insights into Hydrometeorological Factors Constraining Flood Prediction Skill during the May and October 2015 Texas Hill Country Flood Events. J. Hydrometeorology 19, 1339–1361. JHM-D-18-0038.1. doi:10.1175/jhm-d-18-0038.1
Liu, C., Liang, G., Lei, Y., Shunfu, Z., Yanzeng, Z., and Tianyu, S. (2018a). A Review of Advances in China's Flash Flood Early-Warning System. Nat. Hazards 92 (7), 619–634. doi:10.1007/s11069-018-3173-7
Liu, S., Wang, G., and Zhang, L. (2018b). Availability Assessment of TIGGE Precipitation Data in Flood Forecasting for Chaihe River Basin. J. Hydrol. (in Chinese) 38 (5), 17–22.
Liu, Y., Yan, Z., and Feng, J. (2013). Predictability of 6-hour Precipitation in the Yishu River basin Based on TIGGE Data. Chin. J. Atmos. Sci. (in Chinese) 37 (3), 539–551. doi:10.3878/j.issn.1006-9895.2012.11078
Louvet, S., Sultan, B., Janicot, S., Kamsu-Tamo, P. H., and Ndiaye, O. (2016). Evaluation of TIGGE Precipitation Forecasts over West Africa at Intraseasonal Timescale. Clim. Dyn. 47 (1-2), 1–17. doi:10.1007/s00382-015-2820-x
Morgan, M. C., Houghton, D. D., and Keller, L. M. (2007). The Future of Medium-Extended-Range Weather Prediction: Challenges and a Vision. Bull. Amer. Meteorol. Soc. 88 (5), 631–634. doi:10.1175/bams-88-5-631
Morss, R. E., Wilhelmi, O. V., Downton, M. W., and Gruntfest, E. (2005). Flood Risk, Uncertainty, and Scientific Information for Decision Making: Lessons from an Interdisciplinary Project. Bull. Amer. Meteorol. Soc. 86 (11), 1593–1602. doi:10.1175/bams-86-11-1593
Murphy, A. H. (1993). What Is a Good Forecast? an Essay on the Nature of Goodness in Weather Forecasting. Wea. Forecast. 8, 281–293. doi:10.1175/1520-0434(1993)008<0281:wiagfa>2.0.co;2
Pappenberger, F., Bartholmes, J., Thielen, J., Cloke, H. L., Buizza, R., and de Roo, A. (2008). New Dimensions in Early Flood Warning across the globe Using Grand-Ensemble Weather Predictions. Geophys. Res. Lett. 35 (3), 1956–1964. doi:10.1029/2008gl033837
Pielke, R. A. (1999). Who Decides? Forecasts and Responsibilities in the 1997 Red River Flood. Appl. Behav. Sci. Rev. 7, 83–101. doi:10.1016/s1068-8595(00)80012-4
Qi, L., Yu, H., and Chen, P. (2014). Selective Ensemble-Mean Technique for Tropical Cyclone Track Forecast by Using Ensemble Prediction Systems. Q.J.R. Meteorol. Soc. 140, 805–813. doi:10.1002/qj.2196
Rabier, F., Gauthier, P., Cardinali, C., Langland, R., Tsyrulnikov, M., Lorenc, A., et al. (2008). An Update on THORPEX-Related Research in Data Assimilation and Observing Strategies. Nonlin. Process. Geophys. 15, 81–94. doi:10.5194/npg-15-81-2008
Ramos Filho, G. M., Coelho, V. H. R., Freitas., E. d. S., Xuan, Y., and Almeida, C. d. N. (2021). An Improved Rainfall-Threshold Approach for Robust Prediction and Warning of Flood and Flash Flood Hazards. Nat. Hazards 105, 2409–2429. doi:10.1007/s11069-020-04405-x
Rogelis, M. C., and Werner, M. (2018). Streamflow Forecasts from WRF Precipitation for Flood Early Warning in Mountain Tropical Areas. Hydrol. Earth Syst. Sci. 22 (1), 853–870. doi:10.5194/hess-22-853-2018
Shi, H., Li, T., Liu, R., Chen, J., Li, J., Zhang, A., et al. (2015). A Service-Oriented Architecture for Ensemble Flood Forecast from Numerical Weather Prediction. J. Hydrol. 527, 933–942. doi:10.1016/j.jhydrol.2015.05.056
Stewart, T. R., Pielke, R., and Nath, R. (2003). Understanding User Decision Making and the Value of Improved Precipitation Forecasts-Lessons from a Case Study. Bull. Am. Meteorol. Soc. 85 (2), 1484–1487.
Swinbank, R., Kyouda, M., Buchanan, P., Froude, L., Hamill, T. M., Hewson, T. D., et al. (2016). The TIGGE Project and its Achievements. Bull. Am. Meteorol. Soc. 97 (1), 49–67. doi:10.1175/bams-d-13-00191.1
Thorpe, A. J. (2004). Weather Forecasting: A Centenary Perspective. wea 59 (12), 332–335. doi:10.1256/wea.87.04
Weerts, A. H., Seo, D.-J., Werner, M., and Schaake, J. (2014). “Operational Hydrologic Ensemble Forecasting,” in Book: Applied Uncertainty Analysis for Flood Risk Management (London: Imperial College Press), 387–406. doi:10.1142/9781848162716_0015
Xu, J., Zhang, W., Zheng, Z., Chen, J., and Jiao, M. (2012b). Establishment of a Hybrid Rainfall-Runoff Model for Use in the Noah LSM. Acta Meteorol. Sin 26 (1), 85–92. doi:10.1007/s13351-012-0108-1
Xu, J., Zhang, W., Zheng, Z., Jiao, M., and Chen, J. (2012a). Early Flood Warning for Linyi Watershed by the GRAPES/XXT Model Using TIGGE Data. Acta Meteorol. Sin 26 (1), 103–111. doi:10.1007/s13351-012-0110-7
Yan, Z., Han, J., Jiao, M., Chen, J., Ye, Q., Zhao, L., et al. (2012). Formation of an Interactive User-Oriented Forecasting System: Experience from Hydrological Application in Linyi, Eastern China. Acta Meteorol. Sin 26 (1), 13–25. doi:10.1007/s13351-012-0102-7
Ye, A., Deng, X., Ma, F., Duan, Q., Zhou, Z., and Du, C. (2017). Integrating Weather and Climate Predictions for Seamless Hydrologic Ensemble Forecasting: A Case Study in the Yalong River basin. J. Hydrol. 547, 196–207. doi:10.1016/j.jhydrol.2017.01.053
Ye, D., Yan, Z., Dai, X., Qian, W., and Ye, Q. (2006). A Discussion of Future System of Weather and Climate Prediction. Meteorol. Monthly (in Chinese) 32 (4), 3–8.
Yuan, X., Liang, X.-Z., and Wood, E. F. (2012). WRF Ensemble Downscaling Seasonal Forecasts of China winter Precipitation during 1982-2008. Clim. Dyn. 39, 2041–2058. doi:10.1007/s00382-011-1241-8
Yuan, X., Wood, E. F., Luo, L., and Pan, M. (2011). A First Look at Climate Forecast System Version 2 (CFSv2) for Hydrological Seasonal Prediction. Geophys. Res. Lett. 38 (13), a–n. doi:10.1029/2011GL047792
Zhang, L. C., Yu., X. J., and Shao, W. L. (2020). Comparative Analysis of Xinjiang Mountain Flooding Simulation and Threshold Based on Different Data. Plateau Meteorology (in Chinese) 39 (1), 80–89. doi:10.7522/j.issn.1000-0534.2019.00008
Zhang, S. (2002). Study on the Design and Construction of National Flood Forecasting System (NFFS). Hydrology (in Chinese) 22 (1), 32–34.
Zhao, J., Xu, J., Xie, X., and Lu, H. (2016). Drought Monitoring Based on TIGGE and Distributed Hydrological Model in Huaihe River Basin, China. Sci. Total Environ. 553, 358–365. doi:10.1016/j.scitotenv.2016.02.115
Zheng, F., and Zhu, J. (2016). Improved Ensemble-Mean Forecasting of ENSO Events by a Zero-Mean Stochastic Error Model of an Intermediate Coupled Model. Clim. Dyn. 47 (12), 1–15. doi:10.1007/s00382-016-3048-0
Keywords: interactive forecast, user-oriented forecast system, threshold of flood-leading precipitation, user-oriented information, TIGGE, flood hazard
Citation: Zheng Z, Yan Z, Chen J, Han J, Xia J, Zhang X, Cai S and Liu X (2021) Evolving Threshold of Flood-Leading Precipitation in a User-Oriented Forecast System Based on the TIGGE Dataset. Front. Earth Sci. 9:703024. doi: 10.3389/feart.2021.703024
Received: 04 May 2021; Accepted: 24 November 2021;
Published: 22 December 2021.
Edited by:
Jorge Eduardo Teixeira Leandro, University of Siegen, GermanyReviewed by:
Ahmed Kenawy, Mansoura University, EgyptPunit Kumar Bhola, AIR Worldwide, United States
Copyright © 2021 Zheng, Yan, Chen, Han, Xia, Zhang, Cai and Liu. This is an open-access article distributed under the terms of the Creative Commons Attribution License (CC BY). The use, distribution or reproduction in other forums is permitted, provided the original author(s) and the copyright owner(s) are credited and that the original publication in this journal is cited, in accordance with accepted academic practice. No use, distribution or reproduction is permitted which does not comply with these terms.
*Correspondence: Ziyan Zheng, emhlbmd6eUB0ZWEuYWMuY24=; Jing Chen, Y2hlbmpAY21hLmdvdi5jbg==