 Mathias Ulrich1*
 Loeka L. Jongejans2,3
 Guido Grosse2,3
 Birgit Schneider4
 Thomas Opel5
 Sebastian Wetterich2Alexander N. Fedorov6,7
 Lutz Schirrmeister2Torben Windirsch2,3Julia Wiedmann2
 Jens Strauss2
- 1Institute for Geography, Geoinformatics and Remote Sensing, Leipzig University, Leipzig, Germany
- 2Permafrost Research Unit, Alfred Wegener Institute Helmholtz Centre for Polar and Marine Research, Potsdam, Germany
- 3Institute of Geosciences, University of Potsdam, Potsdam, Germany
- 4Institute for Geography, Physical Geography, Leipzig University, Leipzig, Germany
- 5Polar Terrestrial Environmental Systems, Alfred Wegener Institute Helmholtz Centre for Polar and Marine Research, Potsdam, Germany
- 6Laboratory of General Geocryology, Melnikov Permafrost Institute, Siberian Branch Russian Academy of Sciences, Yakutsk, Russia
- 7BEST International Centre, North-Eastern Federal University, Yakutsk, Russia
Ice- and organic-rich deposits of late Pleistocene age, known as Yedoma Ice Complex (IC), are widespread across large permafrost regions in Northeast Siberia. To reconstruct Yedoma IC formation in Central Yakutia, we analyzed the geochemistry, sedimentology, and stratigraphy of thawed and frozen deposits below two thermokarst lakes in different evolutionary stages (a mature alas lake and a initial Yedoma lake) from the Yukechi site in the Lena-Aldan interfluve. We focused on inorganic geochemical characteristics and mineral weathering in two ∼17 m long sediment cores to trace syngenetic permafrost aggradation and degradation over time. Geochemical properties, element ratios, and specific weathering indices reflect varying sedimentation processes and seasonal thaw depths under variable environmental conditions. Deeper thaw during the interstadial Marine Isotope Stage (MIS) 3 enabled increasing mineral weathering and initial thermokarst processes. Sedimentological proxies reflect high transport energy and short transport paths and mainly terrestrial sediment supply. The Yedoma formation resulted from fluvial, alluvial and aeolian processes. Low mean TOC contents in both cores contrast with Yedoma deposits elsewhere. Likely, this is a result of the very low organic matter content of the source material of the Yukechi Yedoma. Pronounced cryostructures and strongly depleted pore water stable isotopes show a perennially frozen state and preserved organic matter for the lower part of the Yedoma lake core, while changing permafrost conditions, conditions promoting weathering, and strong organic matter decomposition are suggested by our proxies for its middle and upper parts. For the alas lake core, less depleted water stable isotopes reflect the influence of recent precipitation, i.e. the infiltration of rain and lake water into the unfrozen ground. The FENG, MIA(R), and ICV weathering indices have proven to be promising proxies for the identification of conditions that promote mineral weathering to different degrees in the stratigraphy of the thawed and frozen Yedoma deposits, for which we assume a rather homogeneous chemical composition of the parent material. Our study highlights that the understanding of environmental conditions during Yedoma formation and degradation processes by specific geochemical proxies is crucial for assessing the potential decomposition and preservation of the frozen and unfrozen Yedoma inventories.
Introduction
Permafrost is a key element of the cryosphere and stores large amounts of organic carbon (OC) (Hugelius et al., 2014). The Arctic amplification of global warming affects permafrost regions by accelerating permafrost warming and thaw (Biskaborn et al., 2019). When frozen ground thaws, OC, nutrients and other formerly frozen chemical compounds will be reintroduced into active (bio)geochemical cycles (Opfergelt, 2020). Soil microbes could use these inventories to release greenhouse gases (GHG), which will accelerate climate warming and is known as the permafrost-carbon feedback (Schuur et al., 2015). It was shown that extensive remobilization of organic matter (OM) stored in permafrost occurred during the last major warming period at the Pleistocene-Holocene transition (Martens et al., 2020).
Permafrost degrades in different ways, depending on climate and permafrost conditions such as ground-ice content and ground temperature. The formation and development of thermokarst lakes is the most abundant form of permafrost degradation (Grosse et al., 2013). Today, millions of thermokarst lakes in different sizes and remnant lake basins can be found in the northern lowland permafrost regions of Canada, Alaska, Scandinavia, and Russia (Nitze et al., 2017; Muster et al., 2019). The two to four times higher heat storage capacity of water (compared to ice and dry ground) usually causes an ongoing increase of lake water volume and depth resulting in mean annual lake bottom temperatures above 0°C at the water-sediment interface (Grosse et al., 2013). This typically results in the formation of a talik, a body of perennially unfrozen ground occurring in a permafrost area. Anaerobic environments at the lake bottom and in the talik sediments beneath the lakes lead to specific sedimentary and geochemical conditions. Related microbial decomposition of OM and methane production contributes substantially to the current atmospheric carbon budget (Heslop et al., 2020). Hence, thermokarst lakes and taliks are important sources for atmospheric GHG, mainly carbon dioxide and methane (Walter-Anthony et al., 2018; Dean et al., 2020).
Widespread thermokarst basin (alas) formation in Central Yakutia during the late Pleistocene-Holocene transition and the Holocene Thermal Maximum (HTM) led to a lake-rich thermokarst landscape (Soloviev, 1973; Ulrich et al., 2017a; Ulrich et al., 2019). After thermokarst lake drainage, flat basins with steep-sided slopes and treeless grass-dominated meadows remained, which often contain shallow remnant thermokarst lakes. These alas landscapes have mainly developed in ice-rich and silt-dominated syngenetic late Pleistocene Yedoma Ice Complex (IC) deposits that cover large areas of Siberia, Alaska, and Canada. They can reach 50 m in thickness and usually contain huge ice wedges of several meters in width and height (Ulrich et al., 2014; Strauss et al., 2017). A striking feature of the East Siberian Yedoma IC is the relatively high OC content between 1.2 and 4.8 wt% (Schirrmeister et al., 2011). Strauss et al. (2017) calculated an amount of 398 Gt OC for the total circum-Arctic Yedoma domain (1.4 million km2, including thermokarst lakes and basins). However, recent carbon inventory studies of Central Yakutian Yedoma deposits show significantly lower levels of OC (Ø 0.4–0.7 wt%; Windirsch et al., 2020; Jongejans et al., 2021a).
Simultaneously with the thermokarst-induced degradation of OM, geochemical processes and mineral weathering occur in different intensities and can be assessed relative to the chemical composition of the parent material (Zolkos and Tank, 2020). In cold climates, the physical weathering of clayey, silty and sandy source rocks and deposits determines the grain size of the material that is available for transport from local and regional sources (Schwamborn et al., 2012; Schirrmeister et al., 2020). Chemical weathering changes the mineral composition of the sediments, and thereby influences biogeochemical processes during thaw periods but is usually hampered by the permanent frozen conditions. Mineral weathering could even contribute to the fixation of carbon in the sediment (Zolkos et al., 2018; Zolkos and Tank, 2020). However, the effects of inorganic geochemical processes and mineral weathering during sedimentation, syngenetic permafrost aggradation, and thermokarst processes have been rarely studied so far in permafrost deposits (Lacelle et al., 2008; Kokelj et al., 2013; Zolkos et al., 2018; Zolkos and Tank, 2020) and especially for Yedoma IC deposits data are sparse (Zech et al., 2008). Furthermore, these processes are not yet included in climate prediction models and there are still uncertainties about the extent and impact of permafrost dynamics and degradation (Opfergelt, 2020; Turetsky et al., 2020).
The origin of Yedoma deposits, their degradation, and associated biogeochemical processes can be heterogeneous, but the sediment source is generally seen in the local environment (Schirrmeister et al., 2013; Schirrmeister et al., 2020). A knowledge gap remains how the late Pleistocene to Holocene permafrost landscape as well as related depositional and environmental conditions evolved in Central Yakutia. Furthermore, it is unclear how the various sedimentological and biogeochemical processes during Yedoma IC deposition and transformation as well as the formation of thermokarst lake basins affect the deposition and decomposition of OM. Consequently, it is essential to determine effects of organic and inorganic geochemical processes during permafrost degradation, in order to assess ongoing environmental changes and their potential impact on global climatic trends.
In this study our major aims were 1) to reconstruct the late Pleistocene to Holocene depositional processes in the study area, 2) to define proxies of freeze and thaw conditions throughout sedimentation, syngenetic permafrost aggradation and subsequent degradation, and 3) to characterize inorganic geochemical processes and mineral weathering during Yedoma formation and degradation.
Regional Setting
The study area is located in the continuous permafrost zone, which in large parts of Yakutia is particularly characterized by Yedoma IC deposits (Figure 1A). Permafrost depths can reach several hundred meters here (Czudek and Demek, 1970). The active layer thickness reaches depths of up to 1.0 m below forests and up to 2.0 m in grassland areas (Iijima et al., 2010). The region is a low-relief landscape, characterized by numerous alas basins and thermokarst lakes in different evolutionary stages (Soloviev, 1959; Soloviev, 1973; Pestryakova et al., 2012; Tarasenko, 2013) and showed a remarkable increase in lake area of almost 50% during the last 15 years (Nitze et al., 2017; Ulrich et al., 2017b).
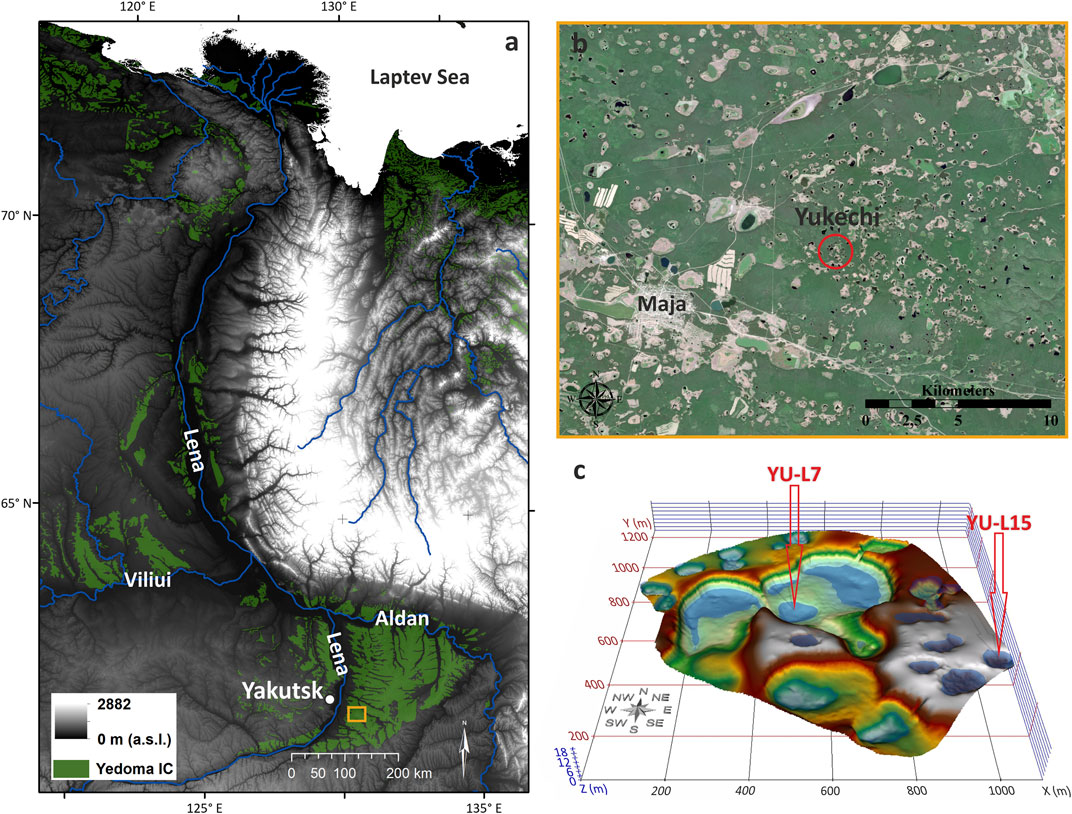
FIGURE 1. Overview of the study area in Central Yakutia, Russia. (A) Location of the study area (orange square) near Yakutsk (Yedoma IC coverage after Strauss et al. (2016), Digital Elevation Model (DEM) generated using data from the ESA DUE Permafrost Project (Santoro and Strozzi, 2012). (B) Close up of the Yukechi study site within the typical Yakutian alas landscape (Sentinel-2 (ESA) 2017–07–29). (C) DEM with drilling locations on the alas lake (YU-L7) and the Yedoma lake (YU-L15). Height differences are obvious from the z-axis (Modified after Ulrich et al., 2017b).
Central Yakutia is characterized by a strong continental climate with low annual precipitation (223 ± 54 mm), high seasonal temperature amplitudes, and a mean annual air temperature of −9.8 ± 1.8°C (based on Yakutsk weather station data for 1910–2014, see Ulrich et al., 2017b). The vegetation is characterized by taiga forest dominated by larch trees with inclusions of pine and birch trees. The alas basins form islands of steppe-like grasslands within the forested Yedoma uplands.
The drilling sites are located in the Lena-Aldan interfluve at approximately 200 m above sea level. Several terraces above the major rivers are differentiated by geomorphology, cryolithology, and sediment genesis (Soloviev, 1959; Soloviev, 1973). The investigated Yukechi alas is located near the small city of Maja, about 50 km southeast of the Yakutian capital Yakutsk on the Abalakh terrace (Figure 1B) and is monitored for several decades by the Melnikov Permafrost Institute in Yakutsk (e.g., Bosikov 1998; Fedorov and Konstantinov, 2009; Fedorov et al., 2014). The Yukechi alas is about 300 by 500 m in size and about 10–15 m deep (Figure 1C). Two larger lakes and one smaller shallow lake exist within the alas (called alas lakes). The area around the alas is characterized by small and young thermokarst lakes on the Yedoma uplands (called Yedoma lakes) that are partly developing in former agricultural areas (Ulrich et al., 2017b).
A mature alas lake within the Yukechi alas (core YU-L7, 61.76397°N, 130.46442°E) and a nearby younger Yedoma lake (core YU-L15, 61.76086°N, 130.47466°E) located about 20 m above the alas ground level were selected as drilling sites. For both lakes, we assume a natural evolution (i.e., no direct anthropogenic interference with lake evolution). Furthermore, we assume a similar parent material for the sediments at the Yukechi study site, although they were altered upon thaw by compaction and degradation/weathering. During field work in March 2015, the alas lake had a diameter of about 100 m and a depth of about 2.3 m. The Yedoma lake was about 80 m in diameter and about 4.4 m deep (Figure 2). The lake ice on both lakes was about 70 cm thick and covered by about 35 cm of snow.
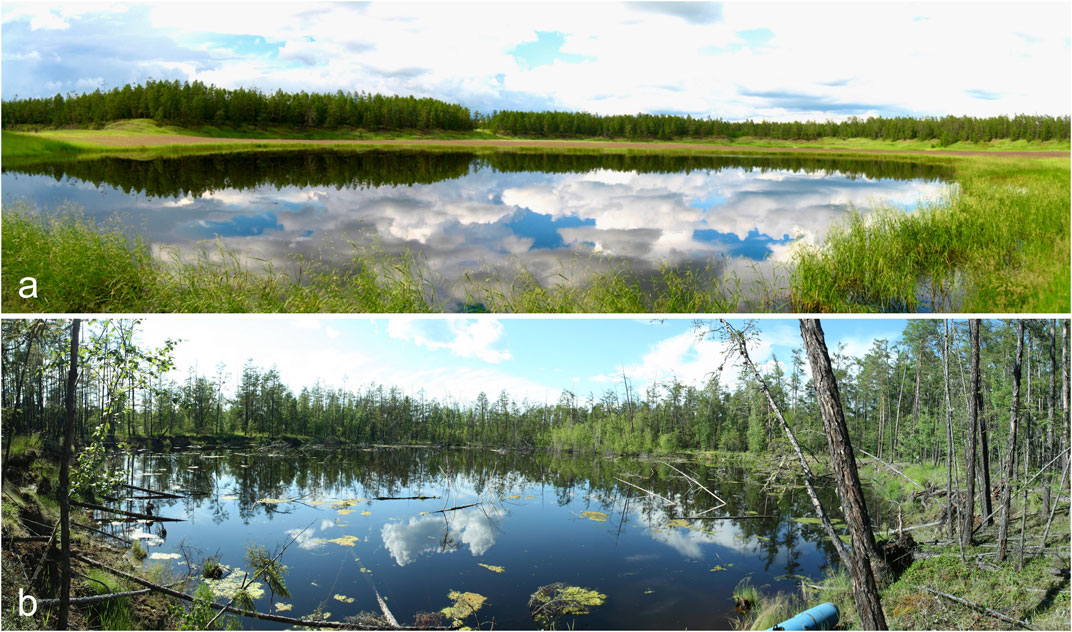
FIGURE 2. Photographs of the drilled lakes at the Yukechi study site during summer with views to Northwest: (A) YU-L7, (B) YU-L15.
Materials and Methods
Drilling and Sampling
The deposits below both lakes were drilled from the lake ice in March 2015 during a joint German-Russian field expedition. The drilling depths reached down to about 20–21 m below the lake-ice surface. We used a URB2-47 drilling rig without a core catching system. Due to partly unfrozen sediment layers, parts of the cores were lost during the drilling process. The retrieved core segments were pushed out with air pressure, described and stored in plastic bags and kept frozen until laboratory analysis. From here on, all core depths are given in centimeters as mean depth of a sampling interval below lake-ice surface (cm bls).
Sample Preparation
The frozen cores were split lengthwise using a band saw and were subsequently subsampled in a freezer room at −5°C. After cleaning, the cores were described visually and photographed (Figure 3). The sampling half was cut into subsamples and divided for further analysis. We did a regular sampling on both cores according to visual stratigraphy. Hence, the alas lake core YU-L7 was sampled in intervals between 20 and 70 cm (n = 19) and the Yedoma lake core YU-L15 at intervals between 10 and 40 cm (n = 49).
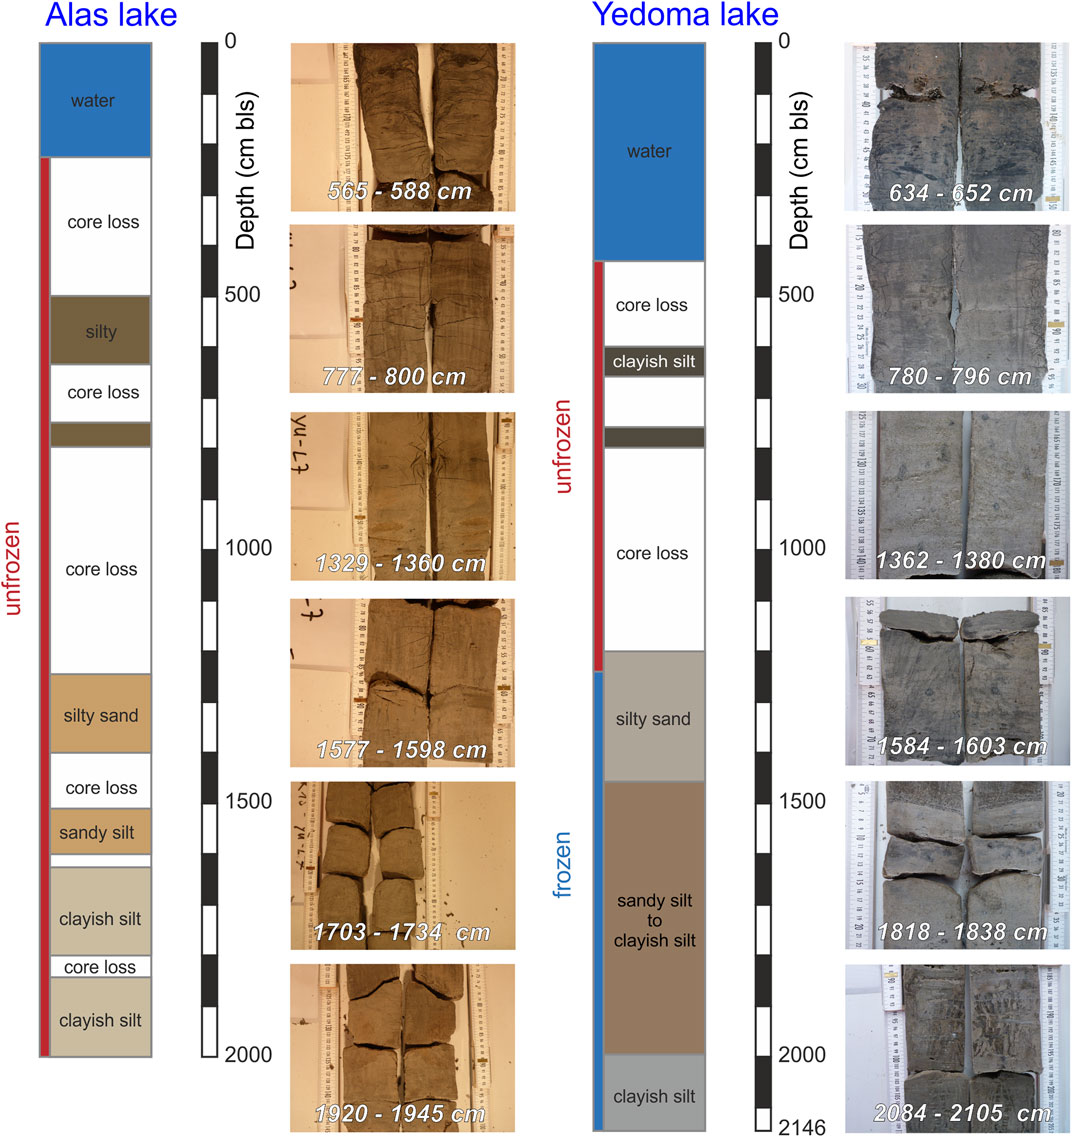
FIGURE 3. Core profiles of the alas lake core YU-L7 and the Yedoma lake core YU-L15 with dominant sediment layers due to color, grain size and cryostructures.
For the biogeochemical and sedimentological analyses, the gravimetric water and/or ice content was determined as the difference between wet mass of a sample (as ice for in situ frozen parts) and the dry sample mass and is expressed in weight percent (wt%). Unless stated otherwise, we will use the term gravimetric water/ice content (GW/IC) onwards, due to changing unfrozen and frozen conditions within the cores.
Radiocarbon Dating
We radiocarbon-dated seven samples from YU-L7 and eight from YU-L15 using Accelerator Mass Spectrometry (AMS) with the Mini Carbon Dating System (MICADAS) at Alfred Wegener Institute Helmholtz Centre for Polar and Marine Research (AWI) Bremerhaven, Germany (Mollenhauer et al., 2021). Macrofossils such as plant and wooden remains (i.e. roots, leaf fragments, twigs, Larix spp. (larch) needles) were picked and dated for nine samples. For the other six samples, bulk sediment was dated. The radiocarbon ages were calibrated using the OxCal4.4 software (Bronk Ramsey, 2009) with the IntCal20 calibration curve after Reimer et al. (2020), and are expressed in calibrated years before present (cal. yrs. BP).
Sedimentology and Biogeochemistry
All subsamples of the YU-L7 alas lake core (n = 19) were analyzed for sedimentology. Of the Yedoma lake core YU-L15, all samples above 1,362 cm and below 2064 cm bls were analyzed but only every second subsample from the middle part (n = 31).
A Bartington Magnetic Susceptibility Meter Model MS2 (Bartington Instruments, United Kingdom) was used to measure the mass-specific magnetic susceptibility (MS). The MS reflects differences in magnetizability of clastic material. Measurements were done at low frequency of 0.465 kHz in an external magnetic field in 10−8 m3/kg.
Grain-size analyses were carried out on organic-free (treated with 35% H2O2) sub-samples using a Malvern Mastersizer 3000 (Malvern Instruments, United Kingdom) with an attached Malvern Hydro LV wet-sample dispersion unit. The proportions of sand, silt and clay fractions are given as sums between 2 mm and 63 µm, 63 and 2 µm and <2 µm, respectively. Grain-size parameters were calculated with the software Gradistat (Version 8.0; Blott and Pye, 2001).
We analyzed the total carbon (TC) content using an Elementar Vario EL III (Elementar Analysensysteme GmbH) (detection limit of 0.05 wt%). Furthermore, total organic carbon (TOC) measurements were performed using the Elementar Vario Max C (detection limit of 0.1 wt%). No external removal of the total inorganic carbon (TIC) is needed for this method. The TIC content was calculated as the difference of TOC and TC. All values of TC, TOC, TIC are calculated in wt% (n = 68).
The stable carbon isotope ratio (δ13C) was determined using a ThermoFisher Scientific Delta-V-Advantage gas mass spectrometer equipped with a FLASH elemental analyzer EA 2000 and a CONFLO IV gas mixing system in the Stable Isotope Laboratory at the AWI Potsdam, Germany. An aliquot per sample of 15 samples per core with TOC values above detection limit were measured. The δ13C measurements have been calibrated by three international reference materials. The results are compared to the common Vienna Pee Dee Belemnite (VPDB) standard and expressed in per mill (‰ vs. VPDB; n = 30; measurement accuracy: equal or smaller than 0.15‰). The δ13C values give information about plant metabolism, as they are generally very similar to those of the former vegetation. We interpret more negative δ13C values as an indication of less-degraded OM, while less negative δ13C values are linked to stronger decomposition processes (Schirrmeister et al., 2011; Strauss et al., 2015).
Pore-Water Hydrochemistry and Stable Water Isotopes
Pore water was extracted from sediment in order to measure stable water isotope ratios. The samples were thawed at 4°C and pore water was extracted using Rhizone soil moisture sampler (Eijkelkamp Soil & Water). The pore size of the membrane was between 0.12 and 0.18 µm. Several sediment subsamples did not hold enough water for pore water extraction. Thus, stable water isotope measurements could be carried out for 42 subsamples of YU-L15 and five subsamples for YU-L7.
Stable water isotopes, i.e. the ratios of hydrogen (δD) and oxygen (δ18O), were measured using a Finnigan MAT Delta-S mass spectrometer following standard procedures described in Meyer et al. (2000). The isotopic ratios of δD and δ18O were calculated using the software ISODAT and expressed in per mill (‰) relative to the Vienna Standard Mean Ocean Water (VSMOW) value. The analytical precision is better than ±0.1‰ for δ18O and ±0.1‰ for δD (Meyer et al., 2000). We furthermore calculated the second-order parameter deuterium excess d (d = δD-8*δ18O, Dansgaard, 1964). While δ18O and δD in precipitation are considered as temperature proxies (lower values reflect lower temperatures, higher values reflect higher temperatures), d provides information on moisture generation processes, mainly relative humidity and sea surface temperature. Freeze-thaw processes in the active layer cause secondary fractionation processes, which may overprint the original isotopic signatures.
Inorganic Geochemistry
All samples were analyzed for their element concentrations by non-destructive X-ray fluorescence (XRF) spectrometry. Therefore, bulk samples were homogenized, mixed with a wax binder (CEREOX Licowax at a ratio of 4 to 1), and pressed into 32 mm pellets. Measurements were carried out using the Energy-Dispersive Polarisation XRF (EDPXRF) SPECTRO XEPOS (SPECTRO Analytical Instruments Ltd.) analyzer in a helium gas atmosphere. The contents of all elements from sodium to uranium were simultaneously determined and adjusted to sample weight. After intensive literature research, analyzing the measured single elements, and calculating a large number of ratios, we concentrated on six elemental ratios (S/Cl, Ca/Ti, Sr/Ca, Fe2O3/MnO, Si/Al, Zr/Al) for detailed discussion of sediment properties and permafrost conditions during Yedoma deposition as well as thermokarst and talik processes. We applied the oxide representation of iron and manganese because both, iron and manganese are characterized by several oxidation states compared to the other element ratios. Thus, the ratio in the oxidized form would be more understandable and easier to compare with literature data. The nominal values of the ratio differ only slightly but would lead to the same conclusions. All measured single element contents for both cores are presented in the Supplementary Tables 1, 2.
Mineral Weathering Indices
Multi-element weathering indices provide, relative to the parent material, semi-quantitative measures of mineral weathering intensity, which is directly dependent on, e.g., water availability and temperature conditions. They are traditionally calculated from the concentrations of several mobile (e.g., Ca, K, Na, Mg) and immobile elements (e.g., Al, Fe, Ti, Zr) (Schatz et al., 2015). From the large number of weathering indices (Schatz et al., 2015, cf. Table 1), we ultimately selected three indices that best correspond to geochemical conditions in frozen and thawed Yedoma deposits: the FENG, MIA, and ICV indices.
Feng (1997) developed the FENG index in particular for calcareous substrates. In contrast to many other indices, Ca is not taken into account in this index. Since the solution and relocation history of Ca is almost exclusively traced in the case of clearly calcareous initial substrates, misinterpretations can result (Buggle et al., 2011). By placing easily soluble elements in the denominator of the formula, an increase in the FENG index indicates increased weathering. In accordance to Feng (1997), the index is calculated in molar proportions using Eq. 1.
Babechuk et al. (2014) proposed the mafic index of weathering (MIA) especially for Mg and Fe-containing minerals. The specific arrangement of the MIA(R) was used in consideration of predominantly reducing soil conditions. This takes into account the redox-dependent weathering behavior of iron. Under reducing conditions, Fe2+ responds as a mobile element and is leached along with Mg during the mafic weathering process (Babechuk et al., 2014). Hence, the MIA(R) index increases with increased weathering. In molar proportion and considering only the silicate-bound Ca (CaO*), the MIA(R) calculation is:
The index of composition variability (ICV) was defined by Cox et al. (1995) and can be applied as a measure of compositional maturity. The index measures the abundance of alumina in relation to other major cations (in molar proportions; Cox et al., 1995).
An index value close to 1 shows hardly any mineral conversions, while an index value less than 1 indicates several cycles of weathering, erosion and accumulation; i.e. the smaller the index, the stronger the weathering. This index is therefore inversely proportional to the FENG and the MIA(R) index.
Statistical Analyses
For the examination of relationships between sedimentology as well as organic and inorganic geochemistry of frozen and thawed Yedoma deposits, statistical analyses were performed. Descriptive statistics were carried out using the Python software packages Pandas (McKinney, 2010) and NumPy (Oliphant, 2006). For calculation of Pearson correlation matrices including p-values and to compare the two sediment cores by Mann–Whitney U nonparametric tests the Pingouin statistical package in Python 3 was used (Vallat, 2018). Principal component analysis (PCA) was performed on all pre-selected sedimentological, organic, and inorganic geochemical parameters. Ca, S and Cl were included, additionally, in order to evaluate the influence of these elements on individual elemental ratios. The PCA was carried out using the Python package Scikit-learn (Pedregosa et al., 2011). Since missing values are incompatible with Scikit-learn estimators, the missing values of the grain size parameters from the Yedoma lake core YU-L15 (see above) were initially replaced using the k-Nearest Neighbors approach. By default, an Euclidean distance metric that supports missing values was used to find the nearest neighbors. For more information on methodology see Troyanskaya et al. (2001). For running the PCA, all variables were standardized by subtracting the mean and scaling the actual data range to unit variance (i.e., z-transform). The resulting ordination diagram presents standardized metric scores (i.e. scalei = i × 1.0/(i.max – i.min)) and expresses the relationship among metrics as correlations. Additionally, all core samples were projected onto the ordination graph for interpretation purposes only, because they do not affect calculations. Finally, the sample scores on the first and second principal component (PC1 and PC2, respectively) were plotted against core depth.
Results
Geochronology
Dating results are shown in Table 1. The mean calibrated ages of the YU-L7 alas core showed a general trend over depth ranging from 3,740 cal. yrs. BP at 520 cm bls, over 13,750 cal. yrs. BP at 758 cm bls to 43,020 cal. yrs. BP at 1,998 cm bls. The dating of plant remains at 1,560 cm bls showed an inverse age (49,070 ± 970 cal. yrs. BP). While the youngest calibrated age from the uppermost core part of YU-L7 came from plant remains dating, the other two dates resulted from bulk sediment dating. Three infinite ages at 1,278 cm bls (>24,570 yrs. BP), 1998 cm bls (>39,600 yrs. BP), and 1746 cm bls (>49,300 yrs. BP) generally fitted into the late Pleistocene age sequence.
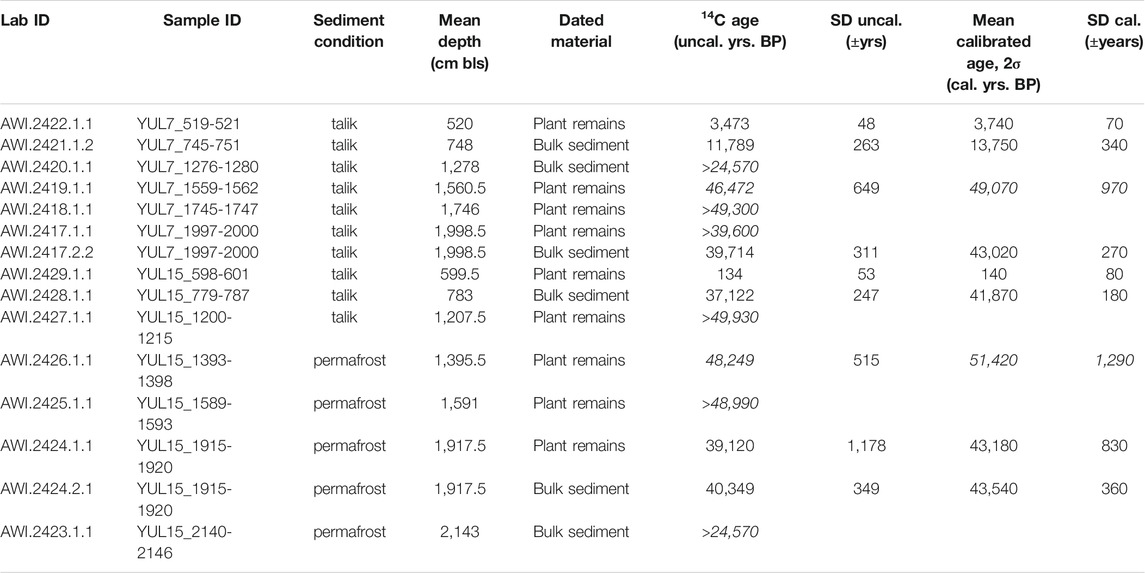
TABLE 1. Radiocarbon dating results for the alas lake core YU-L7 and the Yedoma lake core YU-L15. The mean calibrated ages are rounded to 10 years. Infinite and inverse ages are highlighted in italics.
The mean calibrated radiocarbon ages of the Yedoma lake core YU-L15 showed a relatively short age sequence during the interstadial Marine Isotope Stage (MIS) 3 with a bulk sediment ages of 41,870 cal. yrs. BP at 783 cm bls and 43,540 cal. yrs. BP at 1,917 cm bls. The dating of the plant remains at 1,917 cm bls (43,180 cal. yrs. BP) suggested an age similar to that of the bulk sediment from the same depth, thus confirming the period in which sediments were deposited in this core depth. Plant remains from the uppermost core sample were dated to a nearly modern age (140 ± 80 cal. yrs. BP). The inverse mean age at 1,395 cm bls (51,420 cal. yrs. BP) showed an age near the limit of the 14C calibration curves (Reimer et al., 2020). Three infinite radiocarbon dates of the YU-L15 core also point to late Pleistocene age of the core (Table 1).
Sedimentology and Carbon Characteristics
Alas Lake Core YU-L7
Since the talik below the alas lake (lake depth 230 cm bls) could not be drilled through, the core YU-L7 was completely unfrozen. Generally, the sediments appeared relatively homogeneous and showed a brownish-grey to grey color with varying amounts of organic inclusions as well as blackish dots and streaks (Figure 3). The whole sediment sequence is composed of unimodally distributed, but poorly to very poorly sorted, clayish-silt to sandy-silt deposits (Figure 4). The mean of all grain size distributions (GSDs) is 40 ± 28 µm. The GW/IC (Figure 5) was relatively constant over the entire core (mean 23.2 ± 9.5 wt%) with a peak of 60.8 wt% at 1,258 cm bls as an exception. Taking into account the lithological, sedimentological, and biogeochemical properties and their characteristic simultaneous variations, the core was divided into five sediment units (A-SU).
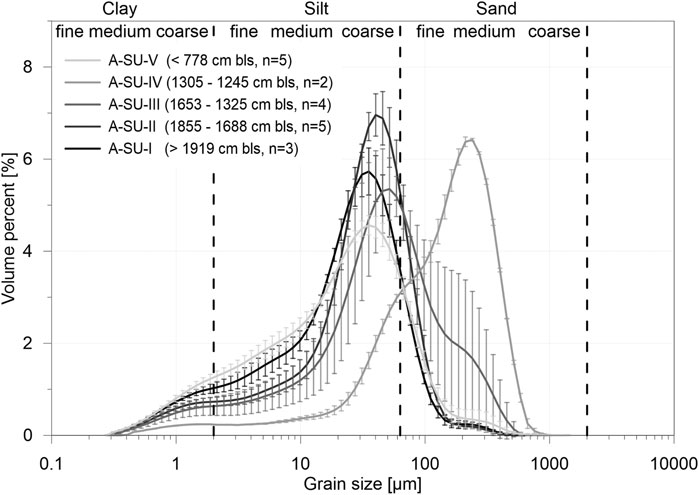
FIGURE 4. Mean grain-size distributions for each sediment unit of the alas lake core YU-L7 (see also Figure 5). The error bars are indicating the standard deviations of individual measured grain sizes.
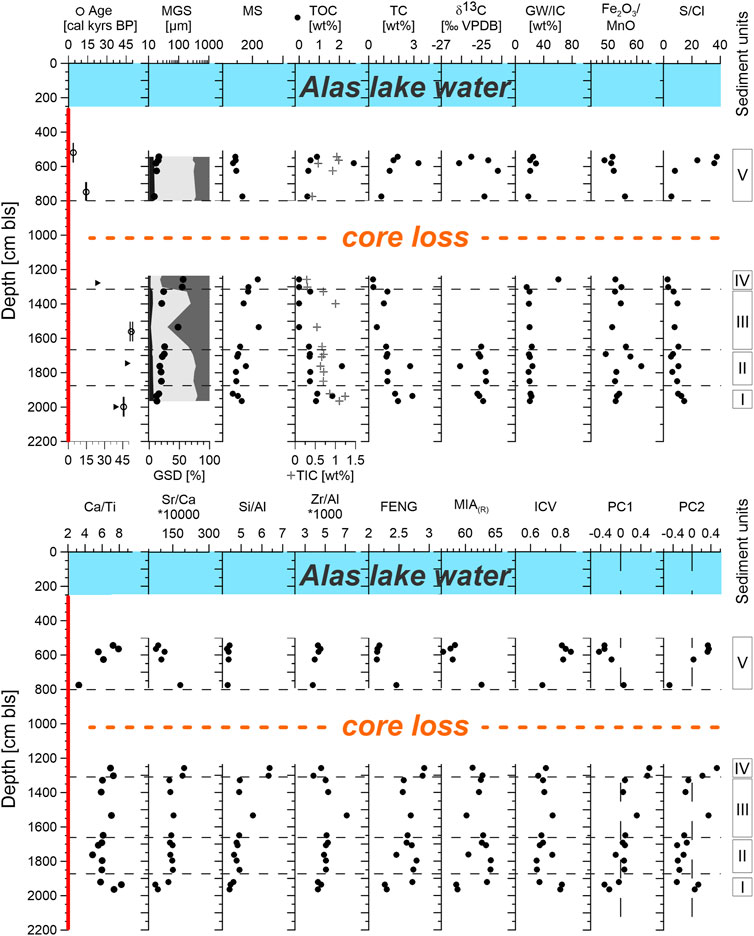
FIGURE 5. Sedimentological parameters, organic and inorganic geochemistry as well as the weathering indices FENG, MIA(R), ICV and the Principal components (PC) of the alas lake core YU-L7 (MGS, Mean grain size; GSD, Grain-size distribution; MS, Mass-specific magnetic susceptibility; GW/IC, Ground water/ice content). Infinite radiocarbon dates are illustrated by triangles. Unfrozen core depth intervals are marked by red depth scale.
The lowest unit (A-SU-I; >1,919 cm bls) was characterized by mean grain size values around 18–21 µm and by GSDs with a distinct peak in the coarse silt fraction (Figure 4). The MS decreased over the three unit samples, while TOC, TIC, and TC peaked at 1936 cm bls. The respective sample had a TOC content of 1.7 wt%, which is the third highest value in YU-L7. The δ13C values varied only slightly around the average of the entire core of −25.1 ± 0.5‰.
In unit A-SU-II (1855–1,688 cm bls), the TOC showed a peak of 2.1 wt% at 1763 cm bls, but otherwise values of about 0.5 wt%. This TOC peak coincided with a positive peak in the MS and TC values, and a negative peak of δ13C to −26.1‰. The TIC values, however, decreased upwards. The mean grain size slightly increased upwards because of a little increase in the sand content.
The mean grain size increased further within sediment unit A-SU-III (1,653–1,325 cm bls) and showed a peak of 94 µm at 1,534 cm bls related to a distinct increase in the sand content. A peak at the same depth was shown by the MS values. Striking in this sedimentary unit was the significant drop of the TOC values down to values below the detection limit of 0.1 wt%. Because of very low values in the OC content, it was not possible to measure δ13C for this sediment unit. The TIC values remained constant here but showed a little high at 1,398 cm bls.
The two samples within sediment unit A-SU-IV (1,305–1,245 cm bls) were characterized as fine to medium sand (Figure 4). Thus, they showed the highest mean grain sizes of the whole YU-L7 core with values of 132 and 141 µm. The MS values typically increased with the increased sand content but TC, TIC, and in particular TOC showed very low values within this sediment unit.
Within sediment unit A-SU-V (<778 cm bls), the clay content increased again while the sand content decreased considerably. Thus, the mean grain size decreased to lowest core values between 16 and 22 µm. This coincided with decreasing MS values. Higher clay content in this upper sediment unit was also reflected in broader GSDs. However, the TOC content showed its highest peak of the core with 2.7 wt% at 582 cm bls. This coincides with an increase of the TC and a negative peak of TIC and δ13C to 0.57 wt% and −26.1‰, respectively (Figure 5).
Yedoma Lake Core YU-L15
The talik below the Yedoma lake reached a depth of about 1,250 cm bls during drilling. Thus, the core YU-L15 was frozen below 1,250 cm bls and unfrozen above, which also resulted in some core loss during drilling. Visually, the sediments appeared much more heterogeneous than the talik deposits below the alas lake and showed light grey to brownish- and blackish-grey colors with higher amounts of organic inclusions and lenses as well as noticeable blackish dots and streaks (Figure 3). The core was characterized by a generally decreasing GW/IC trend upwards and by distinct cryostructures in the middle to lower frozen core part. The cryostructures included structureless to micro-lenticular and also suspended ice. Larger ice veins and bands of few centimeters thickness are mainly vertical in the lowermost core part. Generally, the GSDs of the YU-L15 sediment samples were composed of uni- to bimodally distributed, very poorly sorted, clayish-silt to silty-sand deposits (Figure 6). The mean of all GSDs is 73 ± 51 µm. Considering the sedimentology, the biogeochemistry and also the cryostratigraphy, the YU-L15 core was divided into five sediment units (Y-SU; Figure 7).
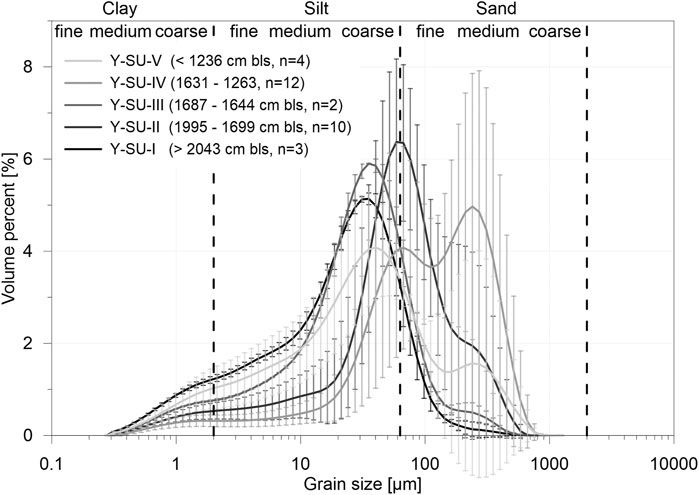
FIGURE 6. Mean grain-size distributions for each sediment unit of the Yedoma lake core YU-L15 (see Figure 7). The error bars are indicating the standard deviations of individual measured grain sizes.
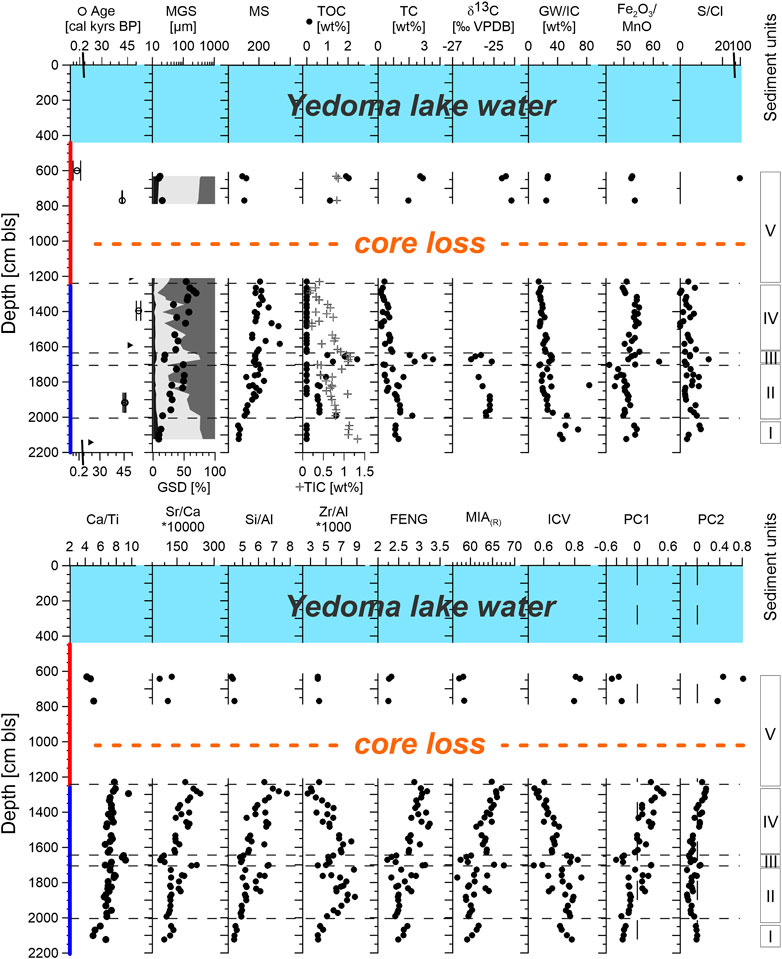
FIGURE 7. Sedimentological parameters, organic and inorganic geochemistry as well as the weathering indices FENG, MIA(R), ICV and the Principal components (PC) of the Yedoma lake core YU-L15 (Mean grain size (MGS); Grain-size distribution (GSD); Mass-specific magnetic susceptibility (MS); Ground water/ice content (GW/IC)). Infinite radiocarbon dates are illustrated by triangles. Unfrozen core depth intervals are marked by red depth scale while frozen ones are marked in blue.
The lowest sediment unit (Y-SU-I; >2,043 cm bls) was characterized by very low mean grain sizes between about 15 and 19 µm (Figure 7). The broad GSDs resulted from higher clay content in this sediment unit (Figure 6). The MS values were the lowest within the whole core. Striking in this unit were TOC values below detection limit and the highest TIC values (1.1–1.3 wt%) of the entire core. The ice contents were high in this unit with up to 68 wt%. The ice richness was represented by up to 3 cm thick-layered lenses and bands that were mainly vertically oriented (Figure 3).
Y-SU-II (1,995–1,699 cm bls) was characterized by a general increase in MS and mean grain size. The upper part of this unit was particularly characterized by high sand contents and a maximum mean grain size of 106 µm at 1,762 cm bls. The grain size variations in this unit were also evident in the strong varying and broad GSDs (Figure 6). In the lowermost part of this unit (1,992 cm bls), the TOC content showed a distinct peak with 1.4 wt%. Above it decreased and alternated between amounts under the detection limit and 0.5–0.9 wt%. The TIC and TC values decreased upwards as well, but the TIC peaked at 1,869 and 1,728 cm bls. The δ13C values show very little variations around −25‰. A striking feature in this unit is the large peak in the gravimetric ice content to 80 wt% at 1817 cm bls. This goes along with a small peak in the TOC to 0.6 wt%. These properties were related to an approximately 5 cm thick ice-rich layer, with an obviously higher organic content than the sharply bordered sandy areas above and below (see Figure 3).
Strong parameter changes were obvious in unit Y-SU-III (1,687–1,644 cm bls). Except for MS, almost all parameters peaked considerably here. The suddenly increasing silt content to about 75% and the decreasing sand content cause a strong decrease in the mean grain size to about 25 µm. The broad GSDs are comparable to that of Y-SU-I but show little lower clay contents (Figure 6). The TOC content showed the highest values of the total core with its highest peak of 2.5 wt% at 1,672 cm bls (Figure 7). The strong TOC increase was complementary to maxima of TC und TIC up to 3.6 and 1.2 wt%, respectively. While δ13C values fell below -26‰, the gravimetric ice content in this unit showed only little higher values around 30 wt% than above and below.
Unit Y-SU-IV (1,631–1,263 cm bls) was characterized by a high sand (up to 92%) and an upward decreasing GW/IC, ranging between 25 and 14 wt%. The ground ice in this unit was structureless and non-visible. With upwardly increasing sand contents, the mean grain size increased to a maximum value of 260 µm at 1,294 cm bls. However, alternating silt- and sand-rich areas within the core unit resulted in strong variations in the mean grains size and GSDs (Figures 6, 7). The MS showed distinct peaks at 1,584, 1,483, and 1,377 cm bls that coincided with peaks in the sand content. This unit is characterized by consistent extremely low TOC amounts below the detection limit. TC also shows very low values decreasing further upwards. The TIC showed a strong decrease above unit Y-SU-III, but fluctuates upwards around a unit mean of about 0.5 wt%.
The uppermost unit Y-SU-V (<1,236 cm bls) represents unfrozen talik sediments and was characterized by silt-dominated GSDs with higher clay contents compared to the middle sediment units. Like the lowest unit Y-SU-I, the mean grain size of this talik unit showed values around 18 µm. The MS showed constant medium values. TOC, TC, and TIC showed high values up to 2.0, 2.9, and 0.9 wt%, respectively. The δ13C values also showed higher values around −24‰ in this unit (Figure 7).
Stable Water Isotope Characteristics
Stable water isotopes were plotted in relation to the Global Meteoric Water Line (GMWL) (Craig, 1961) for each core (Figure 8A) and we used the season-specific Local Meteoric Water Line (LMWL) for Yakutsk from Papina et al. (2017). While the LMWL for the warm season exhibited a lower slope of 7.2 and a negative intercept of −18.9 in comparison to the GMWL, the LMWL for the cold season ran parallel but above the GMWL (Figure 8A). The Local Evaporation Line of Central Yakutia (LEL; Wetterich et al., 2008) reflects regional evaporation effects on the surface waters in the study area.
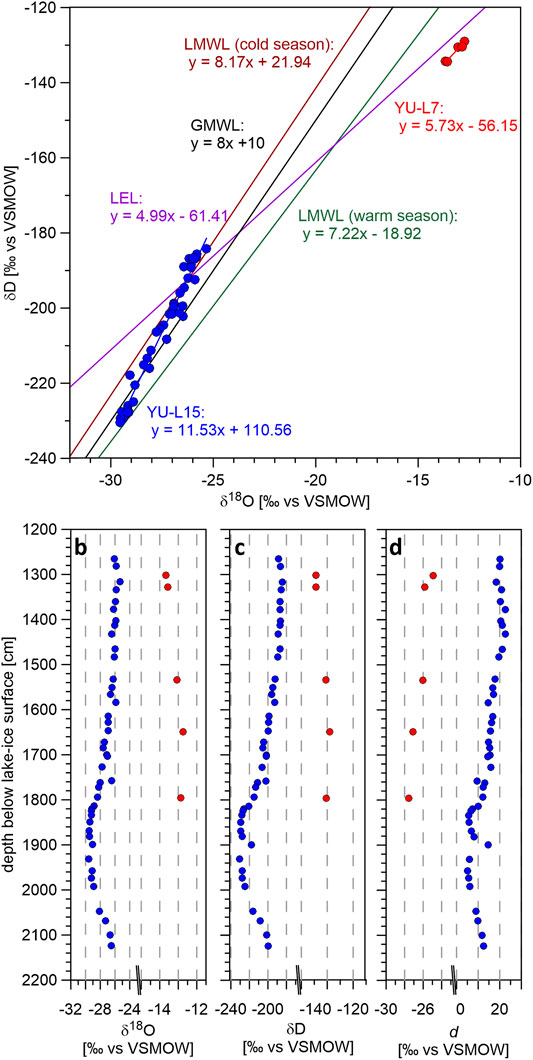
FIGURE 8. Stable water isotopes of the alas lake core YU-L7 (red dots) and the Yedoma lake core YU-L15 (blue dots) samples. (A) Scatter plot of δ18O and δD. Indicated are the GMWL (black), the LEL (purple), and the LMWL of Yakutsk for the warm season (green) and the cold season (brown). (B–D) δ18O, δD, and d (deuterium excess), respectively, against core depth. Note the breaks on the x-axes in (B–D).
The δ18O and δD values of the alas lake core YU-L7 strongly differed from the GMWL and LMWLs, respectively, but their slope (5.7) roughly corresponded to the LEL (slope of 5). The δ18O values ranged from −13.7‰ at 1,302 cm bls to −12.9‰ at 1796 cm bls. The δD values ranged from −134‰ (1,649 cm bls) to −129‰ (1,328 cm bls). The d values varied between −27.6 and −24.9‰ and slightly decreased towards the bottom of the core.
The Yedoma lake core YU-L15 showed a much steeper slope (11.5) than GMWL, LMWLs, and LEL, respectively, with δ18O values between −29.5‰ at 1,316.5 cm bls and −25.3‰ at 1,931.5 cm bls (Figure 8B). The δD values range between −230‰ (1,316.5 cm bls) and −184‰ (1931.5 cm bls). Notably, the isotopic values from the uppermost frozen deposits below the talik (1,265–1,483 cm bls) were highest, while the samples between 1820 and 1992 cm bls showed the lowest and most depleted isotopic values. Generally, the δ18O and δD values decreased with depth until 1931.5 cm bls to −29.5‰ and to 230.4‰, but then increased again to the bottom layer to values that were more similar to the uppermost layers. The d values of the Yedoma lake core showed a similar course and lie between 5.1‰ (1957.5 cm bls) and 22.6‰ (1,377.5 cm bls).
Inorganic Geochemistry and Weathering Indices
Alas Lake Core YU-L7
The inorganic geochemical parameters in the YU-L7 core showed rather little variations (Figure 5). However, some noticeable peaks can be seen in all parameters. The by far highest but outlying S/Cl ratio of 37.6 was calculated for the uppermost unit A-SU-V at 582 cm bls. This peak coincides clearly with high TOC values. Below unit A-SU-V, the ratio showed less variations with minimum values in unit A-SU-IV but again higher values in the lowest sediment units (mean 11.9 ± 9.9).
Higher Ca/Ti ratios were calculated for the lowest und uppermost units. In between, the values stayed rather constant around the mean of 6.3 with a negative peak in unit A-SU-IV at 775 cm bls. The Sr/Ca ratio is inverse proportional to the Ca/Ti course, with low ratios in A-SU-I and A-SU-V and higher ratios in A-SU-IV. The mean Sr/Ca ratio of the alas lake core was 134 ± 35 (Table 2).
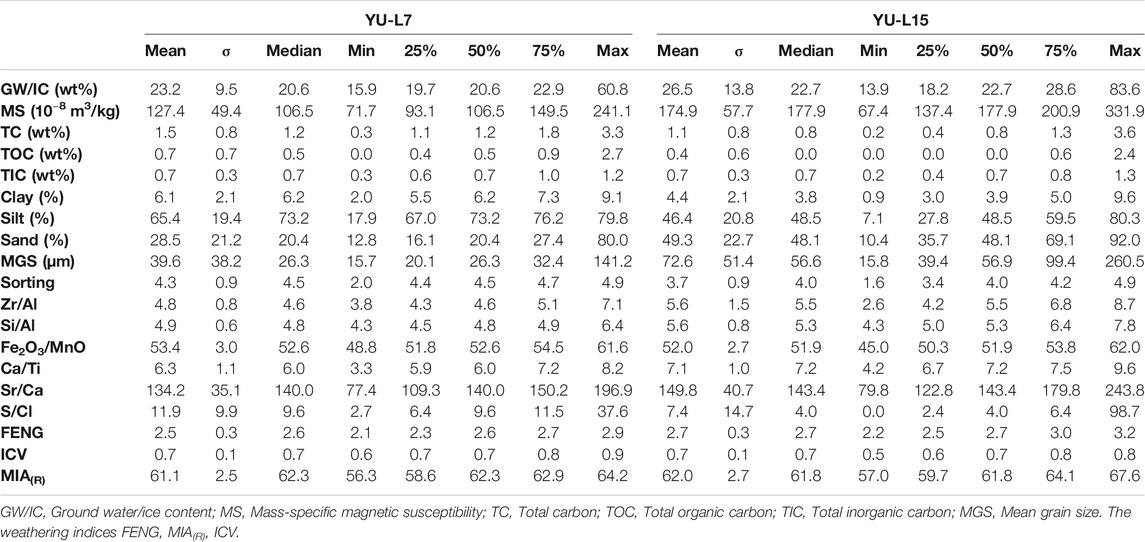
TABLE 2. Overview of statistical characteristics for all analyzed parameters for the alas lake core YU-L7 and the Yedoma lake core YU-L15.
The Fe2O3/MnO ratio showed stronger variations than other parameters in the alas lake core. Particularly, at the transition from A-SU-II to A-SU-III, reducing conditions (higher ratios) changed sharply to conditions of higher oxygen availability (lower ratios). A high Fe2O3/MnO ratio was especially prominent at 1763 cm bls, which corresponded to high TOC and lower δ13C values (Figure 5). Smallest ratio values occurred at 1,692 and 564 cm bls. While the ratio stayed almost above 50 in the whole core and showed a generally upward decreasing trend.
Changes of the Si/Al ratio correlated clearly with the mean grain size in YU-L7 (r = 0.97, p < 0.001), which in particular points to the connection of sand and silicon input. The ratio increased with increasing sand content at 1,534 cm bls (A-SU-III) and in unit A-SU-IV (Figure 5). The Zr/Al ratio increased from A-SU-I together with the Si/Al until a maximum at 1,535 cm bls, but afterwards it decreased towards the top and showed even the lowest values in unit A-SU-IV.
All weathering index values suggest inhibited mineral weathering in the lowest and uppermost parts of the YU-L7 core (low values in FENG and MIA(R) and values close to 1.0 in ICV). Progressive weathering conditions are only shown by the increasing FENG and MIA(R) indices and the low ICV in particular at the transition from A-SU-I to A-SU-II between 1,921 and 1,796 cm bls and at the transition from A-SU-III to A-SU-IV between 1,302 and 1,257 cm bls (Figure 5).
Yedoma Lake Core YU-L15
Prominent maxima in the S/Cl ratio (98.7) were calculated for the uppermost sediment unit Y-SU-V representing the talik and unit Y-SU-III at 1,672 cm bls (13.4). However, the S/Cl ratio in the frozen part of the YU-L15 core was very low but slightly increasing within the lowest unit Y-SU_I (mean 7.4 ± 14.7).
The Ca/Ti ratio showed lowest values in Y-SU-I and Y-SU-V and a mean of 7.1 ± 1.0. In addition to a high ratio in Y-SU-III, another local maximum was shown at 1,294 cm bls (Figure 7). Low Sr/Ca ratio values were obvious for the lowest frozen and the uppermost unfrozen parts of the YU-L15 core. The ratio is slightly increasing in Y-SU-II to a high value of 230 at 1,700 cm bls, which marks the border to unit Y-SU-III. Noticeable in unit Y-SU-III (1,687–1,644 cm bls) is the strong drop in the Sr/Ca ratio to minimum values. Above Y-SU-III the Sr/Ca ratio was increasing again to a maximum of 243 at 1,294 cm bls. The mean Sr/Ca ratio of the Yedoma lake core was 149.8 ± 40.7 (Table 2).
While the Fe2O3/MnO ratio in the lower part of the YU-L15 core indicated a change from slightly reducing soil conditions in Y-SU-I to more oxidizing conditions in Y-SU-II with minimum values at 1,703 cm bls, the ratio remains relatively constant with values just over 50 in Y-SU-IV and the talik unit (Y-SU-V). Obvious, however, was the sharp and strong increase to a maximum ratio of 62 in Y-SU-III (1,684 cm bls).
A clear connection between changes of the Si/Al ratio and the mean grain size are obvious also for Yedoma lake core ((r = 0.93, p < 0.001). The relatively high mean Si/Al ratio of YU-L15 (5.6 ± 5.3) reflected the sandy sediments below the Yedoma lake and the gradual increase of the sand content up to the talik boundary (∼1,250 cm bls; Figure 7). The Zr/Al ratio in the Yedoma lake core was subjected to strong fluctuations. While the ratio increased in the lower core part, it showed rapidly changing maxima and minima from Y-SU-II to Y-SU-IV and then decreased again up to the unfrozen talik sediments.
The three weathering indices calculated for the Yedoma lake core showed high maximum values (minimum for ICV) and strong fluctuations (Table 2). The fluctuations of all three indices increased in the lower core part (Y-SU-I and Y-SU-II). Conditions promoting weathering have been indicated here by high values of the FENG and MIA(R) and low values of the ICV at 1,700 cm bls. A clearly opposite change in all values could then be observed within unit Y-SU-III (Figure 7). Above this, the FENG and MIA(R) indices rose again and the ICV decreased to maximum (minimum for ICV) values up to the talik boundary at 1,250 cm bls. Within the talik sediments (Y-SU-V), mineral weathering seemed to be inhibited again.
Parameter Correlations and Principal Component Analysis
Due to their inverse proportionality, a positive correlation (r) of the FENG or MIA(R) index with a variable corresponds to a negative correlation with the ICV. High negative (respectively positive for ICV) and statistically significant (p < 0.05) correlations are obvious for both cores between the weathering indices and TOC, TIC, TC, and the S/Cl ratio (see Supplementary Tables 3, 4). Further positive correlations for both sediment sequences exist between TOC and the clay and silt grain size fraction. For the YU-L15 Yedoma lake core, there are particularly high positive (respectively negative for ICV) and statistically high significant (p < 0.001) correlations between the three weathering indices and the sand content, the mean grain size, the Si/Al ratio, and the Sr/Ca ratio. A negative and high significant correlation between GW/IC and the sand content can only be seen in YU-L15 (r = −0.64, p < 0.001). In addition, also all three weathering indices show significant negative (resp. positive) correlation with GW/IC in YU-L15. In contrast to YU-L15, all weathering indices show significant (p < 0.05) positive (respectively negative) correlations with depth in the YU-L7 alas lake core.
The PCA of both cores show two major principal components (PC1 and PC2) that explain 68.8% (YU-L7) and 69.2% (YU-L15) of the total variance of all sedimentological and biogeochemical parameters. The sample scores on PC1 and PC2 are plotted against depth for both cores in Figures 5, 7, illustrating their variations against the ordination results within the different sediment units. However, the ordination biplots (Figure 9) show different combinations of variables on the two axes. While the variables within the PCA for the Yedoma lake core YU-L15 are clustered quite clearly, for the alas lake core YU-L7 they show a broad distribution in small groups across the entire biplot. The vector lengths (i.e. PCA loadings) within the biplots indicate how strongly the individual variable is related to the displayed ordination. Hence, for both sediment cores, the highest positive loadings on PC1 are shown for Si/Al, Sr/Ca, Sand, the FENG index, and the MS. The MIA(R) index also shows a positive correlation with PC1 for YU-L15. High negative loadings on the first axis for both cores are shown for TC, clay, silt, sorting, TIC, and TOC. In addition, negative correlations with PC1 are also shown by the variables ICV and GW/IC for YU-L15 and the variables S/Cl, S, Ca and Cl for YU-L7. Variables with high positive loadings on PC2 for YU-L7 are Ca/Ti, ICV, and GW/IC and for YU-L15 S and S/Cl. Negative correlations with PC2 for YU-L7 are shown for MIA(R), Fe2O3/MnO, and depth, while for YU-L15, the variables depth, Zr/Al, Ca, Ca/Ti, and Cl are oriented along the negative range of PC2.
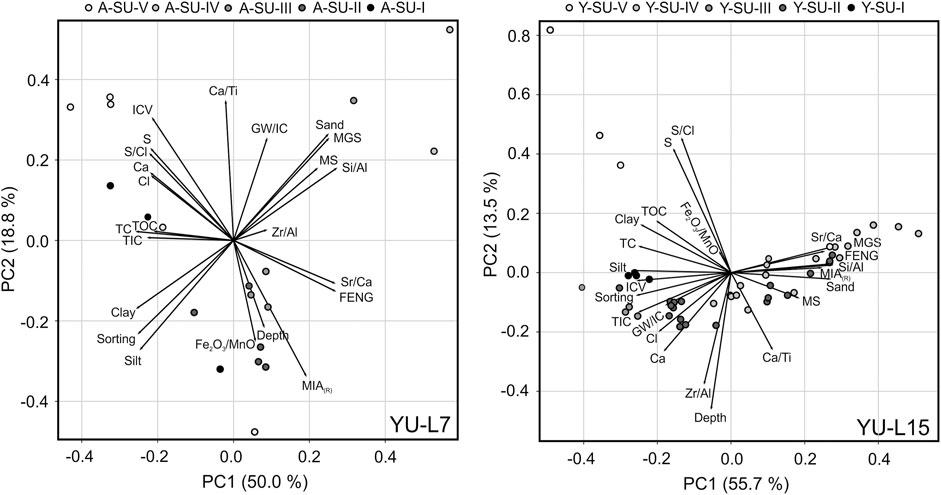
FIGURE 9. PCA ordination biplots on all sedimentological and biogeochemical parameters for (A) the alas lake core YU-L7 and (B) the Yedoma lake core YU-L15. The sample scores are scaled in white, gray and black according to the sediment units given above the plots.
Discussion
Origin of Ground Water and Ice
For our studied cores we found varying amounts of pore water/ice which is linked to the different host sediments and their respective water storage capacity (Figure 8). With a mean GW/IC value of 26.5 ± 13.8 wt%, the Yedoma lake core contains slightly more water/ice in comparison to the alas lake core (mean: 23.2 ± 9.5 wt%). The deposits of the alas lake core were completely thawed already. Thus, no further ground subsidence is expected for the ground below the alas lake. The higher GW/IC in the Yedoma lake core results from the perennial frozen conditions, particularly of the lower parts of the YU-L15 core. This together with further vertical and lateral expansion of the lake and the talik, would lead to more thawing of the sediments and further ground subsidence below the Yedoma lake (Fedorov et al., 2014).
In general, the composition of stable water isotopes in thermokarst lakes is mostly influenced by precipitation, evaporation and occasionally by meltwater from the surrounding catchment and the underlying permafrost (e.g., Turner et al., 2014). Earlier measurements of stable water isotopes of lake water from different thermokarst lakes at the Yukechi study site show evaporation by enriched δ18O (−13.8 to −8.8‰) and δD (−133.8 to −110.9‰) values, which is also seen in the LEL for Central Yakutia of δD = 5*δ18O - 61.4 (sample nos. Yak-01 to Yak-05; Wetterich et al., 2008).
Because of ground thawing (i.e., talik development) and lake water infiltration, the lake water has a strong influence on the pore water isotope composition of the talik sediments. In comparison to Northern Yakutia, the influence of local air temperatures and resulting evaporation effects on lake water δ18O are stronger due to much higher summer temperatures in Central Yakutia (Wetterich et al., 2008).
As shown in Figure 8, the δ18O and δD values from the alas lake core YU-L7 (mean: −13.2 ± 0.4‰ and −131.7 ± 2.2‰, respectively) are distinctly less depleted than those from the Yedoma lake core YU-L15 (−27.4 ± 1.3‰ and −205.0 ± 15.4‰, respectively). Furthermore, the alas lake core data are clearly independent from the GMWL but align with the LEL. Overall, they are similar but slightly more depleted than stable isotope values of the nearby drilled alas sediment core presented in Windirsch et al. (2020). Despite the low number of samples (n = 5), both the slope of 5.73 (R2 = 0.97) and the enriched isotopic composition with extremely negative d values suggest that the pore waters of the alas core originated from water infiltration from the alas lake above the thawed sediments. The alas lake water itself can be interpreted to represent a rather recent water source signal (i.e. precipitation), which is strongly affected by evaporative fractionation and further depends on cyclical water balance changes typical for the alas lakes in Central Yakutia (Ulrich et al., 2017b). The relatively homogenous isotope signals of YU-L7 result from the saturation of the sediments with surface water. This suggests subsurface water flow after talik development, which probably has also implications for local hydrology in a way that new flow paths through former impermeable layers are possible under warmer climate conditions (Johansson et al., 2015).
The Yedoma lake core (YU-L15) stable isotope data (n = 43) are highly correlated (R2 = 0.97) with a δ18O-δD slope of 11.53. The low δ18O and δD and high d values indicate that the water/ice originates from intra-sedimental pore and segregation ice of the still frozen, i.e. intact, Yedoma IC below the lake. Hence, they represent the original isotopic composition during permafrost formation. An overprinting by isotopically different lake water can be ruled out. Furthermore, the high slope and the high d values indicate that neither evaporation nor freezing fractionation have played a major role before fixation of the isotope signals in permafrost. While the upper part (above 1,800 cm bls) of the Yedoma lake core is dominated by structureless non-visible pore ice, the sediments below 1,800 cm bls represent a larger variety of intra-sedimental cryostructures: from structureless non-visible ice to varying amounts of micro and macro ice lenses to almost pure ice lenses (Figure 10). Hence, distinct minima in δ18O, δD, and d between 1,800 and 2,000 cm bls might be related to the higher amount of segregation ice even though the isotope profile below and above 1,800 cm bls do not differ considerably in terms of the δ18O-δD slopes. Furthermore, changes in climate and hydrological conditions, their seasonal variations as well as active-layer dynamics may have contributed to this pattern.
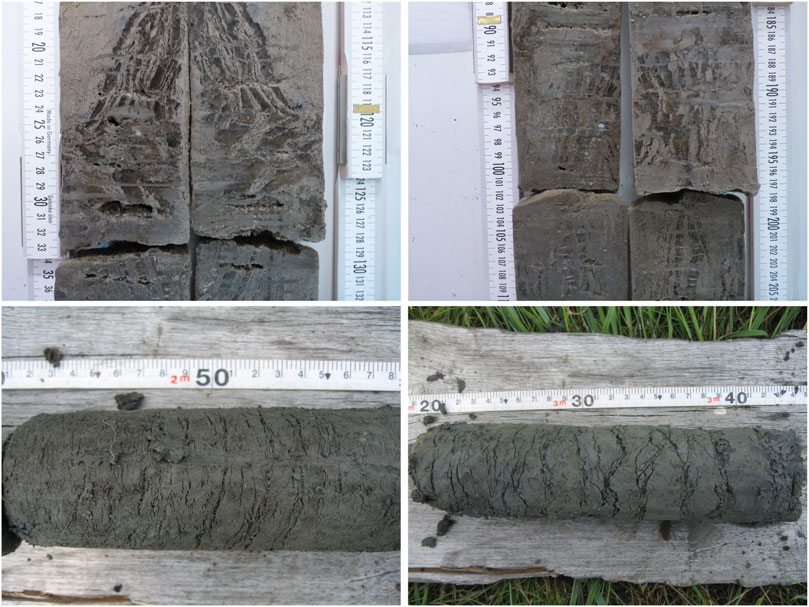
FIGURE 10. Comparison of different cryostructures within the study region of Central Yakutia. (Above) Cryostructures of Y-SU-I at about 2,200 cm bls of the Yedoma lake core YU-L15 (this study) in comparison to (Below) cryostructures that have formed by the downward moisture migration in subaquatic deposits during talik re-freezing from the nearby alas basin Khara Bulgunnyakh (Ulrich et al., 2017a).
Overall, the mean δ18O and δD values of the Yedoma lake core are very similar to those of the nearby drilled on-land Yedoma core presented by Windirsch et al. (2020), whereas the mean d value of our core is lower, mainly driven by the distinct minimum between 1,800 and 2,000 cm bls. Nevertheless, our δ18O-δD slope (11.53) differs distinctly from that of the Windirsch et al. (2020) core (6.61) and is much higher than season-specific LMWLs for Yakutsk (Figure 8). Generally, the low δ18O and δD and the high d values are close to those of a nearby ice wedge (Windirsch et al., 2020) as well as other Central and Interior Yakutian MIS 3 ice wedges (Popp et al., 2006; Opel et al., 2019). This suggests a substantial contribution of winter precipitation (characterized by lower δ and higher d values) to the formation of the intra-sedimental ice. Comparable high pore ice d values have also been reported for some stratigraphic units exposed at the Batagay megaslump (Opel et al., 2019) and might therefore represent an over-regional pattern for Central and Interior Yakutia related to the extreme continentality of climate during MIS 3.
Organic Carbon Characteristics of Thawed and Frozen Yedoma Deposits at the Yukechi Study Site
Quantifying the OM content is important to estimate the relevance of the study site regarding potential future GHG release from Yedoma deposits (Turetsky et al., 2020). The TOC for the YU-L7 core has a mean value of 0.72 wt%, whereas the mean value for YU-L15 core lies at only 0.37 wt%. These values are in the marginal range of averaged TOC values reported by Strauss et al. (2013) for Siberian Yedoma deposits (3.0 + 1.6/−2.2 wt%), but fit well with results of previous studies carried in Central Yakutia (Ulrich et al., 2019; Windirsch et al., 2020). In both cores, TOC correlates negatively with grain size (YU-L7: r = −0.48, p < 0.05; YU-L15: r = −0.43, p < 0.01; Supplementary Tables 1, 2). TOC, TIC, and TC values show local peaks in the fine-grained sediment units; most prominent at the silt shift at 1,672 cm bls (Y-SU-III; Figure 7). Extreme low TOC values are rather linked to the sand-dominated units.
One explanation for the low TOC content can be a strong post-sedimentary OC decomposition during thermokarst processes (Strauss et al., 2015; Weiss et al., 2016). But this could only apply for the thawed YU-L7 core sediments. The cryostratigraphy and stable water isotope values for the middle and lower parts of core YU-L15 indicate that at least this part stayed frozen since accumulation. Therefore, a deep OM degradation is unlikely here. However, short-term and rather shallow OM degradation within the active layer after different sedimentation phases of YU-L15 could be an explanation. A subsequent slowly rising permafrost table would leave enough time for the carbon mobilization before the sediment would freeze.
Another explanation for the low TOC values is a low initial OC content. Windirsch et al. (2020) argued that the fluvial and alluvial deposition of coarse-grained (sandy), organic-poor sediments led to the low TOC content. In addition, plant growth and organic input could have been hampered by substrate quality and disturbance (i.e. accumulation) frequency.
Further OM decomposition processes within the sediments below both thermokarst lakes are possible and traceable by δ13C isotopes (Schirrmeister et al., 2011; Strauss et al., 2015). For the talik unit Y-SU-V of the Yedoma lake core, δ13C indicate lower quality and higher carbon decomposition rates (Strauss et al., 2015; Weiss et al., 2016). The high quality signal in the upper part of the YU-L7 core (−26.12‰) likely resulted from modern input by the alas lake above. However, Jongejans et al. (2021a) found higher C/N ratio in the Yedoma lake core and in the bottom of the alas lake core compared to the top and middle parts of YU-L7, which suggest that OM was at least better preserved in frozen sediments below the Yedoma lake compared to large parts of YU-L7.
Finally, the conditions that promote the weathering processes also lead to the gradual degradation of the OM, as can be indicated by the high significant correlations of the weathering indices with the TOC values (e.g., r = −0.74, p < 0.001 for FENG versus TOC, see Supplementary Tables 3, 4). However, analysis of close-by sediment cores drilled on dry land at the Yukechi site point against strong post-sedimentary decomposition of OM but rather for the input of organically poor and pre-decomposed material (Windirsch et al., 2020). Based on our data, a combination of the two can be assumed. Relatively few OM was deposited, which could then be decomposed comparatively quickly. Despite the low OC content of the Yukechi Yedoma IC sediments, Jongejans et al. (2021a) found substantial greenhouse gas production from sediments upon thawing. Their findings showed that the OM quality and turnover history are the main driver for GHG production (Jongejans et al., 2021a).
Applicability and Sensitivity of Specific Element Ratios
When comparing the two cores, it must be taken into account that the Yedoma lake core YU-L15 is significantly sandier than the alas lake core YU-L7 (Table 2; p < 0.001). Usually, there are more adsorption surfaces in silty substrates, depending on the element considered, but this could explain the generally higher element concentrations, and at least higher TOC content, in YU-L7 (p < 0.01). Thus, the comparison of weathering indices and elemental ratios is more suitable to compare different substrates than pure single element contents.
Previous studies from NE Siberia and Central Yakutia showed that Yedoma IC deposits are not only rich in carbonates (Schirrmeister et al., 2011) but also sulfides (Siegert, 1979; Siegert, 1987; Biskaborn et al., 2012; Ulrich et al., 2017a; Ulrich et al., 2019), the latter are common in the form of pyrite (FeS2). Pyrite forms under reducing conditions and oxidizes relatively easily under oxygen-rich conditions. When the surface thaws and comes into contact with oxygen, sulfide oxidizes to sulfate and can then be easily removed, together with Fe, which is dissolved. Thus, individual surfaces can be detected that represent these short-term thawing processes and subsequent re-freezing (in case of the YU-L15 core) by increasing S and Fe values. Those are in particular prominent in the lower and upper parts of both cores (Supplementary Tables 1, 2). Furthermore, S naturally shows a close relation to the organic matrix, so that high S contents could be detected in the core sections with high TOC concentrations. Kokelj et al. (2013) reported S releases in the form of SO42- during permafrost thaw and carbonate weathering from Late Pleistocene ice-rich glaciogenic sediments under oxidizing conditions on the Peel Plateau of northwestern Canada. The carbonate weathering includes sulfide oxidation, which leads to an increase in solute fluxes (Zolkos et al., 2018). With Cl− as an ion that showed only minor increase with permafrost degradation, Kokelj et al. (2013) have shown that the SO42−/Cl− ratios have more than doubled since the 1960s in a Canadian Arctic river. This was resulting from an increase in retrogressive thaw slump (RTS) activities within its watershed due to increasing air temperatures. The following statements are possible if these findings are applied to our results. Since chloride is very easily soluble, it is removed faster than sulfate, which is only generated from sulfide through oxidation processes. The S/Cl ratio in the thawed core YU-L7 and within the talik of YU-L15 is thus higher than in the frozen part of YU-L15 (Table 2), where Cl is bound by the frozen state and has not been removed, yet. Therefore, individual maxima of the S/Cl ratio within YU-L15 suggest also brief thawing processes during pausing sedimentation. The syngenetically rising permafrost table has preserved the resulting S/Cl ratio.
The Ti/Ca ratio is often used as the primary weathering index, which increases as the degree of weathering increases, since the immobile Ti is more stable against weathering than the Ca, which is often bound in CaCO3 (Fischer et al., 2012). Since we used the reverse Ca/Ti ratio, it drops when the weathering processes increases. When comparing the two cores, it becomes obvious that YU-L7 shows overall lower Ca/Ti values than YU-L15 (p < 0.01), which indicates a higher overall degree of mineral weathering in the alas lake core than in the Yedoma lake core. This is likely caused by the fact that YU-L7 is consistently thawed and is therefore subject to stronger and longer weathering than the frozen core part of YU-L15. Moreover, Ti is generally known to reflect detrital input (usually in lakes) as it is released from source rocks or deposits by physical weathering and minerals containing Ti are not sensitive to dissolution (Demory et al., 2005). Haberzettl et al. (2007) used the Ca/Ti ratio to interpret hydrological variability in lacustrine deposits from Southern Patagonia with the immobile Ti as a proxy for allochthonous clastic input. Using this method, we can differentiate between tendencies of lithogenic to carbonate deposition, with lower Ca/Ti values reflecting an intensified allochthonous input and higher values for autochthonous mineral precipitation.
The ratio of (Sr/Ca)*104 is used to separate lithogenic and biogenic Ca, whereby high ratios indicate lithogenic carbonate, while small ratios reflect the biogenic influence (mussel and snail shells). Overall, the Sr/Ca ratio of the alas lake core was showing much smaller values compared to the Yedoma lake core (Table 2; p < 0.1). This is suggesting a higher biogenic influence on the carbonate amount in the sediments below the alas lake and a predominantly lithogenic (clastic) carbonate input in the Yedoma deposits (Wien et al., 2005; Demina et al., 2019). Beside the predominantly lithogenic carbonate input in the Yedoma deposits, as supposed above, this ratio drops in Y-SU-III (1,672 cm bls) suggesting a short-term biogenic Ca input in this sediment unit. Moreover, if the (Sr/Ca)*104 ratio is >100, it is suggested to be an indication of the presence of aragonite (Sr-rich) rather than calcite (Wegwerth et al., 2014). Aragonite is mostly formed secondary by chemical precipitation from calcareous water. The prerequisite for this chemical precipitation is an increase in the CaCO3 concentration until a supersaturated solution is reached (Wegwerth et al., 2014; Lampe et al., 2016). Aragonite precipitation is generally more characteristic of marine environments, but Roeser et al. (2016) were able to detect the accumulation of aragonite in lake sediments from NW Turkey in connection with very shallow lake levels and phases of increasing temperatures during the late Pleistocene (i.e. MIS3) and the early Holocene. The CaCO3 precipitation from calcareous (ground-)water can only occur in thawed subsurface sediments as only then, a subsequent weathering process can be initiated. Thus, the Sr/Ca ratio, if compared with the FENG index, shows high correlations for YU-L7 and YU-L15 of r = 0.83 and r = 0.91, respectively. In this way, different phases of weathering of different degrees can be identified.
The Si/Al and Zr/Al ratios provide information about grain-size changes and can be used to estimate transport energy in sedimentary catchments (Lopez et al., 2006; Urbat, 2009; Bertrand et al., 2012). The amount of Si and Zr in surface sediments is controlled by their association with heavy minerals and are interpreted as signals of detrital input. However, Al is relatively insensitive to changes in the nature of the sediment sources, the size of the catchment area and hydrodynamic processes. Therefore, it represents the ideal element to interpret the lithogenic fraction of the sediment and to use it to normalize other lithophile elements (Bertrand et al., 2012). Increasing Si/Al and Zr/Al ratios during cold to moderate climate conditions may, therefore, reflect higher transport energy and terrestrial sediment supply, since silicate minerals cannot be weathered and removed as much under such conditions (Lopez et al., 2006; Urbat, 2009). The perennially frozen conditions below 1,250 cm bls in the YU-L15 core are reflected in overall high Si/Al ratios (Table 2; Figures 5, 7). The Zr/Al ratio is understood in a similar context indicating cooler phases by high values. Bertrand et al. (2012) demonstrate that the Zr/Al ratio is in particular sensitive in proximal sediment environments of fjords in Northern Chilean Patagonia and increases with increasing transport energy. Especially in lower core parts of YU-L15 (below 1700 cm bls), the Zr/Al values are higher on average (almost twice as high), than in YU-L7 and the talik section of YU-L15. The relatively immobile Zr was only released and removed during increasing weathering processes (Urbat, 2009; Bertrand et al., 2012). Within both cores, the Zr/Al ratio decreases upwards, which suggests warmer conditions with longer lasting thawing cycles. Lower Zr/Al values (in particular within YU-L15), can be interpreted as old sediment surfaces, where higher summer temperatures could have favored deeper active layers.
Weathering Conditions Within Thawed and Frozen Yedoma Ice Complex Deposits
We consider similar chemical composition and hardly any post-sedimentary modification of the Yedoma deposits parent material, which have, as commonly acknowledged, rather local sources from where different transport mechanisms enabled the polygenetic Yedoma formation (e.g., Schirrmeister et al., 2013). This has been shown in Schirrmeister et al. (2020) by comparing grain-size distributions and endmembers of Yedoma deposits, which revealed a localized pattern and short-distance transport. As we studied a single Yedoma site, i.e. Yukechi, we assume the same general Yedoma formation conditions here and thus a rather homogeneous chemical composition. We further assume that alas deposits formed within and from Yedoma deposits, and are largely composed of taberal and re-located Yedoma deposits, although authigenic deposition during thermokarst lake stages is expected. Thus, any further diagenetic evolution of the material as reflected by increased weathering and expressed by the values of the weathering indices refers to the same base. Although variations between the single units of each core occur (see Figures 5, 7) that allowed us to differentiate our proxies between the sediment units, with the still frozen sediments of YU-L15 as reference.
The applied weathering indices clearly indicate alternating freezing and thawing processes in the study area. Particularly during thawing phases, intensive chemical weathering processes took place due to the presence of (melt) water. Thus, all weathering indices indicated specific periods within both sediment sequences when weathering processes could have been more active. The good accordance of the indices is shown by their significant and high correlation coefficients in both cores (p < 0.001; see Supplementary Tables 3, 4). The correlations between the indices and the sand content, the mean grain size, the Si/Al, and the Sr/Ca ratio, suggests that weathering processes have mainly affected the lithogenic fraction of the sediments and thus the least pre-weathered portion. This would confirm the assumption that the parental material of the Yedoma IC deposits were hardly or not at all pre-weathered. Comparatively short transport routes and primary sedimentation under cold climatic conditions, i.e. conditions that are unfavorable for mineral weathering, could be reasons for this (Schirrmeister et al., 2020). However, these correlations are lower for the YU-L7 core, in particular with the MIA(R) index. This is probably due to the redox sensitivity of the MIA(R) index (Babechuk et al., 2014) and sustained reducing conditions in the talik zone. Contemporary sustained reducing conditions are found especially for the upper core sediments that are located immediately below the lakes. The significant negative correlation of the MIA(R) and FENG indices (positive for ICV; p < 0.001) with the GW/IC in YU-L15 confirms that (chemical) weathering processes stagnate under frozen conditions. The application of weathering indices can therefore be transferred very well to periglacial conditions in order to estimate past freezing processes.
The sampling of YU-L7 was not as detailed as for YU-L15 due to core loss. Nevertheless, homogeneous weathering conditions can be inferred from the relatively constant values of the indices. The uniform ICV values between 0.6 and 0.8 suggest only moderate mineral conversion for the YU-L7 sediments (Cox et al., 1995). Because these sediments were thawed completely, similar weathering processes likely took place throughout the YU-L7 sequence. At 1,762 cm bls and below about 1,900 cm bls, clear inhibited weathering processes are indicated by decisive indices. One explanation for this is the fluctuating expansion of the talik below the lake in connection with changing lake levels. Strongly changing lake levels including phases of complete drying out are typical for Central Yakutian alas lakes (Soloviev, 1959; Soloviev, 1973; Ulrich et al., 2017b). It is generally assumed that with loss of water bodies, taliks within the permafrost re-freeze relatively quickly from the sides (Grosse et al., 2013).
In general, the core YU-L15 is showing a much more differentiated picture for all utilized indices. Since we assume a largely homogeneous chemical composition of the parent material of both sediment sequences, we see the frozen sediments as a reference in our study on which we test our proxies comparatively. Most noticeable within YU-L15 is the significant jump in the index values within Y-SU-III. The frozen core section can clearly be structured from bottom up into three phases of weathering of different degrees (first: below about 1,700 cm bls; second: about 1,700–1,600 cm bls; and third: above about 1,600 cm bls). Starting from the lowest first phase, the weathering tendency increases to the third phase with a low during second phase. This suggests that weathering conditions have increased gradually from the bottom to top of the sediment sequence, which is associated with frequent changes of long-lasting thawing and subsequent freezing processes. Furthermore, we assume a deepening active layer caused by increasing ground temperatures, since the detected chemical weathering can take place more intensively only at higher positive temperatures and thawing permafrost (Zolkos et al., 2018).
Finally, our findings are supported by the Fe2O3/MnO ratio. The ratio of iron to manganese in sediments is known to change with the degree of oxidation (usually in lacustrine environments) during accumulation (Davison, 1993; Biskaborn et al., 2013). During reducing soil/sediment conditions, the Fe2O3/MnO ratio increases, since Mn is more soluble than Fe and is therefore faster mobilized. For YU-L7, the ratio is always above 50, which suggests sustained reducing conditions throughout the core (Lampe et al., 2016). For the frozen part of core YU-L15, a clear difference was obvious between the first and third weathering phases. Below about 1,700 cm bls, the ratio is significantly smaller than above, which in turn confirms the discussions of the FENG and MIA(R) value changes. It finally suggests that due to the long-lasting frozen state of the sediment units Y-SU-I and Y-SU-II of the Yedoma lake core, Mn was not reduced and discharged, which is reflected in lower Fe2O3/MnO ratios. The upper part of the frozen sediments has already been subject to several thawing phases and higher water availability due to rising temperatures, which is reflected in higher ratios. Since reducing anaerobic soil conditions significantly slows the degradation of organic matter (Knoblauch et al., 2012), higher TOC values for the areas of higher Fe2O3/MnO ratio could be expected. However, this correlation is not significant for the sediment cores presented here and ultimately cannot answer the question of the generally low TOC contents. In addition, higher TOC levels in the active layer can also be a sign of increasing plant production during warmer periods in the past (Schirrmeister et al., 2011).
Synthesis: Implications for Yedoma Ice Complex Deposition, Thermokarst Processes, and Paleo-Environmental Conditions
Our dating results do not allow a detailed age-depth model. Nevertheless, they suggest that the sediment sequence under the Yedoma lake was deposited quickly during MIS3. In contrast, the calibrated radiocarbon age range of the sediments under the alas lake points to a much longer sedimentation history, which extends from the MIS3 into the middle Holocene (Table 1). However, similar geochemical properties of both cores allow us to conclude that both sediment sequences originate from the same parent material and a primarily terrestrial sedimentation history. Evidence of higher terrestrial plants found throughout both cores by Jongejans et al. (2021b), indicated by the dominance of specific long-chained alkanes, corroborates the lack of lacustrine sediments even under the alas lake. The lenticular, layered and suspended cryostructures in the middle and lower section of the YU-L15 core (Figure 10) point to a gradual syngenetic freezing of the active layer of subaerial deposits, crack infilling and different rates of sedimentation (French and Shur, 2010).
Our PCA results are particularly helpful to discuss the general sedimentation environment of the Yedoma IC deposits at the Yukechi study site. In both cores, PC1 is generally determined by organic enrichment in connection with clayey-silty grain sizes on the one hand (negative sample scores) and sand-rich grain sizes, higher transport energy of sili-clastic material and conditions promoting weathering on the other hand (positive sample scores). The different distribution of the variables along PC2, however, reflects the differences between the two cores with regard to their depth-dependent thawed and/or frozen states and related redox conditions (Figures 5, 7, 9). We found that the sedimentation conditions gradually change from bottom to top, but return to conditions in the top most recent stratigraphic units comparable to those of the bottom sediment units.
For the East Siberian lowland region, Schirrmeister et al. (2013), Schirrmeister et al. (2020) developed the concept of a polygenetic Yedoma IC accumulation (including alluvial, fluvial and partly aeolian transportation) from nearby sources and syngenetic ground ice segregation, ice-wedge growth, peat aggradation, cryosol formation and cryoturbation. Furthermore, many paleo-environmental studies from NE Siberia discuss the MIS3 interstadial (57–29 ka BP), i.e. the main Yedoma IC formation period, as a climate optimum stage that was punctuated by strong climate fluctuations (Anderson and Lozhkin, 2001; Zech et al., 2008; Wetterich et al., 2014; Diekmann et al., 2017). For instance, plant macrofossils studied by Kienast et al. (2005) on Bykovsky Peninsula in the Central Laptev Sea region suggest relatively warm and moist summers even for Northern Yakutian regions with mean July temperatures above 12°C. Comparable variations in summer climate conditions in Central Yakutia could be the reason for the strong fluctuations in our proxy data, especially in the YU-L15 core. Warm and moist phases caused increased fluvial-alluvial sedimentation of sand-rich sediments, deeper active layer depths, increased mineral weathering and higher OM decomposition. In contrast, cooler and drier phases are dominated by aeolian sedimentation, inhibited weathering processes, and hampered decomposition of OM (Strauss et al., 2013; Jongejans et al., 2021b). The clearly unimodal GSDs with a high peak in the coarse silt to fine sand fraction (Figures 4, 6) and the lack of stratification within both sediment sequences indicate the high aeolian component in our sediment cores (Péwé and Journaux, 1983; Murton et al., 2015). However, Schirrmeister et al. (2020) point out that the formation of finer-grained sediments in Yedoma deposits can also be the result of severe in situ frost weathering. But, high proportion of sand in the middle sediment units of both cores and especially in Y-SU-IV of the YU-L15 core (maximum mean grain size of 260 µm) can only be explained by fluvial-alluvial transport processes (Schirrmeister et al., 2020; Windirsch et al., 2020). These were intense short events of fluvial-alluvial deposition of large sediment amounts, which we suggest to be comparable to the short time frame covered by the Yedoma lake core and the proxy cyclicity represented by the sample score variations of PC1. A representative exception in the sedimentation history of the YU-L15 core is the unit Y-SU-III, which was defined as the second weathering phase, with low indices but exceptionally high TOC values and Fe2O3/MnO ratios. All proxies in this unit indicate that short-term thermokarst processes could have taken effect here (Figure 7) and that a shallow thermokarst lake may have developed and disappeared during a very short period (Ulrich et al., 2017a). A similar proxy pattern can be seen in the A-SU-II of the alas lake core at a depth of 1,763 cm bls. However, it cannot be conclusively clarified whether these short-term processes are the same in terms of time and thaw intensity.
For the transition to the MIS2 and the Last Glacial Maximum (LGM, 26.5–19 ka BP; Clark et al., 2009), significant summer and winter cooling and arid conditions are often described for NE Siberia (Wetterich et al., 2011). Such conditions are supposed to be typical for the formation of the NE Siberian Yedoma IC deposits (Schirrmeister et al., 2013; Schirrmeister et al., 2020). We cannot identify the MIS2 based on our dating and proxy data. A Holocene cover of the Yedoma IC deposits at the Yukechi study site is also not at all visible in the YU-L15 core and even difficult to identify in the YU-L7 core. Wetterich et al. (2020) describe several hiatuses for Northeast Siberian Yedoma deposits during MIS3-2 as typical regional disturbance leading to either low accumulation and/or fluvially-triggered or climate-triggered erosion of deposited IC material. We assume that for the Yukechi study site, climate-related thawing of the permafrost and successive changes of accumulation areas during the Lateglacial to Holocene transition and/or the HTM are the reason for the lack of younger deposits.
Various studies suggest that large alas basins in Central Yakutia formed during the pronounced climate warming after the LGM and during the HTM as a result of extensive thawing processes, ground-ice melting, and subsidence of Yedoma deposits (Soloviev, 1973; Ulrich et al., 2017a; Ulrich et al., 2019). During the formation of these thermokarst basins, younger OM likely was also deposited (e.g., mobilized from thermo-erosion processes and basin expansion) as seen by the two uppermost early and mid-Holocene dates from the YU-L7 core. In contrast, the inverse age at 1,560 cm bls of YU-L7 (Table 2) is interpreted as the result of old OM incorporation already during Yedoma deposition or thermokarst lake and talik development (Gaglioti et al., 2014). The calibrated radiocarbon dates from the uppermost core sample in YU-L15 (142 ± 49 cal. yrs. BP) suggest the deposition of modern sediments during the formation of the young thermokarst lake above, but could also reflect fresh input prior to the lake phase and cryoturbation.
The questions regarding the significantly lower sand proportion in the YU-L7 core remains. Biskaborn et al. (2013) and Ulrich et al. (2019) discussed that depositional activities and grain size fractionation during thermokarst (lake) basin development might have overprinted the original sediment characteristics of the Yedoma source sediments. Concerning this, distal sediment transport after lake bank erosion or a low-energy sedimentation milieu within an expanding thermokarst lake basin could have led to a homogeneous fractionation of finer-grained sediments in a basin center as represented by the YU-L7 core site.
Conclusion
Geochemical proxies and specific weathering indices were helpful in understanding the regionally varying history of formation and decay of the Yedoma IC, and provided more detailed information about the deposition, fixation, and degradation of the OM inventory of these permafrost deposits.
We were able to show that the combination of geochemical and sedimentological properties, element ratios and certain weathering indices, reflect changing sedimentation processes, seasonal thawing depths and environmental conditions. Deeper summer thawing enabled increasing mineral weathering and initial thermokarst processes during the interstadial MIS3. In particular, the FENG and MIA(R) indices have proven to be very promising proxies for Yedoma IC deposits. The ICV gives additional information about the general mineral weathering status. Grain-size distributions, certain sedimentological proxies (i.e. Si/Al, Sr/Ca) and a typical cryostratigraphy reflect high transport energy, short transport routes and terrestrial sediment supply as interactions of fluvial, alluvial and aeolian processes as well as syngenetic permafrost aggradation. With our study we show that frozen and thawed Yedoma deposits are more heterogeneous in their sedimentological and formation conditions at regional and circumarctic level than previously thought.
Nevertheless, all geochemical and sedimentological proxies of Yedoma sediments always seem to be mixed signals of original characteristics of parent material and the influence of permafrost degradation (seen by the radiocarbon dates). The latter applies above all to the talik areas of the studied sedimentary sequences. Dissolution and leaching of certain elements and also certain grain-size fractions are the results of extensive thermokarst formation. The talik sediment properties indicate, however, pure subsidence of the thawed sediment package during late Pleistocene and Holocene thaw-related formation of alas basin and lakes. Lacustrine processes and talik evolution have only marginally influenced the geochemical properties of the thawed sediments. Rather, the general geochemical and sedimentological properties of the Yedoma IC deposits seem to have been preserved in the alas deposits. A clear determination of thermokarst and/or taberal deposits in the sense of in-situ thaw of Yedoma deposits under a large body of water and the tracing of clear diagenetic changes within the sedimentary structures in this context is therefore not possible.
Data Availability Statement
The original contributions presented in the study are included in the article/Supplementary Material, further inquiries can be directed to the corresponding author.
Author Contributions
All authors listed have made a substantial, direct, and intellectual contribution to the work and approved it for publication.
Funding
We acknowledge support from Leipzig University for Open Access Publishing. This study is based on a joint field campaign of the ERC PETA-CARB project (starting grant No. 338335) and a Deutsche Forschungsgemeinschaft (DFG) project (DFG grant No. UL426/1-1), and was carried out in cooperation with the Melnikov Permafrost Institute, Siberian Branch of Russian Academy of Sciences. SW acknowledges further support from DFG (grant No. WE4390/7-1). Additional support for this study was provided by the German Federal Environmental Foundation (DBU) and the Potsdam Graduate School.
Conflict of Interest
The authors declare that the research was conducted in the absence of any commercial or financial relationships that could be construed as a potential conflict of interest.
Publisher’s Note
All claims expressed in this article are solely those of the authors and do not necessarily represent those of their affiliated organizations, or those of the publisher, the editors and the reviewers. Any product that may be evaluated in this article, or claim that may be made by its manufacturer, is not guaranteed or endorsed by the publisher.
Acknowledgments
We greatly appreciate the efforts of all Russian and German colleagues in organizing and supporting the fieldwork and laboratory analyses. We thank in particular Pavel Konstantinov, Alexey R. Desyatkin, and Avksenty Kondakov for field and drilling assistance as well as Dyke Scheidemann, Mikaela Weiner, Hanno Meyer (Alfred Wegener Institute and the Isolab Facility) and Katja Pöhlmann (University of Leipzig) for laboratory assistance.
Supplementary Material
The Supplementary Material for this article can be found online at: https://www.frontiersin.org/articles/10.3389/feart.2021.704141/full#supplementary-material
References
Anderson, P. M., and V. Lozhkin, A. (2001). The Stage 3 Interstadial Complex (Karginskii/Middle Wisconsinan Interval) of Beringia: Variations in Paleoenvironments and Implications for Paleoclimatic Interpretations. Quat. Sci. Rev. 20, 93–125. doi:10.1016/s0277-3791(00)00129-3
Babechuk, M. G., Widdowson, M., and Kamber, B. S. (2014). Quantifying Chemical Weathering Intensity and Trace Element Release from Two Contrasting Basalt Profiles, Deccan Traps, India. Chem. Geol. 363, 56–75. doi:10.1016/j.chemgeo.2013.10.027
Bertrand, S., Hughen, K. A., Sepúlveda, J., and Pantoja, S. (2012). Geochemistry of Surface Sediments from the Fjords of Northern Chilean Patagonia (44-47°S): Spatial Variability and Implications for Paleoclimate Reconstructions. Geochim. Cosmochim. Acta 76, 125–146. doi:10.1016/j.gca.2011.10.028
Biskaborn, B. K., Herzschuh, U., Bolshiyanov, D., Savelieva, L., and Diekmann, B. (2012). Environmental Variability in Northeastern Siberia During the Last ∼ 13,300 Yr Inferred from lake Diatoms and Sediment-Geochemical Parameters. Palaeogeogr. Palaeoclimatol. Palaeoecol. 329–330, 22–36. doi:10.1016/j.palaeo.2012.02.003
Biskaborn, B. K., Herzschuh, U., Bolshiyanov, D. Y., Schwamborn, G., and Diekmann, B. (2013). Thermokarst Processes and Depositional Events in a Tundra lake, Northeastern Siberia. Permafrost Periglac. Process. 24 (3), 160–174. doi:10.1002/ppp.1769
Biskaborn, B. K., Smith, S. L., Noetzli, J., Matthes, H., Vieira, G., Streletskiy, D. A., et al. (2019). Permafrost is Warming at a Global Scale. Nat. Commun. 10, 264. doi:10.1038/s41467-018-08240-4
Blott, S. J., and Pye, K. (2001). GRADISTAT: a Grain Size Distribution and Statistics Package for the Analysis of Unconsolidated Sediments. Earth Surf. Process. Landf. 26 (11), 1237–1248. doi:10.1002/esp.261
Bosikov, N. P. (1998). Wetness Variability and Dynamics of Thermokarst Processes in Central Yakutia. Collect. Nordicana 57, 71.
Bronk Ramsey, C. (2009). Bayesian Analysis of Radiocarbon Dates. Radiocarbon 51 (1), 337–360. doi:10.1017/s0033822200033865
Buggle, B., Glaser, B., Hambach, U., Gerasimenko, N., and Marković, S. (2011). An Evaluation of Geochemical Weathering Indices in Loess-Paleosol Studies. Quat. Int. 240 (1–2), 12–21. doi:10.1016/j.quaint.2010.07.019
Clark, P. U., Dyke, A. S., Shakun, J. D., Carlson, A. E., Clark, J., Wohlfarth, B., et al. (2009). The Last Glacial Maximum. Science 325 (5941), 710–714. doi:10.1126/science.1172873
Cox, R., Lowe, D. R., and Cullers, R. L. (1995). The Influence of Sediment Recycling and Basement Composition on Evolution of Mudrock Chemistry in the Southwestern United States. Geochim. Cosmochim. Acta 59 (14), 2919–2940. doi:10.1016/0016-7037(95)00185-9
Craig, H. (1961). Isotopic Variations in Meteoric Waters. Science 133, 1702–1703. doi:10.1126/science.133.3465.1702
Czudek, T., and Demek, J. (1970). Thermokarst in Siberia and its Influence on the Development of Lowland Relief. Quat. Res. 1, 103–120. doi:10.1016/0033-5894(70)90013-x
Dansgaard, W. (1964). Stable Isotopes in Precipitation. Tellus 16, 436–468. doi:10.3402/tellusa.v16i4.8993
Davison, W. (1993). Iron and Manganese in Lakes. Earth Sci. Rev. 34 (2), 119–163. doi:10.1016/0012-8252(93)90029-7
Dean, J. F., Meisel, O. H., Martyn Rosco, M., Marchesini, L. B., Garnett, M. H., Lenderink, H., et al. (2020). East Siberian Arctic Inland Waters Emit Mostly Contemporary Carbon. Nat. Commun. 11, 1627. doi:10.1038/s41467-020-15511-6
Demina, L. L., Novichkova, E. A., Lisitzin, A. P., and Kozina, N. V. (2019). Geochemical Signatures of Paleoclimate Changes in the Sediment Cores from the Gloria and Snorri Drifts (Northwest Atlantic) Over the Holocene-Mid Pleistocene. Geosciences 9, 432. doi:10.3390/geosciences9100432
Demory, F., Oberhänsli, H., Nowaczyk, N. R., Gottschalk, M., Wirth, R., and Naumann, R. (2005). Detrital Input and Early Diagenesis in Sediments from Lake Baikal Revealed by Rock Magnetism. Glob. Planet. Change 46 (1‐4), 145–166. doi:10.1016/j.gloplacha.2004.11.010
Diekmann, B., Pestryakova, L., Nazarova, L., Subetto, D., Tarasov, P. E., Stauch, G., et al. (2017). Late Quaternary lake Dynamics in the Verkhoyansk Mountains of Eastern Siberia: Implications for Climate and Glaciation History. Polarforschung 86, 97–110. doi:10.2312/polarforschung.86.2.97
Fedorov, A. N., Gavriliev, P. P., Konstantinov, P. Y., Hiyama, T., Iijima, Y., and Iwahana, G. (2014). Estimating the Water Balance of a Thermokarst lake in the Middle of the Lena River basin, Eastern Siberia. Ecohydrol. 7 (2), 188–196. doi:10.1002/eco.1378
Fedorov, A. N., and Konstantinov, P. Y. (2009). Response of Permafrost Landscapes of Central Yakutia to Current Changes of Climate, and Anthropogenic Impacts. Geogr. Nat. Resour. 30, 146–150. doi:10.1016/j.gnr.2009.06.010
Feng, Z.-D. (1997). Geochemical Characteristics of a Loess-Soil Sequence in Central Kansas. Soil Sci. Soc. Am. J. 61, 534–541. doi:10.2136/sssaj1997.03615995006100020023x
Fischer, P., Hilgers, A., Protze, J., Kels, H., Lehmkuhl, F., and Gerlach, R. (2012). Formation and Geochronology of Last Interglacial to Lower Weichselian Loess/palaeosol Sequences - Case Studies from the Lower Rhine Embayment, Germany. E&G Quat. Sci. J. 61 (1), 48–63. doi:10.23689/fidgeo-174810.3285/eg.61.1.04
French, H., and Shur, Y. (2010). The Principles of Cryostratigraphy. Earth Sci. Rev. 101, 190–206. doi:10.1016/j.earscirev.2010.04.002
Gaglioti, B. V., Mann, D. H., Jones, B. M., Pohlman, J. W., Kunz, M. L., and Wooller, M. J. (2014). Radiocarbon Age-Offsets In An Arctic Lake Reveal The Long-Term Response of Permafrost Carbon To Climate Change. J. Geophys. Res.-Biogeo. 119 (8), 1630–1651. doi:10.1002/2014JG002688
Grosse, G., Jones, B., and Arp, C. (2013). “8.21 Thermokarst Lakes, Drainage, and Drained Basins,” in Treatise on Geomorphology. Editor J. F. Shroder (San Diego, CA: Academic Press), 325–353. doi:10.1016/b978-0-12-374739-6.00216-5
Haberzettl, T., Corbella, H., Fey, M., Janssen, S., Lücke, A., Mayr, C., et al. (2007). Lateglacial and Holocene Wet-Dry Cycles in Southern Patagonia: Chronology, Sedimentology and Geochemistry of a Lacustrine Record from Laguna Potrok Aike, Argentina. Holocene 17, 297–310. doi:10.1177/0959683607076437
Heslop, J. K., Walter Anthony, K. M., Winkel, M., Sepulveda-Jauregui, A., Martinez-Cruz, K., Bondurant, A., et al. (2020). A Synthesis of Methane Dynamics in Thermokarst Lake Environments. Earth Sci. Rev. 210, 103365. doi:10.1016/j.earscirev.2020.103365
Hugelius, G., Strauss, J., Zubrzycki, S., Harden, J. W., Schuur, E. A. G., Ping, C.-L., et al. (2014). Estimated Stocks of Circumpolar Permafrost Carbon with Quantified Uncertainty Ranges and Identified Data Gaps. Biogeosciences 11, 6573–6593. doi:10.5194/bg-11-6573-2014
Iijima, Y., Fedorov, A. N., Park, H., Suzuki, K., Yabuki, H., Maximov, T. C., et al. (2010). Abrupt Increases in Soil Temperatures Following Increased Precipitation in a Permafrost Region, Central Lena River basin, Russia. Permafrost Periglac. Process. 21, 30–41. doi:10.1002/ppp.662
Johansson, E., Gustafsson, L.-G., Berglund, S., Lindborg, T., Selroos, J.-O., Claesson Liljedahl, L., et al. (2015). Data Evaluation and Numerical Modeling of Hydrological Interactions between Active Layer, lake and Talik in a Permafrost Catchment, Western Greenland. J. Hydrol. 527, 688–703. doi:10.1016/j.jhydrol.2015.05.026
Jongejans, L. L., Liebner, S., Knoblauch, C., Mangelsdorf, K., and Strauss, J. (2021b). Dissolved Organic Carbon Content in Thawed Sediments underneath a Yedoma and Alas Thermokarst lake in Eastern Siberia. PANGAEA. doi:10.1594/PANGAEA.928136
Jongejans, L. L., Liebner, S., Knoblauch, C., Mangelsdorf, K., Ulrich, M., Grosse, G., et al. (2021a). Greenhouse Gas Production and Lipid Biomarker Distribution in Yedoma and Alas Thermokarst Lake Sediments in Eastern Siberia. Glob. Change Biol. 27 (12), 2822–2839. doi:10.1111/gcb.15566
Kienast, F., Schirrmeister, L., Siegert, C., and Tarasov, P. (2005). Palaeobotanical Evidence for Warm Summers in the East Siberian Arctic during the Last Cold Stage. Quat. Res. 63, 283–300. doi:10.1134/S004451341911010210.1016/j.yqres.2005.01.003
Knoblauch, C., Beer, C., Sosnin, A., Wagner, D., and Pfeiffer, E.-M. (2013). Predicting Long-Term Carbon Mineralization and Trace Gas Production from Thawing Permafrost of Northeast Siberia. Glob. Change Biol. 19 (4), 1160–1172. doi:10.1111/gcb.12116
Kokelj, S. V., Lacelle, D., Lantz, T. C., Tunnicliffe, J., Malone, L., Clark, I. D., et al. (2013). Thawing of Massive Ground Ice in Mega Slumps Drives Increases in Stream Sediment and Solute Flux across a Range of Watershed Scales. J. Geophys. Res. Earth Surf. 118, 681–692. doi:10.1002/jgrf.20063
Lacelle, D., Juneau, V., Pellerin, A., Lauriol, B., and Clark, I. D. (2008). Weathering Regime and Geochemical Conditions in a Polar Desert Environment, Haughton Impact Structure Region, Devon Island, Canada. Can. J. Earth Sci. 45 (10), 1139–1157. doi:10.1139/E08-063
Lampe, R., Janke, W., Schult, M., Meng, S., and Lampe, M. (2016). Multiproxy-Untersuchungen zur Paläoökologie und -hydrologie eines spätglazial- bis frühholozänen Flachsees im nordostdeutschen Küstengebiet (Glowe-Paläosee/Insel Rügen). E&G Quat. Sci. J. 65 (1), 41–75. doi:10.3285/eg.65.1.03
Lopez, P., Navarro, E., Marce, R., Ordoñez, J., Caputo, L., and Armengol, J. (2006). Elemental Ratios in Sediments as Indicators of Ecological Processes in Spanish Reservoirs. Limnetica 25 (1–2), 499–512.
Martens, J., Wild, B., Muschitiello, F., O’Regan, M., Jakobsson, M., Semiletov, I., et al. (2020). Remobilization of Dormant Carbon from Siberian-Arctic Permafrost During Three Past Warming Events. Sci. Adv. 6, eabb6546. doi:10.1126/sciadv.abb6546
McKinney, W. (2010). “Data Structures for Statistical Computing in Python,” in Proceedings of the 9th Python in Science Conference, Austin, TX, USA, June 28–July 3. Editor S. van der Walt, and K.J. Millman, 56–61. Available at: http://conference.scipy.org/proceedings/scipy2010/pdfs/mckinney.pdf.
Meyer, H., Schönicke, L., Wand, U., Hubberten, H. W., and Friedrichsen, H. (2000). Isotope Studies of Hydrogen and Oxygen in Ground Ice - Experiences with the Equilibration Technique. Isotopes Environ. Health Stud. 36, 133–149. doi:10.1080/10256010008032939
Mollenhauer, G., Grotheer, H., Gentz, T., Bonk, E., and Hefter, J. (2021). Standard Operation Procedures and Performance of the MICADAS Radiocarbon Laboratory at Alfred Wegener Institute (AWI), Germany. Nucl. Instrum. Methods Phys. Res. Section B: Beam Interactions Mater. Atoms 496, 45–51. doi:10.1016/j.nimb.2021.03.016
Murton, J. B., Goslar, T., Edwards, M. E., Bateman, M. D., Danilov, P. P., Savvinov, G. N., et al. (2015). Palaeoenvironmental Interpretation of Yedoma silt (Ice Complex) Deposition as Cold-Climate Loess, Duvanny Yar, Northeast Siberia. Permafrost Periglac. Process 26, 208–288. doi:10.1002/ppp.1843
Muster, S., Riley, W. J., Roth, K., Langer, M., Cresto Aleina, F., Koven, C. D., et al. (2019). Size Distributions of Arctic Waterbodies Reveal Consistent Relations in Their Statistical Moments in Space and Time. Front. Earth Sci. 7, 5. doi:10.3389/feart.2019.00005
Nitze, I., Grosse, G., Jones, B., Arp, C., Ulrich, M., Fedorov, A., et al. (2017). Landsat-Based Trend Analysis of lake Dynamics across Northern Permafrost Regions. Remote Sens. 9 (7), 640. doi:10.3390/rs9070640
Opel, T., Murton, J. B., Wetterich, S., Meyer, H., Ashastina, K., Günther, F., et al. (2019). Past Climate and Continentality Inferred from Ice Wedges at Batagay Megaslump in the Northern Hemisphere's Most continental Region, Yana Highlands, Interior Yakutia. Clim. Past 15, 1443–1461. doi:10.5194/cp-15-1443-2019
Opfergelt, S. (2020). The Next Generation of Climate Model Should Account for the Evolution of Mineral-Organic Interactions with Permafrost Thaw. Environ. Res. Lett. 15, 091003. doi:10.1088/1748-9326/ab9a6d
Papina, T., Malygina, N., Eirikh, A., Galanin, A., and Zheleznyak, M. (2017). Isotopic Composition And Sources of Atmospheric Precipitation In Central Yakutia. Earth’s Cryosphere 21, 52–61. doi:10.21782/EC2541-9994-2017-1(52-61)
Pedregosa, F., Varoquaux, G., Gramfort, A., Michel, V., Thirion, B., Grisel, O., et al. (2011). Scikit-Learn: Machine Learning in Python. J. Mach. Learn. Res. 12, 2825–2830.
Pestryakova, L. A., Herzschuh, U., Wetterich, S., and Ulrich, M. (2012). Present-Day Variability and Holocene Dynamics of Permafrost-Affected Lakes in central Yakutia (Eastern Siberia) Inferred from Diatom Records. Quat. Sci. Rev. 51, 56–70. doi:10.1016/j.quascirev.2012.06.020
Péwé, T. L., and Journaux, A. (1983). Origin and Character of Loess-Like Silt in Unglaciated South-Central Yakutia, Siberia, USSR. USGS Prof. Pap. 1262, 1–45.
Popp, S., Diekmann, B., Meyer, H., Siegert, C., Syromyatnikov, I., and Hubberten, H.-W. (2006). Palaeoclimate Signals as Inferred from Stable-Isotope Composition of Ground Ice in the Verkhoyansk Foreland, Central Yakutia. Permafrost Periglac. Process. 17, 119–132. doi:10.1002/ppp.556
Reimer, P., Austin, W., Bard, E., Bayliss, A., Blackwell, P., Bronk Ramsey, C., et al. (2020). The IntCal20 Northern Hemisphere Radiocarbon Age Calibration Curve (0–55 cal kBP). Radiocarbon 62, 725–757. doi:10.1017/rdc.2020.41
Roeser, P., Franz, S. O., and Litt, T. (2016). Aragonite and Calcite Preservation in Sediments from Lake Iznik Related to Bottom lake Oxygenation and Water Column Depth. Sedimentology 63 (7), 2253–2277. doi:10.1111/sed.12306
Santoro, M., and Strozzi, T. (2012). Circumpolar Digital Elevation Models > 55° N with Links to Geotiff Images. PANGAEA. doi:10.1594/PANGAEA.779748
Schatz, A.-K., Scholten, T., and Kühn, P. (2015). Paleoclimate and Weathering of the Tokaj (Hungary) Loess-Paleosol Sequence. Palaeogeogr. Palaeoclimatol. Palaeoecol. 426, 170–182. doi:10.1016/j.palaeo.2015.03.016
Schirrmeister, L., Dietze, E., Matthes, H., Grosse, G., Strauss, J., Laboor, S., et al. (2020). The Genesis of Yedoma Ice Complex Permafrost - Grain-Size Endmember Modeling Analysis from Siberia and Alaska. E&G Quat. Sci. J. 69, 33–53. doi:10.5194/egqsj-69-33-2020
Schirrmeister, L., Froese, D., Tumskoy, V., Grosse, G., and Wetterich, S. (2013). “Yedoma: Late Pleistocene Ice-Rich Syngenetic Permafrost of Beringia,” in The Encyclopedia of Quaternary Science. Editor S.A. Elias (Amsterdam: Elsevier) Vol. 3, 542–552.
Schirrmeister, L., Kunitsky, V., Grosse, G., Wetterich, S., Meyer, H., Schwamborn, G., et al. (2011). Sedimentary Characteristics and Origin of the Late Pleistocene Ice Complex on north-east Siberian Arctic Coastal Lowlands and Islands – A Review. Quat. Int. 241 (1–2), 3–25. doi:10.1016/j.quaint.2010.04.004
Schuur, E. A. G., McGuire, A. D., Schädel, C., Grosse, G., Harden, J. W., Hayes, D. J., et al. (2015). Climate Change and the Permafrost Carbon Feedback. Nature 520, 171–179. doi:10.1038/nature14338
Schwamborn, G., Schirrmeister, L., Frütsch, F., and Diekmann, B. (2012). Quartz Weathering in Freeze-Thaw Cycles: experiment and Application to the el'gygytgyn Crater Lake Record for Tracing Siberian Permafrost History. Geografiska Annaler: Ser. A, Phys. Geogr. 94, 481–499. doi:10.1111/j.1468-0459.2012.00472.x
Siegert, C. (1987). Greigite and Mackinawite in Quaternary Deposits of central Yakutia. Mineral. Zh. 9 (5), 75–81.
Siegert, C. (1979). “Minerologic-petrographic Characteristic of Alas Deposits,” in Structure and Absolute Geochronology of Alas Deposits in Central Yakutia. Editor E. M. Katasonov (Moscow: Nauka), 44–61.
Soloviev, P. A. (1959). Cryolithic Zone of the Northern Part of Lena-Amga Interfluve. Moscow: Izdatel’stvo Akademii SSSR, 142.
Soloviev, P. A. (1973). Thermokarst Phenomena and Landforms Due to Frost Heaving in Central Yakutia. Biuletyn Peryglacjalny 23, 135–155.
Strauss, J., Laboor, S., Fedorov, A. N., Fortier, D., Froese, D., Fuchs, M., et al. (2016). Database of Ice-Rich Yedoma Permafrost (IRYP). PANGAEA. doi:10.1594/PANGAEA.861733
Strauss, J., Schirrmeister, L., Grosse, G., Fortier, D., Hugelius, G., Knoblauch, C., et al. (2017). Deep Yedoma Permafrost: A Synthesis of Depositional Characteristics and Carbon Vulnerability. Earth Sci. Rev. 172, 75–86. doi:10.1016/j.earscirev.2017.07.007
Strauss, J., Schirrmeister, L., Grosse, G., Wetterich, S., Ulrich, M., Herzschuh, U., et al. (2013). The Deep Permafrost Carbon Pool of the Yedoma Region in Siberia and Alaska. Geophys. Res. Lett. 40, 6165–6170. doi:10.1002/2013GL058088
Strauss, J., Schirrmeister, L., Mangelsdorf, K., Eichhorn, L., Wetterich, S., and Herzschuh, U. (2015). Organic-Matter Quality of Deep Permafrost Carbon - A Study from Arctic Siberia. Biogeosciences 12, 2227–2245. doi:10.5194/bg-12-2227-2015
Tarasenko, T. V. (2013). Interannual Variations in the Areas of Thermokarst Lakes in Central Yakutia. Water Resour. 40 (2), 111–119. doi:10.1134/S0097807813010107
Troyanskaya, O., Cantor, M., Sherlock, G., Brown, P., Hastie, T., Tibshirani, R., et al. (2001). Missing Value Estimation Methods for DNA Microarrays. Bioinformatics 17 (6), 520–525. doi:10.1093/bioinformatics/17.6.520
Turetsky, M. R., Abbott, B. W., Jones, M. C., Anthony, K. W., Olefeldt, D., Schuur, E. A. G., et al. (2020). Carbon Release through Abrupt Permafrost Thaw. Nat. Geosci. 13, 138–143. doi:10.1038/s41561-019-0526-0
Turner, K. W., Wolfe, B. B., Edwards, T. W. D., Lantz, T. C., Hall, R. I., and Larocque, G. (2014). Controls on Water Balance of Shallow Thermokarst Lakes and Their Relations with Catchment Characteristics: a Multi-Year, Landscape-Scale Assessment Based on Water Isotope Tracers and Remote Sensing in Old Crow Flats, Yukon (Canada). Glob. Change Biol. 20, 1585–1603. doi:10.1111/gcb.12465
Ulrich, M., Grosse, G., Strauss, J., and Schirrmeister, L. (2014). Quantifying Wedge-Ice Volumes in Yedoma and Thermokarst Basin Deposits. Permafrost Periglac. Process. 25, 151–161. doi:10.1002/ppp.1810
Ulrich, M., Matthes, H., Schirrmeister, L., Schütze, J., Park, H., Iijima, Y., et al. (2017b). Differences in Behavior and Distribution of Permafrost‐Related Lakes in Central Yakutia and Their Response to Climatic Drivers. Water Resour. Res. 53 (2), 1167–1188. doi:10.1002/2016WR019267
Ulrich, M., Matthes, H., Schmidt, J., Fedorov, A. N., Schirrmeister, L., Siegert, C., et al. (2019). Holocene Thermokarst Dynamics in Central Yakutia - A Multi-Core and Robust Grain-Size Endmember Modeling Approach. Quat. Sci. Rev. 218, 10–33. doi:10.1016/j.quascirev.2019.06.010
Ulrich, M., Wetterich, S., Rudaya, N., Frolova, L., Schmidt, J., Siegert, C., et al. (2017a). Rapid Thermokarst Evolution During the Mid-Holocene in Central Yakutia, Russia. Holocene 27 (12), 1899–1913. doi:10.1177/0959683617708454
Urbat, I. (2009). Oceanic Anoxic Event (OAE) 1b - High Resolution Geochemical Studies, Mazagan Plateau and Vocontian Basin. PhD thesis. Cologne, Germany: University of Cologne, 125.
Vallat, R. (2018). Pingouin: Statistics in Python. J. Open Source Softw. 3 (31), 1026. doi:10.21105/joss.01026
Walter Anthony, K., Schneider von Deimling, T., Nitze, I., Frolking, S., Emond, A., Daanen, R., et al. (2018). 21st-Century Modeled Permafrost Carbon Emissions Accelerated by Abrupt Thaw beneath Lakes. Nat. Commun. 9, 3262. doi:10.1038/s41467-018-05738-9
Wegwerth, A., Dellwig, O., Kaiser, J., Ménot, G., Bard, E., Shumilovskikh, L., et al. (2014). Meltwater Events and the Mediterranean Reconnection at the Saalian-Eemian Transition in the Black Sea. Earth Planet. Sci. Lett. 404, 124–135. doi:10.1016/j.epsl.2014.07.030
Weiss, N., Blok, D., Elberling, B., Hugelius, G., Jørgensen, C. J., Siewert, M. B., et al. (2016). Thermokarst Dynamics and Soil Organic Matter Characteristics Controlling Initial Carbon Release from Permafrost Soils in the Siberian Yedoma Region. Sediment. Geol. 340, 38–48. doi:10.1016/j.sedgeo.2015.12.004
Wetterich, S., Herzschuh, U., Meyer, H., Pestryakova, L., Plessen, B., Lopez, C. M. L., et al. (2008). Evaporation Effects as Reflected in Freshwaters and Ostracod Calcite from Modern Environments in Central and Northeast Yakutia (East Siberia, Russia). Hydrobiologia 614, 171–195. doi:10.1007/s10750-008-9505-y
Wetterich, S., Kizyakov, A., Fritz, M., Wolter, J., Mollenhauer, G., Meyer, H., et al. (2020). The Cryostratigraphy of the Yedoma Cliff of Sobo-Sise Island (Lena delta) Reveals Permafrost Dynamics in the central Laptev Sea Coastal Region During the Last 52 kyr. Cryosphere 14, 4525–4551. doi:10.5194/tc-14-4525-2020
Wetterich, S., Rudaya, N., Tumskoy, V., Andreev, A. A., Opel, T., Schirrmeister, L., et al. (2011). Last Glacial Maximum Records in Permafrost of the East Siberian Arctic. Quat. Sci. Rev. 30, 3139–3151. doi:10.1016/j.quascirev.2011.07.020
Wetterich, S., Tumskoy, V., Rudaya, N., Andreev, A. A., Opel, T., Meyer, H., et al. (2014). Ice Complex Formation in Arctic East Siberia during the MIS3 Interstadial. Quat. Sci. Rev. 84, 39–55. doi:10.1016/j.quascirev.2013.11.009
Wien, K., Kölling, M., and Schulz, H. D. (2005). Close Correlation between Sr/Ca Ratios in Bulk Sediments from the Southern Cape Basin and the SPECMAP Record. Geo. Mar. Lett. 25, 265–271. doi:10.1007/s00367-005-0211-8
Windirsch, T., Grosse, G., Ulrich, M., Schirrmeister, L., Fedorov, A. N., Konstantinov, P. Y., et al. (2020). Organic Carbon Characteristics in Ice-Rich Permafrost in Alas and Yedoma Deposits, central Yakutia, Siberia. Biogeosciences 17, 3797–3814. doi:10.5194/bg-17-3797-2020
Zech, M., Zech, R., Zech, W., Glaser, B., Brodowski, S., and Amelung, W. (2008). Characterisation and Palaeoclimate of a Loess-Like Permafrost Palaeosol Sequence in NE Siberia. Geoderma 143 (3–4), 281–295. doi:10.1016/j.geoderma.2007.11.012
Zolkos, S., and Tank, S. E. (2020). Experimental Evidence that Permafrost Thaw History and Mineral Composition Shape Abiotic Carbon Cycling in Thermokarst-Affected Stream Networks. Front. Earth Sci. 8, 152. doi:10.3389/feart.2020.00152
Keywords: inorganic geochemistry characteristics, weathering indices, thermokarst landscapes, Siberia (Russia), environmental reconstruction, permafrost, XRF (X-ray fluorescence analysis), talik
Citation: Ulrich M, Jongejans LL, Grosse G, Schneider B, Opel T, Wetterich S, Fedorov AN, Schirrmeister L, Windirsch T, Wiedmann J and Strauss J (2021) Geochemistry and Weathering Indices of Yedoma and Alas Deposits beneath Thermokarst Lakes in Central Yakutia. Front. Earth Sci. 9:704141. doi: 10.3389/feart.2021.704141
Received: 01 May 2021; Accepted: 31 July 2021;
Published: 11 August 2021.
Edited by:
Daniel Nývlt, Masaryk University, CzechiaReviewed by:
Sophie Opfergelt, Catholic University of Louvain, BelgiumJulien Fouché, Montpellier SupAgro, France
Copyright © 2021 Ulrich, Jongejans, Grosse, Schneider, Opel, Wetterich, Fedorov, Schirrmeister, Windirsch, Wiedmann and Strauss. This is an open-access article distributed under the terms of the Creative Commons Attribution License (CC BY). The use, distribution or reproduction in other forums is permitted, provided the original author(s) and the copyright owner(s) are credited and that the original publication in this journal is cited, in accordance with accepted academic practice. No use, distribution or reproduction is permitted which does not comply with these terms.
*Correspondence: Mathias Ulrich, bWF0aGlhcy51bHJpY2hAdW5pLWxlaXB6aWcuZGU=