 Joseph M. Shea
 Philip D. A. Kraaijenbrink
 Walter W. Immerzeel
 Fanny Brun
- 1Department of Geography, Earth, and Environmental Science, University of Northern British Columbia, Prince George, BC, Canada
- 2Department of Physical Geography, Utrecht University, Utrecht, Netherlands
- 3Université Grenoble Alpes, CNRS, IRD, Grenoble, France
Debris-covered glaciers represent potentially significant stores of freshwater in river basins throughout High Mountain Asia (HMA). Direct glacier mass balance measurements are extremely difficult to maintain on debris-covered glaciers, and optical remote sensing techniques to evaluate annual equilibrium line altitudes (ELAs) do not work in regions with summer-accumulation type glaciers. Surface elevation and glacier velocity change have been calculated previously for debris-covered glaciers across the region, but the response of debris cover itself to climate change remains an open question. In this research we propose a new metric, i.e. the debris emergence elevation (ZDE), which can be calculated from a combination of optical and thermal imagery and digital elevation data. We quantify ZDE for 975 debris-covered glaciers in HMA over three compositing periods (1985–1999, 2000–2010, and 2013–2017) and compare ZDE against median glacier elevations, modelled ELAs, and observed rates of both mass change and glacier velocity change. Calculated values of ZDE for individual glaciers are broadly similar to both median glacier elevations and modelled ELAs, but slightly lower than both. Across the HMA region, the average value of ZDE increased by 70 +/− 126 m over the study period, or 2.7 +/− 4.1 m/yr. Increases in ZDE correspond with negative mass balance rates and decreases in glacier velocity, while glaciers and regions that show mass gains and increases in glacier velocity experienced decreases in ZDE. Regional patterns of ZDE, glacier mass balance, and glacier velocities are strongly correlated, which indicates continued overall increases in ZDEE and expansion of debris-covered areas as glaciers continue to lose mass. Our results suggest that ZDE is a useful metric to examine regional debris-covered glacier changes over decadal time scales, and could potentially be used to reconstruct relative mass and ELA changes on debris-covered glaciers using historical imagery or reconstructed debris cover extents.
Introduction
Glacier changes in High Mountain Asia (HMA; Figure 1) have been quantified through in situ glaciological measurements (Vincent et al., 2013; Wagnon et al., 2013; Azam et al., 2016), surface elevation differencing (Bolch et al., 2011; Gardelle et al., 2012; Wang et al., 2014; Kääb et al., 2015; Maurer et al., 2016; Brun et al., 2017; Maurer et al., 2019; Shean et al., 2020), models of glacier mass balance (Braun et al., 1993; Collier et al., 2013; Shea et al., 2015; Engelhardt et al., 2017), and changes in glacier velocity (Dehecq et al., 2019). Annual equilibrium line altitudes (ELAs), the elevation where annual mass balance (ba) equals zero, are highly correlated with annual net glacier mass balance (Ba; (Yinsheng et al., 1998; Benn and Lehmkuhl, 2000; Rabatel et al., 2017), and are also a key indicator of the glacier status.
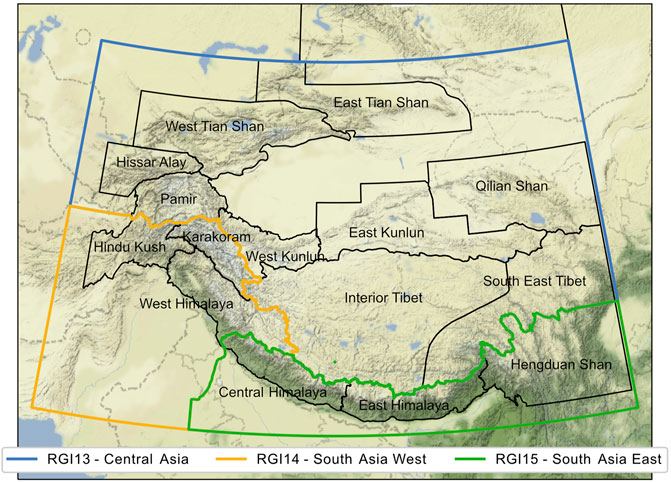
FIGURE 1. Study area map with Randolph Glacier Inventory regions (Table 1) and High Mountain Asia sub-regions (Table 2).
On temperate mid-latitude glaciers, ELAs can be inferred from the elevation of the transient snowline at the end of the ablation season (Rabatel et al., 2005; Rabatel et al., 2013; Shea et al., 2013) or glacier reflectivity (Brun et al., 2015). In tropical/subtropical regions where accumulation and ablation occur simultaneously, the transient snowline is not correlated to the ELA (Ageta and Higuchi, 1984; Brun et al., 2015). Median glacier elevations (Zmed) are highly correlated with glaciologically determined ELAs (Carrivick and Brewer, 2004; Machguth et al., 2012), though the exact relation varies with glacier type and region (Braithwaite, 1984) and the presence of debris cover (Owen and Benn, 2005; Robson et al., 2016).
Debris-covered glaciers are defined as glaciers with a layer of supraglacial debris that covers some portion of their tongue (Cogley et al., 2011). They are common in many mountain regions (Alaska, European Alps, New Zealand, Coast Ranges of British Columbia, and the Andes), and in High Mountain Asia it is estimated that 10% of the total glacierized area is covered by debris (Scherler et al., 2011; Kraaijenbrink et al., 2017; Scherler et al., 2018). Debris is introduced to the glacier through either mass movements onto the glacier surface from adjoining rock walls or lateral moraines (rockfall, debris flow), or subglacial erosion (Kirkbride, 2011). Supraglacial or englacial debris is then transported down-glacier and becomes thickest at lower elevations where ablation rates are typically highest for debris-free glaciers (Benn and Ballantyne, 1994; van Woerkom et al., 2019). Changes in debris-covered area have been used to infer relative glacier status (Herreid et al., 2015) within HMA, but as glaciological mass balance measurements on debris-covered glaciers are notoriously difficult to maintain, there are few direct estimates of ELAs and glacier mass balance on debris-covered glaciers.
Observational and modelling studies demonstrate that the presence of a debris cover leads to longer glacier lengths and lower accumulation area ratios (AAR; (Scherler, Bookhagen and Strecker, 2011; Anderson and Anderson, 2016; Banerjee, 2017). In a warming climate, increased melt and decreased accumulation will lead to higher ELAs and transient decreases in AAR, reduced ice transport and glacier velocities, and increased ice ablation and mass loss (Shea and Immerzeel, 2016; Dehecq et al., 2019). We hypothesize that debris-covered glaciers with increased mass loss would experience accelerated debris melt-out and locally enhanced ablation rates. This will lead to an up-glacier expansion of the debris-covered area, and ZDE should increase. Conversely, debris-covered glaciers experiencing mass gain (Sakai and Fujita, 2017; de Kok et al., 2018; Farinotti et al., 2020) would exhibit increased ice transport from higher elevations and decreases in ZDE.
Expansion or contraction of ZDE will likely occur over decadal time scales (Anderson and Anderson, 2016) and changes in ZDE could thus be used to infer long-term trends in glacier mass balance as an alternative or complementary approach to geodetic methods based on DEM differencing. Using existing glacier inventories (Pfeffer et al., 2014) and a method for debris cover delineation (Kraaijenbrink et al., 2017), we construct composites of debris cover for three time periods and extract values of ZDE for individual debris-covered glaciers in HMA. We then examine relations between ZDE, median glacier elevations, modelled ELAs, and observed mass balances and velocity changes.
Data and Methods
To examine changes in debris cover and ZDE, debris masks were calculated for three different time periods (1985–1999; 2000–2010; 2013–2017) using both optical and thermal imagery. Elevation data from the Shuttle Radar Topography Mission (SRTM, collected in 2000) was then used to calculate elevation statistics for debris-covered portions of each HMA glacier in the Randolph Glacier Inventory (Pfeffer et al., 2014). Modelled (Kraaijenbrink et al., 2017) and observed mass balance rates (Brun et al., 2017) and trends in glacier velocity (Dehecq et al., 2019) for individual debris-covered glaciers were used to independently evaluate the trends in ZDE. While the total number of debris-covered glaciers in HMA is over 7,000, our analysis includes only 1) debris-covered glaciers larger than 5 km2 to match the analysis of Dehecq et al., (2018), and 2) glaciers that have more than 10% of their area below the median elevation covered by debris.
Debris Cover Masks
Debris cover masks were mapped for all HMA glaciers using RGI glacier extents and a normalized difference snow index (NDSI; Hall et al., 1995) calculated from multi-year composites of Landsat imagery (www.usgs.gov). We preferentially select pixels with the highest surface brightness temperatures to construct the NDSI mosaics, which will reduce classification errors due to clouds, shadows, or the presence of snow. An NDSI threshold of 0.25 was then used to classify pixels within RGI glacier extents as either snow/ice (NDSI>0.25) or debris (NDSI<0.25). The classification procedure was performed in Google Earth Engine (GEE) and full details on the classification algorithm and accuracy are given in Kraaijenbrink et al. (2017; https://doi.org/10.5281/zenodo.2548690). Glacier IDs were assigned to each debris-covered glacier in the analysis using the Randolph Glacier Inventory (RGI V5; RGI Consortium, 2017), and a resulting geodatabase was created and populated with data from this analysis and from other sources (see below). The average date and day of year (DOY) of acquisition for each glacier was also extracted from GEE and assigned to the geodatabase (Supplementary Figures S1, S2), and used to assess temporal trends in ZDE and the possibility of bias related to the DOY of acquisition.
Median Glacier Elevation, Debris Emergence Elevation, and Modelled ELA
For each glacier retained in the analysis, a median glacier elevation (Zmed) was extracted from the gap-filled, 90 m resolution SRTM V3.0 elevation data that was collected in February 2000 (Farr et al., 2007). While SRTM accuracy decreases with increasing slope angle (Mukul et al., 2017), the debris-covered glaciers we focus on typically have lower angle slopes. To estimate ZDE, the boundary between debris-free and debris-covered ice was mapped as a polyline, and the median elevation of this contour was extracted from SRTM data (Figure 2). Taking this conservative approach ensures that narrow medial moraines which can extend far up-glacier (or conversely, bare ice patches that extend downglacier) do not affect the determination of ZDE. Alternative approaches for estimation of ZDE (such as using percentiles of elevation for debris-covered pixels) were tested but these produced a wider range of possible values (Supplementary Material), and did not correspond to other ELA metrics (see below). A modelled ELA (ELAmod) for each glacier, based on mass balance gradient constructed from a degree-day climatology, gridded precipitation (Kraaijenbrink et al., 2017), and the SRTM data, is included as a comparison against median glacier elevations and ZDE. Values of Zmed, ZDE, and ELAmod were assigned to each debris-covered glacier in the geodatabase.
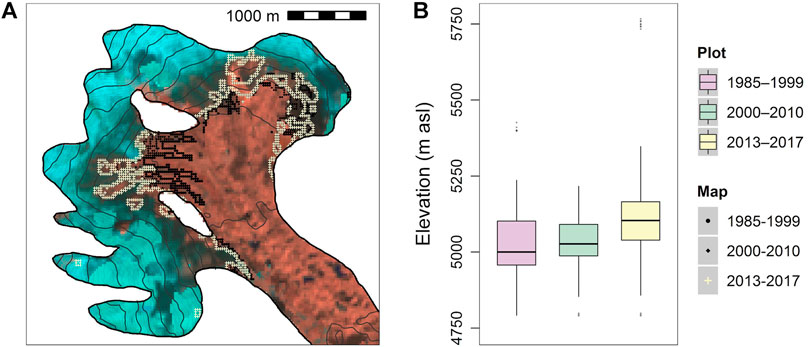
FIGURE 2. Example of a debris-covered glacier (RGI50-15.02637, 90.51N, 28.04E), with (A) two delineations of ice/debris, and (B) boxplots of extracted elevations.
Rates of Change: ZDE
Rates of ZDE change (dZDE/dt; m yr−1) were calculated for each glacier using a linear regression between the glacier-averaged dates of acquisition for the debris cover composites and the corresponding value of ZDE. Positive values of dZDE/dt indicate an increase in ZDE and are likely associated with increased ELAs, more negative net mass balances, and decreased glacier velocities (Dehecq et al., 2019). Negative values of dZDE/dt indicate decreased ELAs and positive mass balances or glacier surges. To exclude both surge-type glaciers and other outliers from affecting our analysis, dZDE/dt values greater than or less than two standard deviations from the mean (5% of all glaciers) were removed prior to analysis and plotting.
Rates of Change: Glacier Mass Balance
Rates of mass change between 2000 and 2016 have been calculated previously for 6,350 glaciers in the HMA region using time series of digital elevation models constructed from re-processed ASTER imagery (Brun et al., 2017). Linear regressions of surface elevation against time were performed for each 30-m glacierized pixel, and outliers were excluded to calculate trends in surface elevation (m yr−1). For each glacier, surface elevation trends were aggregated to 100 m elevation bands, and then converted to net glacier mass change with an assumed density of 850 kg m−3 (Huss, 2013). Net glacier mass balances calculated by Brun et al. (2017) were then merged with the debris-covered database of this study on the RGI V5 glacier ID.
Rates of Change: Glacier Velocity
For each debris-covered glacier in our database, we assign a change in glacier velocity using the dataset produced by Dehecq et al. (2019). Systematic surface feature tracking was applied to a database of Landsat-7 pairs between 1999 and 2017 to estimate gridded annual surface velocities at a grid resolution of 240 m. Trends in glacier velocity were then calculated from the annual velocity estimates, and extrapolated to the year 2000 to establish an initial velocity field. The median percent change in glacier velocity from 2000 to 2016 for each RGI glacier was then extracted from all grid points below the median glacier elevation, and we merge this final dataset with our geodatabase on the RGI ID. Full details on the calculation of glacier velocity changes and their uncertainties can be found in Dehecq et al. (2019).
Analyses
The total number of debris covered glaciers mapped for this analysis is N = 7,457. We exclude debris-covered glaciers less than 5 km2 to match the glacier velocity inventory of Dehecq et al. (2018), and we also exclude glaciers where the debris covered area is less than 10% of the area below the ELA, which leaves N = 976. RGI regions 13 (South Asia East), 14 (South Asia West) and 15 (Central Asia) are used to broadly classify the studied glaciers, and reflect substantial differences in climate and topography (Figure 1). We first examine distributions of Zmed, ZDE, and ELAmod. Rates of ZDE change are then compared with observed rates of mass change within each region. We also compare the spatial pattern of dZDE/dt with the spatial pattern of geodetic mass balances (Brun et al., 2017) and trends in glacier velocity (Dehecq et al., 2019). We then subdivide the RGI regions into smaller sub-regions based on mountain ranges identified in Kraaijenbrink et al. (2017) and compare sub-regional means.
Results
Median Glacier Elevation, Debris Emergence Elevation, and Modelled ELA
Distributions of Zmed, ZDE, and ELAmod (Figure 3) show strong similarities within all three RGI regions, which supports the use of dZDE/dt as a metric of glacier change. Differences between regions highlight the climatic and geomorphic factors that determine glacier size and shape (Table 1). The highest values for all three metrics are found in South Asia (East), which contains some of the highest elevation mountains in the world. Continental glaciers on the colder and drier Tibetan Plateau and in the Tien Shan mountains (Central Asia) have the lowest values for all three metrics. Bi-modal distributions of Zmed, ZDE, and ELAmod are also found in Central Asia, which may indicate strong climatic differences (e.g. mountain vs. plateau) within the region. South Asia (West), which includes the Pamir and Karakoram ranges, is influenced by both the monsoon and westerly disturbances in winter. Elevations of Zmed, ZDE, and ELAmod for debris-covered glaciers in South Asia (West) are between the values found for Central Asia and South Asia (East).
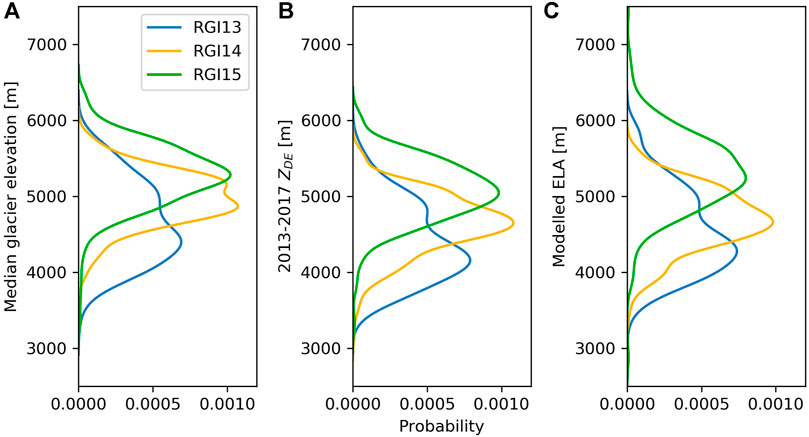
FIGURE 3. Distributions of (A) median glacier elevation derived from SRTM data, (B) median elevation of ZDE 2013–2017, and (C) modelled equilibrium line altitude (Kraaijenbrink et al., 2017) for three RGI regions in HMA.
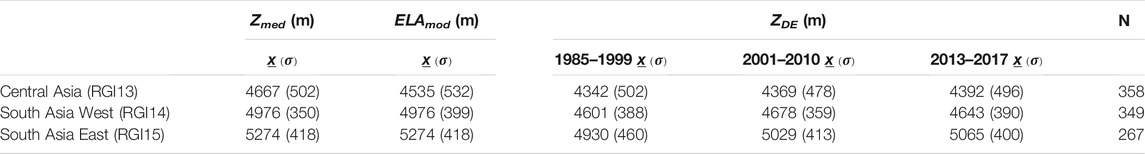
TABLE 1. Average (
Values of ZDE are systematically lower than both ELAmod and Zmed (Table 1) by approximately 150–250 m. Standard deviations of the regional ZDE averages ranged between 361 and 571 m, which is consistent with the standard deviations in mean Zmed (370–560 m) and ELAmod (403–559 m).
Changes in ZDE
In all RGI regions, the average value of ZDE increased from early to late periods (Table 1; Figure 4). To further quantify changes in ZDE through time for each debris-covered glacier, we calculate 1) simple differences in ZDE between periods (early to middle, and middle to late), and 2) the linear trend through time (dZDE/dt; with units of m/yr) over all three compositing periods, using the average acquisition dates and the observed changes in ZDE at each glacier. In Central Asia, an average ZDE increase of 49 m was observed between the composite midpoints 1990 and 2014. In South Asia (West) and South Asia (East), average ZDE increases of 39 and 110 m were observed, respectively, over the same period. In South Asia (West), average values of ZDE increased 65 m between early and middle periods, and decreased 26 m between the 2005 and 2014 midpoints. This decrease in ZDE corresponds with the decadal scale mass changes and corresponding decreases in temperature and increases in precipitation observed in the region by Hugonnet et al. (2021).
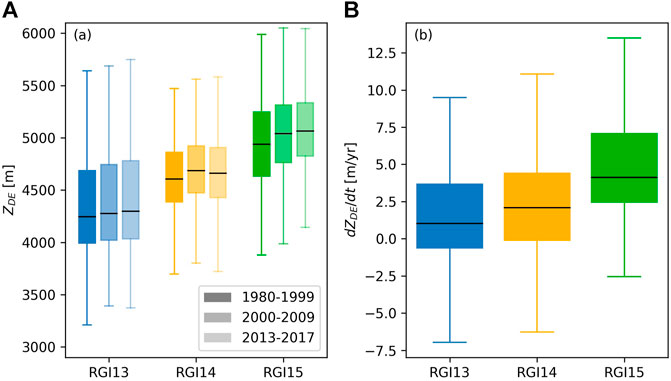
FIGURE 4. (A) boxplots of ZDE by RGI region and compositing period, and (B) boxplots of debris emergence elevation trends (dZDE /dt; m yr−1) by RGI region over the period 1980–2017.
Changes in ZDE between compositing periods (Figure 4A) show a range of debris-covered glacier responses. For Central Asia and South Asia (East), changes in ZDE are more positive between the middle and late periods. A clear decrease in ZDE can be seen in South Asia (West) in the later period, which suggests either increased ice fluxes or decreased ablation on the glacier termini. Glaciers in this region, which includes the Karakoram and Kunlun Shan ranges, have well-documented anomalous mass gains or neutral mass balances (Hewitt, 2005; Brun et al., 2017; de Kok et al., 2018; Shean et al., 2020). As South Asia (West) contains a large number of surging glaciers (Hewitt, 2005; Quincey et al., 2011) it is also possible that our filtering process does not eliminate surging glaciers completely from the analysis. A glacier surge phase would likely affect ZDE and would be interpreted as a mass gain and velocity acceleration at the terminus.
Median values of dZDE/dt are positive (increasing ZDE over time) in all three HMA regions, with the greatest rates observed in South Asia East (Figure 4B). Values of dZDE/dt for individual glaciers range between −10 and +20 m/yr. These trends are in agreement with observed and projected rates of changes in both ELA and seasonal snowline elevations (Pandey et al., 2013; Hasson et al., 2014; Huss and Hock, 2015; Shea et al., 2015; Viste and Sorteberg, 2015; Pieczonka et al., 2018)
Mass Balance, Glacier Velocity, and ZDE
Changes in ZDE should relate directly to changes in glacier mass balances and glacier velocities, as ice flux and ablation control the melt out and emergence of englacial debris. Increased mass loss and a corresponding decrease in glacier velocity would concentrate englacial debris at the surface at the upper limit of the debris-covered area and lead to increases in ZDE. To test this hypothesis, we compare individual rates of ZDE change with observed geodetic glacier mass balances and changes in glacier velocity (Figure 5) in each RGI region.
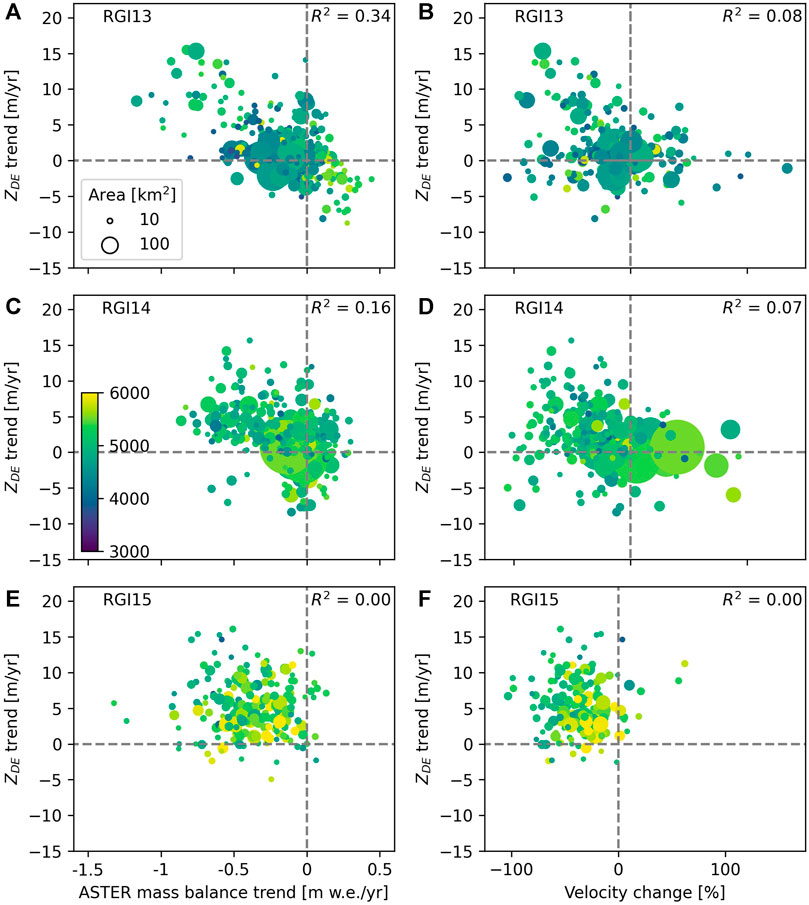
FIGURE 5. Left column: calculated rates of changes in ZDE (m yr−1) vs. ASTER mass balance trends (m w.e. yr−1; from Brun et al., 2017) for (A) Central Asia (RGI13), (C) South Asia West (RGI14), and (E) South Asia East (RGI15). Right column: calculated rates of changes in ZDE (m yr−1) vs. median change in glacier surface velocity from 2000 to 2016 (%; from Dehecq et al., 2019). Points are scaled to the area of the individual glaciers, and coloured by the median glacier elevation.
Glaciers in Central Asia and South Asia (West) exhibit statistically significant relations between net mass balance and ZDE trends (R2= 0.18–0.35), but this relation is weak or non-existent in South Asia (East; R2= 0.00; Figure 5). Median glacier elevation and glacier area do not appear to affect the relation between dZDE/dt and net mass balance. Similar relations are observed between ZDE and changes in glacier velocity (Figure 5), though velocity changes and ZDE are not as closely linked as mass balance (R2= 0.08 for both Central Asia and South Asia West). Debris-covered glaciers that are stable or gaining mass typically show decreases in ZDE, and a mixed velocity response.
Glaciers in South Asia (East) have considerably thinned and retreated in recent decades, and have relatively fewer glaciers that exhibit mass gains. The lack of significant relations between mass balance and ZDE and glacier velocity and ZDE may simply indicate a sampling bias, or the fact that debris-covered glaciers in advanced state of recession will tend to have more variable changes in ZDE. Alternatively, the debris cover mask in South Asia (East) may be less reliable due to monsoon cloud cover which dominates South Asia (East) more than the other regions.
Regional and Sub-Regional Trends
At the sub-regional scale (Supplementary Figures S4, S5, Table 2), relations between dZDE, glacier mass balance, and glacier velocity for individual glaciers exhibit a greater degree of variability, yet the same basic relations exist. Sub-regions with positive net mass balances and increasing glacier velocities (Karakoram and Kunlun Shan W) notably have stable or decreasing ZDE through time. All other regions, which exhibit mass losses and velocity decreases, show increases in ZDE. When sub-regional means are calculated, strong links between ZDE, glacier mass balance, and glacier velocity are observed (Figure 6).
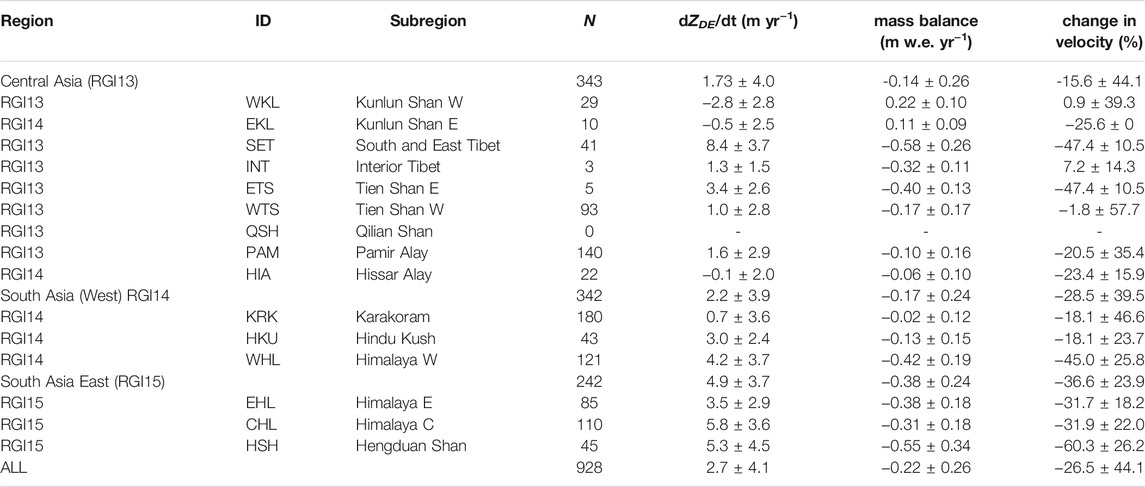
TABLE 2. Regional and sub-regional trends in ZDE, mass balance, and velocity for debris covered glaciers with a total area greater than 5 km2. Values given are mean +/− standard deviation.
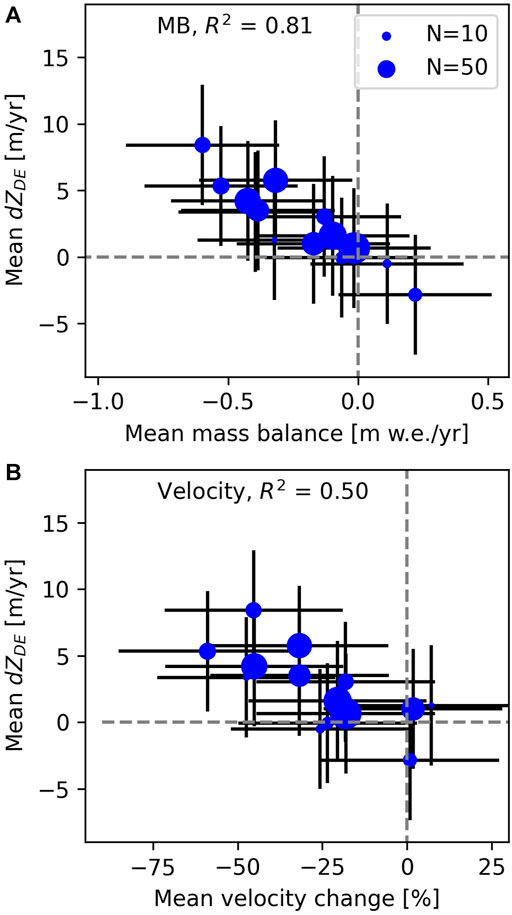
FIGURE 6. Sub-region means of ZDE versus mass balance rate (top panel) and ZDE vs. change in glacier velocity. Error bars are standard deviations for each sub-region and metric, as in Table 2, and points are scaled to the sample size.
Spatial patterns of ZDE, glacier mass change, and glacier velocity (Figure 7) further demonstrate the linkages between these metrics. The observed trends in mass balance, velocity, and ZDE are nearly identical across the region, and demonstrate the potential use of ZDE to map historical patterns of glacier change. The most negative mass balance rates and the greatest increases in ZDE are seen in the eastern Himalayas. Regions of anomalous mass gain (Kunlun Shan and Karakoram) that have been identified previously (Hewitt, 2005; Gardelle et al., 2013; Kääb et al., 2015; Brun et al., 2017) coincide with regions of decreases in ZDE. Regional changes in ZDE thus provide a broad indication of glacier mass change, and there are very few outliers to this regional pattern.
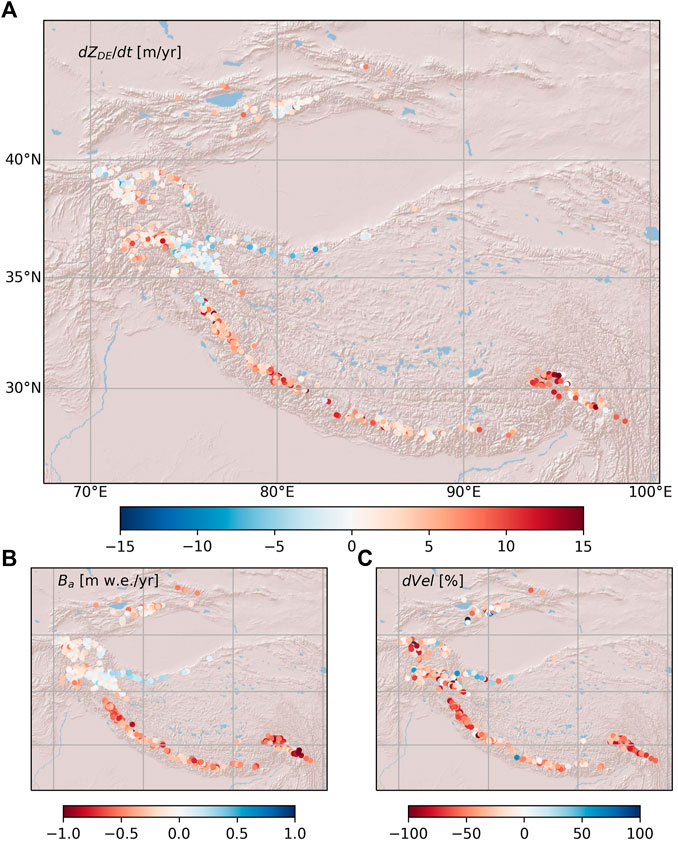
FIGURE 7. Spatial distributions of dZDE/dt(A), mass balance (B), and change in velocity (C) for debris covered glaciers >5 km2 in HMA. Mass balance data and velocity data from (Brun et al., 2017; Dehecq et al., 2018), respectively.
Previous work has shown that there are no significant differences in the mass balance of debris-covered and debris-free glaciers in the region (Brun et al., 2019). While debris insulates ice from melt, this is countered by low slope angles, low velocities, and low emergence velocities observed on debris-covered tongues (Brun et al., 2018). And though the glaciological ELA will respond to annual climate fluctuations, the terminus response times of debris-covered glaciers is substantially longer (Banerjee and Shankar, 2013). Thus, both the debris-covered area and changes in ZDE will lag behind annual variations in climate.
Discussion
Debris covered glaciers in the HMA region represent a potentially significant source of meltwater on decadal/century time scales (Kraaijenbrink et al., 2017; Scherler et al., 2018; Herreid and Pellicciotti, 2020). The few studies that have examined the temporal evolution of debris cover have pointed out that a stable debris-covered area corresponds to a neutral or positive mass balance (Herreid et al., 2015).
This work demonstrates that the elevation of the debris-ice transition (ZDE) has a similar distribution to both median glacier elevations and modelled equilibrium line altitudes (Table 1; Figure 3). As the ELA responds to annual variation in climate, we focus on how ZDE changes through time and compare this with published mass balance and velocity trends. Our discussion here focuses on the implications of our results, the limitations of the research, and opportunities for future research.
Debris covered glacier extents can be difficult to map with remotely sensed imagery (Frey et al., 2012). However, the transition between debris and clean glacier ice can be reliably estimated from cloud-free optical imagery (Rounce et al., 2021). While the elevation of this debris-ice transition will vary over individual glaciers (e.g. Figure 2), the median value of the transition elevation extracted here as ZDE has very similar distributions to both median glacier elevations and modelled ELAs (Figure 3). Limitations to our approach include the use of a static DEM and the duration of the compositing period used to construct debris cover maps. In the absence of accurate DEMs for each composite period, we have relied on SRTM elevations (ca. 2000) for all estimates of ZDE. If we assume that the majority of glaciers in the region have been experiencing mass loss and surface lowering, our use of SRTM data for all periods may result in overestimates of ZDE in the 2013–2017 period, and underestimates in the 1981–2000 period. Nevertheless, we do not expect the reliance on a static DEM to affect our conclusions substantially, as these errors are likely small near the ELA (which is slightly higher in elevation than ZDE, Figure 3). This study relies on compositing periods that cover 7–15 years periods, in order to obtain sufficient snow-free imagery to map the full extent of debris cover accurately. Changes in ZDE at shorter timescales would likely not be detectable with reasonable accuracy, and given the absence of annual mass balance or velocity trends there is no need for finer temporal resolutions.
Sub-regional means of ZDE exhibit clear negative relations with mass balance and velocity trends (Figure 7), with negative mass balances and velocity slowdowns associated with increased elevations of debris emergence. However, we do not find strong evidence for these relations at the scale of individual glaciers (Figures 6, 7). Glaciers in Central Asia (Tien Shan, Kunlun Shan, Pamir, and Tibetan ranges) appear to have the strongest links between these three glacier metrics, while the relation is weaker in South Asia (West) and South Asia (East). These differences are possibly the result of sampling bias, the relative health of glaciers in a region, the date of imagery acquisition, debris supply rates, and the density of lake-terminating debris-covered tongues.
As there are no debris-covered glaciers in South Asia (West) or South Asia (East) that are gaining mass, the first issue is sampling bias: we are only able to sample glaciers that are losing mass. This bias is further related to the general health of glaciers in a given region. Sustained negative mass balances in South Asia (West) and South Asia (East) have produced debris-covered glaciers that are in an advanced state of decline, and in some cases are being cut off from their accumulation areas (Naito et al., 2000; Shea et al., 2015; Pieczonka et al., 2018) and in transition to becoming rock glaciers (Anderson et al., 2018). As a result, ZDE will have an upper limit.
Our analysis of the dates of acquisition shows that imagery is typically collected in early August in most regions and composites (Supplementary Figure S1). However, we find a slight bias towards a later average glacier acquisition DOY for RGI15 in the 2013–2017 composite. While debris emergence elevations are expected to change on annual/decadal timescales in response to mass balance forcings, the timing of image acquisition could potentially affect the delineation of debris cover due to snow. Our compositing procedure preferentially selects pixels with the highest brightness temperatures to help minimize this bias. The average date of acquisition also varies between glaciers (Supplementary Figure S2). In using glacier-averaged composite dates for the trend calculations we find greater trend magnitudes than if the arithmetic mid-point of the composites is used.
Additionally, our calculated ZDE metric extends beyond the time periods of the mass balance and velocity data. Looking only at the absolute change in ZDE between the last two debris-cover masks, we observe a similar, albeit weaker, pattern in all three regions (Supplementary Figure S4). Glaciers that experience mass loss and decreases in velocity tend to show increases in ZDE. As debris-covered glaciers thin, there is the possibility of increased debris supply from unstable and de-buttressed lateral moraines (van Woerkom et al., 2019) which would act to increase ZDE. Finally, South Asia (West) and South Asia (East) contain a greater density of lake-terminating debris-covered glaciers (King et al., 2019), which have accelerated rates of mass loss relative to land-terminating glaciers. These factors all introduce some uncertainty in the relation between mass balance and ZDE.
This research is unable to resolve a mechanism for changes in ZDE, though enhanced ablation at the boundary between ice and debris, and a positive albedo feedback (warmer temperatures leading to increased ablation, melt out of entrained debris, decreased surface albedo, and enhanced melt) is our working hypothesis. Detailed energy balance modelling work at a regional scale would help test this hypothesis. A reduction in ice flux would point towards reduced debris transport, so the correlation between reduced ice fluxes and increase in ZDE may simply be due to the previously observed relations between mass balance and velocity (Dehecq et al., 2019).
The conceptual model of supraglacial debris given by (Anderson and Anderson, no date) and (Bozhinskiy et al., 1986) suggest that englacial debris emergence at the surface is governed by the local ablation rate and the concentration of the debris within the ice. When debris begins to emerge and concentrate at the surface, ablation rates are reduced at debris thicknesses greater than 0.05–0.10 m, which leads to an increase in local relief of the emerging medial moraine. The increase in surface slopes promotes dispersal of the debris, and so increased mass loss promotes increased debris emergence.
As the velocity is due primarily to the driving stress (with glacier thinning and mass loss leading to reduced driving stress and reduced velocities), the link between changes in velocity and ZDE may be coincidental, and not causal. Put another way, the rise in ZDE and the reduction in horizontal velocities are consequences of the same mechanism but are not directly linked. The rise in ZDE can be seen as the consequence of an increased ELA, which leaves a larger area with positive vertical velocity (downglacier of the ELA), and thus leads to debris cover expansion up-glacier. The rise in ELA leads to more thinning and thus a reduced driving stress, as highlighted in Dehecq et al (2019).
Debris-covered glaciers respond to ELA shifts at decadal or century-scale timescales (Banerjee, 2017). Given the importance of larger debris-covered glaciers to local water supplies (Fegel et al., 2016), we split the dataset in each RGI region according to glacier size (greater than or less than 10 km2) and re-calculate the mean rates of ZDE change to determine if glacier size affects the rate of ZDE change. In RGI13, larger glaciers have a slightly higher ZDE rate of change (+3.23 m yr−1, N = 81) than smaller glaciers (+2.68 m yr−1, N = 104), though the standard deviations on these estimates are large (5.90 and 4.86 m yr−1, respectively). In South Asia (West) and South Asia (East), smaller debris-covered glaciers have higher rates of ZDE change (3.15 and 6.23 m yr−1, respectively) than larger debris-covered glaciers (2.69 and 5.24 m yr−1, respectively). Again, large uncertainties prevent any meaningful conclusions about the role of glacier area in the rate of ZDE response.
In light of these discussion points, our work indicates that changes in ZDE derived from historical airborne or spaceborne imagery could be used as indicators of past glacier change. Historical regional inventories of ZDE derived from Corona/Hexagon imagery (Maurer et al., 2016; Bolch et al., 2017) would provide additional information for the development and testing of models of glacier dynamics and the response times of debris-covered glaciers to climatic change. Extension of this work also includes the potential for refinements to reconstructions of debris-cover extents and ELAs from the Last Glacial Maximum (Owen et al., 2002) or early Holocene (Fernández-Fernández et al., 2017) from geomorphological evidence.
Conclusion
Debris-covered glaciers are common in High Mountain Asia, and represent a potentially important long term source of meltwater. In this study, we map the elevation of the debris-ice transition zone (ZDE) for debris-covered glaciers in High Mountain Asia over three different compositing periods, identify trends and changes in ZDE between periods, and compare rates of glacier mass change and velocity change with changes in ZDE. Over decadal timescales and sub-regional spatial scales, ZDE is closely related to both glacier mass balance and glacier velocity. Glacier mass loss and reductions in velocity are coincident with increases in ZDE, and we hypothesize that this is likely a result of increased ablation at the debris-ice transition leading to increased melt-out of englacial debris. Rates of increases in ZDE are of the same magnitude as modelled and observed increases in ELA. Our results provide an avenue for mapping the relative health of debris-covered glaciers from historical imagery, which can be used to improve debris-covered glacier models and projections of future meltwater availability.
Data Availability Statement
The raw data supporting the conclusion of this article will be made available by the authors, without undue reservation.
Author Contributions
JS, WI, PK, and FB designed the study. JS and PK conducted the analyses and prepared the figures, and all authors contributed to the writing.
Funding
JS is funded by an NSERC Discovery Grant and was supported by Global Water Futures and the University of Saskatchewan during the inception of this study. PK and WI are financially supported by the Strategic Priority Research Program of the Chinese Academy of Sciences within the Pan-Third Pole Environment framework (grant agreement number XDA20100300), by the European Research Council (ERC) under the European Union’s Horizon 2020 research and innovation programme (grant agreement number 676819), and by the Netherlands Organization for Scientific Research under the Innovational Research Incentives Scheme VIDI (grant agreement 016.181.308).
Conflict of Interest
The authors declare that the research was conducted in the absence of any commercial or financial relationships that could be construed as a potential conflict of interest.
Publisher’s Note
All claims expressed in this article are solely those of the authors and do not necessarily represent those of their affiliated organizations, or those of the publisher, the editors and the reviewers. Any product that may be evaluated in this article, or claim that may be made by its manufacturer, is not guaranteed or endorsed by the publisher.
Acknowledgments
We gratefully acknowledge Amaury Dehecq for providing the glacier velocity change database, and the constructive comments and feedback from the reviewers.
Supplementary Material
The Supplementary Material for this article can be found online at: https://www.frontiersin.org/articles/10.3389/feart.2021.709957/full#supplementary-material
References
Ageta, Y., and Higuchi, K. (1984). Estimation of Mass Balance Components of a Summer-Accumulation Type Glacier in the Nepal Himalaya. Geografiska Annaler: Ser. A, Phys. Geogr. 66 (3), 249–255. doi:10.2307/52069810.1080/04353676.1984.11880113
Anderson, L. S., and Anderson, R. S. (2016). Modeling Debris-Covered Glaciers: Response to Steady Debris Deposition. The Cryosphere 10 (3), 1105–1124. doi:10.5194/tc-10-1105-2016
Anderson, R. S., Anderson, L. S., Armstrong, W. H., Rossi, M. W., and Crump, S. E. (2018). Glaciation of alpine Valleys: The Glacier - Debris-Covered Glacier - Rock Glacier Continuum. Geomorphology 311, 127–142. doi:10.1016/j.geomorph.2018.03.015
Azam, M. F., Ramanathan, A., Wagnon, P., Vincent, C., Linda, A., Berthier, E., et al. (2016). Meteorological Conditions, Seasonal and Annual Mass Balances of Chhota Shigri Glacier, Western Himalaya, India. Ann. Glaciol. 57 (71), 328–338. doi:10.3189/2016AoG71A570
Banerjee, A. (2017). Brief Communication: Thinning of Debris-Covered and Debris-free Glaciers in a Warming Climate. The Cryosphere 11 (1), 133–138. doi:10.5194/tc-11-133-2017
Banerjee, A., and Shankar, R. (2013). On the Response of Himalayan Glaciers to Climate Change. J. Glaciol. 59 (215), 480–490. doi:10.3189/2013JoG12J130
Benn, D. I., and Ballantyne, C. K. (1994). Reconstructing the Transport History of Glacigenic Sediments: a New Approach Based on the Co-variance of Clast Form Indices. Sed. Geol. 91 (1), 215–227. doi:10.1016/0037-0738(94)90130-9
Benn, D. I., and Lehmkuhl, F. (2000). Mass Balance and Equilibrium-Line Altitudes of Glaciers in High-Mountain Environments. Quat. Int. 65-66, 15–29. doi:10.1016/S1040-6182(99)00034-8
Bolch, T., Pieczonka, T., and Benn, D. I. (2011). Multi-decadal Mass Loss of Glaciers in the Everest Area (Nepal Himalaya) Derived from Stereo Imagery. The Cryosphere 5 (2), 349–358. doi:10.5194/tc-5-349-2011
Bolch, T., Pieczonka, T., Mukherjee, K., and Shea, J. (2017). Brief Communication: Glaciers in the Hunza Catchment (Karakoram) Have Been Nearly in Balance since the 1970s. The Cryosphere 11, 531–539. doi:10.5194/tc-11-531-2017
Bozhinskiy, A. N., Krass, M. S., and Popovnin, V. V. (1986). Role of Debris Cover in the Thermal Physics of Glaciers. J. Glaciol. 32 (111), 255–266. doi:10.3189/S0022143000015598
Braithwaite, R. J. (1984). Can the Mass Balance of a Glacier Be Estimated from its Equilibrium-Line Altitude. J. Glaciol. 30 (106), 364–368. doi:10.3189/S0022143000006237
Braun, L. N., Grabs, W., and Rana, B. (1993). “Application of a Conceptual Precipitation- Runoff Model in the Langtang Kfaola Basin,”. Editor G. J. Young, Proceedings of the Kathmandu Symposium, Nepal Himalaya, November 16–21, 1992 (Wallingford, United Kingdom: IAHS), 221–237.
Brun, F., Berthier, E., Wagnon, P., Kääb, A., and Treichler, D. (2017). A Spatially Resolved Estimate of High Mountain Asia Glacier Mass Balances from 2000 to 2016. Nat. Geosci 10 (9), 668–673. doi:10.1038/NGEO2999
Brun, F., Dumont, M., Wagnon, P., Berthier, E., Azam, M. F., Shea, J. M., et al. (2015). Seasonal Changes in Surface Albedo of Himalayan Glaciers from MODIS Data and Links with the Annual Mass Balance. The Cryosphere 9, 341–355. doi:10.5194/tc-9-341-2015
Brun, F., Wagnon, P., Berthier, E., Jomelli, V., Maharjan, S. B., Shrestha, F., et al. (2019). Heterogeneous Influence of Glacier Morphology on the Mass Balance Variability in High Mountain Asia. J. Geophys. Res. Earth Surf. 124, 1331–1345. doi:10.1029/2018JF004838
Brun, F., Wagnon, P., Berthier, E., Shea, J. M., Immerzeel, W. W., Kraaijenbrink, P. D. A., et al. (2018). Ice Cliff Contribution to the Tongue-wide Ablation of Changri Nup Glacier, Nepal, central Himalaya. The Cryosphere 12, 3439–3457. doi:10.5194/tc-12-3439-2018
Carrivick, J. L., and Brewer, T. R. (2004). Improving Local Estimations and Regional Trends of Glacier Equilibrium Line Altitudes. Geografiska Annaler: Ser. A, Phys. Geogr. 86 (1), 67–79. doi:10.1111/j.0435-3676.2004.00214.x
Cogley, J. G., Hock, R., Rasmussen, L. A., Arendt, A. A., Bauder, A., Braithwaite, R. J., et al. (2011). ‘Glossary of Glacier Mass Balance and Related Terms, IHP-VII Technical Documents in Hydrology No. 86, IACS Contribution No. 2. Paris: UNESCO-IHP. doi:10.5167/uzh-53475
Collier, E., Mölg, T., Maussion, F., Scherer, D., Mayer, C., and Bush, A. B. G. (2013). High-resolution Interactive Modelling of the Mountain Glacier-Atmosphere Interface: an Application over the Karakoram. The Cryosphere 7 (3), 779–795. doi:10.5194/tc-7-779-2013
de Kok, R. J., Tuinenburg, O. A., Bonekamp, P. N. J., and Immerzeel, W. W. (2018). Irrigation as a Potential Driver for Anomalous Glacier Behavior in High Mountain Asia. Geophys. Res. Lett. 45 (4), 2047–2054. doi:10.1002/2017GL076158
Dehecq, A., Gourmelen, N., Gardner, A. S., Brun, F., Goldberg, D., Nienow, P. W., et al. (2019). Twenty-first century Glacier Slowdown Driven by Mass Loss in High Mountain Asia. Nat. Geosci 12 (1), 22–27. doi:10.1038/s41561-018-0271-9
Engelhardt, M., Leclercq, P., Eidhammer, T., Kumar, P., Landgren, O., and Rasmussen, R. (2017). Meltwater Runoff in a Changing Climate (1951-2099) at Chhota Shigri Glacier, Western Himalaya, Northern India. Ann. Glaciol. 58 (75), 47–58. doi:10.1017/aog.2017.13
Farinotti, D., Immerzeel, W. W., de Kok, R. J., Quincey, D. J., and Dehecq, A. (2020). Manifestations and Mechanisms of the Karakoram Glacier Anomaly. Nat. Geosci. 13 (1), 8–16. doi:10.1038/s41561-019-0513-5
Farr, T. G., Rosen, P. A., Caro, E., Crippen, R., Duren, R., Hensley, S., et al. (2007). The Shuttle Radar Topography mission. Rev. Geophys. 45 (2). doi:10.1029/2005rg000183
Fegel, T. S., Baron, J. S., Fountain, A. G., Johnson, G. F., and Hall, E. K. (2016). The Differing Biogeochemical and Microbial Signatures of Glaciers and Rock Glaciers. J. Geophys. Res. Biogeosci. 121 (3), 919–932. doi:10.1002/2015jg003236
Fernández-Fernández, J. M., Palacios, D., García-Ruiz, J. M., Andrés, N., Schimmelpfennig, I., Gómez-Villar, A., et al. (2017). Chronological and geomorphological investigation of fossil debris-covered glaciers in relation to deglaciation processes: A case study in the Sierra de La Demanda, northern Spain. Quat. Sci. Rev. 170, 232–249. doi:10.1016/j.quascirev.2017.06.034
Frey, H., Paul, F., and Strozzi, T. (2012). Compilation of a Glacier Inventory for the Western Himalayas from Satellite Data: Methods, Challenges, and Results. Remote Sensing Environ. 124, 832–843. doi:10.1016/j.rse.2012.06.020
Gardelle, J., Berthier, E., Arnaud, Y., and Kääb, A. (2013). Region-wide Glacier Mass Balances over the Pamir-Karakoram-Himalaya during 1999-2011. The Cryosphere 7 (4), 1263–1286. doi:10.5194/tc-7-1263-2013
Gardelle, J., Berthier, E., and Arnaud, Y. (2012). Slight Mass Gain of Karakoram Glaciers in the Early Twenty-First century. Nat. Geosci 5, 322–325. doi:10.1038/ngeo1450
Hall, D. K., Riggs, G. A., and Salomonson, V. V. (1995). Development of Methods for Mapping Global Snow Cover Using Moderate Resolution Imaging Spectroradiometer Data. Remote Sensing Environ. 54 (2), 127–140. doi:10.1016/0034-4257(95)00137-P
Hasson, S., Lucarini, V., Khan, M. R., Petitta, M., Bolch, T., and Gioli, G. (2014). Early 21st century Snow Cover State over the Western River Basins of the Indus River System. Hydrol. Earth Syst. Sci. 18 (10), 4077–4100. doi:10.5194/hess-18-4077-2014
Herreid, S., Pellicciotti, F., Ayala, A., Chesnokova, A., Kienholz, C., Shea, J., et al. (2015). Satellite Observations Show No Net Change in the Percentage of Supraglacial Debris-Covered Area in Northern Pakistan from 1977 to 2014. J. Glaciol. 61 (227), 524–536. doi:10.3189/2015JoG14J227
Herreid, S., and Pellicciotti, F. (2020). The State of Rock Debris Covering Earth's Glaciers. Nat. Geosci. 13 (9), 621–627. doi:10.1038/s41561-020-0615-0
Hewitt, K. (2005). The Karakoram Anomaly? Glacier Expansion and the 'Elevation Effect,' Karakoram Himalaya. Mountain Res. Develop. 25, 332–340. doi:10.1659/0276-4741(2005)025[0332:tkagea]2.0.co;2
Hugonnet, R., McNabb, R., Berthier, E., Menounos, B., Nuth, C., Girod, L., et al. (2021). Accelerated Global Glacier Mass Loss in the Early Twenty-First century. Nature 592 (7856), 726–731. doi:10.1038/s41586-021-03436-z
Huss, M. (2013). Density Assumptions for Converting Geodetic Glacier Volume Change to Mass Change. The Cryosphere 7 (3), 877–887. doi:10.5194/tc-7-877-2013
Huss, M., and Hock, R. (2015). A New Model for Global Glacier Change and Sea-Level Rise. Front. Earth Sci. 3, 54. doi:10.3389/feart.2015.00054
Kääb, A., Treichler, D., Nuth, C., and Berthier, E. (2015). Brief Communication: Contending Estimates of 2003-2008 Glacier Mass Balance over the Pamir-Karakoram-Himalaya. The Cryosphere 9 (2), 557–564. doi:10.5194/tc-9-557-2015
King, O., Bhattacharya, A., Bhambri, R., and Bolch, T. (2019). Glacial Lakes Exacerbate Himalayan Glacier Mass Loss. Sci. Rep. 9 (1), 18145. doi:10.1038/s41598-019-53733-x
Kirkbride, M. P. (2011). “Debris-Covered Glaciers,” in Encyclopedia of Snow, Ice and Glaciers. Editors V. P. Singh, P. Singh, and U. K. Haritashya (Dordrecht: Springer Netherlands), 180–182. doi:10.1007/978-90-481-2642-2_622
Kraaijenbrink, P. D. A., Bierkens, M. F. P., Lutz, A. F., and Immerzeel, W. W. (2017). Impact of a Global Temperature Rise of 1.5 Degrees Celsius on Asia's Glaciers. Nature 549 (7671), 257–260. doi:10.1038/nature23878
Machguth, H., Haeberli, W., and Paul, F. (2012). Mass-balance Parameters Derived from a Synthetic Network of Mass-Balance Glaciers. J. Glaciol. 58 (211), 965–979. doi:10.3189/2012JoG11J223
Maurer, J. M., Rupper, S. B., and Schaefer, J. M. (2016). Quantifying Ice Loss in the Eastern Himalayas since 1974 Using Declassified Spy Satellite Imagery. The Cryosphere 10 (5), 2203–2215. doi:10.5194/tc-10-2203-2016
Maurer, J. M., Schaefer, J. M., Rupper, S., and Corley, A. (2019). Acceleration of Ice Loss across the Himalayas over the Past 40 Years. Sci. Adv. 5, eaav7266. doi:10.1126/sciadv.aav7266
Mukul, M., Srivastava, V., Jade, S., and Mukul, M. (2017). Uncertainties in the Shuttle Radar Topography Mission (SRTM) Heights: Insights from the Indian Himalaya and Peninsula. Sci. Rep. 7, 41672. doi:10.1038/srep41672
Naito, N., Nakawo, M., and Kadota, T. (2000). “Numerical Simulation of Recent Shrinkage of Khumbu Glacier, Nepal Himalayas,” in Debris Covered Glaciers, Proceedings of the Seattle Symposium. Editors M. Nakawo, C. Raymond, and A. Fountain (Wallingford, Oxfordshire: IAHS), 245–254.
Owen, L. A., and Benn, D. I. (2005). Equilibrium-line Altitudes of the Last Glacial Maximum for the Himalaya and Tibet: an Assessment and Evaluation of Results. Quat. Int. 138-139, 55–78. doi:10.1016/j.quaint.2005.02.006
Owen, L. A., Finkel, R. C., and Caffee, M. W. (2002). A Note on the Extent of Glaciation throughout the Himalaya during the Global Last Glacial Maximum. Quat. Sci. Rev. 21 (1), 147–157. doi:10.1016/S0277-3791(01)00104-4
Pandey, P., Kulkarni, A. V., and Venkataraman, G. (2013). Remote Sensing Study of Snowline Altitude at the End of Melting Season, Chandra-Bhaga basin, Himachal Pradesh, 1980-2007. Geocarto Int. 28 (4), 311–322. doi:10.1080/10106049.2012.705336
Pfeffer, W. T., Arendt, A. A., Bliss, A., Bolch, T., Cogley, J. G., Gardner, A. S., et al. (2014). The Randolph Glacier Inventory: a Globally Complete Inventory of Glaciers. J. Glaciol. 60 (221), 537–552. doi:10.3189/2014JoG13J176
Pieczonka, T., Bolch, T., Kröhnert, M., Peters, J., and Liu, S. (2018). Glacier branch Lines and Glacier Ice Thickness Estimation for Debris-Covered Glaciers in the Central Tien Shan. J. Glaciol. 64 (247), 835–849. doi:10.1017/jog.2018.75
Quincey, D. J., Braun, M., Glasser, N. F., Bishop, M. P., Hewitt, K., and Luckman, A. (2011). Karakoram Glacier Surge Dynamics. Geophys. Res. Lett. 38 (18), a–n. doi:10.1029/2011GL049004
Rabatel, A., Dedieu, J.-P., and Vincent, C. (2005). Using Remote-Sensing Data to Determine Equilibrium-Line Altitude and Mass-Balance Time Series: Validation on Three French Glaciers, 1994-2002. J. Glaciol. 51 (175), 539–546. doi:10.3189/172756505781829106
Rabatel, A., Letréguilly, A., Dedieu, J.-P., and Eckert, N. (2013). Changes in Glacier Equilibrium-Line Altitude in the Western Alps from 1984 to 2010: Evaluation by Remote Sensing and Modeling of the Morpho-Topographic and Climate Controls. The Cryosphere 7 (5), 1455–1471. doi:10.5194/tc-7-1455-2013
Rabatel, A., Sirguey, P., Drolon, V., Maisongrande, P., Arnaud, Y., Berthier, E., et al. (2017). Annual and Seasonal Glacier-wide Surface Mass Balance Quantified from Changes in Glacier Surface State: A Review on Existing Methods Using Optical Satellite Imagery. Remote Sensing 9 (5), 507. doi:10.3390/rs9050507
RGI Consortium (2017). Randolph Glacier Inventory–A Dataset of Global Glacier Outlines: Version 6.0: Technical Report, Global Land Ice Measurements from Space. Colorado, United States: Digital Media. doi:10.7265/N5-RGI-60
Robson, B., Hölbling, D., Nuth, C., Strozzi, T., and Dahl, S. (2016). Decadal Scale Changes in Glacier Area in the Hohe Tauern National Park (Austria) Determined by Object-Based Image Analysis. Remote Sensing 8 (1), 67. doi:10.3390/rs8010067
Rounce, D. R., Hock, R., McNabb, R. W., Millan, R., Sommer, C., Braun, M. H., et al. (2021). Distributed Global Debris Thickness Estimates Reveal Debris Significantly Impacts Glacier Mass Balance. Geophys. Res. Lett. 48 (8), e2020GL091311. doi:10.1029/2020GL091311
Sakai, A., and Fujita, K. (2017). Contrasting Glacier Responses to Recent Climate Change in High-Mountain Asia. Sci. Rep. 7 (1), 13717. doi:10.1038/s41598-017-14256-5
Scherler, D., Bookhagen, B., and Strecker, M. R. (2011). Spatially Variable Response of Himalayan Glaciers to Climate Change Affected by Debris Cover. Nat. Geosci 4, 156–159. doi:10.1038/ngeo1068
Scherler, D., Wulf, H., and Gorelick, N. (2018). Global Assessment of Supraglacial Debris-Cover Extents. Geophys. Res. Lett. 45 (21), 11798–11805. doi:10.1029/2018gl080158
Shea, J. M., and Immerzeel, W. W. (2016). An Assessment of basin-scale Glaciological and Hydrological Sensitivities in the Hindu Kush-Himalaya. Ann. Glaciol. 57, 308–318. doi:10.3189/2016AoG71A073
Shea, J. M., Immerzeel, W. W., Wagnon, P., Vincent, C., and Bajracharya, S. (2015). Modelling Glacier Change in the Everest Region, Nepal Himalaya. The Cryosphere 9, 1105–1128. doi:10.5194/tc-9-1105-2015
Shea, J. M., Menounos, B., Moore, R. D., and Tennant, C. (2013). An Approach to Derive Regional Snow Lines and Glacier Mass Change from MODIS Imagery, Western North America. The Cryosphere 7, 667–680. doi:10.5194/tc-7-667-2013
Shean, D. E., Bhushan, S., Montesano, P., Rounce, D. R., Arendt, A., and Osmanoglu, B. (2020). A Systematic, Regional Assessment of High Mountain Asia Glacier Mass Balance. Front. Earth Sci. 7, 363. doi:10.3389/feart.2019.00363
van Woerkom, T., Steiner, J. F., Kraaijenbrink, P. D. A., Miles, E. S., and Immerzeel, W. W. (2019). Sediment Supply from Lateral Moraines to a Debris-Covered Glacier in the Himalaya. Earth Surf. Dynam. 7 (2), 411–427. doi:10.5194/esurf-7-411-2019
Vincent, C., Ramanathan, A., Wagnon, P., Dobhal, D. P., Linda, A., Berthier, E., et al. (2013). Balanced Conditions or Slight Mass Gain of Glaciers in the Lahaul and Spiti Region (Northern India, Himalaya) during the Nineties Preceded Recent Mass Loss. The Cryosphere 7 (2), 569–582. doi:10.5194/tc-7-569-2013
Viste, E., and Sorteberg, A. (2015). Snowfall in the Himalayas: an Uncertain Future from a Little-Known Past. The Cryosphere 9 (3), 1147–1167. doi:10.5194/tc-9-1147-2015
Wagnon, P., Vincent, C., Arnaud, Y., Berthier, E., Vuillermoz, E., Gruber, S., et al. (2013). Seasonal and Annual Mass Balances of Mera and Pokalde Glaciers (Nepal Himalaya) since 2007. The Cryosphere 7 (6), 1769–1786. doi:10.5194/tc-7-1769-2013
Wang, P., Li, Z., Li, H., Wang, W., and Yao, H. (2014). Comparison of Glaciological and Geodetic Mass Balance at Urumqi Glacier No. 1, Tian Shan, Central Asia. Glob. Planet. Change 114, 14–22. doi:10.1016/j.gloplacha.2014.01.001
Keywords: glacier, debris cover, mass balance, velocity, High Mountain Asia
Citation: Shea JM, Kraaijenbrink PDA, Immerzeel WW and Brun F (2021) Debris Emergence Elevations and Glacier Change. Front. Earth Sci. 9:709957. doi: 10.3389/feart.2021.709957
Received: 14 May 2021; Accepted: 16 September 2021;
Published: 01 October 2021.
Edited by:
Aparna Shukla, Ministry of Earth Sciences, IndiaReviewed by:
William Armstrong, Appalachian State University, United StatesDavid Rounce, Carnegie Mellon University, United States
Copyright © 2021 Shea, Kraaijenbrink, Immerzeel and Brun. This is an open-access article distributed under the terms of the Creative Commons Attribution License (CC BY). The use, distribution or reproduction in other forums is permitted, provided the original author(s) and the copyright owner(s) are credited and that the original publication in this journal is cited, in accordance with accepted academic practice. No use, distribution or reproduction is permitted which does not comply with these terms.
*Correspondence: Joseph M. Shea, am9zZXBoLnNoZWFAdW5iYy5jYQ==