 Lara Hughes-Allen1,2*
 Frédéric Bouchard1,3
 Christine Hatté4
 Hanno Meyer2
 Lyudmila A. Pestryakova5
 Bernhard Diekmann2
 Dmitry A. Subetto6,7
 Boris K. Biskaborn2*
- 1CNRS, GEOPS, Université Paris-Saclay, Orsay, France
- 2Alfred Wegener Institute Helmholtz Centre for Polar and Marine Research, Potsdam, Germany
- 3Centre d’études nordiques (CEN), Université Laval, Québec, Canada
- 4Laboratoire des Sciences du Climat et de L’Environnement (LSCE), CEA CNRS UVSQ, Université Paris-Saclay, Gif-sur-Yvette, France
- 5North-Eastern Federal University of Yakutsk, Yakutsk, Russia
- 6Herzen State Pedagogical University of Russia, Saint Petersburg, Russia
- 7Institute for Water and Environmental Problems, Siberian Branch of the Russian Academy of Sciences, Barnaul, Russia
A multi-proxy paleolimnological analysis of a sediment core sequence from Lake Malaya Chabyda in Central Yakutia (Eastern Siberia, Russia) was conducted to investigate changes in lake processes, including lake development, sediment and organic carbon accumulation, and changes in primary productivity, within the context of Late Pleistocene and Holocene climate change. Age-depth modeling with 14C indicates that the maximum age of the sediment core is ∼14 cal kBP. Three distinct sedimentary units were identified within the sediment core. Sedimentological and biogeochemical properties in the deepest section of the core (663–584 cm; 14.1–12.3 cal kBP) suggests a lake environment mostly influenced by terrestrial vegetation, where organic carbon accumulation might have been relatively low (average ∼100 g OC m−2 a−1), although much higher than the global modern average. The middle section of the core (584–376 cm; 12.3–9.0 cal kBP) is characterized by higher primary productivity in the lake, much higher sedimentation, and a remarkable increase in OC delivery (average ∼300 g OC m−2 a−1). Conditions in the upper section of the core (<376 cm; < 9.0 cal kBP) suggest high primary productivity in the lake and high OC accumulation rates (average ∼200 g OC m−2 a−1), with stable environmental conditions. The transition from organic-poor and mostly terrestrial vegetation inputs (TOC/TNatomic ratios ∼20) to conditions dominated by aquatic primary productivity (TOC/TNatomic ratios <15) occurs at around 12.3 cal kBP. This resulted in an increase in the sedimentation rate of OC within the lake, illustrated by higher sedimentation rates and very high total OC concentrations (>30%) measured in the upper section of the core. Compact lake morphology and high sedimentation rates likely resulted in this lake acting as a significant OC sink since the Pleistocene-Holocene transition. Sediment accumulation rates declined after ∼8 cal k BP, however total OC concentrations were still notably high. TOC/TNatomic and isotopic data (δ13C) confirm the transition from terrestrial-influenced to aquatic-dominated conditions during the Early Holocene. Since the mid-Holocene, there was likely higher photosynthetic uptake of CO2 by algae, as suggested by heavier (isotopically enriched) δ13C values (>−25‰).
Introduction
Permafrost is a dominant landscape feature in Siberia, Alaska, and Canada, occupying more than 20 million square kilometers and representing 24% of land cover within the northern hemisphere (Brown et al., 1997). Regional climate conditions, landscape cover, and other factors control the spatial extent and thickness of permafrost, and ground ice content can vary widely across landscapes (Grosse et al., 2016; Strauss et al., 2017). The Yedoma ice complex (referred to as “Yedoma” in the following) is a particular type of ice-rich (50–90 vol%), relatively low organic content (2–4 wt%) permafrost that can reach depths of up to 40 m (Schirrmeister et al., 2013; Hugelius et al., 2014). Permafrost landscapes of all types are sensitive to changes in temperature and other local disturbances including forest fires and forest removal for agricultural purposes as well as lake formation and development (Grosse et al., 2013; Ulrich et al., 2019), which can have widespread implications for local and regional hydrology and the global carbon cycle (Walter Anthony et al., 2016). Yedoma is particularly susceptible to localized abrupt thaw based on its high ice content (Vonk et al., 2013). The Arctic is currently warming at a disproportionately high rate and magnitude compared to global averages, with mean annual air temperature predicted to increase by as much as 5.4°C within the 21st century in the absence of significant and directed global effort to reduce greenhouse gas emissions (Pörtner et al., 2019). This will likely herald a period of dynamic changes within permafrost landscapes.
The surface of Yedoma landscapes in many places is covered by ponds and lakes that document thermokarst processes (Strauss et al., 2017). In addition to the dominance of thermokarst lakes in Yakutia, lake formation can occur within the dune landscape which is widespread in the lower section of the Vilyui River and the middle part of the Lena River (Pestryakova et al., 2012). These sand dunes (also called tukulans) likely originated during the early stages of the interglacial epochs and dune lakes can often form in deflation basins (Pestryakova et al., 2012). Similar to thermokarst lakes, the high heat capacity of water relative to the air causes preferential thawing of surrounding permafrost as well as settling of sand to facilitate minor deepening of the lake (Sumgin et al., 1940; Kachurin, 1961; Zhirkov, 1983). While the genesis of dune lakes clearly differs from thermokarst lakes, there is overlap in the developmental history between these two lake types. There is, however, a relative paucity of studies which examine the paleolimnological history of dune lakes located in permafrost landscapes, and in particular differences in the potential for release of stored carbon upon permafrost thawing between these lakes and thermokarst lakes. Permafrost thaw can release substantial amounts of organic and mineral matter, including carbon, to surrounding terrestrial and aquatic ecosystems (Vonk et al., 2015). Soils across northern permafrost regions could contain twice as much carbon as currently exists in the atmosphere (Schuur et al., 2015). Total global terrestrial (non-marine) stores alone are estimated to hold 1,672 Pg of carbon (PgC), with Yedoma deposits accounting for more than 500 Pg C of this total (Hugelius et al., 2014). Permafrost carbon stores consist primarily of the remnants of terrestrial vegetation such as leaves and root detritus as well as microorganisms which have accumulated in the perennially frozen soil over thousands of years (Davidson and Janssens, 2006; Vonk and Gustafsson, 2013; Schuur et al., 2015). Lakes, however, store both terrestrial material (allochthonous) and also the organic matter (OM) that was produced by algae in the aquatic ecosystem (autochthonous) (Schuur et al., 2015). However, there is a lack of studies which study long-term carbon storage in Siberian lakes (Mendonça et al., 2017). Lakes can also act as hotspots for greenhouse gas emissions in permafrost landscapes. These emissions originate from the mineralization of OM (both allochthonous and autochthonous) stored within lake sediments (Bouchard et al., 2015; Hughes-Allen et al., 2021; Prėskienis et al., 2021) and understanding past lake dynamics can inform predictions about future greenhouse gas emissions from permafrost landscapes.
Paleolimnological studies often rely on proxy analyses based on carbon concentrations, carbon isotopes, and nitrogen concentrations. However, the applicability of these variables for interpretation of the relationships between carbon accumulation, carbon degradation, and the permafrost catchment are not fully understood (Biskaborn et al., 2019a). Therefore, the general approach of our study was to gain insights into how these variables can contribute to a better understanding of carbon dynamics in Siberian lake systems, facilitating future paleolimnological studies. Here, we present the results from a multi-proxy analysis of an approximately 6.6 m-long sediment core, covering the last 14,000 years, from Lake Malaya Chabyda within the Central Yakutia region to understand the history and processes of carbon accumulation through time within a permafrost landscape. The specific objectives of the study were: 1. present the development history of Lake Malaya Chabyda, 2. quantify and understand the accumulation of organic carbon in the lake, 3. distinguish between organic matter produced within the lake itself and within the surrounding catchment, 4. discern carbon preservation trends based on climate variability and changing lake dynamics.
Study Site
Lake Malaya Chabyda (Озеро Малая Чабыда) (61.9569 °N, 129.4091 °E) is located approximately 15 km southwest of the City of Yakutsk (Central Yakutia, Eastern Siberia). This lake is at 188 m a.s.l, has an area of 0.24 km2, and a max depth of 3 m (Kumke et al., 2007). During initial surveying in July 2005, Lake Malaya Chabyda had a pH of 6.71, a conductivity of 131 (µS/cm), and a temperature of 18°C (Pestryakova et al., 2012). The lake catchment is 10 km2 and also includes Lake Ulakhan Chabyda (Tarasov et al., 1996), which is a lake four times larger than Lake Malaya Chabyda, approximately 3 km to the northwest (Figure 1). Lake Ulakhan Chabyda has an area of 2.1 km2, an average depth of 0.5 m and a maximum depth of 2.0 m. There are no surface inflows into Lake Ulakhan Chabyda (Pestryakova et al., 2012), but this lake does discharge into Lake Malaya Chabyda during times of high water (i.e. after spring melting). Lake Malaya Chabyda sits on massifs of spear-shaped dunes which have been fixed in place by vegetation growth since the onset of the Holocene. Both lakes sit on the former Lena River erosion-accumulation plain, within the central Yakutian Depression. This plain is composed of Quaternary loams overlying Cambrian limestones (Pestryakova et al., 2012).
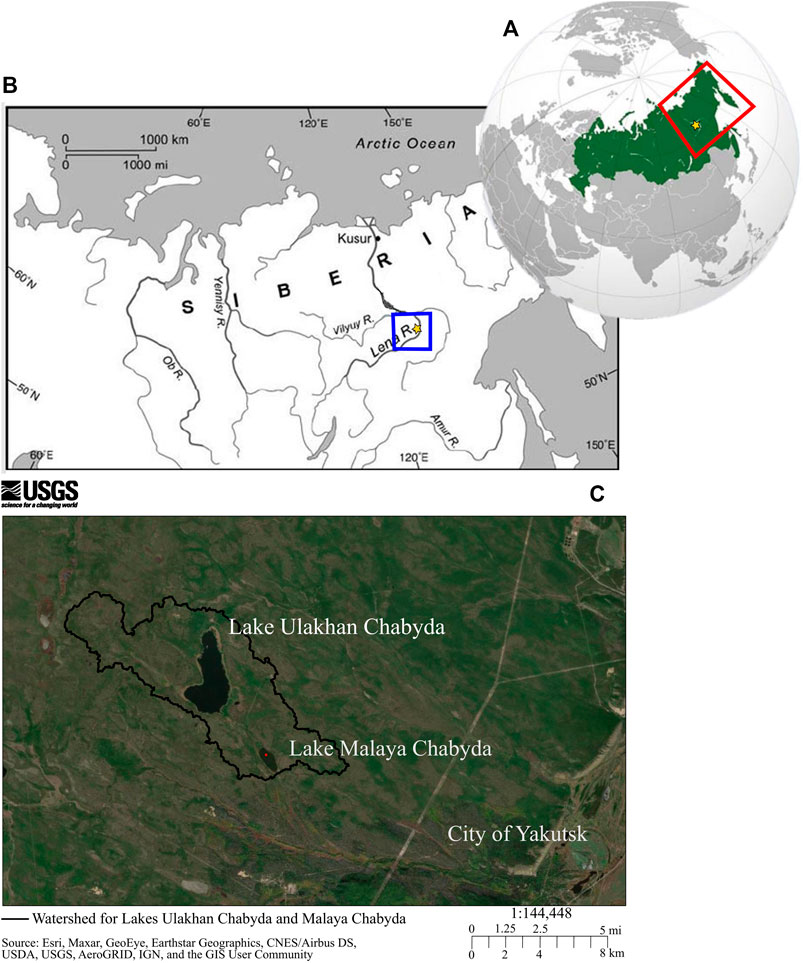
FIGURE 1. (A) Map showing general location of the study site (red box) within the Russia Federation (green) (B) Location of study site (blue box). Note the Lena River and the city of Yakutsk (yellow star) (C) Locations of Lakes Ulakhan Chabyda and Malaya Chabyda, near the city of Yakutsk. Lake catchment is outline in black. Coring site location is indicated by red circle.
Central Yakutia is characterized by an extreme subarctic continental climate with long, cold, and dry winters (January mean temperature around –40°C) and relatively warm summers (July mean temperature around +20°C). The winter season, characterized by the presence of ice cover on local lakes, generally extends from late September until early May (Hughes-Allen et al., 2021). The biologically productive summer season is short, lasting from the middle of June to the beginning of August (Nazarova et al., 2013). The low annual precipitation (190–230 mm) is mostly constrained to the summer season. Average snow depth for winter months (January to April) ranges from 24 cm in January to a maximum of 30 cm in March, and then decreasing to 10 cm at the end of April (1980-2020 recorded values from Yakutsk weather station) (A. Fedorov pers. comm.). Yearly evaporation rates exceed total precipitation in this region (Fedorov et al., 2014b). Between 1996 and 2016, the mean annual air temperature of Central Yakutia increased by 0.5–0.6 °C per decade (Gorokhov and Fedorov, 2018).
Permafrost in this region is continuous, thick (>500 m deep), and the upper 30–50 m (Pleistocene-age fluvial and aeolian sediments) can be extremely rich in ground ice (50–90% by volume) (Ivanov, 1984). The active layer typically reaches depths of 0.5–2.0 m, varying depending on landscape factors that include vegetation cover type, general topography, soil type, and subsurface water content (Ulrich et al., 2017b). Central Yakutia is dominated by a middle taiga landscape regime (Fedorov et al., 2014) and larch, pine, and birch forests are prevalent (Ulrich et al., 2017a). Grasslands are abundant in unforested areas, including land cleared for farming, ranching, or in the remnant depressions of old thaw lakes known as ‘alases’. After the cold temperatures and low precipitation of the Younger Dryas, Central Yakutia experienced a slow, but relatively persistent increase in temperature and precipitation (Müller et al., 2009; Biskaborn et al., 2012; Nazarova et al., 2013). These conditions resulted in widespread permafrost degradation (Biskaborn et al., 2012), including the development of ‘alas’ depressions that are now widespread in Central Yakutia (Soloviev, 1959; Brouchkov et al., 2004). The grasslands in the alases consist of halophytic steppe-like and bog plant communities (Ulrich et al., 2017b).
Nearly half of the landscape has been affected by thermokarst since the Early Holocene, resulting in the formation of thousands of partly drained ‘alas’ depressions (Soloviev, 1959; Brouchkov et al., 2004). However, recent thermokarst activity related to natural landscape evolution, increasing air temperatures and/or human-induced landscape modifications (agriculture, clear-cutting, and infrastructure) is also occurring in the region, resulting in the development of numerous small, fast-developing lakes and retrogressive thaw slumps along lake shores (Fedorov et al., 2014; Séjourné et al., 2015). Dune lakes are found in the lower section of the Vilyui River and the middle section of the Lena River, where there are abundant unvegetated massifs of undulating and cross-bedded quartz loamy sand that can be up to 25 m thick. These dune features are fairly common in the Lena watershed and can account for nearly 30 percent of the landscape in some areas (Galanin et al., 2018). Central Yakutian dunes are considered to be aeolian in origin and likely formed at the end of the last glacial epoch between 27.0–12.0 cal kBP on Lower Cambrian carbonates, although the actual abundance of CaCO3 in the dune sand is not known. Lakes are found in deflation and aeolian-dammed basins (Pestryakova et al., 2012).
Methods
Field Sampling
Eight overlapping sediment cores, representing an approximately 6.6 m–long composite sequence (Supplementary Figure S1), were collected on March 24, 2013 from Lake Malaya Chabyda in Central Yakutia (exact coring location 61°57.509′ 129°24.500′). Sampling was conducted during a German–Russian Expedition (“Yakutia 2013”) as the cooperation between the North Eastern Federal State University in Yakutsk (NEFU) and the Alfred Wegener Institute Helmholtz Centre for Polar and Marine Research (AWI).
Two parallel drilling holes, approximately 1 m apart, were used alternatingly to obtain core sections which overlap by approximately 20 cm. To penetrate ca. 1 m of lake ice cover, 250-mm-diameter holes were drilled using a hand-held Jiffy ice auger. Water depth was measured using an Echo sounder (HONDEX PS-7 LCD) and a calibrated rope for verification. Each individual core sample consisted of a 100 cm-long core collected at 2 m water depth using a Russian peat corer and supported by an UWITEC gravity coring system. Core samples were taken alternatingly from the first drill hole and then the second until the entire length of the core was obtained. Care was taken when coring to ensure that there was 20 cm of overlap between core sections. Cores were stored in waterproof sealed, transparent PVC plastic tubes in cool and dark conditions. After the field season, the cores were transported to Potsdam, Germany and stored at 4°C in the cold rooms at AWI. The cores did not experience any visible drying or surface oxidation during storage.
Sediment Core Subsampling and Dating
After XRF scanning in early 2014, subsampling of the cores for laboratory analyses began in November 2018 with a simple visual description and photography of the eight cores sections. One-cm-thick discrete subsamples were then taken at approximately 10 cm intervals using an inox spatula. Each subsample was split into two parts containing approximately equal amounts of material (4–10 g) and weighed. One subsample was kept in the cold room for potential future analysis. The remaining subsample was used for all subsequent analysis.
Four bulk samples and three organic vegetal macro remains were extracted from the sediment cores sections and sent for 14C dating to the MICADAS radiocarbon lab at AWI, Germany (Table 1). These samples were placed in glass containers and dried at 50 °C and analyzed for radiocarbon dating using accelerator mass spectrometry (AMS) after using an acid treatment (method outlined in (Vyse et al., 2020). We applied Bacon in R (Blaauw and Christen, 2011) and the IntCal20 calibration curve (Reimer et al., 2020) to model the age-depth relationship. The surface of the core represents 2013 CE (the time of core retrieval) and the linear relationship of the samples from the bottom to the top of the core shows that there is no significant reservoir effect in the lake.
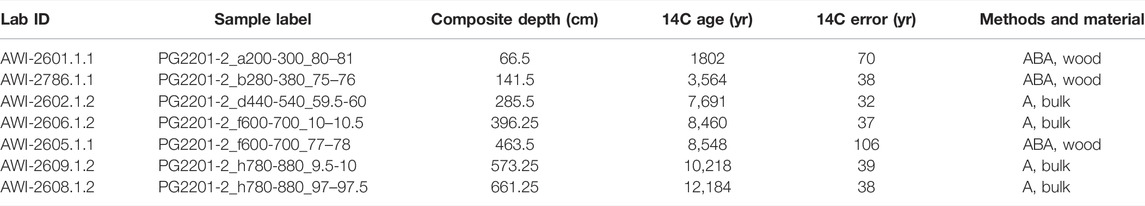
TABLE 1. Radiocarbon (14C) dated samples from Lake Malaya Chabyda sediment core.
X-Ray Fluorescence (XRF) Analysis
High–resolution X–ray fluorescence (XRF) analyses were carried out with 10 mm resolution on the entire sequence using an Avaatech XRF core scanner at AWI (Bremerhaven, Germany) with a Rh X-ray tube at 10 kV (without filter, 12 s, 1.5 mA) and 30 kV (Pd-thick filer, 15 s, 1.2 mA). The sediment surface was cleaned, leveled, and covered with a 4 µm ultralene foil to avoid sediment desiccation prior to XRF scanning. Individual element counts per second (CPS) were transformed using a centered log transformation (CLR) and element ratios were transformed using an additive log ratio (ALR) to account for compositional data effects and reduce effects from variations in sample density, water content, and grain size (Weltje and Tjallingii, 2008). Statistical analysis was completed using the Python programming language (Python Software Foundation, https://www.python.org/). XRF analysis of the sequence indicated 24 detectable elements and a subset of these were selected for analysis based on low element Chi-Square (χ2) values. χ2 values are produced by the WinAxil Software to help determine the goodness of fit of the mathematical model. Provided that the χ2 value does not exceed 3, it is considered acceptable. These selected elements include the major rock forming elements of Silicon (Si) (Chi2 1.4), Calcium (Ca) (Chi2 6.3), Titanium (Ti) (Chi2 1.3), Rubidium (Rb) (Chi2 0.6), Strontium (Sr) (Chi2 0.7), Zircon (Zr) (Chi2 0.6) and the redox sensitive, productivity indicating elements of Manganese (Mn) (Chi2 1.3), Iron (Fe) (Chi2 2.5), and Bromine (Br) (Chi2 0.8).
Grain Size Analysis
All subsequent analyses took place after the extracted subsamples had been freeze–dried until completely dry (approximately 48 h). Grain size analysis was conducted on 16 samples that were chosen to span the entire sequence at relatively regular intervals. The samples were first treated for 5 weeks with H2O2 (0.88 M) in order to isolate clastic material. After treatment, seven samples were eliminated from the analysis because the remaining inorganic sediment fraction was too low for detection by the laser grain size analyzer. The remaining samples were homogenized using an elution shaker for 24 h and then analyzed using a Malvern Mastersizer 3,000 laser. Standard statistical parameters (mean, median, mode, sorting, skewness, and kurtosis) were determined using GRADISTAT 9.1 (Blott and Pye, 2001).
Dry Bulk Density, Sedimentation and Organic Carbon Accumulation Calculations
Total organic carbon concentrations (see below) were used to determine the organic vs mineral matter content (OM vs MM) in each sample, assuming that bulk OM contains about 50% of organic carbon (Pribyl, 2010). OM and MM concentrations were used to derive average particle densities, based on values of 1.25 g cm−3 and 2.65 g cm−3 for OM and MM, respectively (Avnimelech et al., 2001). Dry bulk density (DBD, in g cm−3) values were then inferred by multiplying particle densities by porosity values, which had been calculated using wet and dry weights (thus the water content before and after sediment drying by freeze drying). Sedimentation rate (SR, in cm a−1) was calculated using the R function “accrate.depth”, which estimated mean sedimentation rate derived from the age-depth model at 0.5 cm increments downcore. All iterations at each depth from the bacon modelling output where then used in a student t-test to calculate the 95% confidence range and the p-values for SR at each 0.5 cm increment. Sediment mass accumulation rate (MAR, in g cm−2 a−1) was obtained by multiplying DBD by SR. Finally, the organic carbon accumulation rate (OCAR, in g OC m−2 a−1) was inferred as the adjusted product of MAR and the total organic carbon concentration. OCAR and MAR uncertainties were calculated from the 95% uncertainty ranges of SR.
Biogeochemical Analysis
Total carbon (TC), total organic carbon (TOC), and total nitrogen (TN) analyses were completed after the freeze–dried subsamples were ground in a Pulverisette 5 (Fritsch) planetary mill at 3,000 rpm for 7 min. TC and TN were measured in a carbon–nitrogen–sulphur analyzer (Vario EL III, Elementar). Five mg of sample material were encapsulated in tin (Sn) capsules together with 10 mg of tungsten–(VI)–oxide. The tungsten–(VI)–oxide ensures complete oxidation of the sample during the measurement process. Duplicate capsules were prepared and measured for each subsample. Blanks and calibration standards were placed every 15 samples to ensure analytical accuracy (<± 0.1 wt%). Between each sample the spatula was cleaned with KIMTECK fuzz-free tissues and isopropyl.
Analysis of TOC began by removing the inorganic carbon fraction by placing each subsample in a warm hydrochloric acid solution (1.3 M) for at least 3 hours and then transferring the sample to a drying oven. The TC measured for each subsample in the previous analysis was used to determine the amount of sample required for the TOC analysis. The appropriate amount of sample was weighted in a ceramic crucible and analyzed using the Vario Max C, Elementar. The TOC/TN ratio was converted to the TOC/TNatomic ratio by multiplying the TOC/TN ratio by 1.167 (atomic weight of carbon and nitrogen) (Meyers and Arbor, 2001). Total inorganic carbon (TIC) analysis was completed using a Vario SoilTOC cube elemental analyzer after combustion at 400°C (TOC) and 900°C (TIC) (Elementar Corp, Germany).
Calculation of δ13C was completed twice for a subset of samples using two different methodologies. The analysis completed at the AWI Potsdam ISOLAB Facility removed carbonate by treating the samples with hydrogen chloride (12 M HCl) for 3 hours at 97°C, then adding purified water and decanting and washing three times. Once the chloride content was below 500 parts per million (ppm), the samples were filtered over a glass microfiber (Whatman Grade GF/B, nominal particle retention of 1.0 µm). The residual sample was dried overnight in a drying cabinet at 50°C. The dry samples were manually ground for homogenization and weighted into tin capsules and analyzed using a ThermoFisher Scientific Delta–V–Advantage gas mass spectrometer equipped with a FLASH elemental analyzer Andreev and Klimanov, 2000 and a CONFLO IV gas mixing system. In this system, the sample is combusted at 1,020°C in O2 atmosphere so that the OC is quantitatively transferred to CO2, after which the isotope ratio is determined relative to a laboratory standard of known isotopic composition. Capsules for control and calibration were run in between. The isotope composition is given in permil (‰) relative to Vienna Pee Dee Belemnite (VPDB).
The analysis of a small subset of samples which took place at Laboratoire des sciences du climat et de l’environnement Isotopic Laboratory for methodological comparison underwent a slightly different treatment, as follows. The sediment underwent a soft leaching process to remove carbonate using pre-combusted glass beakers, HCl 0.6N at room temperature, ultra-pure water and drying at 50°C. The samples were then crushed in a pre-combusted glass mortar for homogenization prior to carbon content and δ13 C analysis. The handling and chemical procedures are common precautions employed with low-carbon-content sediments. Analysis was performed online using a continuous flow EA-IRMS coupling, that is, a Fisons Instrument NA 1500 Element Analyzer coupled to a ThermoFinigan Delta + XP Isotope-Ratio Mass Spectrometer. Two in-house standards (oxalic acid, δ13C = −19.3% and GCL, _13C = −26.7%) were inserted every five samples. Each in-house standard was regularly checked against international standards. The measurements were at least triplicated for representativeness. The external reproducibility of the analysis was better than 0.1%, typically 0.06%. Extreme values were checked twice.
Those samples for which the carbonate was leeched at the room temperature, with lower HCl concentration (0.6N), and without a filtration step (samples analyzed at Laboratoire des sciences du climat et de l’environnement Isotopic Laboratory) had δ13C values 0.1–1.0‰ (average 0.5‰) higher than the samples treated at the higher temperature (97.7°C). However, the plotted δ13C curve is nearly identical for the subset of samples which were subjected to both treatments (Supplementary Figure S2). There is some heterogeneity in the amount of offset between the two treatment methods. This might be related to an asymmetrical distribution of hot acid-soluble organic compounds throughout the sediment core. A correction of ca. +0.5‰ was applied to the results of the high temperature treatment. These values were then combined with the low temperature results to provide a complete dataset for the whole core. The standard deviation of the typical measurement error (1σ) is generally better than δ13C = ±0.15‰.
Statistical Analysis
A hierarchical agglomerative cluster analysis was performed in order to divide the sediment core sequence into distinct units. XRF elemental data (CLR values for Ca, Fe, Ti, Mn, Sr, Zr, Rb, Br, and Si), δ13C, TN (wt%), C (wt%), TOC (wt%), and TIC (wt%) were used to perform the cluster analysis (Supplementary Figure S3).
A principal component analysis (PCA) was completed on a subset of XRF elements (Ca, Sr, Fe, Zr, and Ti), and biogeochemical parameters (TOC (wt%), C (wt%), TN (wt%), TOC/TNatomic) to explore the dimensionality of the dataset and the relationships between the included variables. All values were z-transformed. The data when considered for the whole core, do not have a Gaussian distribution, but the data do approach a normal distribution when considered by unit. Therefore, the PCA was performed individually for each unit, rather than on the whole core. Only a subset of XRF elements were included in the PCA in order to reduce dimensionality, while preserving as much variability as possible. All variables were then plotted onto an ordination plot for interpretation purposes (Supplementary Figure S4). The clustering analysis and PCA analysis were performed using the Python programming language (Python Software Foundation, https://www.python.org/). Packages used include: numpy (Harris et al., 2020) and pandas (The pandas development team, 2020).
Results
Chronology and Sedimentation Rates
The results of the 14C dating analysis of seven samples indicate that the oldest lake sediments at the base of the core were deposited around 14.1 cal kBP according to the age depth model (Figure 2). The middle horizon (dark brown clayey silt with laminated sections) decreases in age consistently from 12.3 cal kBP at 584 cm depth to ∼9.0 cal kBP at 376 cm depth. The upper horizon (homogenous, brown, clayey silt) decreased from ∼9.0 cal kBP at 376 cm depth to present-day at the top of the sediment core. Mean 95% confidence over the entire core was 874 years 100% of the dates overlap with the age-depth model (95% ranges). It is possible that the bulk-sediment radiocarbon dates are older by multiple centuries or even millennia than recorded due to reworking of old organic material (Strunk et al., 2020). However, based on the linear alignment of dated samples until the time of sampling, we can assume neglectable effects from the presence of old carbon in the samples.
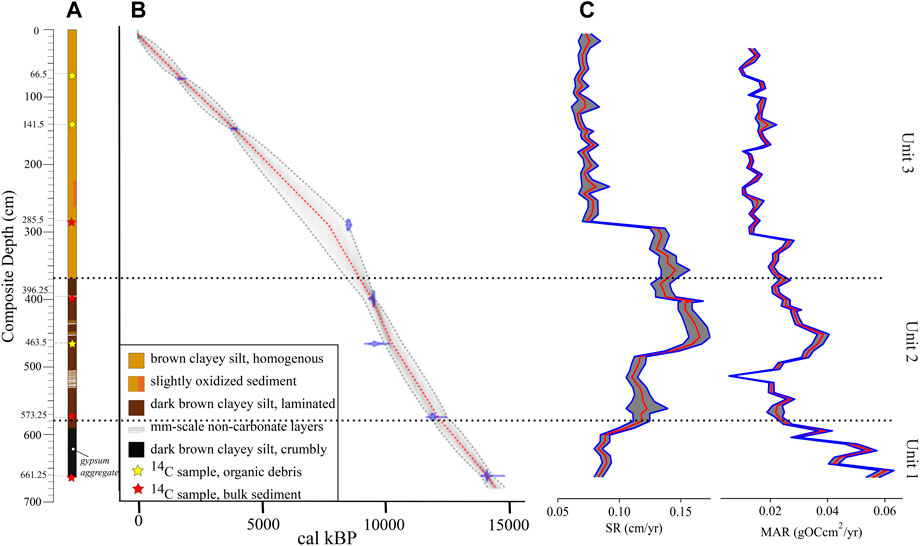
FIGURE 2. (A) General stratigraphy and (B) age-depth model of the sediment core, based on radiocarbon dating of 7 samples, shown as green/yellow stars (see details in Table 1). (C) Inferred sedimentation and mass accumulation rate (SR and MAR) curves along the core, based on the age-depth model.
The age depth model indicates a higher average sedimentation rate (SR) of 0.13 cm a−1 below 290 cm, and a lower average SR of 0.07 cm a−1 in the upper horizon. Considering the dry bulk density (DBD) of each sample, instantaneous sediment mass accumulation rates (MARs) range from 0.02 g cm−2 a−1 above 300 cm depth to 0.06 g cm−2 a−1 near the bottom of the core. Considering each unit separately, average MAR values are 0.05 g cm−2 a−1 for Unit 1, 0.03 g cm−2 a−1 for Unit 2, and 0.02 g cm–2 a−1 for Unit 3. Average OCAR is similar in Unit 1 (57 g m–2 a−1) and Unit 3 (55 g m−2 a−1) and highest in Unit 2 (77 g m–2 a−1) (Figure 5).
General Stratigraphy
The composite sequence is separated into three broad stratigraphic units based on the sedimentological and biogeochemical analyses (Figure 2) and the cluster analysis (Supplementary Figure S2). Due to an existing talik (area of unfrozen ground surrounded by permafrost) below Lake Malaya Chabyda (Bakulina et al., 2000), the entire sequence was unfrozen. From bottom to top, stratigraphic zones are described as follows:
Unit 1 (663–584 cm) (14.1 cal kBP–12.3 cal kBP). The bottom 80 cm of the sequence consists of dark brown massive (i.e., not laminated) clayey silt. The lower section (663–619 cm) is notably dry and has a ‘crumbly’ texture. A small gypsum aggregate particle was found within this unit (623 cm) and identified using a binocular microscope. The upper section (636–584 cm) appears less dry and displays mm-scale, sections of lighter grayish brown.
Unit 2 (584–376 cm) (12.3 cal kBP–9.0 cal kBP). This unit is composed of dark brown, laminated, clayey silt with interstratified light brown to white laminations. These laminations are well-defined horizontal layers of non–calcareous sediment (based on room temperature HCl (10%) test), each one being approximately 1 cm thick and continuous across the width of the sediment cores. The light-colored laminations are notably visible at three sections of the unit, i.e., between 550 and 505 cm depth, and near 450 and 435 cm depth. Above 400 cm depth, the core transitions to homogenous light colored clay characteristic of Unit 3.
Unit 3 (376–0 cm) (9.0 cal kBP–CE 2013). This unit is uniformly lighter brown, silty, homogenous (non-laminated) clay. Traces of oxidation were observed between ∼265 and 225 cm depth.
Grain-Size Distribution
The grain size of the sediment core ranges from uni–, bi–, to trimodally distributed, and spans a size range from medium silt to very-fine sandy coarse silt. The mean grain size for the entire core is 29.05 μm (±6 μm), with a minimum size of 14.4 μm at 156 cm depth and a maximum size of 40.9 μm at 624 cm depth (Figure 3). The sorting ranges from poorly to very-poorly sorted. Sorting becomes generally more poorly sorted below 400 cm depth (Figure 3). The grain size distribution of clay, silt, and sand remains fairly consistent throughout the length of the core, with silt dominating the distribution (∼80%) throughout the entire core (Figure 3).
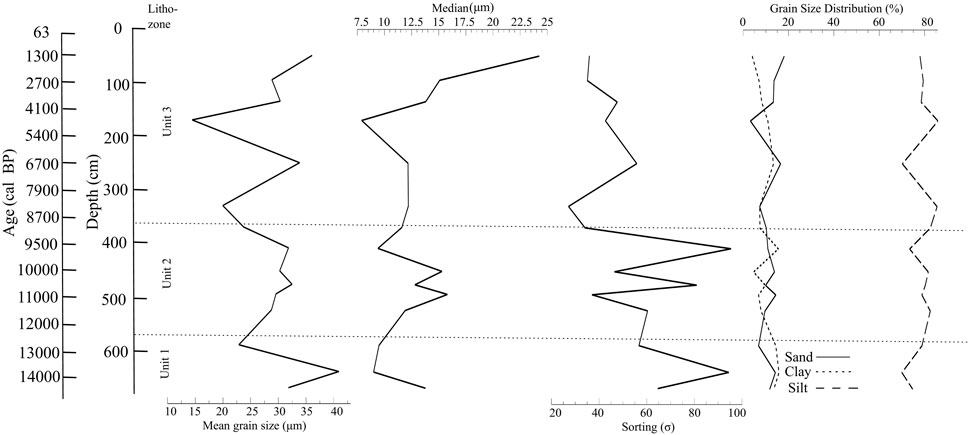
FIGURE 3. Analysis of mean and median grain size, as well as sorting and grain size distribution (% of clay, silt and sand) of 16 samples.
Biogeochemistry
From the base of the sequence to the top of Unit 1 (584 cm depth), TOC content decreases consistently from 17 to 6.5 wt% (Figure 4). There is a sharp increase in TOC content from the lowest value of 6.5% at 584 cm depth (top of Unit 1) to ∼35 wt% at just above 500 cm depth (base of Unit 2). The TOC content is relatively stable in the upper two units (Unit 2 and Unit 3) of the sediment sequence, remaining between 30–40 wt%. OCAR, controlled by both TOC and MAR, experiences two low peaks (∼20 g OC m−2 a−1) at 600 cm depth and 500 cm depth. OCAR decreases throughout Unit 1 from approximately 100 g OC m−2 a−1–24 g OC m−2 a−1. Apart from the low peak at 500 cm depth, OCAR increases relatively steadily throughout Unit 2. There is a high peak of 127 g OC m−2 a−1 at 438 cm depth. OCAR then decreases into Unit 3 where it stabilizes around 50 g OC m−2 a−1 from approximately 300 cm depth (Figure 5). Considering each unit separately, OCAR average values are 101 g OC m−2 a−1 (ranging from 63 to 158 g OC m−2 a−1) for Unit 1, 293 g OC m−2 a−1 (ranging from 168 to 397 gOC m−2 a−1) for Unit 2, and 205 g OC m−2 a−1 (ranging from 144 to 354 g OC m−2 a−1) for Unit 3.
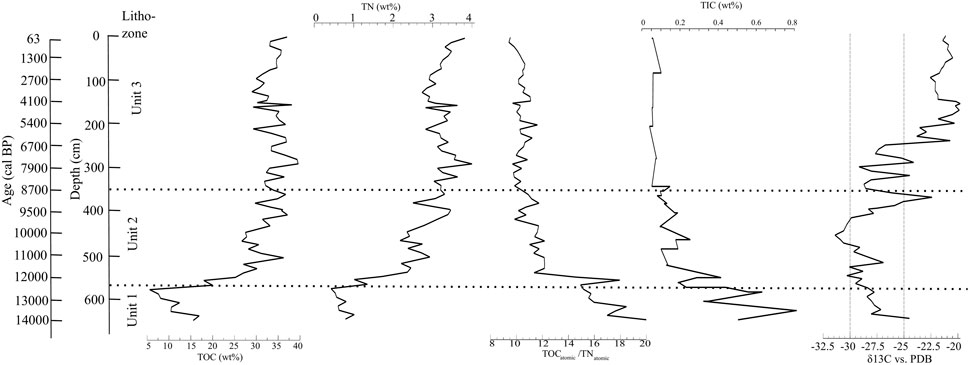
FIGURE 4. Biogeochemical proxies measured of 78 discrete samples, including total organic carbon (TOC), total nitrogen (TN), TOC/TNatomic ratio, total inorganic carbon (TIC) and δ13C trends (vertical dashed lines represent the usual isotopic signature of C3 land plants; see Figure 7).
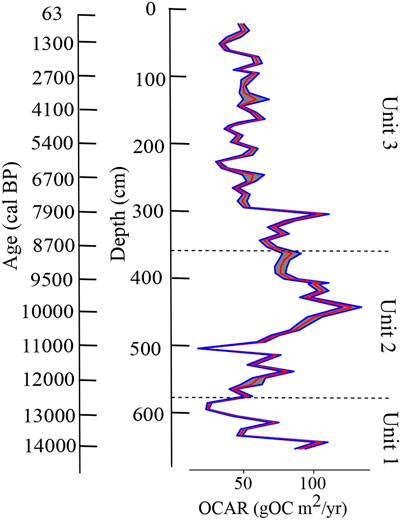
FIGURE 5. Organic carbon accumulation rate (OCAR, in g OC m−2 a−1) for each biogeochemical subsample along the core (see Figure 4), inferred from the age-depth model, as well as sedimentation and mass accumulation rates (see Figure 2).
Similar to TOC, TN is lowest in Unit 1 at the base of the core (below 1 wt%) and increases steadily throughout Unit 2 to approximately 3 wt% (Figure 4). TN is relatively stable throughout Unit 3 at approximately 3.5 wt%. There is less variability in TN above 150 cm depth and a steadily increasing trend to a maximum value of nearly 4 wt% at the top of the core (Figure 4). The TOC/TNatomic is highest at the bottom of the sequence (TOC/TNatomic = 20) and decreases consistently throughout Unit 1. After a transient peak at 570 cm depth (TOC/TNatomic = 18), the TOC/TNatomic ratio is very stable in the top two horizons of the sediment sequence, remaining at nearly 12 (Figure 4). The TOC/TNatomic ratio is highest for Unit 1 (20), while Unit 2 and Unit 3 have similar values of 14 and 12, respectively (Figure 6). TIC content is low throughout the entire sequence (0.0–2.4 wt%), although Unit 1 (below 584 cm) has slightly higher average values compared to the other units (Unit 1 average: 1.9 wt% versus Unit 2 average: 0.6 wt%, Unit 3 average: 0.7 wt%) (Figure 4).
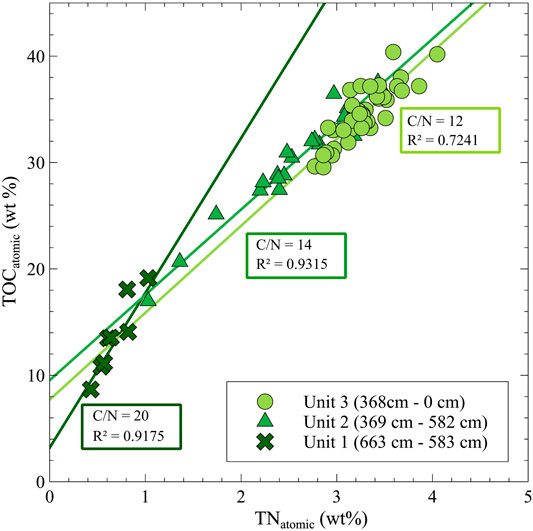
FIGURE 6. Carbon (wt%) versus nitrogen (wt%) ratio by unit.
δ13C values decrease consistently throughout Unit 1 (Figure 4). In the overlying units, δ13C values increase from the lowest value (−31.9‰) at 475 cm depth (middle of Unit 2) until approximately 150 cm depth (middle of Unit 1) to −20.3‰. Above 150 cm depth, δ13C values decrease slightly and then remain stable until the top of the core (Figure 4). Although identifying the distinct sources of organic material in a lacustrine environment is complicated by competing signals from the lake and catchment, the relationship between TOC/TNatomic and δ13C values can help further distinguish OM origin (Meyers and Teranes, 2002). Unit 1 plots within the C3 land plant zone, while Units 2 and 3 plot within the lacustrine algae zone (Figure 7). Again, much of Unit 3 plots above typical values for lacustrine algae.
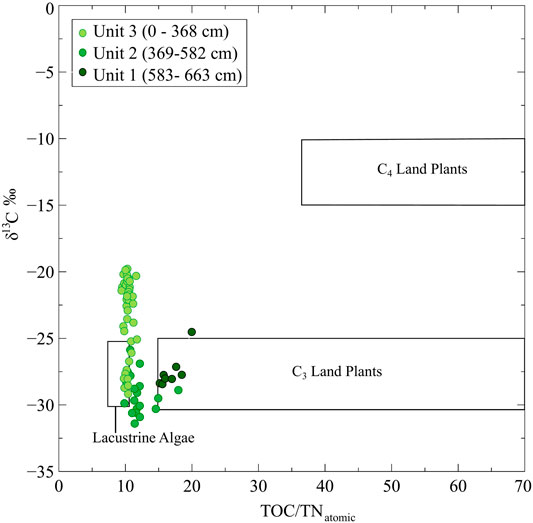
FIGURE 7. δ13C versus TOC/TNatomic ratio of 78 discrete samples. Lacustrine algae, C3 land plant, and C4 land plant designations from Meyers and Teranes, 2002.
Inorganic Elemental Composition
The main rock forming elements analyzed include rubidium (Rb) (Kalugin et al., 2013), zirconium (Zr) (Marshall et al., 2011), titanium (Ti) (Balascio et al., 2011), silicon (Si) (Marshall et al., 2011; Martín-Puertas et al., 2011), calcium (Ca) and strontium (Sr) (Bouchard et al., 2011) and associated ratios. CLR transformed values of Rb and Zr have almost identical profiles (Figure 8). Unit 1 has the highest values of Rb and Zr with low variability. Unit 2 and Unit 3 have low values and very high variability. Ti has similar values in Unit 1 and Unit 3, but there is a notable decrease in Unit 2, with higher variability. Si values increase slightly through Unit 1, then decrease from the bottom of Unit 2 until the middle of Unit 3. Si values increase from 250 cm depth (6.7 cal kBP) to 100 cm depth (2.7 cal kBP), where the values remain consistent until the top of the core (Figure 8). Ca and Sr are high in Unit 1 with relatively low variability (Figure 8). The bottom half of Unit 2 shows a decrease in Ca and Sr; values return to similar levels seen in Unit 1 in the upper half of Unit 2. These values decrease into Unit 3, where they are low with low variability. Ca/Ti, follows a similar trend to Ca. Unit 2 has the highest values, while Unit 3 has consistently low values and low variability (Figure 8).
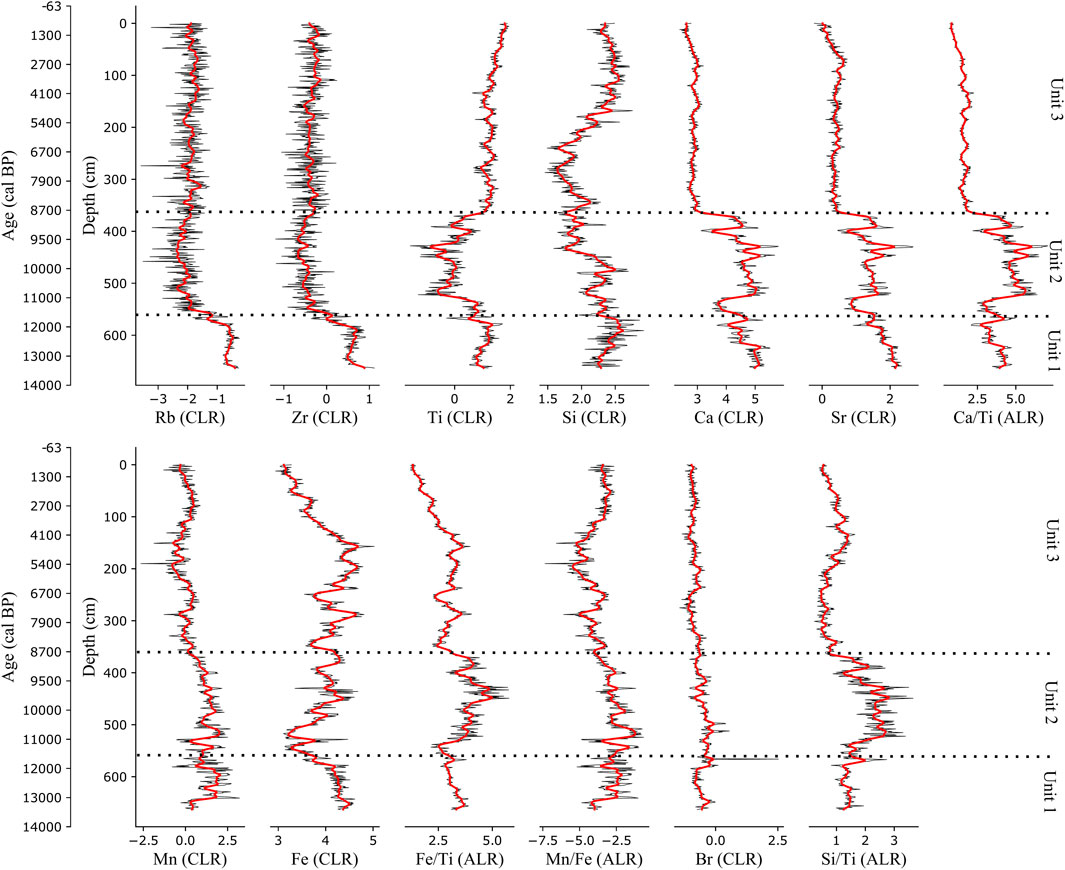
FIGURE 8. XRF profiles of selected elements and elemental ratios along the core. The thin black lines represent continuous measurements (sampling interval of 10 mm), and the thicker red lines represent the 5-point running mean.
Redox sensitive elements analyzed include manganese (Mn) and iron (Fe) (Haberzettl et al., 2007; Bouchard et al., 2011). Mn values are consistent throughout the entire core, with some small changes in the variability of the values between units. Fe values in Unit 1 are high, with low variability. There is a low peak in the lower half of Unit 2, with values returning to Unit 1 levels by the top of Unit 2. Fe values fluctuate between high and low peaks from the bottom of Unit 3 until approximately 150 cm depth (4.0 cal kBP), where values decrease consistently. Fe/Ti (Figure 8), which also represents reducing conditions as well as a possible reduction in grain-size (Marshall et al., 2011; Davies et al., 2015), decreases throughout Unit 1. Fe/Ti increases in the lower half of Unit 2, reaching the highest values at approximately 550 cm depth (∼11.7 cal kBP), before decreasing in the upper half of Unit 2 and stabilizing in the lower half of Unit 3. Fe/Ti values decrease consistently throughout the upper half of Unit 3. Oxygenation of the water column is represented by Mn/Fe (Melles et al., 2012). The highest values are present in the lower half of Unit 2 around 500 cm depth (∼11.0 cal kBP). Values decrease above 500 cm depth until the middle of Unit 3 at around 200 cm depth (∼5.4 cal kBP), where values increase again until the top of the sediment core (Figure 8).
Elements and elemental ratios that are sensitive to changes in organic content include bromine (Br) (Kalugin et al., 2007, 2013; Bouchard et al., 2011) and silicon/titanium (Si/Ti) (Melles et al., 2012). Br values decrease throughout Unit 1 (Figure 8). Values in Unit 2 increase from the bottom of this unit until a large peak at 520 cm depth, after which, the values decrease. Unit 3 has decreasing Br values until 250 cm depth, after which there is a sharp, but brief increase. Br values decrease from approximately 230 cm depth until the top of the sediment core. Si/Ti, which is particularly sensitive to increases in biogenic silica (notably diatoms) (Melles et al., 2012), follows a different pattern. Unit 2 has the highest Si/Ti values (Figure 8). Unit 3 has Si/Ti values which are slightly lower than Unit 1, with a slight increase that peaks around 100 cm depth (2.6 cal kBP).
PCA Analysis
For Unit 1, PC1 accounted for 56.8% of explained variance, while PC 2 accounted for 22.7% variance (Supplementary Figure S4A). Ca, Sr, and TOC/TNatomic are positioned together in the upper left quadrant, while Fe, C (wt%), TOC (wt%), and TN (wt%) are positioned together in the lower left quadrant. Zr is positioned in the upper right quadrant, while Ti is positioned in the lower right quadrant. δ13C is very well negatively correlated to PC2.
For Unit 2, PC1 accounted for 39.6% of explained variance, while PC 2 accounted for 24.4% of explained variance (Supplementary Figure S4B). Ca and Sr are positioned together in the upper left quadrant, while TOC/TNatomic, Zr, and Ti are positioned together in the bottom left quadrant. C (wt%), TOC (wt%), and TN (wt%) are very well positively correlated to PC1. Fe and δ13C are well negatively correlated to PC 2.
For Unit 3, PC 1 accounted for 32.8% of explained variance, while PC2 accounted for 22.4% of explained variance (Supplementary Figure S4C). Sr is very well negatively correlated to PC 1, while Ca, TOC/TNatomic, and Fe are positioned together in the lower left quadrant. C (wt%), TOC (wt%), and TN (wt%) are positioned together in the lower right quadrant. TOC (wt%) and C (wt%) are very well correlated. Ti is positioned in the upper right quadrant. Zr and δ13C are very well positively correlated to PC 2.
Discussion
Multiproxy-Inferred Paleolimnological History
Unit 1 (Late Pleistocene)
The observed depositional history of Lake Malaya Chabyda starts in Unit 1, which spans a time frame from approximately 14.1 – 12.3 cal kBP (Late Pleistocene). The TOC/TNatomic ratio at the bottom of the core represents the maximum (20) measured in the entire recovered sequence, indicating a stronger contribution of carbon produced by vascular land plants than aquatic algae (Figure 6) (Meyers, 1994). Both, the TOC (average = 12 wt%) and TN (average = 0.68 wt%) values are lower in Unit 1 compared to Unit 2 and Unit 3, although relatively high compared to other sites in this region (Vyse et al., 2021). Decreasing TOC and MAR values, resulted in decreasing OCAR values throughout this Unit culminating in a low peak at 600 cm depth (Figure 2, Figure 5). During the time of deposition, this region was still experiencing cold temperatures associated with the Late Pleistocene deglaciation period in the Northern Hemisphere and active microbial decomposition would have been restricted to a short period of time after spring thawing and before the onset of winter cold temperatures. Therefore, microbial decomposition would not have been particularly abundant, limiting significant OM degradation (Davidson and Janssens, 2006). As a result, the lower levels of TOC observed in Unit 1 cannot be explained solely by more active microbial decomposition compared to Unit 2 and Unit 3. It is more likely that Unit 1 experienced lower OC input compared to the upper two units. It is also possible that longer periods of ice cover compared to Unit 2 and Unit 3 restricted in situ autotrophic production (algae) in the lake. However, these TOC values are high compared to other reported values from Yedoma permafrost (Windirsch et al., 2020; Vyse et al., 2021; Figure 8). Moderately high δ13C values, high TIC values, and relatively low TOC (Figure 4) compared to Units 2 and 3 corroborate lower levels of bioproductivity within the lake and indicate input from sources of inorganic carbon during this time (Schirrmeister et al., 2011), as shown in other lake records from Yakutia (Biskaborn et al., 2012). These trends could also reflect an increase in accumulation of authigenic CaCO3, which was not explored in this study, but remains a possibility.
Unit 1 is massive, exhibiting no layering, and has fairly homogenous elemental composition for most of the elements examined using XRF. Analysis of detrital elements Rb, Zr, Si, and Ti indicate that Unit 1 had the highest level of terrestrial input compared to Unit 2 and Unit 3. Higher mineral detrital input coupled with low TOC, high TOC/TNatomic ratio, and moderate δ13C values indicate overall low productivity within the lake. The absence of soil stabilizing vegetation surrounding the lake due to prevalent cold conditions could have facilitated the input of clastic material from the catchment (Subetto et al., 2002; Nazarova et al., 2013). Si/Ti ratios and preliminary inspections of smear-slides (one slide for each unit) suggest that there are diatoms present in all units, indicating that there was an aquatic system at the core location (Vyse et al., 2020). This matches with a continuous diatom record over 14 cal kBP from Lake Ulakhan Chabyda (Figure 1) 4 km northwest of Lake Malaya Chabyda (Pestryakova et al., 2012; Herzschuh et al., 2013). High Ti values can also indicate increased run-off from precipitation events and/or increased aeolian deposition (Davies et al., 2015). This could have been the case at the study site, with active soil erosion and transport associated with poorly developed vegetation cover during this period of cold, Late Pleistocene climate (Biskaborn et al., 2021b). Precipitation was generally low in the study site region during the time of deposition, making increased aeolian deposition more likely than increased run-off from precipitation events (Biskaborn et al., 2012). Relatively high Ca, Ca/Ti, and Sr values can be indicative of a persistent alkaline environment under semi-arid conditions, which can be attributed to Lake Malaya Chabyda during the deposition of Unit 1. These conditions are also observed in neighboring lakes (Ulkahan Chabyda and Temje Lake) (Herzschuh et al., 2013; Nazarova et al., 2013). Both low precipitation and/or strong summer insolation would enhance evaporation. Additionally, during this period, there were open landscapes, strong winds, and, as a result, increased evaporation from the surface of the lakes. The absence of soil cover and swamps around the lake contributed to the absence of humic acids in the surface runoff and the water in the lake was predominantly alkaline, with low bioproductivity and ultra-oligotrophic in contrast to the later Holocene period. It is also possible that changes in Ca, Ca/Ti, and Sr trends throughout the core are more related to changes in regional sources for these elements.
The Mn/Fe ratio for the Lake Malaya Chabyda core is generally higher and more variable in the lower sections of the core, specifically in Unit 1. Higher Mn/Fe compared to the rest of the core indicates predominately oxic conditions as Mn is more readily reduced (dissolved) under anoxic conditions compared to Fe (Davies et al., 2015; Vyse et al., 2020). Shallow lake depth (i.e. light can penetrate to the bottom of the lake) as well as low productivity and stronger lake water mixing could be responsible for maintaining oxygenated bottom waters and a shallow lake could experience evaporation indicated by the proxies described above.
Grain-size distribution and sorting provide information about the dominant denudation, erosional, and transport processes at the study site. Grain size ranges from coarse silt to fine silt and poor to very-poorly sorted sediments are present throughout the entire core (Figure 3), indicating either a relatively short sediment transport distance or the influence of a combination of different erosional and transport processes (Folk and Ward, 1957). It is also possible that the early lake had a very different shore structure than is present today and that active slumping and abrasive processes could have taken place, creating a large amount of unsorted mineral matter input to the lake. A longer transport distance or the influence of a single dominant transport process, such as aeolian activity, would likely have resulted in stronger sorting of grain sizes throughout the core (Biskaborn et al., 2013). Unit 1 sediments are slightly more “poorly sorted” compared to Unit 2 and Unit 3. This is perhaps related to higher detrital input from the surrounding catchment. The polymodal nature of the grain size distributions suggests that the source sediments are heterogeneous and polygenetic in origin (Supplementary Figure S5) (Schirrmeister et al., 2011; Wang et al., 2015; Ulrich et al., 2019). According to grain-size results, there is no sand-dominated material that could have clearly confirmed the sand-dune origin (‘tukulan’) of the lake, as sand percentage remained <20% along the whole core, including at its base (Figure 3). In fact, the top of the core has the highest percentage of sand (18%). However, we expect that such sand-rich deposits lie deeper, in older sediments.
Unit 2 (Late Pleistocene-Holocene Transition)
The proxy analyses suggest that Unit 2, spanning the Late Pleistocene-Early Holocene transition (∼12.3 – 9.0 cal kBP), was deposited under variable limnological conditions. Unit 2 has a consistently high level of TOC (30 – 36 wt%; average 31 wt%), and its TOC/TNatomic ratio (average of 14, ranging from <10 to 18) is close to the 4 – 10 range indicating production by phytoplankton or algae (Meyers, 1994; Ulrich et al., 2019) (Figure 6). There is a consistent reduction in TIC throughout Unit 2, while δ13C first decreases slightly, then increases in the upper half of Unit 2 (Figure 4). δ13C values can vary inversely to water depth and/or in a direct relationship with primary productivity (Meyers, 2003), suggesting that Lake Malaya Chabyda could have experienced lake deepening and then shallowing and/or a decrease followed by an increase in primary productivity within the lake as is supported by strongly increasing Si/Ti values (Figure 8). During the Holocene, increasing thermokarst activity likely caused lake deepening, followed by lake shallowing as thermokarst activity stabilized and the lake depression began to be filled by sediments (Andreev et al., 2003). Analysis of these proxies nonetheless suggests a transition to a dominance of lacustrine versus terrestrial carbon source between 12.3 cal kBP and 9.0 cal kBP (Biskaborn et al., 2013).
Sedimentation experienced an initial decrease in the bottom half of Unit 2 (MAR decreasing from 0.03 g cm−2 a−1 bottom of Unit 2 to 0.006 g cm−2 a−1 at 500 cm depth), before gradually increasing to 0.04 g cm−2 a−1 cm at 450 cm depth (Figure 2). MAR then decreases slightly until about 300 cm depth, where it stabilizes until the top of the core. OC delivery was high during the Early Holocene (average OCAR 83 g OC m−2 a−1 above 500 cm of composite depth, i.e., after ∼11 cal kBP until about 300 cm depth, i.e., 7.9 cal kBP). Such rates are clearly well above the reported values for high-latitude lake basins and notably higher than global modern values (Vyse et al., 2021 and references therein).
Unit 2 is the only unit in the Lake Malaya Chabyda sediment core which exhibits any clear layering or laminations (Figure 2). The subsection of Unit 2 between 535 cm depth and 500 cm depth exhibits the most pronounced layers, with mm scale alternations between light colored non calcareous layers (determined using dilute acid) and the brown, massive clayey silt layers. The presence of these layers indicates a lack of bioturbation and enhanced preservation of OM (Melles et al., 2012). Analysis of detrital elements, Rb and Zr indicate that Unit 2 experienced lower levels of detrital input compared to Unit 1 and higher rate of deposition of organic material produced within the lake, i.e., by algae. Unit 2 has the lowest Ti values compared to Unit 1 and Unit 3, further suggesting a decrease in detrital input. This signal could also be related to a decrease in the relative proportion of detrital inputs due to an increase in accumulation of lighter OM produced within the lake coupled with a decrease the detrital input (Balascio et al., 2011; Davies et al., 2015). This signal is also corroborated by a slight decrease in SR between Unit 1 and Unit 2 and a decrease in MAR between Unit 1 and Unit 2. A shift in bulk sediment deposition from mainly allochthonous in Unit 1 to mainly autochthonous sources in Unit 2 is likely indicative of an increase in biological activity within the lake contributing to an increase in the deposition of OM compared to sediment input from the surrounding catchment. In the Holocene, vegetation cover and soils are formed within the catchment area, resulting in a weakening of the processes of denudation and erosion (Andreev et al., 2003). Only dissolved substances enter the surface runoff, and groundwater and sedimentation begin to be dominated by intra-reservoir processes, particularly, the bioproductivity of the lake ecosystem (Subetto et al., 2017).
Values of Ca and Sr in Unit 2 are more variable but have slightly lower average values compared to Unit 1. There is a low peak in both elements at approximately 530 cm depth (approximately 11.3 cal kBP) suggesting that the lake did not experience any significant evaporative stages or that there were changes in the availability and input source of Ca-rich clastic material. These variabilities in Ca and Sr could also be associated with changing wind directions and reallocation of sediment sources controlled by migrating dune features, as well as changing patterns of detrital input from the surrounding catchment. These variabilities may also be due to a change in the hydrochemical characteristics of the water in the lake. Above this low peak, Ca and Sr values return to Unit 1 levels, but with higher variability, suggesting continued changes within the catchment that affected the source and/or availability of Ca and Sr source materials. Unit 2 has the highest values for Ca/Ti, which can indicate carbonate deposition (Davies et al., 2015). Ca/Ti can be controlled by in-lake (autochthonous) carbonate precipitation, biologically mediated calcite production, and/or input of additional old carbonate from catchment sources. Haberzettl et al. (2007) suggest that high Ca/Ti values indicate lower lake levels, resulting in a proliferation of biologically induced calcite production (i.e., P. lenticularis) related to warmer water temperatures and higher concentrations of nutrients. Warmer water temperatures and higher concentrations of nutrients could be related to shallow lake conditions for Unit 2. These hypotheses are corroborated by δ13C, which increases consistently throughout Unit 2, suggesting a decrease in water depth and/or an increase in biological activity (Meyers, 2003).
The Mn/Fe ratio for Unit 2 decreases consistently throughout the entire unit. Oxygen-depleted conditions could be related to continued microbial activity beneath the winter-ice cover and/or higher levels of primary productivity associated with mixing of the bottom waters in the summer season (Hughes-Allen et al., 2021). This is a possible scenario as the Early Holocene experienced very cold winters (Meyer et al., 2015) and thus prolonged periods ice cover (Biskaborn et al., 2012). The Early Holocene is also associated with an increase in thermokarst lake development in central Yakutia related to warm summers. Warm summer temperatures, like prolonged periods of ice cover, can cause periods of anoxic bottom waters (Hughes-Allen et al., 2021). This is also supported by PCA biplots (Supplementary Figure S4), suggesting a strong relationship between redox-sensitive elements (Fe) and organic matter proxies in the lower units 1 and 2 (Heinecke et al., 2017).
Unit 2 has the highest Si/Ti values compared to the other two units, which is also indicative of high levels of biological activity. The depositional characteristics of Unit 2 suggest that a transition occurred at approximately 12.3 cal kBP from the preferential deposition of terrestrial carbon and low lake primary productivity conditions of Unit 1 to preferential deposition of aquatic carbon and high lake primary productivity in Unit 2.
Unit 3 (Early Holocene to Present)
The proxy analyses indicate that Unit 3, deposited since the Early Holocene (∼9.0 cal kBP), was formed with some variability in lake depth, bottom water oxygen availability, and biological activity. Unit 3 is more homogenous than Unit 1 and Unit 2, both in terms of a lack of discernable laminations or other features and homogeneity within the biogeochemical metrics analyzed. Average TOC content is >34 wt% (ranging from 29 to 39 wt%) in this unit, higher than elsewhere along the core and an order of magnitude above most of the reported values for lakes across Yedoma regions (Vyse et al., 2021). Presumably, this period heralded higher levels of bioproductivity and increased nutrient supply to an expanding lake at the study site. The mean TOC/TNatomic ratio of Unit 3 is 12, which indicates some dominance of production by phytoplankton or algae (Meyers, 1994; Ulrich et al., 2019) (Figure 6) with minor contribution from vascular plants in the lake catchment area (Heinecke et al., 2017). Shallower lake waters would have amplified the influence of carbon from the lake catchment on the TOC/TNatomic ratio. This value suggests a dominance of lacustrine rather than terrestrial carbon input between 9.0 cal kBP and present day (Biskaborn et al., 2013).
OC delivery decreased after 7.9 cal kBP, as shown by an average OCAR of 55 g OC m−2 a−1 for Unit 3. This was the result of a lower sedimentation (average MAR decreasing from ∼0.02 g cm−2 a−1 at the top of Unit 2 to ∼0.01 g cm−2 a−1 in the upper section of Unit 3). Still, OCAR values of 55 g OC m−2 a−1 are notably in the upper range of global modern values and significantly higher than elsewhere across high-latitude regions (Vyse et al., 2021; Figure 8). TIC remains consistently low throughout Unit 3, while δ13C increases in the lower half of the unit, before decreasing and then stabilizing in the upper half of the unit. This could indicate decreasing lake levels followed by increasing lake levels. Changes in δ13C could also be controlled by changes in primary productivity. In this case, primary productivity would have decreased briefly, then increased from the bottom to the top of Unit 3 (Meyers, 2003).
The profiles for detrital elements Rb and Zr are nearly identical to Unit 2 and offer no strong indications of changing catchment regimes or erosional transport. However, Ti values are much higher compared to Unit 2, returning to Unit 1 levels. It is possible that Ti deposition was more sensitive to increases in detrital input. Ti can be also be associated with increased run-off from rain events (Corella et al., 2012) and/or increased aeolian deposition (Bakke et al., 2009) and it is possible that the observed trends are linked to changes in these processes.
Unit 3 has the lowest values for elements Ca and Sr, suggesting a distinctly lacustrine environment that did not experience any significant evaporative events. Ca/Ti, which is also associated with evaporative events, is also consistently low and less variable throughout Unit 3. Mn/Fe values decrease from the bottom of Unit 3 until approximately 200 cm depth (5.4 cal kBP), suggesting increasing lake depth and more frequent periods of anoxic bottom water conditions (Davies et al., 2015). As lake depth increases, unfrozen lake water persists during winter and microbial activity can continue under the ice cover. The ice cover does not allow gas exchange with the atmosphere, creating an anoxic environment at the water-sediment interface (Hughes-Allen et al., 2021). Anoxic conditions can also occur in the summer related to high levels of primary productivity. Unit 3 has the lowest Si/Ti values (between 390 cm depth and 175 cm depth) compared to the rest of the core, and relatively low levels of Br, which can be related to decreases in the input of biogenic silica (Melles et al., 2012) and organic content (Kalugin et al., 2007, 2013; Bouchard et al., 2011), respectively. These low values for elements normally associated with high biological activity suggest that primary productivity is not high enough to account solely for an increase in anoxic bottom water conditions. Mn/Fe values increase from 200 cm depth until approximately 75 cm depth (1.9 cal kBP), where they remain stable until the top of the sediment core. Increasing Mn/Fe values suggest less frequent anoxic conditions, which might have resulted from moderate lake depth decrease, enhanced wind activity, and/or shorter periods of ice-cover allowing for more water column mixing (Hughes-Allen et al., 2021). Si/Ti values also increased during the same time period, potentially indicating a slight increase in the deposition of biogenic silica, which could be related to an increase in primary productivity. Perhaps a decrease in lake depth, that was not so drastic as to cause Lake Malaya Chabyda to freeze to the lake bottom in the winter, caused an increase in water temperature and increased nutrient concentrations during the biologically productive ice-free seasons. These analyses suggest that Unit 3 was deposited under very stable sediment deposition conditions, although there was some variability in lake depth, bottom water oxygen availability, and biological activity. Lacustrine algae were the main source of OC deposited in the lake during this period.
Lake Malaya Chabyda Carbon Accumulation Rates
Total organic carbon concentration (TOC) is a crucial proxy for understanding the abundance of OM in sediments, including the proportion of OM that evaded remineralization during the sedimentation process. The concentration of OM in sediment is generally equivalent to twice the recorded TOC value (Meyers, 2003). Therefore, TOC values can suggest initial production of biomass as well as subsequent levels of degradation. Moreover, since TOC concentrations are expressed in % weight, therefore influenced by mineral/clastic matter inputs (artificially diluted or concentrated), it can be useful to infer organic carbon (OC) accumulation rates (expressed as mg OC cm−2 a−1 or g OC m−2 a−1) when reliable age-depth model and estimations of sediment dry bulk density for each sample are available (Meyers, 2003).
High TOC values, high TOC/TNatomic ratios, and low δ13C generally reflect OM which have not undergone significant decomposition under anaerobic conditions (Schirrmeister et al., 2011; Ulrich et al., 2019). Although Unit 1 showed the highest TOC/TNatomic ratio (20), it also had a lower weight percent of carbon (<20 percent C) compared to Unit 2 and Unit 3 (greater than 30 percent C for both units). Unit 1 can therefore be classified as a mineral sediment (<20% C). Mineral sediments lose 6–13% on average of their OC within 1 decade after exposure due to thawing or other processes (Schirrmeister et al., 2011). Moreover, the inferred OCARs for Unit 1 indeed represent low values compared to Unit 2, with an average of ∼100 g OC m−2 a−1 (ranging from 24 to 105 g OC m−2 a−1; Figure 5). These low values are nevertheless higher than reported rates for temperate latitudes, such as the Great Lakes in North America (e.g., Meyers, 2003), and much higher than several arctic/subarctic sites, such as northern Québec (Ferland et al., 2012, 2014), Finland (Pajunen, 2000), Greenland (Anderson et al., 2009; Sobek et al., 2014), as well as southeastern and northeastern Siberia (Martin et al., 1998; Vyse et al., 2021).
Unit 2 and Unit 3 have greater than 20% carbon and are therefore classified generally as organic sediments. Unit 2, in particular, exhibited significant layering, which suggest a lack of bioturbation and enhanced preservation of OM and/or seasonal changes in sedimentation processes. Organic deposits, including deposits that are aquatic in origin (i.e. fluvial, alluvial, and lacustrine), typically exhibit decade-long losses of 17 – 34% of their OC after exposure by thawing or other processes (Schirrmeister et al., 2011). Some studies suggest that input of ancient carbon into aquatic systems may augment or even galvanize remineralization of modern dissolved OC (Vonk and Gustafsson, 2013; Mann et al., 2015; Strauss et al., 2017). This effect is likely due, in part, to low levels of carbon decomposition during deposition (i.e. colder conditions) and before thawing (Vonk et al., 2013). A significant portion of the Lake Malaya Chabyda sediment core is classified as organic sediment, which is predicted to lose comparatively high percentages of their OC upon potential exposure. Jongejans et al. (2021) found that although the OC content of the Yukechi Yedoma ice complex sediments was relatively low, there was substantial greenhouse gas release upon thawing. These findings point to OM quality and decomposition history and more important drivers of greenhouse gas release than OM content alone (Jongejans et al., 2021). Although a lake currently exists, proxy evidence discussed above suggest that Lake Malaya Chabyda did experience high levels of evaporation, which might have brought the lake close to desiccation in the past. Changing temperature and precipitation regimes, lower precipitation and higher temperatures for example, might make drying out more likely in the future for this relatively small and shallow lake. In this case, it is important to consider OM quality and possible future greenhouse gas release. Furthermore, inferred OCARs for Unit 2 show a strong increase from the base (42 g OC m −2 a−1) to the top (76 g OC m−2 a−1) of this unit, in accordance with developing lacustrine conditions and enhanced biological productivity from algae (i.e., mostly autochthonous source of OM). OC accumulation rates for Unit 3 are slightly lower, but still quite high (average of ∼200 g OC m−2 a−1, ranging from 144 to 354 g OC m−2 a−1) compared to other reported values in both temperate and high-latitude regions (Meyers, 2003; Vyse et al., 2021 and references therein). As Lake Malaya Chabyda is located in a semiarid climate, with high summer temperatures and humid climate, the primary production in its ecosystems can be quite high, resulting in strong accumulation of organic matter in bottom sediments (Biskaborn et al., 2021b). Given the significant increase of OCAR (Figure 5) and TOC accumulation (Figure 4) around 11 cal kBP, Lake Malaya Chabyda likely transitioned to an OC sink at approximately the Pleistocene-Holocene transition. However, data about lake morphology (especially the ratio between lake area and mean depth) and C emissions, which control the net C balance (Ferland et al., 2012), are not available for this site. Ferland et al. (2012) found that sediments in large and shallow lakes (i.e., Lake Ulakhan Chabyda), experience higher rates of decomposition compared to smaller lakes. This is due, in part, to the greater exposure of sediments in these lakes to warmer surface waters which accommodate higher rates of sediment decomposition. Additionally, small lakes, especially those with steeper bathymetry, can have high sedimentation rates and sediment focusing, which reduces the efficiency of sediment decomposition. These characteristics of small lakes lead to generally lower rates of OC degradation and enhanced long-term burial and storage of carbon. Compared to the nearby Lake Ulakhan Chabyda, notably larger but shallower (see study area above), Lake Malaya Chabyda likely acted as a more efficient C sink (per m2) with its ‘compact’ morphology (Ferland et al., 2014). The relatively high sedimentation rate recorded within Lake Malaya Chabyda, especially between 13 cal kBP – 7.9 cal kBP, likely also contributed to the lake acting as an efficient C sink, in part by reducing O2 exposure time (Ferland et al., 2014).
δ13C values can provide information about sources of OM and past productivity trends, as well as identify changes in the availability of nutrients in surface waters (Meyers, 2003; Ulrich et al., 2019). As phytoplankton preferentially use the lighter carbon isotope (12C), an increase in productivity causes an initial, but relatively brief decrease in δ13C in the lake water. However, as the phytoplankton deplete dissolved inorganic carbon stores in the lake, the δ13C values of the residual inorganic carbon in the lake water increases, causing enrichment in the δ13C values of the newly created OM (Meyers and Teranes, 2002). Re-equilibration between lake water DIC and atmospheric CO2 will occur over time, resulting in the deposition of OM not enriched in δ13C in the sediment layer. δ13C values decrease slightly from the bottom of the core until a low point at approximately 450 cm depth (10.0 cal kBP) (middle of Unit 2). This δ13C trend is complicated by the high levels of TOC and a TOC/TNatomic value of 14 in Unit 2, which would normally accompany more enriched δ13C values (Meyers and Arbor, 2001). It is possible that these low δ13C values around 450 cm depth are related to changes in the δ13C signature of available DIC in the lake and/or to changes in the degradation pathways of the δ13C. It is also possible that low algae production in the lake resulted from long periods of ice cover and/or low temperatures unfavorable to primary production.
δ13C values increase consistently from 450 cm depth (10.0 cal kBP) to 150 cm depth (4.0 cal kBP), where they remain stable to the top of the core, suggesting a continuous increase in primary productivity. However, this assumption is complicated by the fact that water from Lake Ulakhan Chabyda can flow into Lake Malaya Chabyda during times of high water. As Lake Malaya Chabyda is relatively small, it is possible that this influx of water could affect the δ13C signal in the sediment core. An increase in δ13C values can also be related to an increase in nutrient delivery from soil erosion and/or active layer development. Perhaps the continued expansion of Lake Malaya Chabyda by thermokarst processes has increased the availability of nitrates and phosphates, which could have enhanced primary productivity, resulting in an increase in δ13C values (Meyers and Teranes, 2002).
The TOC/TNatomic vs δ13C relationship (Figure 7) suggests that the majority of carbon deposited between 14.1–12.3 cal kBP (Unit 1) was from terrestrial (C3) land plants (Meyers and Arbor, 2001; Ulrich et al., 2019). This suggests that the bioproductivity in the lake was very low at the time of deposition (Heinecke et al., 2017) and therefore not recorded in the sediment core. Also possible is that detrital input to the lake was very high during this time, as discussed above. Decreasing MAR combined with low and decreasing TOC resulted in decreasing OCAR values within Unit 1 with a low peak at the top of this unit (Figure 2C; Figure 5). The dominance of vascular plant carbon also suggests higher input from the lake catchment to the lake compared to the upper two units. Thermokarst lakes usually do not have a classical littoral zone and the edges of the lakes are often overgrown with aquatic vegetation and surrounded by peat bogs. Therefore, there is no direct mineral runoff from the catchment area, as it is filtered by the peatlands. However, there can be significant input of organic matter coming from the surrounding peatlands to the lake. The OM found in Units 2 and 3 plots more toward an origin of lacustrine algae. Many of the points in Unit 3 plot above the expected values for lacustrine algae. The relatively high values (>−25‰) generally occur above 250 cm depth (6.7 cal kBP). Enriched δ13C values can occur is alkaline lacustrine systems where there is limited availability of dissolved atmospheric CO2 (δ13C = −8.5‰), therefore HCO3- (δ13C = 1‰) becomes the dominant source of inorganic carbon for lake algae, shifting the isotopic signature to higher (more enriched) values (Meyers, 2003). This effect might have been limited in Lake Malaya Chabyda, where modern pH is slightly acidic (pH = 6.71). This change in carbon source is reflected by comparatively heavier isotopic compositions for lake algae than normally expected (Meyers, 2003). Periods of very high bioproductivity resulting in a depletion in dissolved CO2 can be responsible for a shift from CO2 to HCO3−, among other possible explanations (Meyers, 2003).
Connections Between the Lake Environment, Permafrost Dynamics, and Climatic Conditions
Lake development and thermokarst activity began in earnest in Eastern Siberia between 15.0–10.0 cal kBP (Nazarova et al., 2013; Ulrich et al., 2019), with the postglacial period experiencing gradual rising temperatures and permafrost thaw (Schirrmeister et al., 2011; Biskaborn et al., 2019b). However, this period was also punctuated by periods of colder temperatures and low precipitation (Andreev et al., 2003; Nazarova et al., 2013). Andreev et al. (2003) recorded a transient climate amelioration during the Allerød in Eastern Siberia based on pollen spectra collected from a sediment core from Lake Ulakhan Chabyda (9.75 m depth). They suggest that mean July temperatures in this area were 1.5–2°C below present values and January temperatures were −2– −5°C colder (mean annual temperatures −3– −4°C colder than present). However, subsequent low precipitation levels (150 mm/year lower than modern conditions) and colder temperatures (Andreev et al., 2003) likely slowed the development of many nascent thermokarst lakes that were created during this relatively brief warm period before the onset of the Younger Dryas. Paleoclimatic estimates suggest that mean summer temperature decreased by 3°C and January mean temperature decreased by 6–7°C during the Younger Dryas (Andreev et al., 2003). It is possible that these environmental conditions lead to the signal, recorded in Unit 1 (14.1 cal kBP–12.3 cal kBP), of higher inputs of terrestrial plants from the surrounding catchment rather than deposition of OM produced in the lake. We also see lower values of Br, associated with organic matter production, and Si/Ti, usually related to biogenic silica production, in Unit 1 compared to the other two units. Dry, cold conditions, associated with permafrost stability in the catchment (i.e., no or rare thermokarst activity) and persistent ice cover, were likely favorable to increased detrital input from the catchment to the lake relative to organic matter, as recorded by the XRF signals.
Environmental conditions during the time of deposition of Unit 2 (12.3 cal kBP–9.0 cal kBP) encompassed the Younger Dryas cool period. Conditions during the height of the Younger Dryas were likely colder and dryer than today and then experienced a slow, but persistent warming associated with the end of the Younger Dryas and the transition to the Early Holocene warm period (Andreev et al., 2003; Katamura et al., 2006; Biskaborn et al., 2012; Ulrich et al., 2019). Müller et al. (2009) records the peak of the episodic cooling and drying related to the Younger Dryas between 12.4–11.3 cal kBP based on pollen records from a sediment core taken from Lake Billyakh (approximately 400 km north-west of Lake Malaya Chabyda). However, the conditions were likely still warmer and wetter than the period before the Allerød climate amelioration (15–13.5 cal kBP) (Müller et al., 2009). It is difficult to see evidence of the Younger Dryas in the proxy data analyzed for the Malaya Chabyda sediment core. The transition to the Holocene climate optimum began around 11.3 cal kBP in Eastern Siberia as recorded in the pollen record, peaking between 6.7–5 cal kBP (Müller et al., 2009; Nazarova et al., 2013; Biskaborn et al., 2016). This transition, likely associated with enhanced thermokarst activity, is reflected in the increased deposition of OM produced within the lake, as well as a reduction in detrital input from the surrounding catchment (e.g., Bouchard et al., 2017, and references therein). Proxies (e.g., Mn/Fe) also indicate potentially stronger depletion in bottom-water oxygen caused by enhanced water column stratification during this time (Bouchard et al., 2011). Velichko et al. (1997) reconstructed January and July temperatures that were still 1°C and 0.5°C lower than present values combined with 25 mm/yr lower annual precipitation.
Lake development processes, including thermokarst, generally increase across the region at the time of the Early Holocene warm period, which corresponds to the lower boundary of Unit 3 (9.0 cal kBP–CE 2013) (Müller et al., 2009; Nazarova et al., 2013). Nazarova et al. (2013) hypothesize that temperatures between 8–4.8 cal kBP were likely warmer than present day and record an increase in the sedimentation rate in Lake Temje consistent with increased biological production. July temperatures are recorded to be 1.5°C warmer than today, with the warmest temperatures occurring between 6.7–5 cal kBP. Our results show an increase in sedimentation rates at approximately 10.0 cal kBP, based on the age depth model, and higher TOC values after 9.5 cal kBP, resulting in notably higher OC accumulation rates during the first half of the Holocene. The upper half of Unit 2 seems to be distinctly lacustrine and the development of the lake basin was likely facilitated by rising precipitation levels and associated permafrost thaw (Nazarova et al., 2013; Schirrmeister et al., 2013; Ulrich et al., 2019).
Temperatures dropped below modern values in Central Yakutia after approximately 4.5 cal kBP with the low peak estimated to have occurred between 3.0 and 2.0 cal kBP (Biskaborn et al., 2012; Nazarova et al., 2013). This cooler episode (“Neoglacial”) has also been reported elsewhere across the circumpolar North, for example, in the Canadian Arctic (Fortier et al., 2006; Bouchard et al., 2020). After this cool period, there is a general warming trend, interspersed with short-term temperature fluctuations to present-day values (Biskaborn et al., 2021a). It is possible that the enriched δ13C observed in the upper half of Unit 3 are in response to warmer temperatures and favorable growing conditions.
Conclusion
• Here we present an in-depth and high-resolution analysis of a nearly 7-m-long sediment core which spans the Pleistocene-Holocene transition and encompasses a continuous Holocene time series. There was considerable variation in biogeochemical proxies both between and within three stratigraphic units.
• A shift occurred between 12.5 cal kBP to 11.0 cal kBP from predominately terrestrial land plant contribution to lacustrine algae contribution, which is recorded in OM deposition.
• Unit 2 and Unit 3 have high TOC values, high TOC/TNatomic ratios, and low δ13C, generally indicating OM which have not undergone significant decomposition under anaerobic conditions.
• There is high carbon content, including TOC (wt%) for this sediment core compared to other similar sites in Central Yakutia, and elsewhere across the Arctic. OCARs are above the highest reported values for temperate and high-latitude regions, for both past (Holocene and Late Pleistocene) and modern conditions. Lake Malaya Chabyda might have thus acted as a significant OC sink since the Pleistocene-Holocene transition.
• Increases in lake depth and nutrient availability from the catchment increased bioproductivity within the lake and organic matter preservation and storage relative to decomposition. Compact lake morphology (relatively small surface-to-depth ratio), associated with higher sedimentation rates and less exposure to warmer and oxygen-rich shallow waters, likely contributed to notably high OC preservation.
Data Availability Statement
The datasets presented in this study can be found in online repositories. The names of the repository/repositories and accession number(s) can be found below: Pangaea doi.pangaea.de/10.1594/PANGAEA.933411.
Author Contributions
FB and BB developed the project idea. BB, LP, BD, and DS collected the sediment core. LP and DS provided logistical support for field work and shipment of the sediment core. LH-A conducted laboratory analyses along with HM and CH. LH-A wrote the manuscript with contributions from FB, BB and CH, HM and DS.
Conflict of Interest
The authors declare that the research was conducted in the absence of any commercial or financial relationships that could be construed as a potential conflict of interest.
Publisher’s Note
All claims expressed in this article are solely those of the authors and do not necessarily represent those of their affiliated organizations, or those of the publisher, the editors and the reviewers. Any product that may be evaluated in this article, or claim that may be made by its manufacturer, is not guaranteed or endorsed by the publisher.
Acknowledgments
The authors would like to thank the Melnikov Permafrost Institute (Yakutsk) for their collaboration and fieldwork assistance. We are also grateful to A. Rudolf (AWI) for his calculation of lake catchment area. D. Scheidemann (AWI) and J. Lindemann (AWI) provided laboratory support and analyses. Many thanks to G. Fougeron for his invaluable and patient help with statistical analysis and python programming. DS was supported by Ministry of Education of the Russian Federation (project No. FSZN-2020-16). LH-A and FB are supported by the Agence nationale de la recherche (ANR) through the Make Our Planet Great Again initiative (Programme d’investissements d’avenir – project no. ANR-17-MPGA-0014).
Supplementary Material
The Supplementary Material for this article can be found online at: https://www.frontiersin.org/articles/10.3389/feart.2021.710257/full#supplementary-material
References
Anderson, N. J., D'Andrea, W., and Fritz, S. C. (2009). Holocene Carbon Burial by Lakes in SW Greenland. Glob. Chang. Biol. 15, 2590–2598. doi:10.1111/j.1365-2486.2009.01942.x
Andreev, A. A., and Klimanov, V. A. (2000). Quantitative Holocene Climatic Reconstruction from Arctic Russia. J. Paleolimnol. 24, 81–91. doi:10.1023/A:1008121917521
Andreev, A. A., Tarasov, P. E., Siegert, C., Ebel, T., Klimanov, V. A., Melles, M., et al. (2003). Late Pleistocene and Holocene Vegetation and Climate on the Northern Taymyr Peninsula, Arctic Russia. Boreas 32, 484–505. doi:10.1080/03009480310003388
Avnimelech, Y., Ritvo, G., Meijer, L. E., and Kochba, M. (2001). Water Content, Organic Carbon and Dry Bulk Density in Flooded Sediments. Aquacultural Eng. 25, 25–33. doi:10.1016/S0144-8609(01)00068-1
Bakke, J., Lie, Ø., Heegaard, E., Dokken, T., Haug, G. H., Birks, H. H., et al. (2009). Rapid Oceanic and Atmospheric Changes during the Younger Dryas Cold Period. Nat. Geosci 2, 202–205. doi:10.1038/ngeo439
Bakulina, N. T., Spektor, V. B., Novikov, N. I., Kurchatova, A. N., and Spektor, V. V. (2000). “Section of Benthic Deposits in the Malaya Tchabyda Lake,” in Proceeding of the International Conference ‘“Lakes of Cold Regions”’, Part IV, Paleoclimatology, Paleolimnology and Paleoecology Yakutsk, Russia.
Balascio, N. L., Zhang, Z., Bradley, R. S., Perren, B., Dahl, S. O., and Bakke, J. (2011). A Multi-Proxy Approach to Assessing Isolation basin Stratigraphy from the Lofoten Islands, Norway. Quat. Res. 75, 288–300. doi:10.1016/j.yqres.2010.08.012
Biskaborn, B. K., Herzschuh, U., Bolshiyanov, D., Savelieva, L., and Diekmann, B. (2012). Environmental Variability in Northeastern Siberia during the Last ∼ 13,300 Yr Inferred from lake Diatoms and Sediment-Geochemical Parameters. Palaeogeogr. Palaeoclimatol. Palaeoecol. 329-330, 22–36. doi:10.1016/j.palaeo.2012.02.003
Biskaborn, B. K., Herzschuh, U., Bolshiyanov, D. Y., Schwamborn, G., and Diekmann, B. (2013). Thermokarst Processes and Depositional Events in a Tundra Lake, Northeastern Siberia. Permafrost Periglac. Process. 24, 160–174. doi:10.1002/ppp.1769
Biskaborn, B. K., Narancic, B., Stoof-Leichsenring, K. R., Pestryakova, L. A., Appleby, P. G., Piliposian, G. T., et al. (2021a). Effects of Climate Change and Industrialization on Lake Bolshoe Toko, Eastern Siberia. J. Paleolimnol. 65, 335–352. doi:10.1007/s10933-021-00175-z
Biskaborn, B. K., Nazarova, L., Kröger, T., Pestryakova, L. A., Syrykh, L., Pfalz, G., et al. (2021b). Late Quaternary Climate Reconstruction and Lead-Lag Relationships of Biotic and Sediment-Geochemical Indicators at Lake Bolshoe Toko, Siberia. Front. Earth Sci. 9, 703. Available at: https://www.frontiersin.org/article/10.3389/feart.2021.737353. doi:10.3389/feart.2021.737353
Biskaborn, B. K., Nazarova, L., Pestryakova, L. A., Syrykh, L., Funck, K., Meyer, H., et al. (2019a). Spatial Distribution of Environmental Indicators in Surface Sediments of Lake Bolshoe Toko, Yakutia, Russia. Biogeosciences 16, 4023–4049. doi:10.5194/bg-16-4023-2019
Biskaborn, B. K., Smith, S. L., Noetzli, J., Matthes, H., Vieira, G., Streletskiy, D. A., et al. (2019b). Permafrost Is Warming at a Global Scale. Nat. Commun. 10, 1–11. doi:10.1038/s41467-018-08240-4
Biskaborn, B. K., Subetto, D. A., Savelieva, L. A., Vakhrameeva, P. S., Hansche, A., Herzschuh, U., et al. (2016). Late Quaternary Vegetation and lake System Dynamics in north-eastern Siberia: Implications for Seasonal Climate Variability. Quat. Sci. Rev. 147, 406–421. doi:10.1016/j.quascirev.2015.08.014
Blaauw, M., and Christen, J. A. (2011). Flexible Paleoclimate Age-Depth Models Using an Autoregressive Gamma Process. Bayesian Anal. 6, 457–474. doi:10.1214/ba/1339616472
Blott, S. J., and Pye, K. (2001). GRADISTAT: A Grain Size Distribution and Statistics Package for the Analysis of Unconsolidated Sediments. Earth Surf. Process. Landforms 26, 1237–1248. doi:10.1002/esp.261
Bouchard, F., Fortier, D., Paquette, M., Boucher, V., Pienitz, R., and Laurion, I. (2020). Thermokarst lake Inception and Development in Syngenetic Ice-Wedge Polygon Terrain during a Cooling Climatic Trend, Bylot Island (Nunavut), Eastern Canadian Arctic. The Cryosphere 14, 2607–2627. doi:10.5194/tc-14-2607-2020
Bouchard, F., Francus, P., Pienitz, R., and Laurion, I. (2011). Sedimentology and Geochemistry of Thermokarst Ponds in Discontinuous Permafrost, Subarctic Quebec, Canada. J. Geophys. Res. 116–130. doi:10.1029/2011JG001675
Bouchard, F., Laurion, I., Preskienis, V., Fortier, D., Xu, X., and Whiticar, M. J. (2015). Modern to Millennium-Old Greenhouse Gases Emitted from Ponds and Lakes of the Eastern Canadian Arctic (Bylot Island, Nunavut). Biogeosciences 12, 7279–7298. doi:10.5194/bg-12-7279-2015
Bouchard, F., Macdonald, L. A., Turner, K. W., Thienpont, J. R., Medeiros, A. S., Biskaborn, B. K., et al. (2017). Paleolimnology of Thermokarst Lakes: a Window into Permafrost Landscape Evolution. Arctic Sci. 3, 91–117. doi:10.1139/as-2016-0022
Brouchkov, A., Fukuda, M., Fedorov, A., Konstantinov, P., and Iwahana, G. (2004). Thermokarst as a Short-Term Permafrost Disturbance, Central Yakutia. Permafrost Periglac. Process. 15, 81–87. doi:10.1002/ppp.473
Brown, J., Ferrians, O. J., Heginbottom, J. A., and Melnikov, E. S. (1997). Circum-Arctic Map of Permafrost and Ground-Ice Conditions Circum-Pacific Map Series CP-45, scale 1:10,000,000, 1 sheet. US Geological Survey in Cooperation with the Circum-Pacific Council for Energy and Mineral Resources. doi:10.3133/cp45
Corella, J. P., Brauer, A., Mangili, C., Rull, V., Vegas‐Vilarrúbia, T., Morellón, M., et al. (2012). The 1.5-ka Varved Record of Lake Montcortès (Southern Pyrenees, NE Spain). Quat. Res. 78, 323–332. doi:10.1016/j.yqres.2012.06.002
Davidson, E. A., and Janssens, I. A. (2006). Temperature Sensitivity of Soil Carbon Decomposition and Feedbacks to Climate Change. Nature 440, 165–173. doi:10.1038/nature04514
Davies, S. J., Lamb, H. F., and Roberts, S. J. (2015). “Micro-XRF Core Scanning in Palaeolimnology: Recent Developments,” in BT - Micro-XRF Studies of Sediment Cores: Applications of a Non-destructive Tool for the Environmental Sciences. Editors I. W. Croudace, and R. G. Rothwell (Dordrecht: Springer Netherlands).
Fedorov, A. N., Ivanova, R. N., Park, H., Hiyama, T., and Iijima, Y. (2014). Recent Air Temperature Changes in the Permafrost Landscapes of Northeastern Eurasia. Polar Sci. 8, 114–128. doi:10.1016/j.polar.2014.02.001
Ferland, M.-E., Prairie, Y. T., Teodoru, C., and del Giorgio, P. A. (2014). Linking Organic Carbon Sedimentation, Burial Efficiency, and Long-Term Accumulation in Boreal Lakes. J. Geophys. Res. Biogeosci. 119, 836–847. doi:10.1002/2013JG002345
Ferland, M. E., Giorgio, P. A., Teodoru, C. R., and Prairie, Y. T. (2012). Long‐term C Accumulation and Total C Stocks in Boreal Lakes in Northern Québec. Glob. Biogeochem. Cycles 26, GB0E04. doi:10.1029/2011GB004241
Folk, R. L., and Ward, W. C. (1957). Brazos River Bar [Texas]; a Study in the Significance of Grain Size Parameters. J. Sediment. Res. 27, 3–26. doi:10.1306/74D70646-2B21-11D7-8648000102C1865D
Fortier, D., Allard, M., and Pivot, F. (2006). A Late-Holocene Record of Loess Deposition in Ice-Wedge Polygons Reflecting Wind Activity and Ground Moisture Conditions, Bylot Island, Eastern Canadian Arctic. The Holocene 16, 635–646. doi:10.1191/0959683606hl960rp
Galanin, A. A., Pavlova, M. R., and Klimova, I. V. (2018). Late Quaternary Dune Formations (D'olkuminskaya Series) in Central Yakutia (Part 1). Kz XXII, 3–14. doi:10.21782/KZ1560-7496-2018-63-15
Gorokhov, A. N., and Fedorov, A. N. (2018). Current Trends in Climate Change in Yakutia. Geogr. Nat. Resour. 39, 153–161. doi:10.1134/S1875372818020087
Grosse, G., Goetz, S., Mcguire, A. D., Romanovsky, V. E., and Schuur, E. A. G. (2016). Changing Permafrost in a Warming World and Feedbacks to the Earth System. Environ. Res. Lett. 11, 040201. doi:10.1088/1748-9326/11/4/040201
Grosse, G., Jones, B., and Arp, C. (2013). Thermokarst Lakes, Drainage, and Drained Basins,” in. Treatise on Geomorphology, 326–349. doi:10.1016/B978-0-12-374739-6.00216-5
Haberzettl, T., Corbella, H., Fey, M., Janssen, S., Lücke, A., Mayr, C., et al. (2007). Lateglacial and Holocene Wet-Dry Cycles in Southern Patagonia: Chronology, Sedimentology and Geochemistry of a Lacustrine Record from Laguna Potrok Aike, Argentina. The Holocene 17, 297–310. doi:10.1177/0959683607076437
Heinecke, L., Mischke, S., Adler, K., Barth, A., Biskaborn, B. K., Plessen, B., et al. (2017). Climatic and Limnological Changes at Lake Karakul (Tajikistan) during the Last ∼29 Cal Ka. J. Paleolimnol. 58, 317–334. doi:10.1007/s10933-017-9980-0
Herzschuh, U., Pestryakova, L. A., Savelieva, L. A., Heinecke, L., Böhmer, T., Biskaborn, B. K., et al. (2013). Siberian Larch Forests and the Ion Content of Thaw Lakes Form a Geochemically Functional Entity. Nat. Commun. 4, 2408. doi:10.1038/ncomms3408
Hugelius, G., Strauss, J., Zubrzycki, S., Harden, J. W., Schuur, E. A. G., Ping, C.-L., et al. (2014). Estimated Stocks of Circumpolar Permafrost Carbon with Quantified Uncertainty Ranges and Identified Data Gaps. Biogeosciences 11, 6573–6593. doi:10.5194/bg-11-6573-2014
Hughes-Allen, L., Bouchard, F., Laurion, I., Séjourné, A., Marlin, C., Hatté, C., et al. (2021). Seasonal Patterns in Greenhouse Gas Emissions from Different Types of Thermokarst Lakes in Central Yakutia (Eastern Siberia). Limnol. Oceanogr. 66, S98–S116. doi:10.1002/lno.11665
Ivanov, M. S. (1984). Cryogenic Structure of Quaternary Sediments in the Lena-Aldan Depression. Novosibirsk: Nauka. (in Russian).
Jongejans, L. L., Liebner, S., Knoblauch, C., Mangelsdorf, K., Ulrich, M., Grosse, G., et al. (2021). Greenhouse Gas Production and Lipid Biomarker Distribution in Yedoma and Alas Thermokarst lake Sediments in Eastern Siberia. Glob. Change Biol. 27, 2822–2839. doi:10.1111/gcb.15566
Kachurin, S. P. (1961). Thermokarst on the Territory of USSR. Moscow, Russia: Publ. House USSR Acad. Sci.
Kalugin, I., Darin, A., Rogozin, D., and Tretyakov, G. (2013). Seasonal and Centennial Cycles of Carbonate Mineralisation during the Past 2500 Years from Varved Sediment in Lake Shira, South Siberia. Quat. Int. 290-291, 245–252. doi:10.1016/j.quaint.2012.09.016
Kalugin, I., Daryin, A., Smolyaninova, L., Andreev, A., Diekmann, B., and Khlystov, O. (2007). 800-yr-long Records of Annual Air Temperature and Precipitation over Southern Siberia Inferred from Teletskoye Lake Sediments. Quat. Res. 67, 400–410. doi:10.1016/j.yqres.2007.01.007
Katamura, F., Fukuda, M., Bosikov, N. P., Desyatkin, R. V., Nakamura, T., and Moriizumi, J. (2006). Thermokarst Formation and Vegetation Dynamics Inferred from a Palynological Study in Central Yakutia, Eastern Siberia, Russia. Arctic, Antarctic, Alpine Res. 38, 561–570. doi:10.1657/1523-0430(2006)38[561:tfavdi]2.0.co;2
Kumke, T., Ksenofontova, M., Pestryakova, L., Nazarova, L., and Hubberten, H.-W. (2007). Limnological Characteristics of Lakes in the Lowlands of Central Yakutia, Russia. J. Limnol. 66, 40–53. doi:10.4081/jlimnol.2007.40
Mann, P. J., Eglinton, T. I., McIntyre, C. P., Zimov, N., Davydova, A., Vonk, J. E., et al. (2015). Utilization of Ancient Permafrost Carbon in Headwaters of Arctic Fluvial Networks. Nat. Commun. 6, 7856. doi:10.1038/ncomms8856
Marshall, M. H., Lamb, H. F., Huws, D., Davies, S. J., Bates, R., Bloemendal, J., et al. (2011). Late Pleistocene and Holocene Drought Events at Lake Tana, the Source of the Blue Nile. Glob. Planet. Change 78, 147–161. doi:10.1016/j.gloplacha.2011.06.004
Martin, P., Granina, L., Martens, K., and Goddeeris, B. (1998). Oxygen Concentration Profiles in Sediments of Two 1120 Ancientlakes: Lake Baikal (Siberia, Russia) and Lake Malawi (East Africa). Hydrobiologia 367, 163–174. doi:10.1023/A:1003280101128
Martín-Puertas, C., Valero-Garcés, B. L., Mata, M. P., Moreno, A., Giralt, S., Martínez-Ruiz, F., et al. (2011). Geochemical Processes in a Mediterranean Lake: a High-Resolution Study of the Last 4,000 Years in Zoñar Lake, Southern Spain. J. Paleolimnol. 46, 405–421. doi:10.1007/s10933-009-9373-0
Melles, M., Brigham-Grette, J., Minyuk, P. S., Nowaczyk, N. R., Wennrich, V., DeConto, R. M., et al. (2012). 2.8 Million Years of Arctic Climate Change from Lake El'gygytgyn, NE Russia. Science 337, 315–320. doi:10.1126/science.1222135
Mendonça, R., Müller, R. A., Clow, D., Verpoorter, C., Raymond, P., Tranvik, L. J., et al. (2017). Organic Carbon Burial in Global Lakes and Reservoirs. Nat. Commun. 8, 1694. doi:10.1038/s41467-017-01789-6
Meyer, H., Opel, T., Laepple, T., Dereviagin, A. Y., Hoffmann, K., and Werner, M. (2015). Long-term winter Warming Trend in the Siberian Arctic during the Mid- to Late Holocene. Nat. Geosci 8, 122–125. doi:10.1038/ngeo2349
Meyers, P. A. (2003). Applications of Organic Geochemistry to Paleolimnological Reconstructions: A Summary of Examples from the Laurentian Great Lakes. Org. Geochem. 34, 261–289. doi:10.1016/S0146-6380(02)00168-7
Meyers, P. A., and Arbor, A. (2001). Sediment Organic Matter. Track. Environ. Chang. Using Lake Sediments. Vol. 2 Phys. Geochemical Methods 2, 239–269.
Meyers, P. A. (1994). Preservation of Elemental and Isotopic Source Identification of Sedimentary Organic Matter. Chem. Geology. 114, 289–302. doi:10.1016/0009-2541(94)90059-0
Meyers, P. A., and Teranes, J. L. (2002). “Sediment Organic Matter,” in Tracking Environmental Change Using Lake Sediments. Developments in Paleoenvironmental Research. Editors W. M. Last, and J. P. Smol 2 (Dordrecht: Springer), 239–269. doi:10.1007/0-306-47670-3_9
Müller, S., Tarasov, P. E., Andreev, A. A., and Diekmann, B. (2009). Late Glacial to Holocene Environments in the Present-Day Coldest Region of the Northern Hemisphere Inferred from a Pollen Record of Lake Billyakh, Verkhoyansk Mts, NE Siberia. Clim. Past 5, 74–94. doi:10.5194/cpd-4-1237-2008
Nazarova, L., Lüpfert, H., Subetto, D., Pestryakova, L., and Diekmann, B. (2013). Holocene Climate Conditions in central Yakutia (Eastern Siberia) Inferred from Sediment Composition and Fossil Chironomids of Lake Temje. Quat. Int. 290-291, 264–274. doi:10.1016/j.quaint.2012.11.006
Pajunen, H. (2000). Lake Sediments: Their Carbon Store and Related Accumulations Rates. Spec. Pap. Geol. Surv. Finl. 29, 39–69.
Pestryakova, L. A., Herzschuh, U., Wetterich, S., and Ulrich, M. (2012). Present-day Variability and Holocene Dynamics of Permafrost-Affected Lakes in central Yakutia (Eastern Siberia) Inferred from Diatom Records. Quat. Sci. Rev. 51, 56–70. doi:10.1016/j.quascirev.2012.06.020
Pörtner, H.-O., Roberts, D. C., Masson-Delmotte, V., Zhai, P., Tignor, M., Poloczanska, E., et al. (2019). IPCC Special Report on the Ocean and Cryosphere in a Changing Climate.
Prėskienis, V., Laurion, I., Bouchard, F., Douglas, P. M. J., Billett, M. F., Fortier, D., et al. (2021). Seasonal Patterns in Greenhouse Gas Emissions from Lakes and Ponds in a High Arctic Polygonal Landscape. Limnol. Oceanogr. 66, S117–S141. doi:10.1002/lno.11660
Pribyl, D. W. (2010). A Critical Review of the Conventional SOC to SOM Conversion Factor. Geoderma 156, 75–83. doi:10.1016/j.geoderma.2010.02.003
Reimer, P. J., Austin, W. E. N., Bard, E., Bayliss, A., Blackwell, P. G., Bronk Ramsey, C., et al. (2020). The IntCal20 Northern Hemisphere Radiocarbon Age Calibration Curve (0-55 Cal kBP). Radiocarbon 62, 725–757. doi:10.1017/RDC.2020.41
Schirrmeister, L., Froese, D., Tumskoy, V., Grosse, G., and Wetterich, S. (2013). Permafrost and Periglacial Features | Yedoma: Late Pleistocene Ice-Rich Syngenetic Permafrost of Beringia. Encycl. Quat. Sci. 3, 542–552. doi:10.1016/b978-0-444-53643-3.00106-0
Schirrmeister, L., Grosse, G., Wetterich, S., Overduin, P. P., Strauss, J., Schuur, E. A. G., et al. (2011). Fossil Organic Matter Characteristics in Permafrost Deposits of the Northeast Siberian Arctic. J. Geophys. Res. 116–132. doi:10.1029/2011JG001647
Schuur, E. A. G., McGuire, A. D., Schädel, C., Grosse, G., Harden, J. W., Hayes, D. J., et al. (2015). Climate Change and the Permafrost Carbon Feedback. Nature 520, 171–179. doi:10.1038/nature14338
Séjourné, A., Costard, F., Fedorov, A., Gargani, J., Skorve, J., Massé, M., et al. (2015). Evolution of the banks of Thermokarst Lakes in Central Yakutia (Central Siberia) Due to Retrogressive Thaw Slump Activity Controlled by Insolation. Geomorphology 241, 31–40. doi:10.1016/j.geomorph.2015.03.033
Sobek, S., Anderson, N. J., Bernasconi, S. M., and Del Sontro, T. (2014). Low Organic Carbon Burial Efficiency in Arctic lake Sediments. J. Geophys. Res. Biogeosci. 119, 1231–1243. doi:10.1002/2014JG002612
Soloviev, P. A. (1959). The Cryolithozone of Northern Part of the Lena-Amga Interfluve. Moscow: USSR Acad. Sci. Publ.
Strauss, J., Schirrmeister, L., Grosse, G., Fortier, D., Hugelius, G., Knoblauch, C., et al. (2017). Deep Yedoma Permafrost: A Synthesis of Depositional Characteristics and Carbon Vulnerability. Earth-Science Rev. 172, 75–86. doi:10.1016/j.earscirev.2017.07.007
Strunk, A., Olsen, J., Sanei, H., Rudra, A., and Larsen, N. K. (2020). Improving the Reliability of Bulk Sediment Radiocarbon Dating. Quat. Sci. Rev. 242, 106442. doi:10.1016/j.quascirev.2020.106442
Subetto, D. A., Nazarova, L. B., Pestryakova, L. A., Syrykh, L. S., Andronikov, A. V., Biskaborn, B., et al. (2017). Paleolimnological Studies in Russian Northern Eurasia: A Review. Contemp. Probl. Ecol. 10, 327–335. doi:10.1134/S1995425517040102
Subetto, D. A., Wohlfarth, B., Davydova, N. N., Sapelko, T. V., Björkman, L., Solovieva, N., et al. (2002). Climate and Environment on the Karelian Isthmus, Northwestern Russia, 13000-9000 Cal. Yrs BP. Boreas 31, 1–19. doi:10.1111/j.1502-3885.2002.tb01051.x
Sumgin, M. I., Kachurin, S. P., and Tolstikhin, N. I. (1940). General Permafrost Studies. Moscow, Russia: Publ. House USSR Acad. Sci., 340.
Tarasov, P. E., Harrison, S. P., Saarse, L., Pushenko, M. Y., Andreev, A. A., Aleshinskaya, Z. V., et al. (1996). Lake Status Records from the FSU, Database Documentation Version 2. Boulder, USA: IGBP PAGES/World Data Center-A for Paleoclimatology Data. Contribution Series # 96-032.
Ulrich, M., Matthes, H., Schirrmeister, L., Schütze, J., Park, H., Iijima, Y., et al. (2017a). Differences in Behavior and Distribution of Permafrost‐related Lakes in C Entral Y Akutia and Their Response to Climatic Drivers. Water Resour. Res. 53, 1167–1188. doi:10.1002/2016WR019267.Received
Ulrich, M., Matthes, H., Schmidt, J., Fedorov, A. N., Schirrmeister, L., Siegert, C., et al. (2019). Holocene Thermokarst Dynamics in Central Yakutia - A Multi-Core and Robust Grain-Size Endmember Modeling Approach. Quat. Sci. Rev. 218, 10–33. doi:10.1016/j.quascirev.2019.06.010
Ulrich, M., Wetterich, S., Rudaya, N., Frolova, L., Schmidt, J., Siegert, C., et al. (2017b). Rapid Thermokarst Evolution during the Mid-holocene in Central Yakutia, Russia. The Holocene 27, 1899–1913. doi:10.1177/0959683617708454
Velichko, A. A., Andreev, A. A., and Klimanov, V. A. (1997). Climate and Vegetation Dynamics in the Tundra and forest Zone during the Late Glacial and Holocene. Quat. Int. 41-42, 71–96. doi:10.1016/S1040-6182(96)00039-0
Vonk, J. E., and Gustafsson, Ö. (2013). Permafrost-carbon Complexities. Nat. Geosci 6, 675–676. doi:10.1038/ngeo1937
Vonk, J. E., Mann, P. J., Davydov, S., Davydova, A., Spencer, R. G. M., Schade, J., et al. (2013). High Biolability of Ancient Permafrost Carbon upon Thaw. Geophys. Res. Lett. 40, 2689–2693. doi:10.1002/grl.50348
Vonk, J. E., Tank, S. E., Bowden, W. B., Laurion, I., Vincent, W. F., Alekseychik, P., et al. (2015). Reviews and Syntheses: Effects of Permafrost Thaw on Arctic Aquatic Ecosystems. Biogeosciences 12, 7129–7167. doi:10.5194/bg-12-7129-2015
Vyse, S. A., Herzschuh, U., Andreev, A. A., Pestryakova, L. A., Diekmann, B., Armitage, S. J., et al. (2020). Geochemical and Sedimentological Responses of Arctic Glacial Lake Ilirney, Chukotka (Far East Russia) to Palaeoenvironmental Change since ∼51.8 Ka BP. Quat. Sci. Rev. 247, 106607. doi:10.1016/j.quascirev.2020.106607
Vyse, S. A., Herzschuh, U., Pfalz, G., Pestryakova, L. A., Diekmann, B., Nowaczyk, N., et al. (2021). Sediment and Carbon Accumulation in a Glacial lake in Chukotka (Arctic Siberia) during the Late Pleistocene and Holocene: Combining Hydroacoustic Profiling and Down-Core Analyses. Biogeosciences Discuss. 16, 4791–4816. doi:10.5194/bg-2021-39
Walter Anthony, K., Daanen, R., Anthony, P., Schneider von Deimling, T., VonPing, C., Ping, C.-L., et al. (2016). Methane Emissions Proportional to Permafrost Carbon Thawed in Arctic Lakes since the 1950s. Nat. Geosci 9, 679–682. doi:10.1038/NGEO2795
Wang, R., Zhang, Y., Wünnemann, B., Biskaborn, B. K., Yin, H., Xia, F., et al. (2015). Linkages between Quaternary Climate Change and Sedimentary Processes in Hala Lake, Northern Tibetan Plateau, China. J. Asian Earth Sci. 107, 140–150. doi:10.1016/j.jseaes.2015.04.008
Weltje, G. J., and Tjallingii, R. (2008). Calibration of XRF Core Scanners for Quantitative Geochemical Logging of Sediment Cores: Theory and Application. Earth Planet. Sci. Lett. 274, 423–438. doi:10.1016/j.epsl.2008.07.054
Keywords: paleolimnology, lake sediment core, late Pleistocene, Holocene, Eastern Siberia, organic carbon accumulation, stable carbon isotope (13C)
Citation: Hughes-Allen L, Bouchard F, Hatté C, Meyer H, Pestryakova LA, Diekmann B, Subetto DA and Biskaborn BK (2021) 14,000-year Carbon Accumulation Dynamics in a Siberian Lake Reveal Catchment and Lake Productivity Changes. Front. Earth Sci. 9:710257. doi: 10.3389/feart.2021.710257
Received: 15 May 2021; Accepted: 29 October 2021;
Published: 25 November 2021.
Edited by:
Lutz Schirrmeister, Alfred Wegener Institute Helmholtz Centre for Polar and Marine Research (AWI), GermanyReviewed by:
Mathias Ulrich, Leipzig University, GermanyDarrell Kaufman, Northern Arizona University, United States
Copyright © 2021 Hughes-Allen, Bouchard, Hatté, Meyer, Pestryakova, Diekmann, Subetto and Biskaborn. This is an open-access article distributed under the terms of the Creative Commons Attribution License (CC BY). The use, distribution or reproduction in other forums is permitted, provided the original author(s) and the copyright owner(s) are credited and that the original publication in this journal is cited, in accordance with accepted academic practice. No use, distribution or reproduction is permitted which does not comply with these terms.
*Correspondence: Lara Hughes-Allen, bGFyYS5odWdoZXMtYWxsZW5AdW5pdmVyc2l0ZS1wYXJpcy1zYWNsYXkuZnI=; Boris K. Biskaborn, Qm9yaXMuYmlza2Fib3JuQGF3aS5kZQ==