 Muhammad Taufiq Rafie1
 Phil R. Cummins2,3
 David P. Sahara2*
 Sri Widiyantoro2,4
 Wahyu Triyoso2
 Andri Dian Nugraha2
- 1Graduate Program of Geophysical Engineering Program, Faculty of Mining and Petroleum Engineering, Institut Teknologi Bandung, Bandung, Indonesia
- 2Global Geophysics Research Group, Faculty of Mining and Petroleum Engineering, Institut Teknologi Bandung, Bandung, Indonesia
- 3Research School of Earth Sciences, Australian National University, Canberra, ACT, Australia
- 4Faculty of Engineering, Maranatha Christian University, Bandung, Indonesia
Coseismic changes in principal stress orientation in the northern Sumatra subduction zone due to two giant megathrust earthquakes there in 2004 and 2005 are estimated to investigate the in-situ stress. The two megathrust earthquakes, the 2004 Sumatra-Andaman and the 2005 Nias-Simeulue events, are both among the 11 largest earthquakes ever recorded. Previous studies have shown that these giant earthquakes perturbed the stress field in the Sumatra subduction zone enough to alter the principal stress directions there, and here we investigate whether these changes can be used to better understand spatial variations in stress along the subduction zone. We used 330 previously published focal mechanisms to estimate pre- and post-mainshock principal stress orientations in 3 outer forearc segments and assessed whether orientation differences were resolved and what they imply about the pre- and post-mainshock stress fields. Our results agree with previous studies in establishing that coseismic changes in stress orientation in the forearc are resolvable, and consistent with a low level of stress in the outer Sumatran forearc before the earthquake, with almost all the shear stress on the megathrust relieved in the 2004 and 2005 earthquakes. In this study, we reveal that both the stress orientations and coseismic changes in them exhibit along-strike variations, with a decrease in both the pre-mainshock stress and stress drop found in the rupture area of 2005 relative to that of the 2004 earthquake. The forearc segment between the 2004 and 2005 rupture areas, which coincides with a well-known megathrust rupture barrier beneath the island of Simeulue is observed to have a characteristic signature, with lower shear stress relative to the pre-mainshock stress field and higher shear stress relative to the post-mainshock stress field in the adjacent segments.
Introduction
The island of Sumatra, Indonesia, is adjacent to an active plate boundary, where oceanic lithosphere of the Indian and Australian Plates subducts beneath the continental lithosphere of the Sunda Plate (Figure 1). The Sumatra subduction zone experiences 40–60 mm/yr of oblique convergence, the accommodation of which is partitioned between mostly thrust slip along the Sumatra Trench megathrust, and dextral slip along the Great Sumatra Fault that parallels the island’s southwestern coast about 250 km landward of the Sumatra Trench axis (Hamilton, 1979; McCaffrey, 1992; McCaffrey et al., 2000; McCaffrey, 2009; Malod et al., 1995; Moeremans and Singh, 2015).

FIGURE 1. Map illustrating the distribution of seismic activity with Mw ≥ 5.0 and depth ≤50 km from the ISC-GEM earthquake catalog (Storchak et al., 2015) from 1907 to 2015. The epicenters of the large mainshocks are indicated by yellow stars and colored areas indicate the rupture areas of the 2004 Sumatra-Andaman (brown) and 2005 Nias-Simeulue (magenta) earthquakes. The white arrows indicate the movement of the Indian and Australian (upper left and lower right, respectively) Plates with respect to the Sunda plate, as estimated by the GSRMv2.1 plate motion model of Kreemer et al. (2014). Background bathymetry/topography is from GEBCO (Kapoor, 1981). IN: Indian Plate, AU: Australian Plate, SU: Sunda Plate.
In Figure 1 the relative motions of the Indian and Australian Plates with respect to the Sunda Plate are indicated for the GSRMv2.1 plate model (Kreemer et al., 2014). Because the oceanic lithosphere subducting off northern Sumatra is part of the wide, diffuse boundary between the Indian and Australian Plates that is actively deforming (Wiens et al., 1985; Gordon et al., 1990; Kreemer et al., 2014), GPS-derived plate models do not necessarily provide useful estimates of the obliquity of plate convergence. We believe that GSRMv2.1 is the most appropriate estimate of relative plate motion to use in our study of forearc stress, because it accounts for internal deformation of both the diffuse Indian-Australian plate boundary as well as that of the Sunda Plate that includes Sumatra. As can be seen in Figure 1, the obliquity of convergence of both the Indian and Australian with respect to the Sunda Plate exhibited by GSRMv2.1 is pronounced, at 45–52°. This is consistent with the 20–25 mm/yr dextral slip inferred on the Sumatra Fault by GPS and geologic studies (Ito et al., 2012 and Sieh et al., 1999, respectively).
The oblique plate convergence and the accompanying strain accumulation along the Sumatra forearc and the diffuse Indian-Australian plate boundary have resulted in the occurrence of major earthquakes off northern Sumatra during 2004–2012, including the 2004 Mw ∼9.3 Sumatra-Andaman (Stein and Okal, 2007) and 2005 Mw 8.6 Nias-Simeulue (Konca et al., 2007) megathrust earthquakes, as well as the 2012 Indian Ocean earthquake doublet (Mw 8.6 and Mw 8.2, Satriano et al., 2012). Three of these earthquakes are among the largest 11 earthquakes ever recorded (U.S.Geological Survey, 2017), and the stress transfer caused by such large earthquakes can change the stress field in the Earth’s lithosphere as they relieve and redistribute stress over a wide area (Pollitz et al., 2006b; Gunawan et al., 2014).
Stress changes caused by large earthquakes can also promote or inhibit seismic activity in the surrounding area (Freed, 2005), and indeed changes in seismic activity following the 2004 Sumatra-Andaman and 2005 Nias-Simeulue earthquakes have been linked to such changes in the stress field (Wiseman and Bürgmann, 2011; Sevilgen et al., 2012). Some studies of earthquake-induced stress changes have also described how they can influence the earthquake cycle of major faults (Michael, 1987; Lin et al., 2011; Hasegawa et al., 2012; Hardebeck and Okada, 2018). (McCloskey et al., 2005) showed that the stress changes due the 2004 Sumatra-Andaman earthquake likely brought forward the next rupture of the adjacent Nias section of the Sumatra megathrust, which subsequently did rupture in the 2005 earthquake, and of the northern part of the Great Sumatran Fault (GSF), which has yet to rupture in a major earthquake. The suggestion of most of these studies is that many subduction zone megathrusts are subject to relatively low background differential stress that can experience near-complete relaxation due to the stress drop associated with large megathrust earthquakes (Hardebeck, 2012).
Most studies reporting stress changes after large earthquakes infer them from rotations of principal stress axis orientations estimated before and after the earthquakes (Michael et al., 1990; Hardebeck and Hauksson, 2001; Hardebeck, 2012; Yoshida et al., 2015). The orientation of principal stress axes can be estimated by inverting a set of focal mechanisms or moment tensors (Michael, 1987) from a large number of earthquakes. Calculating the stress orientations before and after a significant earthquake can reveal how the earthquake perturbed the pre-seismic stress field.
In the present study, we first apply stress inversion to yield the orientation of principal in-situ deviatoric stress axes before and after the 2004 and 2005 megathrust earthquakes. We subdivide the megathrust segmentation of Hardebeck (2012) on the northern part of Sumatra Island according to the seismicity pattern to infer the stress perturbation along strike. We use the iterative joint inversion approach of Vavryčuk (2014) to estimate principal stress orientations and apply it to different segments of the Sumatra subduction zone’s outer forearc, to understand spatial variations in the pre- and post-mainshock stress fields. The bootstrap resampling technique is applied to assess the uncertainty of the solution, and results for coseismic changes in stress orientation are compared to previous studies of forearc stress and megathrust earthquake activity (Briggs et al., 2006; Meltzner et al., 2012).
Data and Methods
Seismicity Data
The change in seismic activity before and after the 2004–2005 Sumatra megathrust earthquakes is illustrated by the cumulative seismicity curve in Figure 2. We divided this activity into two parts: the pre-mainshock seismicity which has a constant rate (from 1907 to 2004), and the post-mainshock activity characterized by rapid increases in seismic activity following the 2004 earthquake. We remove the 2005 Nias and 2012 Indian Ocean earthquakes from our analysis of the post-mainshock activity, which includes the aftershock sequences associated with each earthquake. We regard the pre-mainshock seismicity as reflecting failure of faults in response to the stress field prevailing in the latter part of the megathrust earthquake cycle, while the post-mainshock seismicity reflects fault failure in response to stress in the early part of the cycle, following release of stress on the megathrust by a great earthquake.
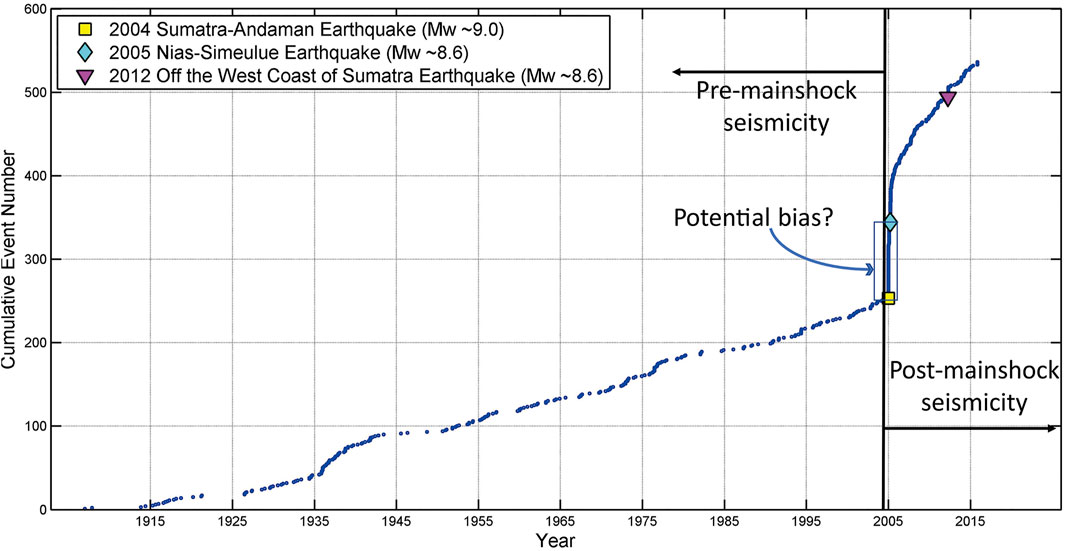
FIGURE 2. Cumulative seismicity during the years 1907–2015, for earthquakes near the Sumatran subduction zone, based on data from the ISC-GEM (Storchak et al., 2015) catalogue. Also indicated are the points on the curve where the 2004 Sumatra-Andaman, 2005 Nias-Simeulue and 2012 Off-west Sumatra earthquakes occurred. The minimum magnitude of the earthquake catalogue in Figure 2 is 5.0. Following Triyoso et al. (2020), the magnitude completeness (Mc) in Sumatra subduction is also 5.0. Therefore, we are sure that the catalogue completes at this level for the whole period of time. The potential bias in the figure refers to the aftershocks of the 2004 earthquake that could affect the stress field on the 2005 earthquake rupture zone (or in this case segment C).
The interpretation that the pre-2004 seismicity reflects a pre-mainshock stress field that has gradually accumulated over the interseismic period seems straightforward, since no earthquake large enough to perturb the regional stress field has occurred in northern Sumatra for at least 100 years prior to the 2004 Sumatra-Andaman event (no event with Mw ≥ 6 was ever recorded in northern Sumatra prior to 2004, see Storchak et al., 2015). The interpretation of the post-2004 seismicity as reflecting the stress field in the early part of the earthquake cycle is more open to question, since the release of stress during the 2004 Sumatra-Andaman and 2005 Nias-Simeulue earthquakes occurred in a manner that was heterogeneous in time and space. The 2005 Nias-Simuelue earthquake occurred only 3 months after the 2004 Sumatra-Andaman, so the aftershocks that occurred prior to the 2005 event may reflect a different stress field from that which prevails after the 2005 event, and a stress inversion that includes them may be biased (see Figure 2). However, we believe this influence is mitigated by these potentially biased aftershocks having occurred well north of the rupture area of the 2005 event, so any bias due to this “transitional” stress field between the times of the 2004 and 2005 events should be minor. A similar consideration applies to the 2012 Indian Ocean earthquakes.
An additional complication is the significant rotation of the stress orientations observed during the months following the 2004 event (Hardebeck, 2012). This was due to a combination of the nearly complete relaxation of stress following the 2004 event–if stress is close to zero even a small stress recovery can change the principal stress directions–and post-seismic motion (Pollitz et al., 2006a; Gunawan et al., 2014). Moreover, significant post-seismic relaxation continued at least until 2010 and is likely ongoing (Gunawan et al., 2014). While it seems certain that these effects influence our estimate of the post-mainshock stress field using aftershocks during 2005–2017, we believe this estimate is nevertheless a useful measure of the average stress at the beginning of the interseismic part of the earthquake cycle, since the 13 years over which our estimate is averaged is much smaller than the previous interseismic intervals - 550 (Rubin et al., 2017) and 143 (Newcomb and McCann, 1987) years for the 2004 and 2005 events, respectively.
In order to estimate principal stress orientations, we used focal mechanism solutions for earthquakes occurring from June 1976 to August 2017 (see Supplementary Table S1), with 5.0 ≤ Mw ≤ 7.0 and focal depth ≤50 km, compiled by the Global Centroid Moment Tensor (GCMT) Project (Dziewonski et al., 1981; Ekström et al., 2012) as well as NIED CMT solutions (Kubo et al., 2002) and solutions from the United States Geological Survey as published in the Bulletin of the International Seismological Centre (Lentas et al., 2019). These data were divided into two-time windows:
• Pre-mainshock seismicity around northern Sumatra from June 1976 to December 2004.
• Post-mainshock from December 2004 to August 2017, excluding events with Mw > 7.0, which were regarded as mainshocks.
The spatial distributions of focal mechanisms used for pre-mainshock and post-mainshock stress inversions are shown in Figure 3. Because in this study we attempt to resolve arc-normal variations in stress, we have segmented the data as indicated in Figure 3. The choice of segments used to group the data was guided by the clustering of aftershocks, and the rupture areas of the 2004 and 2005 mainshocks as described by finite fault rupture models (we considered Ammon et al., 2005; Banerjee et al., 2007; Konca et al., 2007; Tanioka et al., 2006). Spatial segmentation of the data is more consistent with the assumption in stress inversion that the stress field is uniform in the region over which focal mechanisms are inverted, but this comes at the expense of increased uncertainty due to the reduction in the number of events per segment. For this reason, we believe it is not practical to subdivide the data further in either time or space.
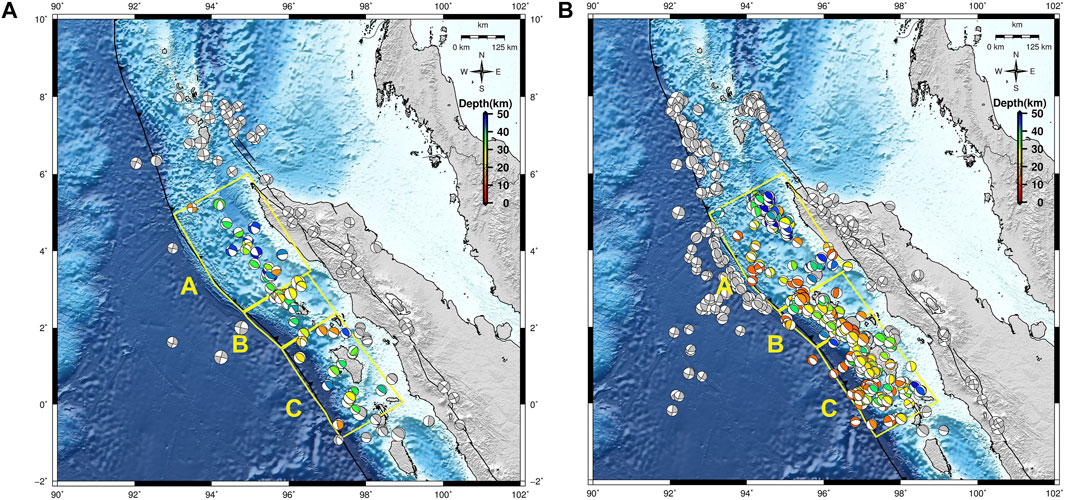
FIGURE 3. Focal mechanism distributions in northern Sumatra for the pre-mainshock (A) and post-mainshock seismicity (B). The yellow polygons show the segments used to group focal mechanisms for estimation of stress parameters in outer forarc. Background bathymetry/topography is from GEBCO (Kapoor, 1981).
Stress Inversion
The methods for estimating principal stress parameters from focal mechanism data assume that: 1) the tectonic stress is uniform in the region over which focal mechanisms are inverted, 2) earthquakes occur on pre-existing faults with varying orientations, 3) the fault slip vector points in the direction of shear stress on the fault (Wallace, 1951; Bott, 1959), and 4) the earthquakes do not interact with each other and do not disturb the background tectonic stress (Vavryčuk, 2014). As discussed above, by grouping focal mechanisms into segments along the subduction zone forearc, we have reduced the region over which focal mechanisms are inverted and should thereby better satisfy the condition of uniform stress. Additionally, by dividing the data into pre-mainshock and post-mainshock intervals, and removing the mainshocks themselves, we have greatly reduced the potential for earthquake interaction and excluded earthquakes that could significantly disturb the overall stress field.
A simple approach for stress inversion is the method proposed by (Michael, 1984) which employs the expressions for shear traction on a fault in the following form:
Where the sum over indices
Where
This equation can be solved using generalized linear inversion in the L2-norm as follows (Lay and Wallace 1995, their section 6.4):
The linear system of Eq. 3 is inverted for all earthquakes simultaneously, resulting in estimated values for the five independent components of
where
However, one basic disadvantage of applying this method is the lack of knowledge of which of the fault mechanism nodal planes is the actual fault plane. An incorrect nodal plane can degrade the accuracy of stress estimates (Vavryčuk, 2014). Therefore, (Vavryčuk, 2014), introduced a modified stress inversion method that iteratively inverts for both stress and fault orientation, with the latter determined using the fault instability criterion of (Lund and Slunga, 1999). (Vavryčuk, 2014) shows that this approach results in improved stress estimates, particularly for the shape ratio
Because the choice of fault plane made during the course of iterative inversion is based on the frictional instability criterion of (Lund and Slunga, 1999), the resulting stress orientation is dependent on a value for fault friction coefficient chosen a priori. In order to assess the sensitivity to and make an optimal choice for the fault friction coefficient, the inversion was run repeatedly with friction coefficient values ranging from 0.0 to 1.0, in steps of 0.05, and the optimal value was chosen as that which produced the highest overall fault instability (see Vavryčuk, 2014).
Finally, we calculate the uncertainty using the bootstrap method with 250 resampled datasets, as this approach is widely used to assess uncertainty in stress inversion (see e.g. Michael, 1984, and Hardebeck and Michael, 2006). The best value is the mean of data distribution, and we express uncertainty as half the width of the 95% quantiles of the distributions associated with the bootstrap resampling.
Results
In this study, we applied the iterative joint inversion scheme of (Vavryčuk, 2014) to invert for principal stress orientations and shape ratio, using 47 focal mechanisms for the pre-mainshock period and 282 focal mechanisms for the post-mainshock period. Stress inversions were performed for the 3 outer forearc segments A, B and C for the pre- and post-mainshock periods–segments A directly above the rupture area of 2004 Sumatra-Andaman earthquake, B at the gap between rupture area of 2004 and 2005 megathrust earthquakes, and C in the rupture area of the 2005 Nias-Simeulue earthquake (see Figure 3). The accuracy of stress inversion depends on the number of focal mechanisms inverted, the noise level in the data (Vavryčuk, 2014), and the distribution of different focal mechanisms.
The directions of maximum horizontal compressive stress (SHmax) for the pre- and post-mainshock intervals are plotted in Figures 4A,B, respectively, and the numerical results for principal stress directions and shape ratio for these are indicated in Table 1 and 2. For each stress tensor, we calculated the directions SHmax and their 95% confidence intervals following (Lund and Townend, 2007). Plots of the focal mechanism P-T axes, principal stress directions, and shape ratios are displayed in Figures 5A,B for pre-mainshock and post-mainshock time periods in the outer forearc segments, respectively. Histograms of bootstrap resampling distributions for
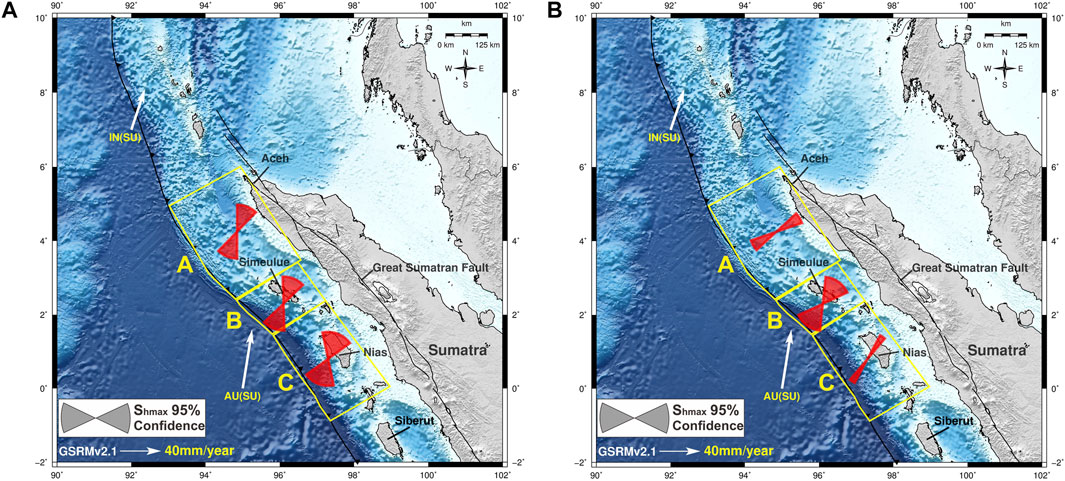
FIGURE 4. Direction of maximum horizontal compressive stress (SHmax) for the pre-mainshock (A) and post-mainshock (B) stress fields in each of the segments A-C. 95% confidence intervals in the SHmax directions are indicated by the width of each symbol. Red symbols denote pre- and post-mainshock SHmax directions.
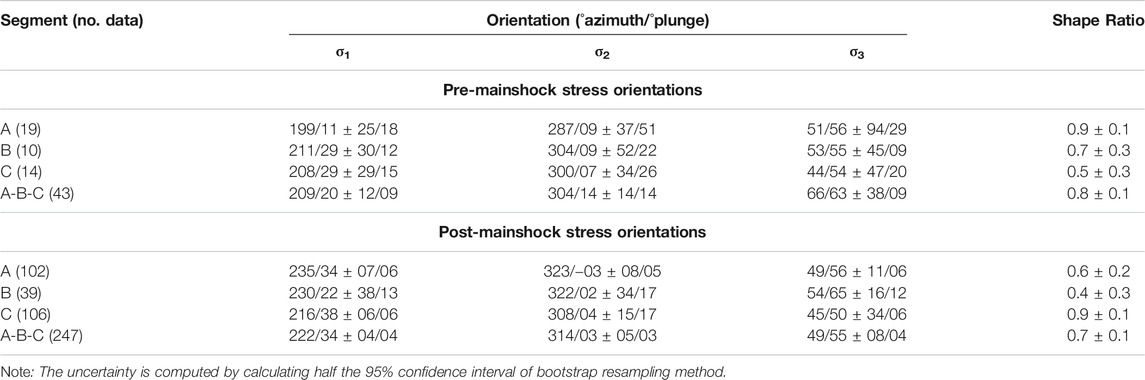
TABLE 1. Stress inversion results for the principle stress directions and shape ratios for pre-mainshock and post-mainshock intervals. The indicated uncertainties are estimated by taking half the width of the 95% quantile interval of the corresponding bootstrap-resampled distribution.
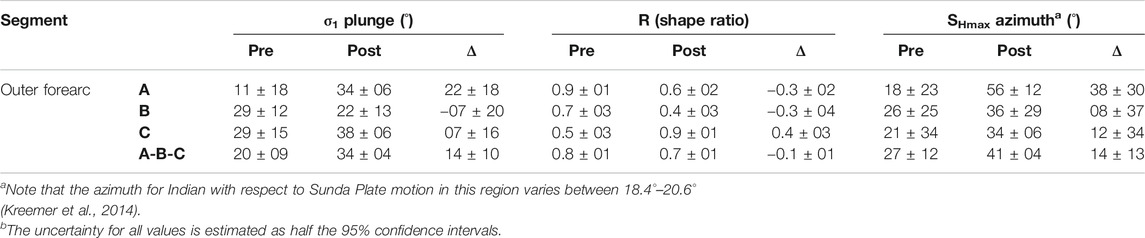
TABLE 2. Comparison of pre-mainshock and post-mainshock stress inversion results. Angles are in degrees and measured positive clockwise (SHmax calculated from the stress orientation parameters in Table 1 according to Lund and Townend, 2007).
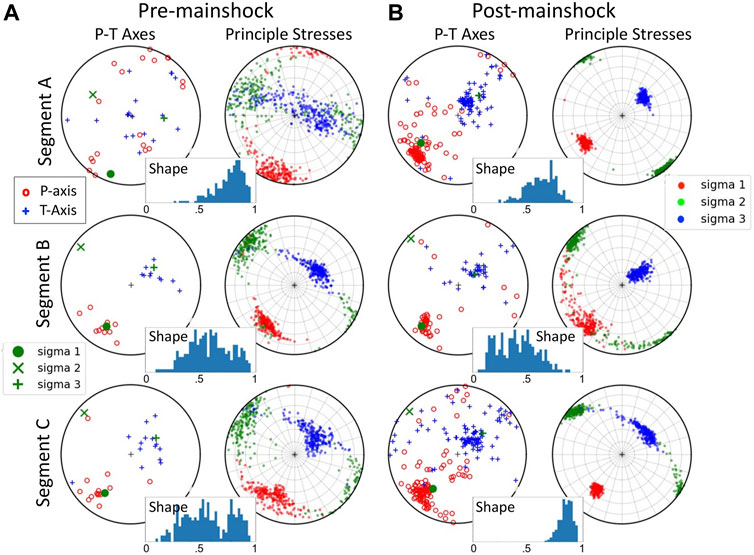
FIGURE 5. Stress Inversion results for outer forearc segments A, B and C. Displayed are results for the pre- and post-mainshock stress field (A) and (B), respectively, in terms of P-T axes for individual focal mechanisms, principal stress axes, and shape factors. The uncertainty of principal stresses and shape ratios is estimated as half the 95% confidence intervals of bootstrap resampling method.
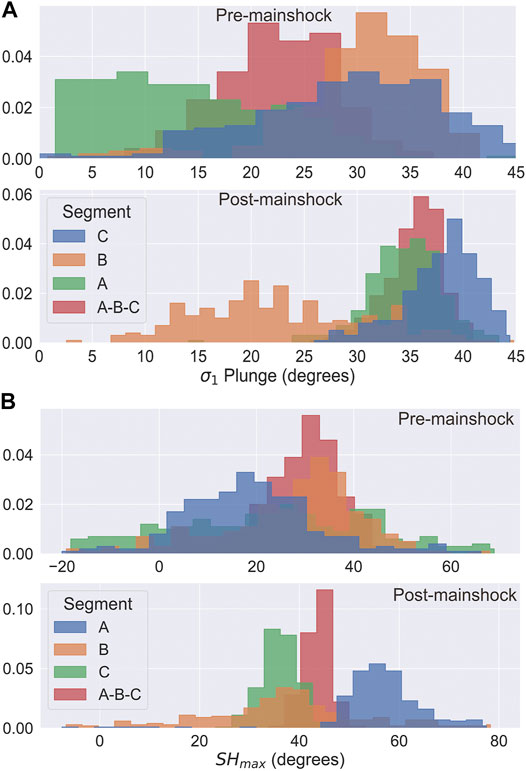
FIGURE 6. Histograms of (A) σ1 plunge and (B) SHmax for outer forearc segments A-B-C, A, B and C estimated in this study. Each histogram represents the variation in samples taken from bootstrap resampling method.
We considered testing for bias introduced into the post-mainshock stress solutions for segment C due to aftershocks of the 2004 earthquake (indicated as “Potential bias” in Figure 2), by removing such events from the Segment C stress solution. However, we found that the focal mechanism dataset for Segment C, after removal of megathrust events as described below, included no events during this time period between the 2004 and 2005 events (see Supplementary Figure S1). Segment B contains four events between the time of the 2004 and 2005 earthquakes, but their effect on the estimated stress orientations was negligible.
To ensure the quality of the stress inversion, the diversity of the fault orientation has to be assessed. As the events were located in the subduction zone, we checked whether the orientations of thrust events are similar to megathrust orientation or not. If the focal mechanism data are dominated by megathrust events, the results of stress inversion may reflect the megathrust geometry rather than the orientation of the forearc stress field (Vavryčuk, 2011 and, 2014; McKenzie, 1969). To avoid this potential source of bias, we identified and removed megathrust events from our dataset.
To identify megathrust events, we first estimated the strike and dip of the Sumatra megathrust for each segment. The strike direction of the megathrust for each segment is estimated based on the direction of the Sumatra trench axis and the megathrust dip of each segment is calculated based on the slab geometry of SLAB2.0 (Hayes, 2018), which is divided into 0–20 km and 20–50 km depth ranges. The strikes of the megathrust segments A, B, and C are 324°, 314°, and 328°, respectively. Dips estimated for each segment vary from 5° to 8° for the 0–20 km and about 20° for the 20–50 km depth ranges, respectively. We then compared the strikes and dips for the most shallowly-dipping nodal planes of the thrust events in our dataset, and rejected events with strike and dip within ±10° and ±5°, respectively, of the strike and dip of the megathrust for the respective segment. Figure 7 depicts the strike and dip values of the most shallow-dipping nodal planes for the thrust events, and shows which were identified and rejected as megathrust events. Vertical cross sections representing the different geometries of the slab including rejected and accepted fault plane solutions in our stress inversion as well as the obtained stress axes are shown Figure 8.
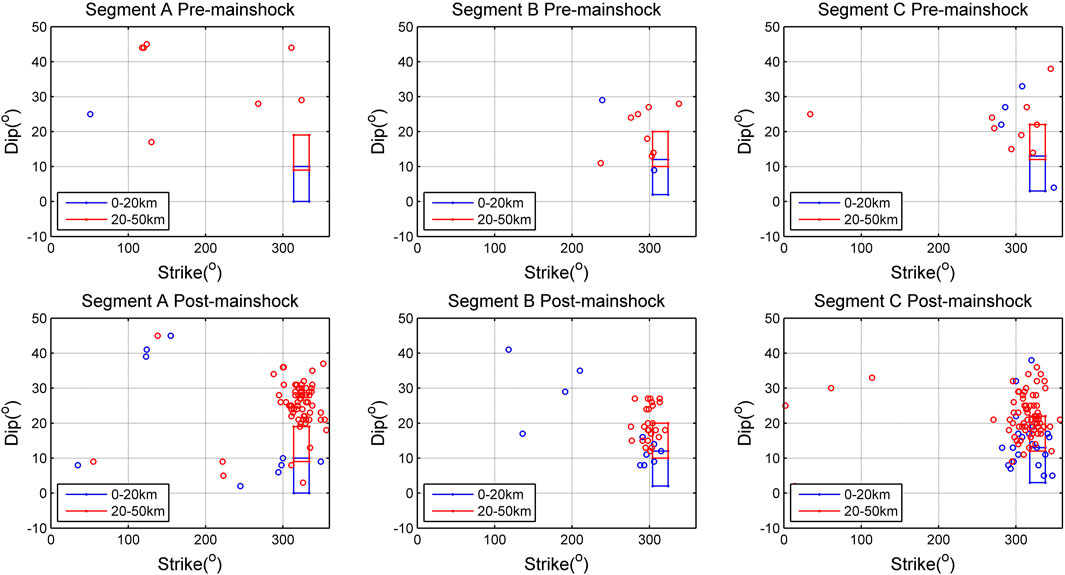
FIGURE 7. Distribution of strike and dip of the most shallow-dipping nodal plane of each thrust mechanism for pre- and post-mainshock. The shallow-dipping nodal planes of thrust event are divided into 0–20 km (blue circles) and 20–50 km (red circles) depth interval. The blue and red boxes represent the zone of megathrust geometry orientation for 0–20 km and 20–50 km depth interval, respectively.
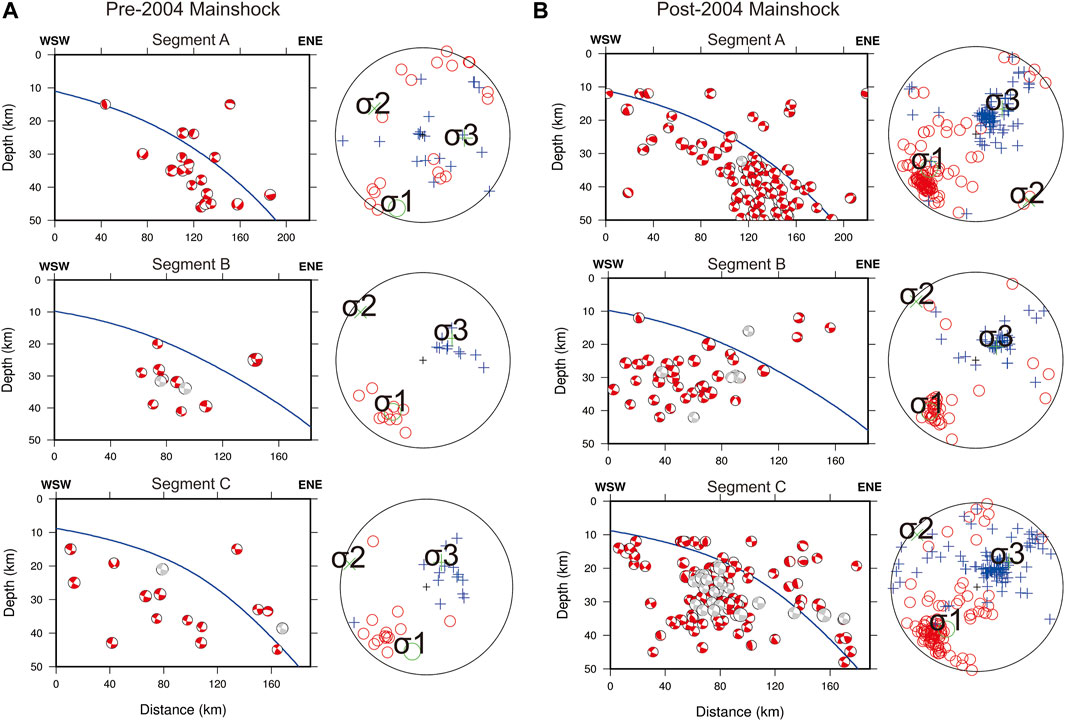
FIGURE 8. Vertical cross section of the distribution of focal mechanisms in each segment for pre- (A) and post-2004 mainshock (B). The obtained principal stress solution is also displayed with P (red circles) and T (blue plus) axes of every focal mechanism on the right of cross section for each time domain. The red focal mechanisms are the data that accepted in the stress inversion while the gray focal mechanisms are the rejected data as they identified as megathrust event. The slab used in the cross section is obtained from SLAB2.0 (Hayes, 2018).
The stress inversion results displayed in Figure 5 are in overall agreement with those of (Hardebeck’s, 2012), who estimated stress directions in the rupture area of the 2004 Sumatra-Andaman earthquake before and after the event. The directions of σ1 and σ3 lie in a vertical plane roughly aligned with the direction of plate convergence, with σ1 having shallow plunge directed opposite to the megathrust dip, and σ3 plunging steeply in the opposite direction. (Hardebeck’s, 2012). used an outer forearc segment A that is almost identical to the segment A used here, so results there can be compared in detail. A comparison of the top panel of our Figure 5 with the bottom panel of (Hardebeck’s, 2012) Figure 5C shows that the estimated post-mainshock stress directions in segment A are almost identical. Although the pre-mainshock stress directions are very similar, the bootstrap resampled distributions of our estimated stress directions exhibit more scatter, and our σ1 has a plunge shallower than that of (Hardebeck 2012).
Because there were so few pre-mainshock events, the bootstrap resampled stress inversion showed larger scatter for each pre-mainshock result compared to the corresponding post-mainshock result, both for σ1 plunge and SHmax (Figure 6). The combined segment A-B-C produced smaller uncertainties for pre- and post-mainshock stress orientations. Although the stress inversions for individual segments have greater uncertainty, results for segments A, B and C reveal a pattern of along-strike variation in stress orientations, which is most clearly evident in the variation of σ1 plunge (Figure 6A).
Discussion
In order to better understand the stress field of the northern Sumatra subduction zone, and how it was influenced by the giant megathrust earthquakes that occurred there in 2004 and 2005, we inverted focal mechanisms for the pre- and post-mainshock principal stress orientations in several segments of the outer forearc. The shallow plunge of σ1 in opposite direction to the megathrust dip, and the steep plunge of σ3, are consistent with numerical models of low-stress outer forearcs (Wang and He, 1999). A plunge of σ1 of 20° for the combined segments A-B-C (Table 1) implies a dip angle of about 40° with the megathrust, which is quite similar to other subduction megathrusts exhibiting high seismic coupling, like SW and NE Japan, and South America (Hardebeck, 2015). On the other hand, we find that plunges for individual segments are 11°, 29° and 29° for segment A, B and C, correspond to angles of 31°, 49° and 49° between the megathrust and σ1. Following (Hardebeck, 2015) assessment of variations in stress orientations and megathrust coupling in subduction zones worldwide, these results imply that segment A is strongly coupled, while segments B and C have weak or intermediate coupling.
The post mainshock stress field of the separate segments in the individual outer forearc is less consistent. Segments A and C, the like combined segment A-B-C, show a steeper plunge of σ1 and clockwise rotation of SHmax (see Table 2), which is consistent with the release of shear stress on the megathrust.
The exception to the near-complete release of pre-mainshock stress in the Sumatra outer forearc is segment B. Segments B and C both have an 18° steeper pre-mainshock plunge of σ1 than segment A, indicating a weaker megathrust. However, relative to its pre-mainshock stress parameters, the plunge of σ1 in segment B has actually decreased by 7°, in contrast to the 22° and 7° increases of σ1 plunge in segments A and C, respectively. Also, segment B has experienced only a 8° clockwise rotation of SHmax, which is much smaller than in either segments A or C (38° and 12°, respectively). While individual these differences may not be significant at the 95% confidence level, we believe the consistency in the contrasting behavior of segment B relative to A and C cannot be ignored. Using the approach of (Hardebeck and Hauksson, 2001), we infer the stress drop ratio, i.e., the ratio of stress drop to initial megathrust shear stress, using the estimated changes in σ1 plunge (Δθ) and the pre-mainshock angle of σ1 to the fault (θ) (see Table 3). This stress drop ratio is computed using Eq. 4 in (Hardebeck and Hauksson, 2001), and we take into account the uncertainty of the σ1 plunge in our estimates of Δθ and θ. The intersection of the 95% quantile of boostrap resampling distributions for Δθ and θ with the allowable areas of the stress drop plot in Figure 9 encompass a wide range of stress drop ratios for each segment. However, if we consider that the occurrence of large earthquakes in segments A and C should be associated with a positive stress drop, then the stress drop ratio for segment A is in the range 86–100%, while that for C is in the range 0–89%. If we allow for segment B to have experienced no or partial rupture, then its range of possible stress drop ratios is so wide as to be essentially meaningless.
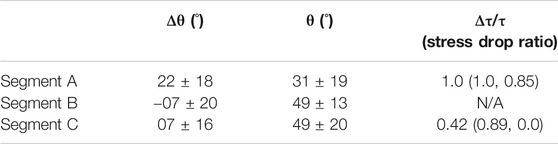
TABLE 3. Stress rotation (Δθ), the pre-mainshock angle of σ1 to the fault (θ), and inferred stress drop ratios (Δτ/τ) according to Hardebeck and Hauksson (2001). Δτ/τ could not be resolved for segment B.
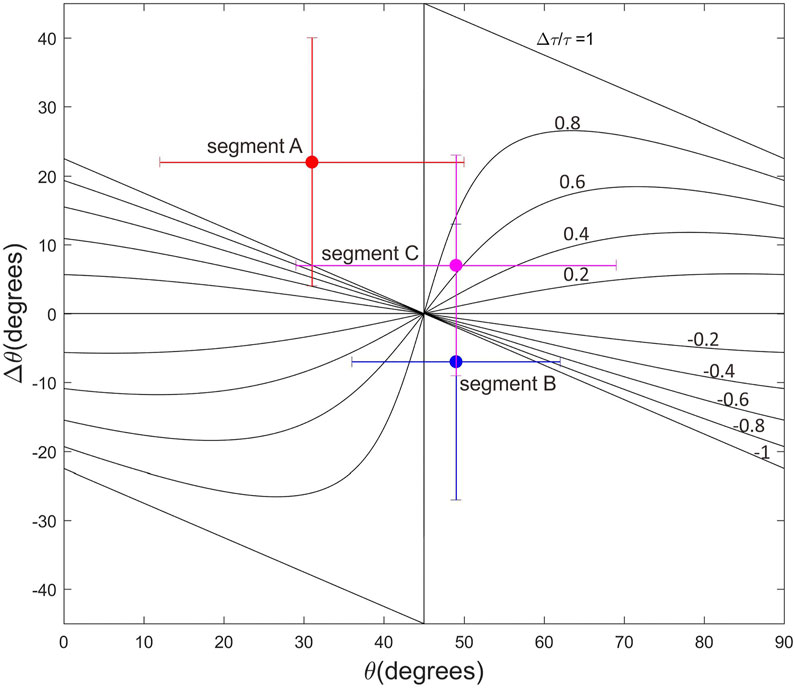
FIGURE 9. Plot of stress rotations in the three segments analysed in this study, where θ is the pre-mainshock angle of σ1 axis to the orientation of the megathrust interface and Δθ is the stress rotation between the pre-vs post-mainshock. The theoretical stress drop ratio following Hardebeck and Hauksson (2001) for each segment is plotted. Bars plotted along with the theoretical stress drop is the uncertainty estimated as half the 95% confidence intervals (see Table 3).
The principal stress orientations and their rotations due to the occurrence of the mainshocks exhibited a consistent variation along strike, in which the pre-mainshock plunge of σ1 was shallower and the coseismic rotations of both the σ1 plunge and SHmax were larger in segment A, the southern part of the 2004 earthquake’s rupture area, than in segment C in the rupture area of the 2005 earthquake. The shallower σ1 suggests a higher level of stress (Hardebeck, 2015; Hardebeck and Loveless, 2017) on the megathrust and the larger coseismic rotations indicate a larger stress drop ratio of the 2004 earthquake relative to the 2005 event. This apparent along-strike variation in stress and stress drops correlates with the time intervals since the previous earthquakes in these segments: the predecessor to the 2004 earthquakes in segment A occurred in AD 1450 ± 3 (Meltzner et al., 2012), so stress had built up over about 550 years, while the predecessor to the 2005 earthquake in segment C occurred in 1861, only 144 years earlier. Hence, megathrust stress accumulated on segment A over a longer interseismic interval before reaching failure, but when it does fail the stress drop is larger than in segment C. However, we note that paleotsunami studies indicate a wide variation in recurrence intervals of large earthquakes on the Sumatra megathrust (Rubin et al., 2017), so such a model is likely an oversimplification.
Like segment C, segment B showed a steeper pre-mainshock plunge of σ1 which suggests that the accumulated stress on the Sumatra megathrust prior to the 2004 and 2005 mainshocks was less on Segments B and C than it was on segment A. The decrease in plunge of -7° following the 2004–2005 mainshocks implies that the stress on the segment B megathrust has increased as a result of the 2004 and 2005 earthquakes.
This apparently anomalous behaviour of Segment B can be explained by its position at the “gap” between the 2004 Sumatra-Andaman and 2005 Nias-Simeulue rupture areas, as indicated by the juxtaposition of the outer forearc changes in stress orientation parameters with slip in the 2004 and 2005 earthquakes in Figures 10B,C. We used the finite fault models of (Banerjee et al., 2007) for comparison, since they use exactly the same methodology for both earthquakes, and they optimize the fit to coseismic displacement observations that should reflect changes in stress. In order to better identify the edges of the rupture area, we normalized each model with respect to its maximum slip, since otherwise the regularization used in the finite fault inversions can spread the rupture area beyond any rupture barrier. That such a barrier exists in segment B is well established by coral microatoll measurements of coseismic uplift along the coast of Simeulue north of Nias, which clearly show a 70 km-wide “saddle” of reduced uplift (0.5–1.5 m) that separates the rupture areas of the 2004 and 2005 earthquakes (Briggs et al., 2006, whose data are reproduced in Figure 10A). Moreover, (Meltzner et al., 2012), more detailed analysis of the coral microatoll data revealed that this barrier is persistent: over the past 1,100 years, rupture of at least three predecessors to the 2004 event and two predecessors to the 2005 event that uplifted the north and south coasts, respectively, of Simeulue, did not extend beyond this barrier.

FIGURE 10. Comparison of (A) coseismic uplift data from Coral microatolls on the coast of Simeulue (Briggs et al., 2006) measured before and after the 2004 and 2005 earthquakes with (B) profiles of normalized slip (maximum slip as a function of latitude divided by the maximum slip for the respective event, taken from the finite fault models of Banerjee et al., 2007), and (C) distributions for changes in the pre-vs post-mainshock changes in the plunge of σ1 and azimuth SHmax among the outer forearc segments A, B and C.
(Briggs et al., 2006) hypothesise that this barrier is a section of megathrust where slip occurs during the interval between large earthquakes, either aseismically or in moderate earthquakes. Thus, when a large earthquake occurs on either side of the barrier, rupture would be unlikely to propagate through the de-stressed section. Our measurements of stress orientations in segment B, especially when compared to those in segments A and C which lie in the rupture areas of the 2004 and 2005 events, respectively, are consistent with this hypothesis for the rupture barrier beneath Simeulue. The steeper plunge of σ1 in segments B and C suggests that at the time of the 2004 event the stress was lower there than in the adjacent segment A where σ1 had shallower plunge. While the megathrust in segment C ruptured at this lower level of stress, segment B did not completely rupture. Instead, the occurrence of the 2004 and 2005 earthquakes in the adjacent segments appears to have increased the stress on segment B, as evidenced by its reduction in σ1 plunge. If the (Briggs et al., 2006) hypothesis is correct, this additional stress will be relieved in future years either through aseismic slip or the occurrence of moderate earthquakes.
Such an interpretation is supported by the aftershock study of (Tilmann et al., 2010), who noticed that shallow aftershocks of the 2004 and 2005 earthquakes mark the transition between stable sliding of the megathrust near the trench and unstable sliding in the rupture zones downdip. However, exactly at the Simeulue Saddle this narrow band of aftershocks undergoes a pronounced shift down-dip, suggesting that stable sliding occupies a greater downdip extent of the megathrust in segment B than elsewhere. (Tilmann et al., 2010). note that this aftershock gap, and the Simeulue Saddle, occurs where a fracture zone in the subducting Indian Ocean crust intersects the trench, and they speculate that this could be a zone of enhanced fluid release into the megathrust, reducing its effective normal stress and promoting stable, aseismic slip (Moore & Saffer 2001; Scholz 2019).
Conclusion
We have investigated along-strike variations in stess of the Sumatra forearc, along with its perturbation due to the occurrence of the 2004–2005 megathrust earthquakes. Prior to the occurrence of these earthquakes, the outer forearc had an SHmax well aligned with the oblique convergence of the Indian and Australian Plates relative to the Sunda Plate. The plunge of maximum principle stress σ1 was only 11° in segment A, the rupture area of the 2004 earthquake, indicating a strong megathrust. This plunge increased to 29° in segments B and C, indicating a pronounced decrease in megathrust strength south of the 2004 earthquake’s rupture area.
After the two megathrust earthquakes occurred, SHmax rotated counterclockwise, to a direction more normal to the plate boundary, and the plunge of σ1 increased, at least in segments A and C, which cover the rupture areas of the 2004 and 2005 earthquakes, respectively. This behaviour is consistent with previous studies and is consistent with a low-stress forearc, in which almost all the stress on the megathrust was released in the earthquakes (Herdebeck, 2012). The stress rotations in segments A and C indicate a larger stress drop ratio of the 2004 earthquake (in a range of about 85–100%) relative to the 2005 (in a range of about 0–90%).
The most intriguing results of this study were obtained for outer forearc segment B, which straddles the boundary between the 2004 and 2005 earthquakes, known as the “Simeulue Saddle” because it marks a gap in megathrust rupture that appears to have persisted over many earthquake cycles (Briggs et al., 2006; Meltzner et al., 2012). The post-mainshock stress results for segment B show that the plunge of σ1 has decreased, implying that stress on the segment B megathrust has actually increased over its pre-mainshock state. This is exactly what would be expected for a rupture barrier that experiences aseismic slip: its pre-mainshock accumulated stress is less than the adjacent segments because stress has been released in the preceding interseismic interval by aseismic creep. Rupture in each of the 2004 and 2005 earthquakes has “loaded” the stress in segment B, as indicated by the reduced plunge of σ1, even though the aseismic zone itself fails to rupture. Under this hypothesis, the increased stress on the megathrust in segment B will be gradually released by aseismic creep until its stress is less than that recovered in the adjacent segments during the next interseismic interval, so that it returns to the pre-mainshock state prior to the 2004 earthquake.
Data Availability Statement
The original contributions presented in the study are included in the article/Supplementary Material, further inquiries can be directed to the corresponding author.
Author Contributions
MR, PC, and DS contributed to calculate all the stress estimation. PC, DS, SW, WT, and AN contributed to supervise and validate the results. All authors contributed to the writing and the preparation of the manuscript. All authors have read and approved the final manuscript.
Funding
This research was supported through “Program Magister menuju Doktor untuk Sarjana Unggul (PMDSU)” scheme by Directorate General of Resources for Science, Technology, and Higher Education of Kemristek/BRIN which has given to MTR.
Conflict of Interest
The authors declare that the research was conducted in the absence of any commercial or financial relationships that could be construed as a potential conflict of interest.
Publisher’s Note
All claims expressed in this article are solely those of the authors and do not necessarily represent those of their affiliated organizations, or those of the publisher, the editors and the reviewers. Any product that may be evaluated in this article, or claim that may be made by its manufacturer, is not guaranteed or endorsed by the publisher.
Acknowledgments
All figures in this manuscript were plotted using Global Mapping Tools (GMT) (Wessel et al., 2019) and MATLAB software.
Supplementary Material
The Supplementary Material for this article can be found online at: https://www.frontiersin.org/articles/10.3389/feart.2021.712144/full#supplementary-material
References
Ammon, C. J., Ji, C., Thio, H., Robinson, D., Ni, S., Hjorleifsdottir, V., et al. (2005). Rupture Process of the 2004 Sumatra-Andaman Earthquake. Science 308, 1133–1139. doi:10.1126/science.1112260
Banerjee, P., Pollitz, F., Nagarajan, B., and Burgmann, R. (2007). Coseismic Slip Distributions of the 26 December 2004 Sumatra-Andaman and 28 March 2005 Nias Earthquakes from GPS Static Offsets. Bull. Seismological Soc. America 97 (1A), S86–S102. doi:10.1785/0120050609
Bott, M. H. P. (1959). The Mechanics of Oblique Slip Faulting. Geol. Mag. 96, 109–117. doi:10.1017/S0016756800059987
Briggs, R. W., Sieh, K., Meltzner, A., Natawidjaja, D., Galetzka, J., Suwargadi, B., et al. (2006). Deformation and Slip along the Sunda Megathrust in the Great 2005 Nias-Simeulue Earthquake. Science 311 (5769), 1897–1901. doi:10.1126/science.1122602
Dziewonski, A. M., Chou, T.-A., and Woodhouse, J. H. (1981). Determination of Earthquake Source Parameters from Waveform Data for Studies of Global and Regional Seismicity. J. Geophys. Res. 86, 2825–2852. doi:10.1029/JB086iB04p02825
Ekström, G., Nettles, M., and Dziewoński, A. M. (2012). The Global CMT Project 2004-2010: Centroid-Moment Tensors for 13,017 Earthquakes. Phys. Earth Planet. Interiors 200-201, 1–9. doi:10.1016/j.pepi.2012.04.002
Freed, A. M. (2005). Earthquake Triggering by Static, Dynamic, and Postseismic Stress Transfer. Annu. Rev. Earth Planet. Sci. 33, 335–367. doi:10.1146/annurev.earth.33.092203.122505
Gordon, R. G., DeMets, C., and Argus, D. F. (1990). Kinematic Constraints on Distributed Lithospheric Deformation in the Equatorial Indian Ocean from Present Motion between the Australian and Indian Plates. Tectonics 9 (3), 409–422. doi:10.1029/TC009i003p00409
Gunawan, E., Sagiya, T., Ito, T., Kimata, F., Tabei, T., Ohta, Y., et al. (2014). A Comprehensive Model of Postseismic Deformation of the 2004 Sumatra-Andaman Earthquake Deduced from GPS Observations in Northern Sumatra. J. Asian Earth Sci. 88 (C), 218–229. doi:10.1016/j.jseaes.2014.03.016
Hamilton, W. (1979). Tectonics of the Indonesian Region. Washington, DC: United States Government Printing Office. doi:10.3133/pp1078
Hardebeck, J. L. (2012). Coseismic and Postseismic Stress Rotations Due to Great Subduction Zone Earthquakes. Geophys. Res. Lett. 39, a–n. doi:10.1029/2012GL053438
Hardebeck, J. L., and Hauksson, E. (2001). Crustal Stress Field in Southern California and its Implications for Fault Mechanics. J. Geophys. Res. 106, 21859–21882. doi:10.1029/2001JB000292
Hardebeck, J. L., and Loveless, J. P. (2017). Creeping Subduction Zones Are Weaker Than Locked Subduction Zones. Nat. Geosci 11 (1), 60–64. doi:10.1038/s41561-017-0032-1
Hardebeck, J. L., and Okada, T. (2018). Temporal Stress Changes Caused by Earthquakes: A Review. J. Geophys. Res. Solid Earth 123, 1350–1365. doi:10.1002/2017JB014617
Hardebeck, J. L. (2015). Stress Orientations in Subduction Zones and the Strength of Subduction Megathrust Faults. Science 349 (6253), 1213–1216. doi:10.1126/science.aac5625
Hasegawa, A., Yoshida, K., Asano, Y., Okada, T., Iinuma, T., and Ito, Y. (2012). Change in Stress Field after the 2011 Great Tohoku-Oki Earthquake. Earth Planet. Sci. Lett. 355-356, 231–243. doi:10.1016/j.epsl.2012.08.042
Hayes, G. P., Moore, G. L., Portner, D. E., Hearne, M., Flamme, H., Furtney, M., et al. (2018). Slab2, a Comprehensive Subduction Zone Geometry Model. Science 362, 58–61. doi:10.1126/science.aat4723
Ito, T., Gunawan, E., Kimata, F., Tabei, T., Simons, M., Meilano, I., et al. (2012). Isolating Along-Strike Variations in the Depth Extent of Shallow Creep and Fault Locking on the Northern Great Sumatran Fault. J. Geophys. Res. 117, a–n. doi:10.1029/2011JB008940
Kapoor, D. C. (1981). General Bathymetric Chart of the Oceans (GEBCO). Mar. Geodesy 5 (1), 73–80. doi:10.1080/15210608109379408
Konca, A. O., Hjorleifsdottir, V., Song, T.-R. A., Avouac, J.-P., Helmberger, D. V., Ji, C., et al. (2007). Rupture Kinematics of the 2005 Mw 8.6 Nias-Simeulue Earthquake from the Joint Inversion of Seismic and Geodetic Data. Bull. Seismological Soc. America 97 (1A), S307–S322. doi:10.1785/0120050632
Kreemer, C., Blewitt, G., and Klein, E. C. (2014). A Geodetic Plate Motion and Global Strain Rate Model. Geochem. Geophys. Geosyst. 15 (10), 3849–3889. doi:10.1002/2014GC005407
Kubo, A., Fukuyama, E., Kawai, H., and Nonomura, K. I. (2002). NIED Seismic Moment Tensor Catalogue for Regional Earthquakes Around Japan: Quality Test and Application. Tectonophysics 356 (1-3), 23–48. doi:10.1016/S0040-1951(02)00375-X
Lentas, K., Di Giacomo, D., Harris, J., and Storchak, D. A. (2019). The ISC Bulletin as a Comprehensive Source of Earthquake Source Mechanisms. Earth Syst. Sci. Data 11, 565–578. doi:10.5194/essd-11-565-2019
Lin, W., Saito, S., Sanada, Y., Yamamoto, Y., Hashimoto, Y., and Kanamatsu, T. (2011). Principal Horizontal Stress Orientations Prior to the 2011 Mw9.0 Tohoku-Oki, Japan, Earthquake in its Source Area. Geophys. Res. Lett. 38, a–n. doi:10.1029/2011GL049097
Lund, B., and Slunga, R. (1999). Stress Tensor Inversion Using Detailed Microearthquake Information and Stability Constraints: Application to Ölfus in Southwest Iceland. J. Geophys. Res. 104, 14947–14964. doi:10.1029/1999JB900111
Lund, B., and Townend, J. (2007). Calculating Horizontal Stress Orientations with Full or Partial Knowledge of the Tectonic Stress Tensor. Geophys. J. Int. 170 (3), 1328–1335. doi:10.1111/j.1365-246X.2007.03468.x
Malod, J. A., Karta, K., Beslier, M. O., and Zen, M. T. (1995). From normal to Oblique Subduction: Tectonic Relationships between Java and Sumatra. J. Southeast Asian Earth Sci. 12, 85–93. doi:10.1016/0743-9547(95)00023-2
McCaffrey, R. (1992). Oblique Plate Convergence, Slip Vectors, and Forearc Deformation. J. Geophys. Res. 97, 8905–8915. doi:10.1029/92JB00483
McCaffrey, R. (2009). The Tectonic Framework of the Sumatran Subduction Zone. Annu. Rev. Earth Planet. Sci. 37, 345–366. doi:10.1146/annurev.earth.031208.100212
McCaffrey, R., Zwick, P. C., Bock, Y., Prawirodirdjo, L., Genrich, J. F., Stevens, C. W., et al. (2000). Strain Partitioning during Oblique Plate Convergence in Northern Sumatra: Geodetic and Seismologic Constraints and Numerical Modeling. J. Geophys. Res. 105, 28363–28376. doi:10.1029/1999JB900362
McCloskey, J., Nalbant, S. S., and Steacy, S. (2005). Earthquake Risk from Co-seismic Stress. Nature 434, 291. doi:10.1038/434291a
McKenzie, D. P. (1969). The Relation between Fault Plane Solutions for Earthquakes and the Directions of the Principal Stresses. Bull. Seismological Soc. America 59 (2), 591–601. doi:10.1785/bssa0590020591
Meltzner, A. J., Sieh, K., Chiang, H.-W., Shen, C.-C., Suwargadi, B. W., Natawidjaja, D. H., et al. (2012). Persistent Termini of 2004- and 2005-like Ruptures of the Sunda Megathrust. J. Geophys. Res. 117, a–n. doi:10.1029/2011JB008888
Michael, A. J. (1984). Determination of Stress from Slip Data: Faults and Folds. J. Geophys. Res. 89, 11517–11526. doi:10.1029/JB089iB13p11517
Michael, A. J., Ellsworth, W. L., and Oppenheimer, D. H. (1990). Coseismic Stress Changes Induced by the 1989 Loma Prieta, California Earthquake. Geophys. Res. Lett. 17, 1441–1444. doi:10.1029/GL017i009p01441
Michael, A. J. (1987). Use of Focal Mechanisms to Determine Stress: A Control Study. J. Geophys. Res. 92, 357–368. doi:10.1029/JB092iB01p00357
Moeremans, R. E., and Singh, S. C. (2015). Fore-arc basin Deformation in the Andaman-Nicobar Segment of the Sumatra-Andaman Subduction Zone: Insight from High-Resolution Seismic Reflection Data. Tectonics 34, 1736–1750. doi:10.1002/2015TC003901
Moore, J. C., and Saffer, D. (2001). Updip Limit of the Seismogenic Zone beneath the Accretionary Prism of Southwest Japan: An Effect of Diagenetic to Low-Grade Metamorphic Processes and Increasing Effective Stress. Geol 29 (2), 183–186. doi:10.1130/0091-7613(2001)029<0183:ulotsz>2.0.co;2
Newcomb, K. R., and McCann, W. R. (1987). Seismic History and Seismotectonics of the Sunda Arc. J. Geophys. Res. 92, 421–439. doi:10.1029/JB092iB01p00421
Pollitz, F. F., Banerjee, P., Bürgmann, R., Hashimoto, M., and Choosakul, N. (2006b). Stress Changes along the Sunda Trench Following the 26 December 2004 Sumatra-Andaman and 28 March 2005 Nias Earthquakes. Geophys. Res. Lett. 33, L06309. doi:10.1029/2005GL024558
Pollitz, F. F., Bürgmann, R., and Banerjee, P. (2006a). Post-seismic Relaxation Following the Great 2004 Sumatra-Andaman Earthquake on a Compressible Self-Gravitating Earth. Geophys. J. Int. 167 (1), 397–420. doi:10.1111/j.1365-246X.2006.03018.x
Rubin, C. M., Horton, B. P., Sieh, K., Pilarczyk, J. E., Daly, P., Ismail, N., et al. (2017). Highly Variable Recurrence of Tsunamis in the 7,400 Years before the 2004 Indian Ocean Tsunami. Nat. Commun. 8, 16019. doi:10.1038/ncomms16019
Satriano, C., Kiraly, E., Bernard, P., and Vilotte, J.-P. (2012). The 2012 Mw 8.6 Sumatra Earthquake: Evidence of Westward Sequential Seismic Ruptures Associated to the Reactivation of a N-S Ocean Fabric. Geophys. Res. Lett. 39 (15). doi:10.1029/2012GL052387
Scholz, C. H. (2019). The Mechanics of Earthquakes and Faulting. Cambridge University Press. doi:10.1017/9781316681473
Sevilgen, V., Stein, R. S., and Pollitz, F. F. (2012). Stress Imparted by the Great 2004 Sumatra Earthquake Shut Down Transforms and Activated Rifts up to 400 Km Away in the Andaman Sea. Proc. Natl. Acad. Sci. USA 109 (38), 15152–15156. doi:10.1073/pnas.1208799109
Sieh, K., Ward, S. N., Natawidjaja, D., and Suwargadi, B. W. (1999). Crustal Deformation at the Sumatran Subduction Zone Revealed by Coral Rings. Geophys. Res. Lett. 26, 3141–3144. doi:10.1029/1999GL005409
Stein, S., and Okal, E. A. (2007). Ultralong Period Seismic Study of the December 2004 Indian Ocean Earthquake and Implications for Regional Tectonics and the Subduction Process. Bull. Seismological Soc. America 97 (1A), S279–S295. doi:10.1785/0120050617
Storchak, D. A., Di Giacomo, D., Engdahl, E. R., Harris, J., Bondár, I., Lee, W. H. K., et al. (2015). The ISC-GEM Global Instrumental Earthquake Catalogue (1900-2009): Introduction. Phys. Earth Planet. Interiors 239, 48–63. doi:10.1016/j.pepi.2014.06.009
Tanioka, Y., Yudhicara, T., Kususose, T., Kathiroli, S., Nishimura, Y., Iwasaki, S.-I., et al. (2006). Rupture Process of the 2004 Great Sumatra-Andaman Earthquake Estimated from Tsunami Waveforms. Earth Planet. Sp 58, 203–209. doi:10.1186/BF03353379
Tilmann, F. J., Craig, T. J., Grevemeyer, I., Suwargadi, B., Kopp, H., and Flueh, E. (2010). The Updip Seismic/aseismic Transition of the Sumatra Megathrust Illuminated by Aftershocks of the 2004 Aceh-Andaman and 2005 Nias Events. Geophys. J. Int. 308 (1A), 1261–1274. doi:10.1111/j.1365-246X.2010.04597.x
Triyoso, W., Suwondo, A., Yudistira, T., and Sahara, D. P. (2020). Seismic Hazard Function (SHF) Study of Coastal Sources of Sumatra Island: SHF Evaluation of Padang and Bengkulu Cities. Geosci. Lett. 7 (1), 1–7. doi:10.1186/s40562-020-00151-x
U.S. Geological Survey (2017). Earthquake Facts and Statistics. Availableat: https://www.usgs.gov/natural-hazards/earthquake-hazards/science/20-largest-earthquakes-world (Accessed April 2, 2020).
Vavryčuk, V. (2014). Iterative Joint Inversion for Stress and Fault Orientations from Focal Mechanisms. Geophys. J. Int. 199, 69–77. doi:10.1093/gji/ggu224
Vavryčuk, V. (2011). Principal Earthquake: Theory and Observation from the 2008 West Bohemia Swarm. Earth Planet. Sci. Lett. 305, 290–296. doi:10.1016/j.epsl.2011.03.002
Wallace, R. E. (1951). Geometry of Shearing Stress and Relation to Faulting. J. Geology. 59, 118–130. doi:10.1086/625831
Wang, K., and He, J. (1999). Mechanics of Low-Stress Forearcs: Nankai and Cascadia. J. Geophys. Res. 104 (B7), 15191–15205. doi:10.1029/1999JB900103
Wessel, P., Luis, J. F., Uieda, L., Scharroo, R., Wobbe, F., Smith, W. H. F., et al. (2019). The Generic Mapping Tools Version 6. Geochem. Geophys. Geosyst. 20, 5556–5564. doi:10.1029/2019GC008515
Wiens, D. A., DeMets, C., Gordon, R. G., Stein, S., Argus, D., Engeln, J. F., et al. (1985). A Diffuse Plate Boundary Model for Indian Ocean Tectonics. Geophys. Res. Lett. 12 (7), 429–432. doi:10.1029/GL012i007p00429
Wiseman, K., and Bürgmann, R. (2011). Stress and Seismicity Changes on the Sunda Megathrust Preceding the 2007 Mw 8.4 Earthquake. Bull. Seismological Soc. America 101, 313–326. doi:10.1785/0120100063
Keywords: coseismic stress rotation, in-situ stress, principle stress orientation, Sumatran subduction, megathrust earthquake
Citation: Rafie MT, Cummins PR, Sahara DP, Widiyantoro S, Triyoso W and Nugraha AD (2021) Variations in Forearc Stress and Changes in Principle Stress Orientations Caused by the 2004–2005 Megathrust Earthquakes in Sumatra, Indonesia. Front. Earth Sci. 9:712144. doi: 10.3389/feart.2021.712144
Received: 20 May 2021; Accepted: 20 July 2021;
Published: 02 August 2021.
Edited by:
Yosuke Aoki, The University of Tokyo, JapanReviewed by:
Jeanne Hardebeck, United States Geological Survey (USGS), United StatesAndrea Zanchi, University of Milano-Bicocca, Italy
Copyright © 2021 Rafie, Cummins, Sahara, Widiyantoro, Triyoso and Nugraha. This is an open-access article distributed under the terms of the Creative Commons Attribution License (CC BY). The use, distribution or reproduction in other forums is permitted, provided the original author(s) and the copyright owner(s) are credited and that the original publication in this journal is cited, in accordance with accepted academic practice. No use, distribution or reproduction is permitted which does not comply with these terms.
*Correspondence: David P. Sahara, ZGF2aWQuc2FoYXJhQGdmLml0Yi5hYy5pZA==