 Denis Shmelev
 Maria Cherbunina
 Victor Rogov
 Sophie Opfergelt
 Arthur Monhonval
 Jens Strauss
- 1Institute of Physicochemical and Biological Problems in Soil Science, Russian Academy of Sciences, Pushchino, Russia
- 2Geology Department, Lomonosov Moscow State University, Moscow, Russia
- 3Geography Department, Lomonosov Moscow State University, Moscow, Russia
- 4Earth and Life Institute, Université Catholique de Louvain, Louvain-la-Neuve, Belgium
- 5Permafrost Research Section, Alfred Wegener Institute Helmholtz Centre for Polar and Marine Research, Potsdam, Germany
Cryogenic weathering is a key driver of periglacial sediment composition and properties. Selective mineral-grain weathering caused by freeze-thaw cycles in permafrost environments has the ability to dominate this process, leading to silt-rich grain-size distributions. The cryogenic weathering index (CWI) is a promising tool to quantify cryogenic weathering and freezing conditions. It considers the low resistance of quartz to freeze-thaw cycles compared to feldspars. Using this approach, this study aims to decipher post-depositional weathering by reconstructing cryogenic late Pleistocene Yedoma origins of the Yedoma stratotype exposure Duvanny Yar. To estimate the recent environmental endmember and to determine the initial mineral composition of sediment until freezing, the distribution of CWI in the active layer was studied. In addition to CWI, we studied mineral composition, heavy mineral distribution, grain size distribution and grain morphology. We suggest that cryogenic weathering likely altered polygenetic deposits (fluvial, nival, colluvial, lacustrine, alluvial, and aeolian processes) during sediment and ground ice accumulation. Moreover, we found two CWI distribution peaks in the late Pleistocene - Holocene sediments at the boundaries between glacial and interglacial ages. In conclusion, we see that the Duvanny Yar sediment facies varied by CWI, but also with grain-size distribution, suggesting environmental changes during formation. Nevertheless, post-depositional processes like cryogenic weathering have influenced sediment characteristics and should be considered in paleoenvironmental reconstructions.
Introduction
The permafrost region (including permafrost-free areas) of the Northern Hemisphere land area is estimated to be 21 million km2 (22% of the exposed land area), and modelling studies indicate that 13.9 million km2 are actually underlain by permafrost (Obu et al., 2019). In general, frozen soils are characterized by specific properties caused by their accumulation and freezing. Cryogenic weathering of permafrost, i.e., the processes of selective mineral destruction that occur during alternating freeze-thaw cycles, has been shown previously (Konishchev, 1981; Konishchev and Rogov, 1993; Rogov, 2000; Konishchev, 2013). A process of cryogenic weathering (mineral-grain destruction due to changing thickness of water films, ice pressure, and the pressure of gas-liquid inclusions) was found to be a key process of cryolithogenes (rock-like sediments, caused by freezing). Looking closer at the influence of mineral composition on weathering effectiveness, an increasing resistance of minerals to cryogenic weathering was found in this order: quartz < amphibole < pyroxene < feldspars < mica (Konishchev, 1981). An accepted view is that quartz is more resistant than feldspar to chemical weathering, the process involving chemical reactions of minerals with water and acidity leading to the dissolution of the minerals. For cryogenic weathering, this is the opposite: quartz is less resistant than feldspar (Konishchev and Rogov, 1993; Schwamborn et al., 2012). Konishchev and Rogov (1993) argued that during freeze-thaw cycles cryogenic weathering depends primarily on the thickness and properties of the unfrozen water film, and less on the mechanical properties of the mineral itself. Due to different surface energy (charge) quartz is assumed to have thicker water films compared to feldspar (Rogov, 2000). Rogov (2000) suggested that when gas-liquid inclusions, generally containing salt, freeze, they create weak points, leading to the weathering of quartz minerals during freeze-thaw cycles.
Cryogenic weathering is important in the permafrost region, especially in ice-bearing permafrost areas. Especially the Yedoma domain could be a prime candidate for cryogenic weathering. The Duvanny Yar site in northeastern Siberia is a well-known stratotype of a typical Yedoma landscape with traces of permafrost dated back to the Pliocene in the form of ice-wedge casts and cryoturbations (Sher, 1971; Arkhangelov, 1977; Sher et al., 1979). During the Last Glacial Maximum (LGM, 22,000–14,000 yrs BP) winter temperatures in the Arctic were found to be 10–15°C lower than today (Meyer et al., 2015), and permafrost temperatures were up to 20°C colder than modern permafrost temperatures (Kaplina, 2009; Konishchev, 2013). Starting in late Pleistocene times, Yedoma deposits accumulated in a tundra-steppe landscape via cryogenic weathering and different transport and deposition mechanisms until the late Pleistocene to Holocene transition period (∼12,000 yrs BP) (Sher, 1971; Arkhangelov, 1977; Sher et al., 1979; Tomirdiaro, 1980; Schirrmeister et al., 2011; Strauss et al., 2012; Murton et al., 2015; Strauss et al., 2017). Yedoma deposits largely formed due to polygenetic deposition with syngenetic frost cracking and ground ice accumulation (Ulrich et al., 2014). A relatively constant sedimentation rate and significant syngenetic ice development in Yedoma deposits accumulated sediments up to 50 m thick (Kanevskiy et al., 2011; Schirrmeister et al., 2013). Two key layers are generally distinguished within Yedoma outcrops (e.g., Chukochiy cape, Duvanny Yar, Mus-Khaya): the one formed during the Marine Isotope Stage (MIS) 3–4 (75,000–50,000 and 50,000–25,000 yrs BP) with thick and infrequent ice wedges, and the one formed during the MIS-2 (25,000–12,000 yrs BP) with thin and frequent ice wedges (Arkhangelov, 1977; Konishchev, 1983; Katasonov, 2009). Thermal degradation was starting in the late glacial (mainly Holocene) warming. This intensified the degradation of Yedoma deposits. The main degradation process during this period was thermokarst (Olefeldt et al., 2016), i.e., the deep thawing of Yedoma ice wedges leading to shallow lake formation and permafrost subsidence (Grosse et al., 2013). When the lake drains, the sediments in the thawed depression refreeze under subaerial conditions. Sediments in thermokarst depressions are considered to be alas deposits (Walter et al., 2007; Kaplina, 2009). Moreover, the surfaces of the Yedoma uplands have been reworked by Holocene thawing and refreezing. Thus, a Holocene cover layer up to 2–3 m thick (Sher, 1997; Kaplina, 2009) was developed.
It is considered that Yedoma formation at the Duvanny Yar stratotype involves polygenetic origins such as aeolian, fluvial, colluvial sediments (Sher, 1997; Schirrmeister et al., 2011; Strauss et al., 2012), as described for other Yedoma deposits (Strauss et al., 2017; Schirrmeister et al., 2020). However, there are still unsolved questions regarding the influence of post-depositional processes at the Duvanny Yar site. An alternative explanation for a sediment considered dominated by aeolian deposition (Tomirdiaro, 1980; Gubin, 1999; Murton et al., 2015) could be that post-depositional cryogenic weathering processes may have affected grain morphology. This hypothesis can be tested by using the cryogenic weathering index (CWI) developed by Konishchev (1981) as a proxy for the intensity of cryogenic transformation. Given that multiple repeated freeze-thaw processes in the active layer can also affect the mineral distributions in the grain-size fractions, there is also a need to investigate the variability of the CWI in modern active layers.
Applying the CWI, the aim of this study is to decipher the Yedoma depositional environment and the post-depositional processes involved at the Duvanny Yar Yedoma stratotype by determining the role of cryogenic weathering in the formation of Yedoma deposits and the cover layers.
Study Area
We studied the Yedoma deposit stratotype in northeastern Siberia, the Duvanny Yar exposure. In addition, samples of the modern active layer, collected in various landscapes and geomorphological conditions, were included as benchmarks for assessing the impact of cryogenic weathering on the mineral distribution in the grain size fractions of the deposits.
The Kolyma lowland’s relief is dominated by low hills (50–100 m above sea level [asl], Figure 1). This coastal lowland deposits show widespread degradation by thermokarst processes. Polygons, frost cracks, pingos, thermokarst lakes, alases, and baidzerakhs (called thermokarst mounds, the inter-wedge sediment remnants left after ice wedges melt; Figure 2) are evidence of widespread cryogenic processes and warming-caused permafrost degradation.
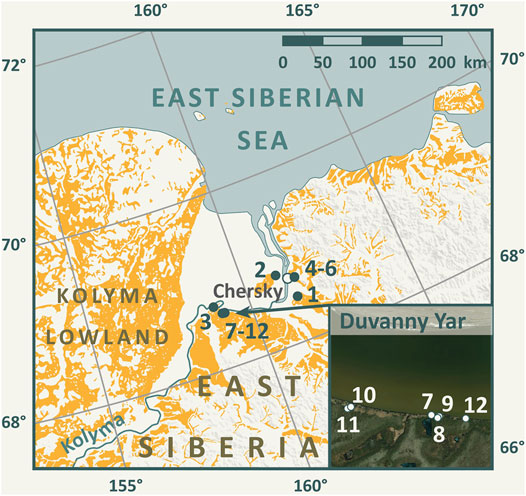
FIGURE 1. Location of the study sites. The yellowish background is part of the Yedoma map (Strauss et al., 2021), where ice rich Yedoma occurrence is likely. Numbers show the locations of (1) Malchikovskaya channel, (2) Lake Akhmelo, (3) Mouth of the Omolon River, (4–6) Mount Rodinka and (7–12) the Duvanny Yar exposure. 7–12 are shown as a close up in the inset on the lower right.
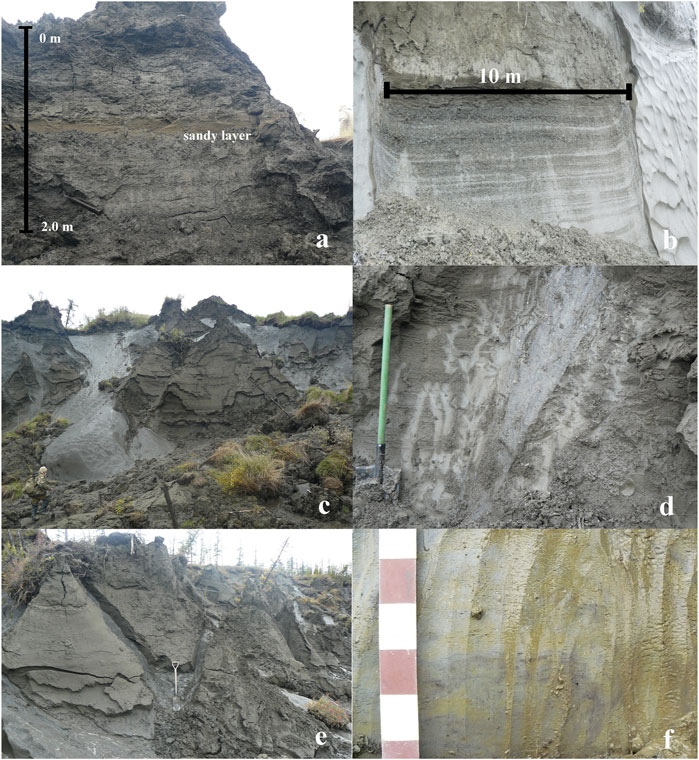
FIGURE 2. Cryolithological features of the Duvanny Yar exposure. (A)–sandy layer at 8–10 m above the Kolyma level, Unit A; (B)–low-center polygon deposit, Unit A; (C)–the exterior of Unit B; (D)–mineral part of Unit B; (E)–baidzerakh and ice wedges, Unit B; (F)–organic inclusions and cryoturbation traces, Unit C.
We collected the samples for our study at the Duvanny Yar site, a permafrost outcrop on the right bank of the Kolyma River. The site was first described by Barandova (1957) and Biske (1957), and subsequently investigated by several researchers (Sher, 1971; Strauss, 2010; Wetterich et al., 2014). The left bank of the Kolyma river beside Duvanny Yar site is presented by late Pleistocene 15–20 m above river level (arl) terrace called Alyoshkina Zaimka (Sher et al., 1979; Murton et al., 2015). This surface is covered by poorly silty sand with ice-less cryostructures.
The exposure is located within a typical Yedoma landscape. The outcrop is about 9 km long and up to 55 m high. Seven gentle Yedoma hills of late Pleistocene ice-rich silty sediment (Figure 2) and four drained Holocene thermokarst lakes (alas depressions) were distinguished by Sher et al. (1979). Four stratigraphic units were identified (Figure 3) by Sher et al. (1979). The first unit is described as interglacial lacustrine silts with ice-wedge casts at the river level, which deposited in middle Pleistocene. Peat sediments represent a second unit from the middle Pleistocene/beginning of late Pleistocene. The third unit is associated with late Pleistocene Yedoma deposits. The top of the exposure is composed of a Holocene cover layer.
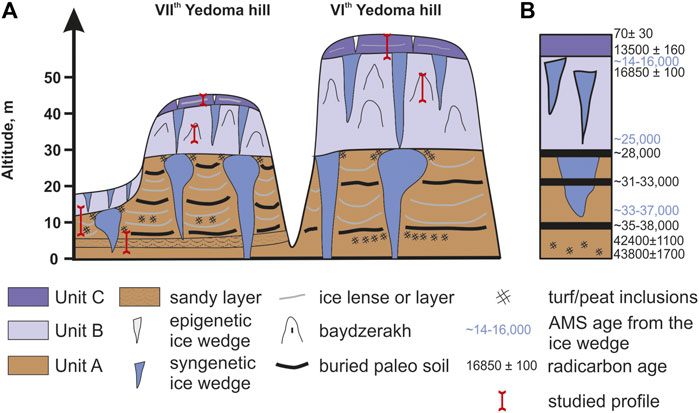
FIGURE 3. Scheme of the Duvanny Yar exposure. The VIth and the VIIth Yedoma hill correspond to previously described exposures (Sher et al., 1979). (A)–geological cross-section. (B)–review of Duvanny Yar deposit dating.
The deposits of the Duvanny Yar exposure were studied previously by other researchers, which allow us to link the units by absolute (radiocarbon) age. In the lower part (12 m arl) of VIth Yedoma hills a buried peat layer up to 1.5 m thick is found with a radiocarbon age of 42,000–44,000 yrs BP (Zanina et al., 2011; Gubin and Zanina, 2013). The peat is overlaid by a sandy layer (Unit A). Three paleo soil horizons are found in Unit A (MIS-3 deposits) and located at 1–1,5 m arl, 18–28 m arl and 30–32 m arl. Radiocarbon age are within range of 38,000–28,000 yrs BP; the oldest paleo soil is similar to the age from the Yedoma ice wedges (ca 33,000–37,000 yrs BP), and the youngest paleo soil corresponds to the MIS-3 termination (28,000 yr BP) (Gubin and Zanina, 2013; Wetterich et al., 2014).
The age referencing within Unit B is most difficult. Unit B accumulation is expected to have begun at 28,000 yrs BP (Zanina et al., 2011). The younger 14C and optically stimulated luminescence (OSL)-obtained dates of Yedoma from the Duvanny Yar exposure usually vary from 17,000 to 22,000 yrs BP (Kaplina, 2009; Zanina et al., 2011; Murton et al., 2015). All ice samples from upper ice wedges show ages younger than 25,000 yrs BP; the youngest dates are 14–16,000 yrs BP (Vasil’chuk, 2005; Vasil’chuk, 2013).
The Holocene cover layer (Unit C) is 13,500 ± 160 yrs BP, as dated from the paleo soil at the Yedoma top, and 13,080 ± 160 14C BP as dated from soil about 51 m arl (Gubin, 1999; Zanina et al., 2011). The youngest 14C dates from near-surface silt vary from 840 ± 40 to 70 ± 30 14C BP (Murton et al., 2015).
Methods
We studied the composition (mineralogy, grain size, morphology) and structure of cryogenic silt and clay using the abovementioned sample material.
Sampling
Fieldwork was conducted at the Duvanny Yar site during summer 2013 on the Yedoma hills called the VIth hill (N 68.62998, E 159.13582) and the VIIth hill (N 68.62732, E 159.19460) (Sher et al., 1979) (Figure 1, Supplementary Figure S3). During our field season, the lower part of the exposure was under water. We described the cryolithological structures of the exposure and collected 36 sediment samples by hammer and axe. For a same depth, some samples were taken close to the ice wedge, and some further within the mineral part. We transferred the air-dried samples to our laboratories for further analysis.
In addition, 14 samples of the modern active layer were collected in various landscapes and geomorphological conditions at the following sites: Malchikovskaya channel (Kolyma floodplain, active layer depth (ALD), ALD up to 60 cm), lake Akhmelo (sandy forest-tundra, Khallercha level, ALD up to 110 cm), the mouth of the Omolon (Yedoma hill, ALD 30–40 cm), the slope of the Rodinka mountain (larch forest). The annual number of freeze-thaw cycles are 14–15 for all sites (Shmelev et al., 2015, Supplementary Table S3). Samples were collected from various depths of the active layer in the August–September period. On the Rodinka mountain slope, samples were collected from a depth of 10 cm at the top of the mountain, in the middle part of the slope and at the foot of the mountain in order to evaluate the change in the mineral distribution in sediment during denudation.
Mineral Composition and Heavy Mineral Distribution
Sediment samples (n = 38) were sieved to separate the 10–50 μm and 51–100 μm fractions. Following Schwamborn et al. (2012), Schwamborn et al. (2014) the mineral compositions in the 10–50 μm and 51–100 μm grain-size fractions were determined by X-ray phase analysis with a Dron-3M (Shlykov, 1991).
We separated heavy and light mineral fractions in a centrifuge using a heavy liquid (bromoform, CHBr3 with a density of 2.89 g/cm3). Based on the data obtained, the coefficient of heavy residue (CHR) was calculated as a function of the heavy residue of minerals in the 10–50 μm (HM1) and 51–100 μm (HM2) grain-size fractions (Konishchev, 1981).
This coefficient shows the role of sediment sorting during sedimentation. The greater the transport capacity during deposition (high-energy conditions), the greater the CHR values and the grain size. Lower CHR values reflect decreasing transport capacity (Konischev, 1981; see Supplementary Figure S3).
The mineral composition and the CHR were determined on the samples from Duvanny Yar (n = 36) and on the samples of modern active layer (n = 5).
Grain-Size Parameters
The grain-size distribution (GSD) was determined on the samples from Duvanny Yar (n = 50) by a “Mastersizer 3000” Laser Particle Sizer (Malvern Instruments). Following the procedure described in Strauss et al. (2012), and in order to measure only mineral grains and to disaggregate the sample, organic components were removed by adding hydrogen peroxide (H2O2). The organic-free samples were diluted and washed to neutral pH values by centrifugation. The resulting GSD comprises 101 grain-size classes. We used GSD results to calculate grain-size parameters (mean diameter and sorting) used for the lithostratigraphical classification. GSD parameters were calculated after Folk and Ward (1957) using the Gradistat software (Blott and Pye, 2001).
Grain Morphology
The morphology of 100–250 μm particles was studied on the samples from Duvanny Yar (n = 24) with a Tesla Scanning Electron Microscope (SEM). We studied 30 to 40 mineral grains in each sample. The mineral grains and aggregates consisting of mineral and organic particles were studied. Individually, the roundness of quartz grains was assessed using a five-number scale according to Khabakov (1933) (Table 1), i.e., well correlated to a classical scheme by Krumbein (1941) (Table 1).
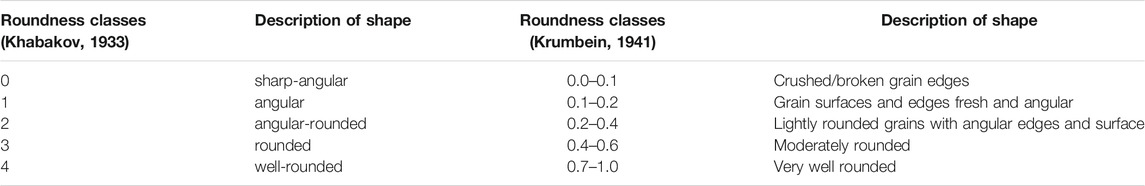
TABLE 1. Classification of grain roundness according to Khabakov (1933) and according to Krumbein (1941).
For grain-shape quantification (roundness), we used average and most-frequently-encountered (mode) values on a scale ranging from 0 to 4. The morphological features of grain shapes (relief and shape of grain edges) were described and classified according to Mahaney (2002) and Woronko and Pisarska-Jamroży (2016). The grain relief is the contrast between a mineral and its surroundings due to difference in refractive index, and classified as low, medium or high (Mahaney, 2002; Vos et al., 2014). Low relief is recognized as surfaces being smooth with near to no topographic irregularities while medium relief indicates a surface being affected by collisions or weathering processes (diagenetic environments) resulting in a somewhat irregular surface. High relief is recognized on a grain with a highly irregular surface, which mostly belongs in a glacial environment where glacial grinding and crushing has affected the grains. According to Konishchev and Rogov (1993) the 101–250 μm grain-size fraction is determined as the fraction that is most actively processed by cryogenic destruction of minerals, especially when looking at quartz and feldspar. We studied this fraction in detail for identification of signals and evidences of cryogenic weathering at sedimentation and freezing of deposits.
Cryogenic Weathering Index
The grain-size fractions determined in Mineral Composition and Heavy Mineral Distribution are used to calculate the cryogenic weathering index (CWI) (Konishchev, 1981). Using the CWI it is possible to quantify the intensity of cryogenic sediment transformation. We calculate the CWI as follows (Eq. 2):
where Q1 and F1 are the quartz and feldspar contents in the 10–50 μm fraction (in %) and Q2 and F2 represent the quartz and feldspar contents in the 51–100 μm size fraction. CWI values > 1 indicate active cryogenic weathering during sedimentation. The greater the value, the more cryogenic weathering during sedimentation has occurred. CWI values < 1 indicate a low influence of cryogenic weathering. The CWI was determined on the samples from Duvanny Yar (n = 24) and on the samples of modern active layer (n = 14).
Results
Mineral Composition, Grain Size Distribution and Cryogenic Weathering Index in Modern Active Layer Samples
For the Lake Akhmelo site (Figure 1, no. 2), the highest CWI values are typical in the upper 20 cm (up to CWI of 1.4), whereas in the lower part of the section the CWI decreases to 0.5 (Figure 4). This reflects the most favorable conditions for cryogenesis in the upper part of the active layer (the greatest number of transitions through 0°C and highest temperature amplitudes). At the same time, the granulometric composition is almost unchanged throughout the entire active layer; the mean grain size varies in the region of 50–150 µm. The particle distribution is monomodal (Figure 5). In samples with high CWI values, quartz accumulates in a finer fraction (silt), whereas in samples with low CWI quartz accumulates in fractions of fine sand. The mineral particles are characterized by clean surfaces with fresh cracks (Figure 6A). Besides the sample in 50 cm depth (moderately sorted), all samples are poorly sorted.
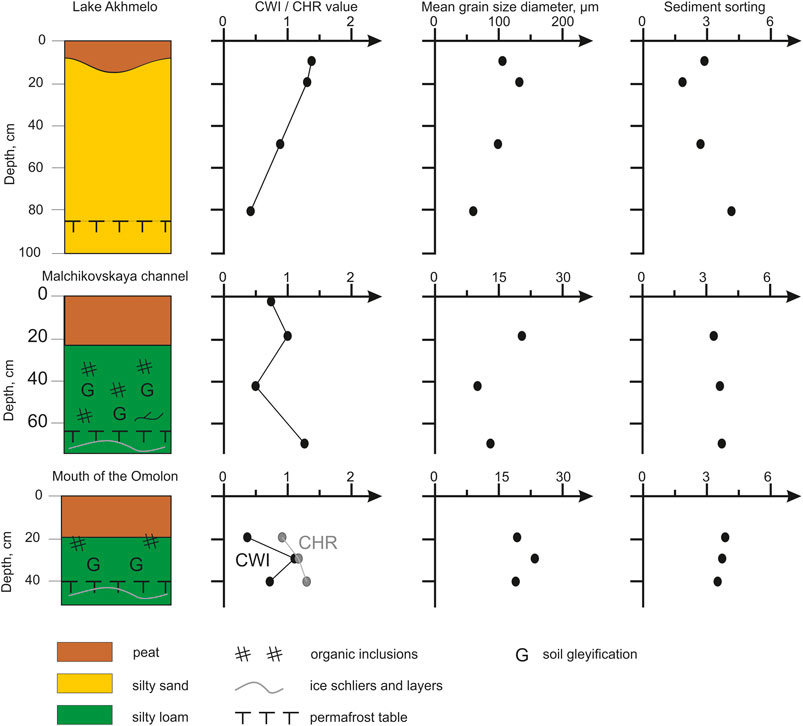
FIGURE 4. Sediment parameters analysis of the active layer sediments. CWI = cryogenic weathering index; CHR = coefficient of heavy residue. Please note that the mean grain size axis for Lake Akhmelo is different from the others.
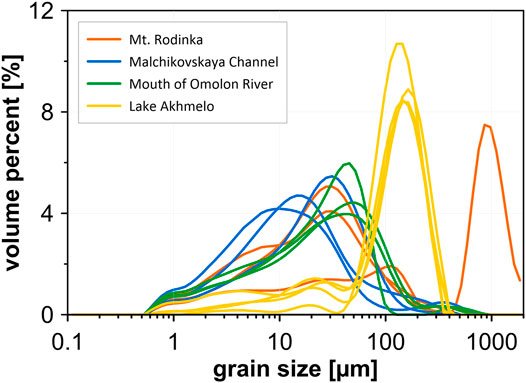
FIGURE 5. Grain size distribution of the active layer sediments.
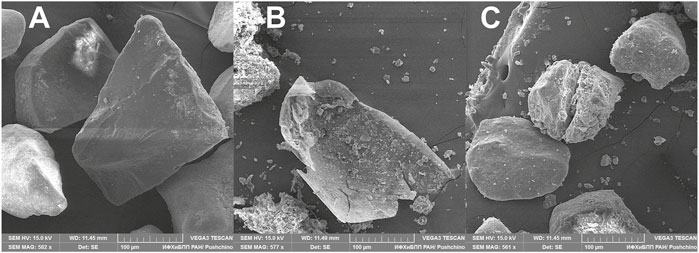
FIGURE 6. Grain morphology images from a raster electron microscope on the active layer sediments. (A)–fresh quartz surface (Lake Akhmelo, depth 20 cm); (B)–disintegration of cryogenic aggregate (Malchikovskaya channel, depth 10 cm); (C)–disintegration of quartz grain (mouth of the Omolon River, depth 20 cm).
We studied the processes of cryogenic transformation of mineral particles in the conditions of active modern sedimentation at the Kolyma floodplain (Malchikovskaya channel site, Figure 1, no. 1). Here, the CWI values vary from 0.5 to 1.2 (Figure 4), and there is a clear relationship with the grain composition of the sediments. Cryogenic values (CWI—1.0–1.2) are associated with fine sediments in the silt fraction. Here, non-cryogenic revealing values (CWI values 0.5–0.7) are associated with coarse sediments–sand with organic inclusions and loam. The particle distribution is unimodal with a peak per fraction of 0.001–0.01 mm and 0.01–0.1 mm (Figure 5). The surface of the mineral particles is covered by aggregates (smaller particles and organic residues). These aggregates are cut by cracks into separate parts (Figure 6B).
At the mouth of the Omolon site (Figure 1, no. 3), the thickness of the active layer at the time of the study was 40 cm. Upper 20 cm of active layer is presented by water-saturated turf and moss layer. The CWI values vary in a large range from 0.4 to 1.1 by only 20 cm (Figure 4). The particle distribution is unimodal with a peak per fraction of 0.001–0.01 mm and 0.01–0.1 mm (Figure 5). There are both particles covered by aggregates (like as Malchikovskaya channel site), and particles with clean and fresh surfaces. Some quartz grains are broken in half (Figure 6C).
We studied the influence of denudation and slope processes on cryogenesis on the northwestern slope of the Mt Rodinka (Figure 1, no. 4–6). The granulometric features and CHR indicates a lateral transportation from the top to the foothill. The CHR values increase from the top of the Mt. Rodinka (CHR = 1.13), where the source rock is destroyed through the middle part of the slope (CHR = 1.62) to the bottom of the slope, where the maximum is reached (CHR = 2.76). The mean grain size also decreases from the top (196.6 µm) to the bottom (19.6 µm). The CWI values change very much: 0.6 at the top, 1.6 in the middle part of the slope, 0.5 at the bottom of the slope. Thus, the active lateral transportation of the sediment interferes with the cryogenic processing of the substance in the active layer. The particle distribution is unimodal (Figure 5).
Grain Size Distribution of the Duvanny Yar Exposure
Analyses of GSD show homogeneous composition (Figure 7). Unit A, Unit B, and Unit C are composed of very fine sand or very coarse silt sediments. All samples are characterized by a main peak between 20 and 60 µm and a secondary peak in the 4–8 µm range. Some samples (mainly from Unit C) have a small peak in the fine and middle sand fraction (200–600 µm). The mean grain-size diameter and standard deviation is 25.3 ± 7 µm. The sediments are poorly to very-poorly sorted with a mean sorting degree after Falk and Ward (1957) of 3.0 ± 0.5 (Figure 8). Unit B exhibits coarser grain sizes than the other two units (mean diameter is 29.9 for Unit B, 21.4 for Unit A, and 20.8 µm for Unit C), Unit C is better sorted (3.6 ± 0.5).
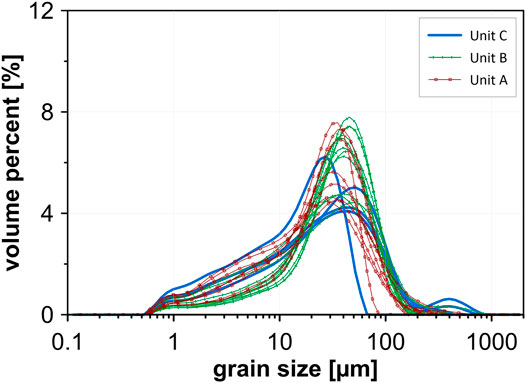
FIGURE 7. Grain size distribution on the Duvanny Yar sediments. Unit A and Unit B–late Pleistocene Yedoma, Unit C–Holocene Cover Layer.
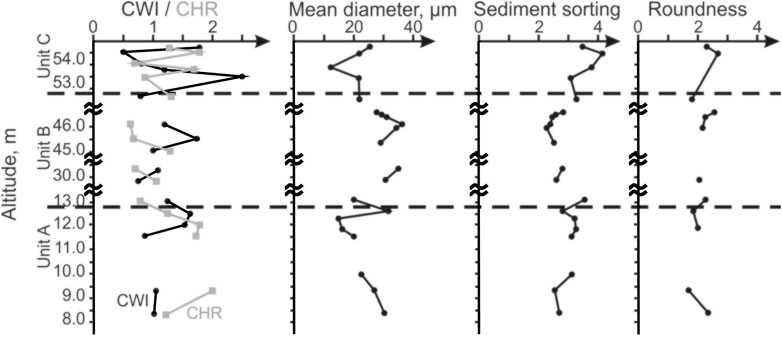
FIGURE 8. Sediment parameters analysis on the Duvanny Yar sediments: CHR = coefficient of heavy residue; CWI = cryogenic weathering index. Unit A and Unit B–late Pleistocene Yedoma, Unit C–Holocene Cover Layer.
Cryolithological Structure of the Duvanny Yar Exposure
In this section we follow our cryostratigraphic classification of two different Yedoma facies and the Holocene cover layer. These units are marked as Unit A, Unit B, and Unit C, respectively (Figure 3). Unit A is located in the lower part of the exposure from 5 to 25 m asl. The layer is characterized by thick ice wedges with a visible width of 5–8 m and distances between the wedges 10–15 m. The uppermost parts of the wedges are penetrated by wedge tails from the overlaying Unit B. The ice of the lower wedges is dark-grey and muddy with vertical foliation and layers less than 1–2 cm wide.
Unit A involves at least two distinct sediment facies. The first type is dominated by a sandy layer, which extends across the exposure at 8–10 m arl (Figure 2A). This layer is a yellow and dark-yellow, silty fine sand with inclusions of bluish-grey silt. The lower part consists of 2–5 cm thick ice-rich layers. The thickness of this sand varies from 1 to 2 m. The sandy layer is a marking horizon of the Duvanny Yar exposure (Sher, 1971; Vasil’chuk, 2005; Gubin and Zanina, 2013).
The second sampled Unit A sediment facies consists of dark-brown and black ice- and organic-rich silts with peat layers and buried soils. This includes 5–8 m thick ice wedges. The heads of the ice wedges are surrounded by lightly-decomposed brown peat containing wood and roots. These sediments are similar to modern deposits formed in centers of low-center polygons of boggy polygonal tundra (Figure 2B). The cryostructure includes up to 2–5 cm thick horizontal ice lenses, and micro-lenticular and non-visible (called structureless) cryostructures between the ice lenses. The distance between these layers is 40–60 cm. In the lower part (at 11–13 m arl) the organic layer is 30–40 cm thick. Unit A is overlain by Unit B silts, while ice-wedge roots of Unit B penetrate into the underlying deposits.
Unit B is located in the high parts of the studied Yedoma hills above Unit A (Figure 3). We observed the most characteristic Unit B outcrops in the central parts of the studied Yedoma hills in thermocirques (Figure 2C). Unit B is different from Unit A by thinner (1–2 m width) ice wedges located closer to each other (3–5 m) than in Unit A. The ice wedges are dark grey and contain sediment inclusions, gas bubbles, and vertical foliation. The uppermost parts of the ice wedges are penetrated by very thin (0.5–3 cm thick) milky-colored ice wedges. At the boundary between ice wedges, inclined, 1–3 cm wide ice lenses are present in the sediment. Moreover, the mineral component of Unit B is composed of homogeneously grey and dark-grey silts with structureless and lenticular cryostructures and rootlets up to 10 cm long (Figure 2D). Organic layers 30–50 cm thick composed of roots and peat inclusions occur. Sparse anoxic soil environments are indicated by blue vivianite spots. Unit B is significantly influenced by thermokarst and thermoerosion processes and its outcrops are within thermocirques 500–1,000 m wide and 20–30 m deep. In fact, this is the area where baidzerakhs are present (Figure 2E). The mean baidzerakh size is 5–10 m high and up to 20–30 m wide at the base. Sporadically, the baidzerakh contain leftover parts of ice wedges.
Unit C is located on top of the Yedoma remains and overlies Unit B (Figure 3). Unit C was formed in the early Holocene as the result of deep thawing and subsequent re-freezing of the upper Yedoma deposits. The main difference between Unit C and alas deposits is that the thawing did not lead to ice wedge degradation and lake formation; therefore, the repeated freezing of water-saturated deposits formed an ice-rich permafrost layer called a transient or protective layer. Unit C contains thin milky-colored ice wedges ∼0.5–1.0 m thick and is overlain by the 0.5–1.0 m thick modern active layer and soil. Ice wedges from Unit C sometimes penetrate the top of Unit B wedges. The organic peat inclusions and traces of cryoturbation occur at the bottom (Figure 2F).
The sediment composition of Unit C is similar to that of Unit B because it consists of reworked former Yedoma deposits. The main feature of Unit C is its cryostructural diversity, including the whole variety from structureless to crystal and suspended and pure ice layers.
Mineral Composition and Heavy Mineral Distribution of the Duvanny Yar Exposure
The mineral composition of the Duvanny Yar deposit can be characterized as homogeneous for all units of the exposure (Table 2). The heavy mineral fraction includes pyroxene, hornblende, pyrope, pyrite, magnetite, and individual grains of apatite, goethite, and siderite. The heavy mineral concentration is low and varies from 1.3 to 8.5%. The main light minerals are quartz (up to 50% of grains), feldspars, illite, chlorite and clay minerals (mainly smectite), dolomite, and calcite (occasionally). In one sample (sandy layer of Unit A) kaolinite was present. The sandy layer CHR values are >1.0. Within Unit A, the CHR varies between 1.25 and 2.71. The CHR values decrease toward the top of Unit A with the maximum values adjacent to ice wedges. At the final stage the wedges were covered by peat layers.
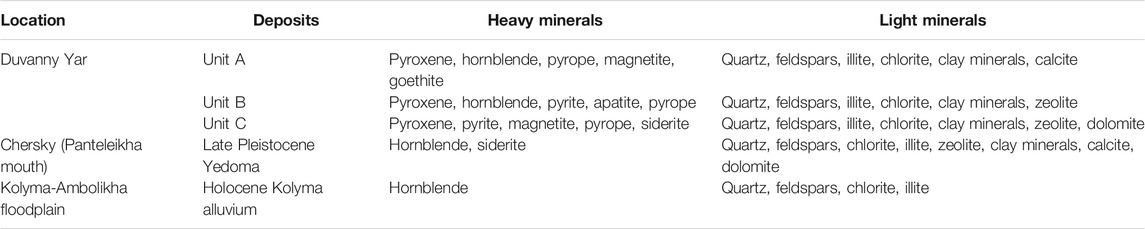
TABLE 2. Mineral composition in 10–100 µm grain size classes of Duvanny Yar sediments (this study) and comparison to Kolyma alluvium and Chersky Yedoma deposits (Shmelev et al., 2013).
The Unit B CHR values range from 0.69 to 1.84 (Figure 8). Similar to Unit A, the Unit B maximum values are located adjacent to ice wedges, where they can reach 1.70–1.84. The CHR values of the mineral layer are low at 0.69–1.04.
Grain Morphology of the Duvanny Yar Exposure
In Unit A extended angular rounded shapes (slightly rounded grains with angular edges and surface) with matte surface dominate; mean rounded degree values are 2.16 for the sandy layer and 2.00 for samples from a low center polygon (Figure 2B). The mode value for Unit A is 2. The grains are characterized by high relief in sand deposits and medium relief in ice-rich silts. Fresh conchoidal surfaces with concentric ripples like a shell (Figure 9A) with high-frequency and radial fractures and craters (Figure 9G) have been observed. Often we were able to identify the point of origin of grain destruction. The grain edge is mostly sharp and jagged (Figure 9B), but nodular edges are ovserved also (Figure 9H).
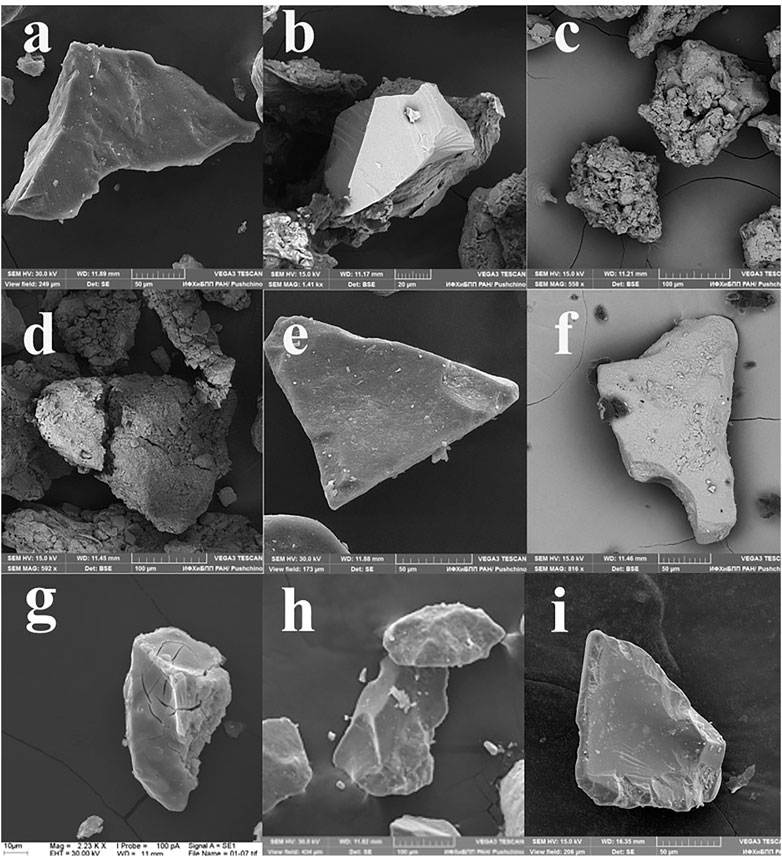
FIGURE 9. Grain morphology images from a raster electron microscope on the Duvanny Yar sediments. (A)–fresh surface; (B)–sharp, coarse grain edge; (C)–cryogenic aggregate; (D)–obvious crack; (E)–fresh surface; (F)–nodular edge; (G)–radial fractures on quarts grain; (H)–fresh surface with nodular edge; (I)–fresh conchoidal surface with shell fracture.
Unit B is characterized by more rounded grain shapes with a mean rounded degree value up to 2.45. Here, the mode value is 3. The grain relief in Unit B is low to medium. Fresh or weathered surfaces are absent and significant parts of grains are covered by aggregates in the form of adhering particles. Such a formation is called a “cryogenic aggregate” (Rogov, 2000) (Figure 9C). Big cracks crossing the grains and rounded edges have been identified (Figure 9D).
In Unit C the weathering evidence is more clearly developed. The grain shape varies within a broad range; the degree of rounding reaches up to 2.57 with a mode value of 3 between ice lenses. The mean value for Unit C is 1.85, with a mode value of 2. The grain shapes are more elongated than in Unit A. The grain morphology can be characterized by low and medium relief, fresh surfaces (Figure 9E), nodular (Figure 9F), high-frequency fractures and shell edges (Figure 9I). Table 3 presents the results of the grain morphology studies.
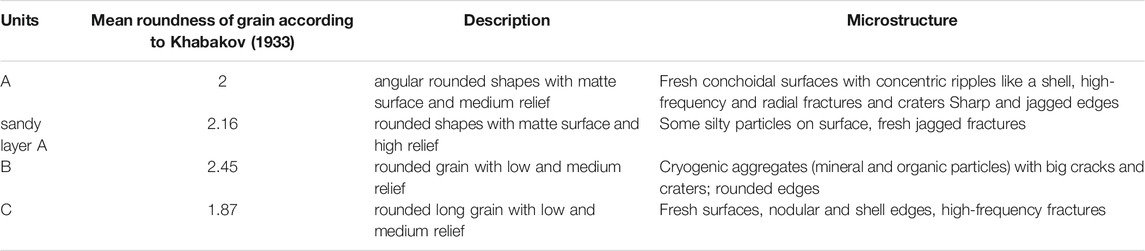
TABLE 3. Roundness and microstructures of the Duvanny Yar samples.
Cryogenic Weathering Index Distribution of the Duvanny Yar Exposure
In the Unit A sediment column we observe CWI values increasing from 0.88 to 1.55, with maximum values in the upper part. The CWI values from sediments collected at a boundary with ice wedges (at a 20–30 cm distance from them) are lower (0.77–1.11) compared to samples at the same height but further away from the wedge. In the center of the mineral part, the CWI values increase towards the top. Moreover, CWI values are positively correlated with the visible ice contents. In Unit B, at a height of 1 m above the boundary with Unit A, the CWI value is 1.32 in the mineral part and 0.78 same depth, but close to the ice wedges (Supplementary Figure S1).
The sandy layer of Unit A (Figure 8) is characterized by low CWI values between 0.98 and 1.01, suggesting a weaker influence of cryogenic weathering. Mean Unit A CWI values are 1.10 ± 0.3 (n = 7).
The lithological and cryostructural Unit B features are homogeneous, but the CWI values vary across a wide range between 0.66 and 1.70. The maximum CWI value in Unit B occurs near the ice wedges. Adjacent sediment samples show low CWI values that do not exceed 1.10. The mean Unit B CWI value is 1.05 ± 0.5 (n = 10) (Figure 8).
Unit C is composed similar to the upper layer of the Yedoma exposure (Unit B), which thawed, subsided, and re-froze during the Holocene. Despite the lithological affinity, the CWI values of this Holocene cover layer (Unit C) are significantly higher than in the underlying deposits and reach the overall maximum here. Thus, in ice-free layers CWI values can range between 1.88–2.51, while in layers with pure ice and suspended cryostructures the CWI decreases to 0.52–0.84. The CWI values in the lower active layer range from 1.00 to 1.77. Remarkably, the uppermost Unit B sediments (at 45–50 m arl) show CWI values of 0.65 (Figure 8). This variation happens over short distances (2–3 m). The mean Unit C CWI value is 1.29 ± 0.5 (n = 7).
Discussion
Deciphering Accumulation and Post-deposition Process Using Cryogenic Weathering Index of Modern Active Layer
The analysis of samples of the modern active layer allowed us to determine the main features of cryogenic weathering during sedimentation. A first driver of CWI in the active layer is a gradual decrease of the CWI values with depth at stable surfaces that were deposited outside the cryogenic impact, like in subaquatic environments. The most favorable temperature conditions for cryogenic weathering are great temperature amplitudes and number of temperature cycles through 0°C (Shmelev, 2015; see Supplementary Table S2). These are observed in the upper near-surface layer, where sediment is transformed (Lake Akhmelo; Figure 4).
A second driver of CWI are the dependence of cryogenic processing and CWI values with the sedimentation rate. The cryogenic weathering is most active at significant temperature amplitudes and a large number of transitions after 0°C. According to the analysis of the active layer’s temperature regime, the most favorable temperature conditions are in the near-surface layer (Shmelev, 2015; see Supplementary Table S2). Thus, the sedimentation rate will influence on the cryogenic weathering. The faster sediments are deposited on top of the old surface (sedimentation), the faster the deeper sediment will leave the near-surface zone. At the same time, the stabilization of the surface or even its partial washout because of erosion processes will increase the time of the sediment in conditions favorable for cryogenic weathering, which will lead to increase of CWI values. For the Malchikovskaya Channel and the mouth of the Omolon River, we found the CWI values to be higher for sediments with bigger mean grain size. We explain this by the cycles of rapid sedimentation. Rapid sedimentation leads to the burial of the near-surface layer, because of which the sediment leaves the favorable conditions for cryogenic weathering. At loctions with good temperature insulation, like by thick moss cover, peat layers or water saturation, this significantly impedes cryogenic weathering due dampened temperature amplitudes.
An important feature of the grain-size composition of active layer samples is their multimodal distribution. Such a distribution may be the result of cryogenic weathering, which leads to the formation of a secondary peak in the grain size composition associated with the silty fraction. Our analysis of the mineral composition of samples from the Malchikovskaya Channel revealed that the content of feldspars by grain size fractions (100–51 microns and 50–10 microns) does not change severely, but in cryogenic samples (CWI >1) the quartz particles are more in the silt fraction. Of course a silt peak can have more than one explanation, and likely is the sum of different processes (like multiple transport cycles/dynamics, hydrodynamic sorting and more). But also quartz weathering likely contributed to the formation of a secondary peak in the grain size distribution.
We want to note that during transport in a fluvial environment, especially when mixed-grain sediment is transported, intense abrasion and production of silt fractions takes place. But quartz is more resistant to mechanical destruction than feldspar. At intense abrasion, feldspar should mainly be destroyed and accumulate in a finer fraction, and we expect quartz to be increased (relatively) in a coarser fraction. However, the higher CWI values mean that more quartz concentrate in the fine grain-size fractions, feldspars concentrate in the coarser fraction. That is why high CWI values indicate the dominant role of cryogenic weathering.
On the slope of Mt. Rodinka, the same mineralogical composition and distribution of minerals by grain fractions are established. The CWI values increase downhill with 0.6 at the top and 1.6 at the middle part of slope. At the same time, cryoturbation processes lead to mixing of sediments and smoothing of the results of the cryogenic weathering leading to a CWI of 0.5 at the bottom of the slope. As we applied a transect sampling (up, middle, down the slope) we were not able to include a profile sketch and diagram on Figure 4.
Deciphering Accumulation and Post-deposition Process Using Cryogenic Weathering Index of Unit A
A comparison of the mineral composition of the Duvanny Yar deposits to modern alluvial deposits and Yedoma deposits located in the lower streams of the Kolyma River (at Chersky location) (Shmelev et al., 2013) shows obvious differences. In the Duvanny Yar exposure, pyrope, pyrite, magnetite, goethite, and siderite are present, while in the Yedoma deposits at Chersky these minerals are absent (except siderite). The composition of the light minerals is also different: chlorite is more abundant than hydromica illite in the alluvial deposits of the lower streams of the Kolyma River, while clay minerals are more abundant in the Yedoma deposits of Duvanny Yar (Table 2) (Shmelev et al., 2013). Based on this we show a different mineralogical provenance, meaning a different source of Duvanny Yar Yedoma deposit sediments compared to the middle and lower Kolyma River Yedoma. Moreover, looking at the mineral composition of the Duvanny Yar Yedoma deposits, a homogeneous mineralogical composition indicates a constant source of sediments for the entire late Pleistocene to Holocene period. The warm interstadial MIS-3, exposed in Unit A of Duvanny Yar, shows warm and wet conditions [changing to more dry and aerial signals during MIS-2 (Kaplina, 2011; Zanina et al., 2011; Murton et al., 2015)]. Higher CHR values and good roundness, reflected by increasing mean grain-size diameter (Figure 8), indicate that the lower sand layer in ice-rich silts under buried soil was deposited by highly energetic processes under warmer permafrost conditions. Strauss et al. (2012) offer an explanation associated with increased stream velocity during a period of flooding. In the “low-center polygon” setting of Unit A the gradual drying of the polygon was accompanied by the development of cryogenic weathering and permafrost conditions. During this time, the permafrost conditions around frost cracks were warmer including deep seasonal thawing and higher ground temperatures.
The above-mentioned warmer conditions are revealed by lower CWI values here than in the center of the mineral part. We suggest that this is caused by seasonally percolating and flowing water in the active layer. According to Vasil’chuk, (2005), Vasil’chuk, (2013) ice-wedge development during long periods of subaerial bog-floodplain sedimentation was interrupted by subaqueous conditions. The fine mean grain-size diameter and good sediment sorting reveal sedimentation in subaquatic conditions (like alluvial floodplain deposition). Evidence for these conditions is found in the Unit A CHR distribution. Here, the maximum CHR values occur close to the ice wedges (Supplementary Figure S1); this could be caused by the influence of flowing water (high-energy conditions). On the vertical scale, slow drying of the low-center polygon is confirmed by 1) decreasing ice contents and cryostructure changes from suspended, thick layers to structureless, thin lenses, 2) increasing CWI values, and 3) decreasing CHR values towards the top of the stratigraphic boundary between Unit A and Unit B (reduction of transporting energy, sedimentation in “calm” conditions: shallow drying lakes and puddles, may be a signal of aerial conditions and aeolian processes).
Thus, we hypothesize that Unit A accumulated under the impact of fluvial processes (according to grain shapes and GSD) under high-energy conditions, influenced by flowing water. This is consistent with the high ice content (visible ice content of 50–70%) and layered, reticulate, and crystal cryostructures, which are typical of wet conditions. Moreover, seasonal streams and creeks flowing above the top of the ice wedges caused periodic thermoerosion of the wedges. This comes with intensive cryogenic weathering (high CWI values). Generally, the depositional environment may be characterized as wet polygonal tundra and corresponds to proposed reconstructions for MIS-3 Yedoma (Zanina et al., 2011; Wetterich et al., 2014). It is possible that the natural conditions during the accumulation and freezing of Unit A were close to the modern ones observed at the Malchikovskaya channel site. Grain size is characterized mainly by a bimodal grain-size distribution, which can be caused by cryogenic weathering. At the same time, in general, the deposits are characterized by good sorting. This regularity of the grain size distribution is typical of all the studied Units at the Duvanny Yar.
Accumulation and Post-deposition Process Using Cryogenic Weathering Index of Unit B
The stratigraphic boundary between Unit A and Unit B is distinct, according to both cryogenic structures (dominance of ice-poor structures in Unit B) and lithology (change of sediment color). This is caused by the environmental shift after the MIS-3 termination to harsher stadial MIS-2 conditions at 28,000 yrs BP (Konishchev, 1983; Wetterich et al., 2014). The shift from warmer and wetter conditions (warm interstadial MIS-3) to dryer and cooler conditions (late MIS-3, MIS-2) (Zanina et al., 2011; Wetterich et al., 2014) corresponds to cryogenic weathering activation. This is nicely shown by the CWI peak at the boundary between Unit A and Unit B in our data. Based on our analyses we hypothesize that the Unit B accumulation was accompanied by drying of the interstadial landscape and the dominance of subaerial conditions (according to grain shapes, visible ice content, CHR distribution). The seasonal water in frost cracks above the ice wedges dried up, resulting in the freezing of sediments above the ice wedges. The maximum CWI values located close to the ice wedges support this (Supplementary Figure S1). Environmental drying caused an increased role of aeolian processes, which is also reflected by rising mean grain diameter, better sorting, and rounded grain morphologies. The lower CHR values reveal decreasing transport energy. We consider low CHR values (<1.0) to be a signal of dominating aeolian processes during deposition. Concerning the post-depositional change of the sediments, we explain the great variety of CWI values within the mineral part of Unit B as reflecting a period characterized by either a relatively high sedimentation rate. This causes a short exposure time in the paleo active layer resulting in a low rate of cryogenic weathering, or a low deposition rate and long residence time of the sediments in the active layer for active cryogenic weathering. We see the decreasing trend of coarse grains with low CWI values because of fast freezing. In general, the CHR decreases in Unit B likely reflect decreasing transport capacity during deposition.
We interpret the fraction >50 µm as a signal of aeolian input, and not a consequence of cryogenic destruction. A constraint on this interpretation is that this is only valid for the mineral part where low CWI values occur. For mineral layers closer to ground ice intensive, cryogenic weathering shown by high CWI values, complicates the interpretation of the grain-size curves.
Decreasing fluvial/alluvial signals correspond to a time around 14,000–15,000 yrs BP, when a terrace called the Alyoshkina terrace was deposited. This terrace was composed of sediments at a lower elevation than the Yedoma surface (15–20 m arl), underlain by relatively ice-poor silty sands. The Alyoshkina accumulated at the left bank of Kolyma River beside the Duvanny Yar exposure as an alluvial terrace, causing Kolyma channel migration during the MIS-2 period (Sher et al., 1979). This shows that alluvial or fluvial silty sands cannot have been simultaneously deposited at elevations of 15–20 m arl at the Alyoshkina terrace and at 50–100 m arl across the Omolon-Anyuy Yedoma plain (including Duvanny Yar) without extremely high river floods, at a time when the Kolyma River level was increasing at only a few meters per decade (Murton et al., 2015).
Accumulation and Post-deposition Process Using Cryogenic Weathering Index of Unit C
Unit C accumulated in the early Holocene during deep thawing and subsequent freezing of the Yedoma top, which formed in the LGM (19,000–14,000 yrs BP). The mineral part of Unit C originated from Unit B, but thawed and refroze during the Holocene. We explain the maximum CWI values by initially active cryogenic weathering of Yedoma deposits in the LGM and intensification of this weathering during Holocene thawing and re-freezing cycles. Finally, Yedoma accumulation was accompanied by the activation of aeolian processes.
The CWI values of near-surface silt samples (53–55 arl) correlates to visible ice content (high or low) and cryostructures (structureless-lensed-layered-suspended). Active-layer wetting led to gradual termination of aeolian sedimentation, because the grain size classes suitable for wind transport were protected by water and vegetation. In Unit C the CHR varies from 0.69 to 1.83, but there is no clear association with cryostructures or lithology.
Conclusion
Generally, the Cryogenic Weathering Index (CWI) seems to be a helpful tool in the toolbox for deciphering post-depositional processes in all freeze-thaw affected environments. Our data and literature data that, after being deposited polygenetically, sediments were affected by post-depositional processes dominated by cryogenic weathering. Holocene warming caused thawing of the upper Yedoma layers and re-deposition of these deposits, but also intensified cryogenesis due to more freeze thaw cycling.
The paleo-permafrost dynamics at Duvanny Yar accumulation is reflected in the CWI distribution. Two main peaks associated to cryogenic weathering activation links to environmental shift in MIS-3–MIS-2 boundary (change from wet to dry conditions) and in LGM (maximum climate cooling). The CWI distribution within selected Yedoma units depends from the ratio between sedimentation rate, sediment watering and soil cover (peat). The dependence of the CWI values from many factors is confirmed by the research of the modern active layer, then the CWI values wide varies within the active layer.
Data Availability Statement
The original contributions presented in the study are included in the article/Supplementary Material, further inquiries can be directed to the corresponding author.
Author Contributions
DS, MC and VR collected the data. DS and JS outlined the paper, SO and AM contributed with the other authors to the interpretation of the data. All authors contributed to the discussion of data and manuscript writing.
Funding
This investigation is part of the activities of the IPA Action Group “The Yedoma Region: A Synthesis of Circum-Arctic Distribution and Thickness”. Research has been supported by RFBR projects no. 16-35-00403 and 16-05-00612. JS was supported by the European Research Council (Starting Grant #338335) and the German Federal Ministry of Education and Research (BMBF, CACOON project, 03F0806A). SO and AM acknowledges support by the European Union’s Horizon 2020 research and innovation program (grant agreement No. 714617). SO acknowledges support from the “Fonds National de la Recherche Scientifique” (FNRS, Belgium, FC69480).
Conflict of Interest
The authors declare that the research was conducted in the absence of any commercial or financial relationships that could be construed as a potential conflict of interest.
Publisher’s Note
All claims expressed in this article are solely those of the authors and do not necessarily represent those of their affiliated organizations, or those of the publisher, the editors and the reviewers. Any product that may be evaluated in this article, or claim that may be made by its manufacturer, is not guaranteed or endorsed by the publisher.
Acknowledgments
In memory of V. N. Konishchev, who passed away in July 2020. His investigations of cryogenic weathering and consultations were the basis for this paper. We thank O. Zanina, A. Lupachev, S. Gubin, and S. Davydov for consultation during fieldwork and laboratory studies. Most labwork was done in the Geography faculty at Moscow State University and the Institute of Physicochemical and Biological Problems in Soil Science (Pushchino).
Supplementary Material
The Supplementary Material for this article can be found online at: https://www.frontiersin.org/articles/10.3389/feart.2021.727315/full#supplementary-material
References
Arkhangelov, A. A. (1977). “Underground Glaciation of the Kolyma Lowland,” in Problems of Cryolithology. Editor A. Popov (Moscow: Moscow State University), 26–57.
Barandova, Y. P. (1957). Geomorphological Sketch of the Eastern Part of the Kolyma Lowland. Mater. Geology. Resour. Northeast USSR (Magadan: Sevvostgeologiya), 208–222.
Biske, S. F. (1957).Quaternary Deposits of the Kolyma Lowlands Materials for Geology and Resources of Northeast USSR. Magadan: Sevvostgeologiya.
Blott, S. J., and Pye, K. (2001). GRADISTAT: A Grain Size Distribution and Statistics Package for the Analysis of Unconsolidated Sediments. Earth Surf. Process. Landforms 26, 1237–1248. doi:10.1002/esp.261
Folk, R. L., and Ward, W. C. (1957). Brazos River Bar [Texas]; a Study in the Significance of Grain Size Parameters. J. Sediment. Res. 27, 3–26. doi:10.1306/74d70646-2b21-11d7-8648000102c1865d
Grosse, G., Jones, B., and Arp, C. (2013). “8.21 Thermokarst Lakes, Drainage, and Drained Basins,” in Treatise in Geomorphology. Editor J. F. Shroder (San Diego: Academic Press), 325–353. doi:10.1016/b978-0-12-374739-6.00216-5
Gubin, S. V. (1999). Late Pleistocene Soil Formations in Loess-Ice Deposits of Northeast Eurasia. Abstract of doctor dissertation. Pushchino.
Gubin, S., and Zanina, O. (2013). Variation of Soil Cover during the Ice Complex deposit Formation, Kolyma Lowland (Part 1). Earth Cryosphere 17, 48–56.
Kanevskiy, M., Shur, Y., Fortier, D., Jorgenson, M. T., and Stephani, E. (2011). Cryostratigraphy of Late Pleistocene Syngenetic Permafrost (Yedoma) in Northern Alaska, Itkillik River Exposure. Quat. Res. 75, 584–596. doi:10.1016/j.yqres.2010.12.003
Kaplina, T. (2011). Northern Yakutia, Pleistocene, Ancient Ice Complex, Thermokarst, Ancient Alas Complex. The Earth’s Cryosphere 15, 3–13.
Katasonov, E. M. (2009). Litologiya Merzlykh Chetvertichnykh Otlozhenii (Kriolitologiya) Yanskoi Primorskoi Nizmennosti - (Lithology of Frozen Quaternary Deposits (Cryolithology) of the Yana Coastal Plain). Moscow: OAO PNIIIS.
Khabakov, A. (1933). Kratkaya Instruktsiya Dlya Polevogo Issledovaniya Konglomeratov (Short Instruction for the Field Study of Conglomerates). Moscow: Gos. nauchn.-technol. geologo-razvedochn. izdatelstvo.
Konishchev, V. N. (1983).Cryolithological Evidences of the Heterogeneous Structure of “Ice Complex” Deposits in the Dyvanny Yar Section Problems of Cryolithology. Moscow: MGU, 56–64.
Konishchev, V. N. (1981). Formirovanie Sostava Dispersnih Porod V Kriolitosfere [Formation of the Composition of Dispersed Rocks in the Cryolithosphere]. Novosibirsk: Nauka, 197.
Konishchev, V. N., and Rogov, V. V. (1993). Investigations of Cryogenic Weathering in Europe and Northern Asia. Permafrost Periglac. Process. 4, 49–64. doi:10.1002/ppp.3430040105
Konishchev, V. (2013). The Nature of Cyclic Structure of the Ice Complex, East Siberia. Geogr. Environ. Sustain. 6, 4–20. doi:10.24057/2071-9388-2013-6-3-4-20
Krumbein, W. C. (1941). Measurement and Geological Significance of Shape and Roundness of Sedimentary Particles. J. Sediment. Res. 11, 64–72. doi:10.1306/d42690f3-2b26-11d7-8648000102c1865d
Mahaney, W. C. (2002). Atlas of Sand Grain Surface Textures and Applications. USA: Oxford University Press.
Meyer, H., Opel, T., Laepple, T., Dereviagin, A. Y., Hoffmann, K., and Werner, M. (2015). Long-term winter Warming Trend in the Siberian Arctic during the Mid- to Late Holocene. Nat. Geosci 8, 122–125. doi:10.1038/Ngeo2349
Murton, J. B., Goslar, T., Edwards, M. E., Bateman, M. D., Danilov, P. P., Savvinov, G. N., et al. (2015). Palaeoenvironmental Interpretation of Yedoma Silt (Ice Complex) Deposition as Cold-Climate Loess, Duvanny Yar, Northeast Siberia. Permafrost Periglac. Process. 26, 208–288. doi:10.1002/ppp.1843
Obu, J., Westermann, S., Bartsch, A., Berdnikov, N., Christiansen, H. H., Dashtseren, A., et al. (2019). Northern Hemisphere Permafrost Map Based on TTOP Modelling for 2000-2016 at 1 Km2 Scale. Earth-Science Rev. 193, 299–316. doi:10.1016/j.earscirev.2019.04.023
Olefeldt, D., Goswami, S., Grosse, G., Hayes, D., Hugelius, G., Kuhry, P., et al. (2016). Circumpolar Distribution and Carbon Storage of Thermokarst Landscapes. Nat. Commun. 7, 13043. doi:10.1038/ncomms13043
Rogov, V. V. (2000). Specific Features of the Morphology of Skeletal Particles of Cryogenic Alluvium. The Earth’s Cryosphere 4, 67–73.
Schirrmeister, L., Dietze, E., Matthes, H., Grosse, G., Strauss, J., Laboor, S., et al. (2020). The Genesis of Yedoma Ice Complex Permafrost - Grain-Size Endmember Modeling Analysis from Siberia and Alaska. E&g Quat. Sci. J. 69, 33–53. doi:10.5194/egqsj-69-33-2020
Schirrmeister, L., Froese, D., Tumskoy, V., Grosse, G., and Wetterich, S. (2013). “PERMAFROST and PERIGLACIAL FEATURES | Yedoma: Late Pleistocene Ice-Rich Syngenetic Permafrost of Beringia,” in Encyclopedia of Quaternary Sciences. Editor S. A. Elias. 2 ed (Amsterdam: Elsevier), 542–552. doi:10.1016/b978-0-444-53643-3.00106-0
Schirrmeister, L., Kunitsky, V., Grosse, G., Wetterich, S., Meyer, H., Schwamborn, G., et al. (2011). Sedimentary Characteristics and Origin of the Late Pleistocene Ice Complex on north-east Siberian Arctic Coastal Lowlands and Islands - A Review. Quat. Int. 241, 3–25. doi:10.1016/j.quaint.2010.04.004
Schwamborn, G., Meyer, H., Schirrmeister, L., and Fedorov, G. (2014). Past Freeze and Thaw Cycling in the Margin of the El'gygytgyn Crater Deduced from a 141 M Long Permafrost Record. Clim. Past 10, 1109–1123. doi:10.5194/cp-10-1109-2014
Schwamborn, G., Schirrmeister, L., Frütsch, F., and Diekmann, B. (2012). Quartz Weathering in Freeze-Thaw Cycles: experiment and Application to the El'gygytgyn Crater lake Record for Tracing Siberian Permafrost History. Geografiska Annaler: Ser. A, Phys. Geogr. 94, 481–499. doi:10.1111/j.1468-0459.2012.00472.x
Sher, A. V., Kaplina, T. N., Giterman, R. E., Lozhkin, A. V., Arkhangelov, A. A., Kiselyov, S. V., et al. (1979). Late Cenozoic of the Kolyma Lowland 14th Pacific Science Congress: Academy of Science: Moscow: VINITI. 116.
Sher, A. V. (1971). Mammals and Stratigraphy of the Pleistocene of the Extreme Northeast of the USSR and North America. Moscow: Nauka.
Sher, A. V. (1997). “Yedoma as a Store of Paleoenvironmental Records in Beringia,” in Beringia Paleoenvironmental Workshop. Editors S. Elias, and J. Brigham-Grette, 140–144.
Shmelev, D., Kraev, G., Veremeeva, A., and Rivkina, E. (2013). Carbon Pool of Permafrost in north-eastern Yakutia. Earth's Cryophere 17, 50–59.
Shmelev, D. (2015). The Role of Cryogenesis in the Formation of Texture and Composition of Frozen Late Quaternary Deposits in Antarctic Oases and Northeast Yakutia. Earth's Cryophere 19, 37–52.
Strauss, J. (2010). Late Quaternary Environmental Dynamics at the Duvanny Yar Key Section, Lower Kolyma, East Siberia. Potsdam: University of Potsdam.
Strauss, J., Schirrmeister, L., Grosse, G., Fortier, D., Hugelius, G., Knoblauch, C., et al. (2017). Deep Yedoma Permafrost: A Synthesis of Depositional Characteristics and Carbon Vulnerability. Earth-Science Rev. 172, 75–86. doi:10.1016/j.earscirev.2017.07.007
Strauss, J., Schirrmeister, L., Wetterich, S., Borchers, A., and Davydov, S. P. (2012). Grain‐size Properties and Organic‐carbon Stock of Yedoma Ice Complex Permafrost from the Kolyma lowland, Northeastern Siberia. Glob. Biogeochem. Cycles 26, GB3003. doi:10.1029/2011GB004104
Tomirdiaro, S. V. (1980). Loess-ice Formations in East Siberia during the Late Pleistocene and Holocene. Moscow: Nauka Press.
Strauss, J., Laboor, S., Schirrmeister, L., Fedorov, A. N., Fortier, D., Froese, D., et al. (2021). Circum-Arctic Map of the Yedoma Permafrost Domain. Front. Earth Sci. 9, 758360. doi:10.3389/feart.2021.758360
Ulrich, M., Grosse, G., Strauss, J., and Schirrmeister, L. (2014). Quantifying Wedge-Ice Volumes in Yedoma and Thermokarst basin Deposits. Permafrost Periglac. Process. 25, 151–161. doi:10.1002/ppp.1810
Vasil'chuk, Y. K. (2013, Syngenetic Ice Wedges: Cyclical Formation, Radiocarbon Age and Stable Isotope Records by Yurij K. Vasil 'chuk, Monograph Synopsis. 24, 82–93. doi:10.1002/ppp.1764
Vasil'chuk, Y. K. (2005). Heterochroneity and Heterogeneity of the Duvanny Yar Edoma. Doklady Earth Sci. 402, 568–573.
Vos, K., Vandenberghe, N., and Elsen, J. (2014). Surface Textural Analysis of Quartz Grains by Scanning Electron Microscopy (SEM): From Sample Preparation to Environmental Interpretation. Earth-Science Rev. 128, 93–104. doi:10.1016/j.earscirev.2013.10.013
Walter, K. M., Edwards, M. E., Grosse, G., Zimov, S. A., and Chapin, F. S. (2007). Thermokarst Lakes as a Source of Atmospheric CH4 during the Last Deglaciation. Science 318, 633–636. doi:10.1126/science.1142924
Wetterich, S., Tumskoy, V., Rudaya, N., Andreev, A. A., Opel, T., Meyer, H., et al. (2014). Ice Complex Formation in Arctic East Siberia during the MIS3 Interstadial. Quat. Sci. Rev. 84, 39–55. doi:10.1016/j.quascirev.2013.11.009
Woronko, B., and Pisarska-Jamroży, M. (2016). Micro-Scale Frost Weathering of Sand-Sized Quartz Grains. Permafrost Periglac. Process. 27, 109–122. doi:10.1002/ppp.1855
Zanina, O. G., Gubin, S. V., Kuzmina, S. A., Maximovich, S. V., and Lopatina, D. A. (2011). Late-Pleistocene (MIS 3-2) Palaeoenvironments as Recorded by Sediments, Palaeosols, and Ground-Squirrel Nests at Duvanny Yar, Kolyma lowland, Northeast Siberia. Quat. Sci. Rev. 30, 2107–2123. doi:10.1016/j.quascirev.2011.01.021
Keywords: cryogenic weathering, Kolyma lowland, Arctic, permafrost, late Pleistocene, Holocene
Citation: Shmelev D, Cherbunina M, Rogov V, Opfergelt S, Monhonval A and Strauss J (2021) Reconstructing Permafrost Sedimentological Characteristics and Post-depositional Processes of the Yedoma Stratotype Duvanny Yar, Siberia. Front. Earth Sci. 9:727315. doi: 10.3389/feart.2021.727315
Received: 18 June 2021; Accepted: 30 September 2021;
Published: 29 October 2021.
Edited by:
Go Iwahana, University of Alaska Fairbanks, United StatesReviewed by:
Barbara Woronko, University of Warsaw, PolandGeorg Schwamborn, Istanbul Technical University, Turkey
Copyright © 2021 Shmelev, Cherbunina, Rogov, Opfergelt, Monhonval and Strauss. This is an open-access article distributed under the terms of the Creative Commons Attribution License (CC BY). The use, distribution or reproduction in other forums is permitted, provided the original author(s) and the copyright owner(s) are credited and that the original publication in this journal is cited, in accordance with accepted academic practice. No use, distribution or reproduction is permitted which does not comply with these terms.
*Correspondence: Denis Shmelev, c2htZWxldmRlbmlzX21zdUBtYWlsLnJ1