 Stuart Hardy
 Nestor Cardozo
- 1ICREA (Institució Catalana de Recerca i Estudis Avançats), Barcelona, Spain
- 2Departament de Dinàmica de la Terra i de l’Oceà, Facultat de Ciències de la Terra, Universitat de Barcelona, Barcelona, Spain
- 3Department of Energy Resources, University of Stavanger, Stavanger, Norway
Thrust faults, and thrust wedges, are an important part of the surface morphology and structure of many contractional mountain belts. Analogue models of thrust wedges typically provide a map- and/or side-view of their evolution but give limited insight into their dynamic development. Numerical modelling studies, both kinematic and mechanical, have produced much insight into the various controls on thrust wedge development and fault propagation. However, in many studies, syn-tectonic sediments or “growth strata” have been modelled solely as passive markers and thus have no effect on, or do not feedback into, the evolving system. To address these issues, we present a high-resolution, 2D, discrete element model of thrust fault and wedge formation and the influence that coeval sedimentation may have on their evolution. We use frictional-cohesive assemblies, with flexural-slip between pre-defined layers, to represent probable cover rheologies. The syn-tectonic strata added during contraction are frictional-cohesive and we can think of them as “mechanical growth strata” as they interact with, and influence, the growing thrust wedge. In experiments of thrust wedge development without syn-tectonic sedimentation, a forward-breaking sequence is seen: producing a typical thrust-wedge geometry, consistent with analogue and numerical models. In general, the inclusion of syn-tectonic sedimentation produces thrust wedges composed of fewer major forward-vergent thrusts and with only minor thrust activity in the foreland. In most of these models the sequence of thrust activity is complex and not simply forward-breaking. With increasing sedimentation, the frontal thrust has much greater displacement and overrides a much thicker package of earlier syn-tectonic sediments. Very high syn-tectonic sedimentation results in the formation of a single basin-bounding thrust fault and no thrust-wedge per se. At the local (outcrop) scale of individual fault-related folds, high syn-tectonic sedimentation alters fault-fold evolution by producing steeper ramps, whereas low syn-tectonic sedimentation allows shallower ramps that may flatten and propagate into the syn-tectonic strata. Implications of these results for the interpretation of thrust faults and wedges and their interaction with associated growth strata are discussed.
Introduction
Thin-skinned foreland fold-and-thrust belts are characteristically found at the margins of contractional orogenic belts created by oceanic subduction or continent–continent collision (see review in McClay and Whitehouse, 2004; Figure 1A). The structural style of these fold-and-thrust belts is described as thin-skinned as it lacks any significant involvement of crystalline basement. Orogenic belts such as the Pyrenees, the Alps or the Appalachians are typically asymmetric with marginal fold-and thrust belts, often called “doubly vergent orogenic wedges”, the formation of which has been the focus of much research (e.g., Willett, 1999; Burbidge and Braun, 2002; McClay and Whitehouse, 2004; Naylor et al., 2005; Butler et al., 2019; Butler, 2020). Thrust faults and fault-related folds are now recognised as being an important part of the surficial morphology and structure of many such mountain belts. The manner in which individual thrust faults initiate, grow, and interact with other thrusts faults to build a wedge is complex and the subject of much previous research (e.g., Hardy et al., 1998; Selzer et al., 2007; Hardy et al., 2009).
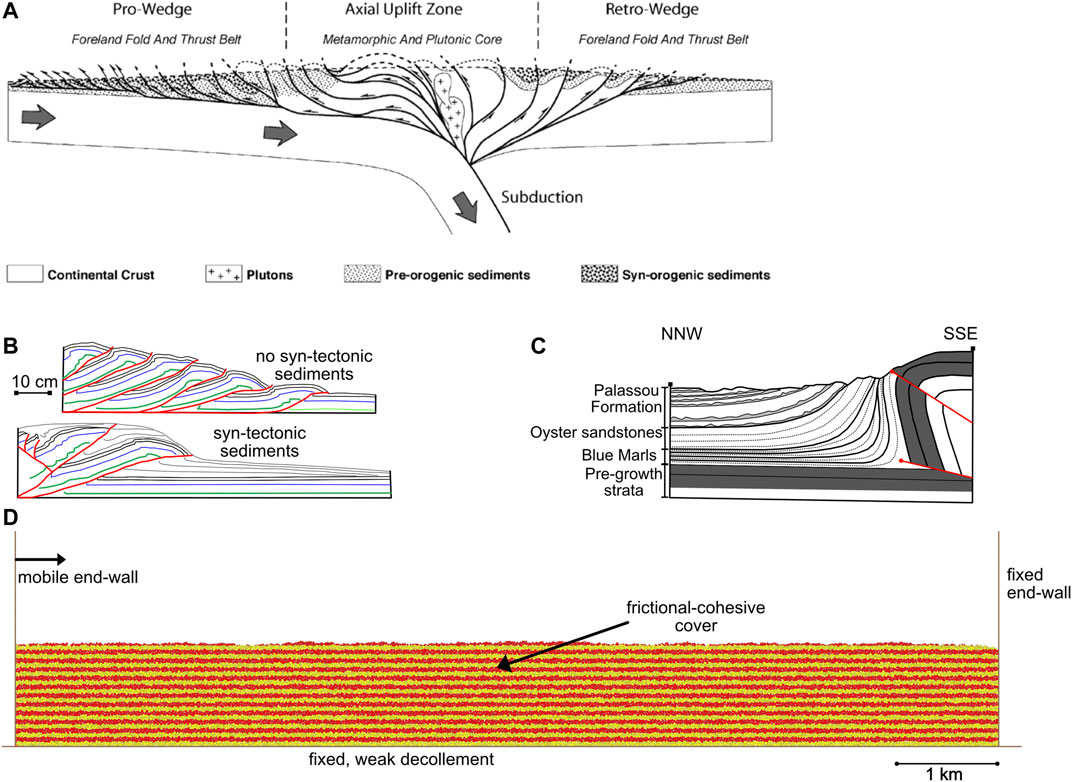
FIGURE 1. (A) Conceptual model of a doubly-vergent thrust wedge system produced by continent–continent collision redrawn from Hardy et al., (2009), (B) Analogue models of thrust wedges redrawn from Storti and McClay (1995)–the upper model shows thrust imbrication without syn-tectonic sedimentation: note closely spaced multiple imbricates and use of basal decollement. The lower panel illustrates thrusting with syn-tectonic sedimentation: note limited number of thrusts which “root” near the back wall and the overriding of syn-tectonic sediments. (C) Cross-section through the north-western Mouthoumet Front (NE Pyrenees) showing growth structures involving the Eocene Blue Marls, Oyster Sandstones and Palassou Formation (redrawn from Christophoul et al., 2003), (D) Boundary conditions and 2D model set-up used in the experiments presented herein.
Analogue models of thrust wedge formation typically provide a side-wall and map-view picture of the wedge initiation and evolution but give limited insight into the dynamic evolution of such systems (e.g., Figure 1B), although they highlight the influence of syn-tectonic sedimentation and erosion (see e.g., Storti and McClay, 1995; Mugnier et al., 1997; Wu and McClay, 2011; Graveleau et al., 2012). However, the syn-tectonic “sediments” in many of these studies are homogeneous, lacking mechanical stratigraphy and inter-layer slip-surfaces, quite unlike natural sedimentary sequences (e.g., Figure 1C). Numerical modelling studies, both kinematic and mechanical, of thrust wedge formation are varied and numerous and have produced some quite interesting results whereby the simulated thrust wedges in both weak, frictional and “strong” materials are generally quite similar to those observed on Earth and in analogue modelling studies (Willet et al., 1993; Hardy et al., 1998; Burbidge and Braun, 2002; Naylor et al., 2005; Selzer et al., 2007; Hardy et al., 2009; Simpson, 2010; Dean et al., 2013; Fillon et al., 2013). However, many of these numerical studies have not included syn-tectonic sediments or “growth strata”. Those that do either treat them as passive markers of fault/fold growth (e.g., Hardy and Ford, 1997), have a very coarse resolution (100 s of m) such that detailed, local interactions of faulting and sedimentation are not discernible (Selzer et al., 2007; Fillon et al., 2013), or are accretionary wedge-type finite element simulations where only hinterland sediment supply and diffusion are simulated (e.g., Selzer et al., 2007; Simpson, 2010).
Conceptually, experimentally and observationally, syn-tectonic sedimentation (and erosion) is thought to have a significant influence on local thrust tectonics and wedge development in general (Nichols, 1987a; Nichols, 1987b; Storti and McClay, 1995; Storti et al., 1997; Mugnier et al., 1997; Benesh et al., 2007; Bigi et al., 2010; Fillon et al., 2013; Dean et al., 2015; Butler et al., 2019; Butler, 2020; Noda et al., 2020). This syn-tectonic sedimentation may be the result of local erosion, transport and sedimentation, sediment supply from the hinterland, or more regional basinal processes such that thrusts propagate into a growing (aggrading) foreland sedimentary sequence. Whilst previous numerical and analogue studies have addressed the interaction of sedimentation and tectonics, their resolution has typically not allowed the examination of detailed, single structure, tectono-stratigraphic relationships. Here, we present a high-resolution (average 9.7 m element radius) discrete element model of thrust wedge development (Figure 1D). We use frictional-cohesive assemblies of discrete elements, grouped in multiple, pre-defined layers separated by weak interfaces, to represent probable, mechanically variable, cover rheologies. This also allows for the development of folds and fault-related folds within the thrust wedge. Homogenous frictional-cohesive models produce results that are very similar but are dominated by shear zones rather than fault-related folds. The syn-tectonic strata added here are also frictional-cohesive and we call them “mechanical growth strata” as they interact with the growing thrust fault array. The model allows us to examine the detailed evolution of thrusts and thrust wedges as they propagate into a growing (aggrading) basinal sedimentary sequence in the foreland. Implications of the results for the interpretation of coupled tectono-sedimentary systems are discussed.
Methodology
Here we use a 2D discrete element numerical model to simulate the growth of a thrust wedge in a frictional-cohesive cover overlying a weak, horizontal, decollement. Modelling of deformation to high strain is an ideal candidate for the discrete element technique as it is well-suited to studying problems in which discontinuities (shear-zones, faults, fractures, voids, etc.) are important. It also allows deformation involving unlimited relative motions of individual elements and complex, abrupt and changing boundary conditions (Cundall and Strack, 1979; Finch et al., 2004:; Egholm et al., 2007; Hardy, 2008, Hardy, 2011, Hardy, 2019a; Thompson et al., 2010), particularly germane to the simulation/formation of thrust faults and wedges. The discrete element code used here is “cdem2D” which has been used previously to undertake a wide variety of structural geology modelling in both 2D and 3D (as cdem3D). The basic numerical methodology and its application to a variety of problems (fault-propagation folding, orogenic wedge growth, caldera collapse, dike intrusion on Mars, viscous flow, Gilbert deltas, etc.) has been published previously (e.g., Botter et al., 2014, Botter et al., 2016; Hardy, 2008; Hardy et al., 2009; Hardy, 2016; Hardy, 2018; Hardy, 2019a; Hardy, 2019b). The details of this code applied to frictional and frictional-cohesive materials can be found elsewhere (e.g., Hardy et al., 2009; Hardy 2011, Hardy, 2015, Hardy, 2019b, Hardy, 2021), however an overview is given below. Here, we will illustrate the use of this modelling scheme to simulate the evolution of thrust faults/wedges and ongoing syn-tectonic, “growth”, sedimentation.
The discrete element technique, in common with other numerical techniques, has both advantages and disadvantages when considering its application to any specific geological problem. As discussed before, modelling of large deformations and the possibility of applying complex boundary conditions are critical for modelling thrust wedges. However, one disadvantage of the technique lies in the necessary, but time-consuming, calibration of micro-particle parameters to bulk physical properties (cf. Egholm et al., 2007; Botter et al., 2014). The interaction of many tens of thousands of particles, both locally and globally, also leads to situations wherein our ability to explain why a particular fault or fracture grew at the expense of a neighbouring one is limited. Such issues also exist in analogue modelling where repeated experiments under the same boundary conditions are reasonably reproducible but not in the finer details of the fault and fracture systems (e.g., van Gent et al., 2010; Schreurs et al., 2016). Computational limitations on element size and/or model resolution, whilst important previously, are no longer a particular concern due to rapid advances in computational power and the parallelisation of discrete element codes.
The discrete-element model described here is a variant/development of the lattice solid model (LSM) (Mora and Place, 1993, Mora and Place, 1994; Place et al., 2002). Here, a sedimentary rock is treated as an assembly of circular elements, which interact as if connected by breakable elastic springs (bonds) and that undergo motion relative to one another. The behaviour of the elements assumes that the particles interact through a “repulsive–attractive” force (Mora and Place, 1993) in which the resultant (normal) force, Fn, is given by:
Here, Kn is the elastic constant (normal spring stiffness) of the bond, R is the equilibrium distance between the particles (sum of particle radii), r0 is a breaking threshold, and r is the current distance between the particle pair. Particles are bonded until the distance (r) between them exceeds the defined breaking threshold (r0) at which time the bond breaks. The force acting on a bond at this threshold represents the force necessary for a bond to fail or yield, or, alternatively, can be cast as the stress acting on a particle’s bond at failure. After this breaking threshold, the particle pair experiences no further attractive force and the bond is irreversibly broken. However, if the two particles return to a compressive contact (r < R), a repulsive force still acts between them. This is the case with the frictional-cohesive models discussed herein where all elastic bonds are initially broken.
For a frictional-cohesive material, in addition to treating the normal force (Fn) between particles, we also calculate the tangential (shear) force, Fs, as a result of displacement (Xs) perpendicular to the vector connecting the particles’ centroids. This frictional force acts in a direction opposite to that of the relative tangential velocity and is modelled as a threshold-limited elastic spring with a cohesive force term (C0) in parallel with that used to calculate the normal forces (cf. Cundall and Strack, 1979; Mora and Place, 1994). The magnitude of this force is limited to be less than or equal to the shear force allowed by Coulomb friction:
where Ks is the elastic constant (shear spring stiffness) of the contact, Fsmax is the maximum (limiting) shear (frictional) force, Fn is the normal force at a contact, and µ is the inter-particle coefficient of friction. If a contact is ‘‘lost’’ between two touching elements (i.e., they separate), then all the forces between the elements are set to zero. The total elastic force, Fi,α exerted on a particle is thus obtained by summing the normal and tangential forces on each contact/bond that links a specific particle to its neighbours, calculated by:
where fi,j is the elastic force (normal and shear) experienced by particle i from its neighbouring particle j. However, we include a viscous damping term (proportional to the particle velocity) that acts to dampen reflected waves from the rigid edges/boundaries of the model, preventing a build-up of kinetic energy within the closed system, a standard technique to ensure numerical stability (cf. Mora and Place, 1994; Place et al., 2002).
Finally, gravitational forces, Fg, acting on each element are calculated in the vertical direction, increasing the vertical stress with depth. Therefore, the total force (F) on any particle is given by:
where υ represents the dynamic viscosity and ẋ is the velocity of the particle. At each time step, the particles are advanced to their new positions by integrating their equations of motion using Newtonian physics and a velocity-Verlet-based scheme (Allen and Tildesley, 1987). In discrete element models such as the one used here, parameters such as strength, coefficient of friction etc of the assembly are emergent properties and do not relate directly to the element properties. This relation must be assessed through the use of angle of repose and/or unconfined/confined biaxial numerical tests, a process known as calibration (cf. Oger et al., 1998; Finch et al., 2004; Holohan et al., 2011; Botter et al., 2014).
The key additional feature presented here is that, unlike simple, homogeneous, discrete element assemblies, we can choose to have element-element contact properties (such as cohesion, friction or bonding) only activated within a set of (predefined) layers and not between these layers. In this paper, we incorporate this heterogeneous layering into the models in order to facilitate flexural slip deformation along layer interfaces and thus better approximate the typically anisotropic mechanical stratigraphy of sedimentary cover rocks, be this a layered sandstone-shale sequence or salt layers etc (cf. Figure 1C). These inter-layer contacts have no cohesive bonds or friction, in order to make these interfaces as weak as possible. These interfaces cannot be frictionless in the true sense, due to the “roughness” of circular elements and thus there is always some residual, intrinsic friction at the interface. However, it remains much weaker than a frictional-cohesive interface. All other numerical techniques and approaches used on the elements are identical to those discussed in previous papers to which the interested reader is referred (e.g., Hardy et al., 2009; Hardy, 2011, Hardy, 2015).
A second feature presented here is the use of the discrete element technique not only to model deformation of a pre-existing sedimentary sequence but also to model the deposition (and subsequent deformation) of a “growth” sedimentary sequence deposited during active tectonics. After syn-tectonic sediments are added to the evolving model, these elements must be allowed to equilibrate/adjust to a final, initial deposited state. This is done by pausing any external boundary movement after discrete element addition for a predefined (small) number of time-steps until the added elements are in a quasi-static location and effectively stable. This is a crucial computational step. The experiment then continues as before but with a new sediment load added to the system. Compaction per se is not considered, but the greater load, as a result of sedimentation, changes forces and element packing at depth. The specific heuristic used here is to add discrete elements of variable size (identical to the pre-growth and with an average radius of c. 9.7 m), filling up any available submarine accommodation space beneath a defined baselevel. These elements are chosen randomly and then added sequentially with each additional element attempting to minimise the remaining accommodation space until it is filled. They are carefully placed to ensure that they maximise the filling of available accommodation space while just touching the preexisting deposited elements. These growth elements can either be frictionless to represent weak, unconsolidated (un-lithified) sediments or can be frictional-cohesive to represent rapidly lithified (via compaction or cementation, and thus much stronger) growth strata. Here, we consider the growth elements to be frictional-cohesive and as strong as the pre-growth elements. In addition, they can also experience flexural-slip between their defined layers. We do not consider the transport of these elements or their erosion in this study. The spatial resolution chosen here is arbitrary but it is appropriate to simulate the thrust wedges and to achieve realistic runtimes. However, with current rapid advances in computing power, model resolution is becoming less of an issue.
Model Parameters, Set-Up and Boundary Conditions
Below we present the results of a set of 5, numerical models (hereafter called experiments) of thrust-wedge formation as a result of lateral contraction via a mobile left end-wall. These are, in a sense, samples on a continuum between two distinct end-members: thrust-wedge formation under conditions of no sedimentation, and thrust-wedge formation under conditions of very high sedimentation. In each case, we will examine the growth of a thrust wedge above a frictionless, horizontal basement interface/decollement (Figure 1D). The cover has an initial, uniform, thickness of 1,300 m and all models are initially 12,500 m wide. The model represents the pre-growth section (the cover above the basement) and the end-walls/base using approximately 43,000 elements. Element radii range from 6.25 to 15.625 m (average radius 9.7 m) and their density is 2,500 kg/m3. Syn-tectonic strata, where present, are added beneath a defined (and rising) baselevel. Initially there is no imposed bathymetry above the pre-tectonic strata. Formally, there is no rate of either sedimentation or baselevel rise as the deformation of frictional-cohesive materials is time independent, and thus the terms low, medium, high and very high are only relative. Depending on the number of growth elements added, the final number of elements can reach around 80,000.
As discussed before, the bulk behaviour of the assembly does not relate directly to the element properties, but it must be estimated from calibration tests. Using such tests, the frictional-cohesive discrete elements used here have been found to have a bulk coefficient of friction (µ) of c. 0.70 (internal angle of friction,
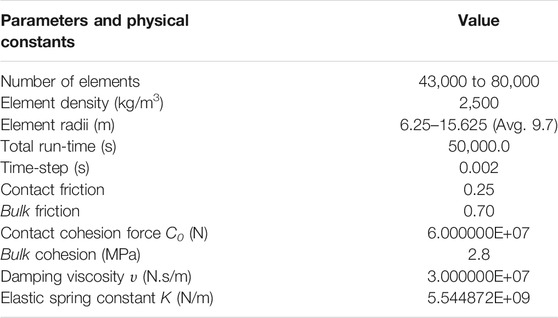
TABLE 1. Model parameters.
As the experiments proceed, the effect of lateral contraction (via the left end-wall) is transmitted into the cover, changing local element interactions and thus contact forces. As a result of this change in local forces, the internal elements are advanced to their new positions within the model by integrating their equations of motion as described before. Element positions are saved during experiments to allow a detailed, high-resolution analysis of geometry, displacement and strain (cf. Cardozo and Allmendinger, 2009 and Cardozo and Hardy in prep). The numerical code used (cdem2D) has been parallelised using OpenMP and has been thoroughly tested and verified against the serial version (cf. Chapman et al., 2007; Hardy, 2015). Experiments like the ones discussed here take ∼24 h to run on a desktop machine with two 6-core Intel Xeon (X5,650–2.66 GHz) processors allowing 24 computational threads. Model results are saved at regular intervals throughout as “time snapshots”.
In each experiment, model results are shown after 500, 1,000, 1,500, 2,000, and 2,500 m horizontal displacement on the left-hand end-wall, corresponding to 4, 8, 12, 16, and 20% shortening (movies of the simulations are included in theSupplementary Material). The pre-tectonic sequence has 48 layers, whilst the syn-tectonic sequence, depending on base level rise and uplift, has a maximum of 32. For visualisation purposes such layers are coloured in groups of two in the model results. Two distinct “growth” packages are highlighted/coloured in order to show the stratal architectures developed in early (green-red package) and mid/late (blue-yellow package) thrust wedge growth, the transition occurring at c. 1,250 m (10% shortening) of lateral contraction. This value was chosen as it best highlights the distinct differences between early and later thrust-fault related growth strata in the experiments. In the experiments, not all thrusts are surface-breaking; however the position of each thrust, or fault-related fold, at the wedge surface is indicated by an arrow in all figures. Structures are labelled alpha-numerically in order of their appearance (T1, T2, etc.).
For each experiment discussed herein many different models have been run with parameters similar to those described above. However, the specific experiments discussed here are representative of the stratigraphic and structural evolution typically observed under these, specific, boundary conditions in that they contain the reproducible, characteristic features seen in many models. In a manner similar to outcrop examples, seismic data or analogue models, determining the “representativeness” or generality of any geometry observed in a specific model is, in a sense, subjective. The important scientific message to be taken away is not thus the precise location of an individual geometric feature or fault, but rather the distinctive, reproducible, structural behaviour and stratigraphic sequences that emerge from multiple experiments.
Experiment 1–Thrust Wedge Development With No Syn-Tectonic Sedimentation
In the first (baseline) experiment (Figure 2), we show the growth of a simple thrust wedge in the frictional-cohesive cover above the frictionless base (Figure 1D). In this instance there is no syn-tectonic sedimentation included, so this can be considered as the reference model against which the effect of syn-tectonic sedimentation can be assessed. We will examine/describe the evolution of this thrust wedge and its characteristic features.
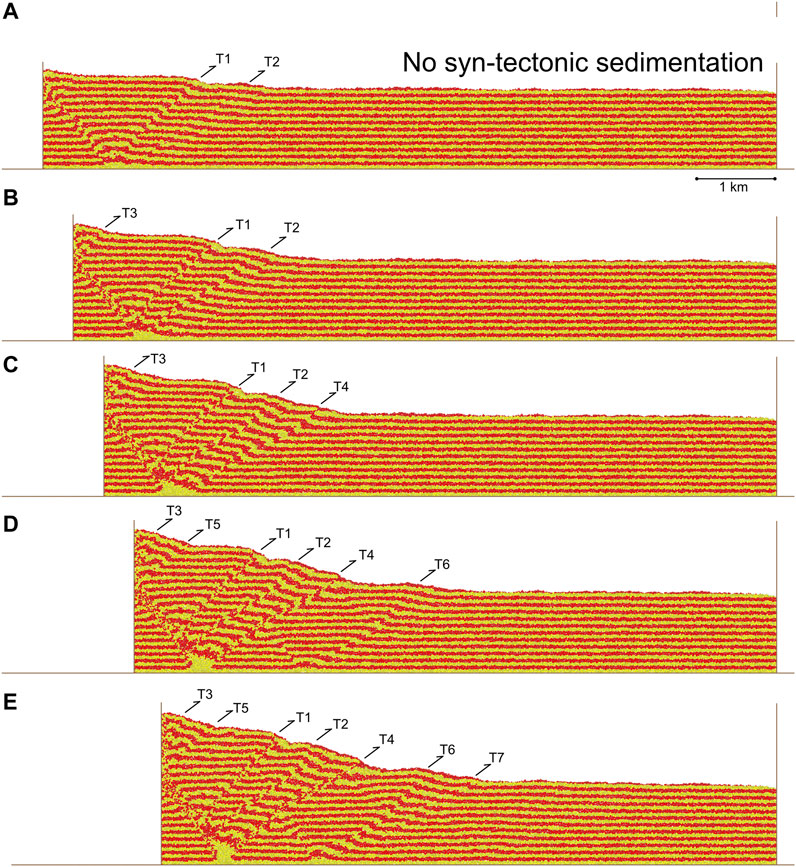
FIGURE 2. Experiment 1, progressive evolution of a contractional model with “no” syn-tectonic sedimentation. Results are shown after 500 (4%), 1,000 (8%), 1,500 (12%), 2000 (16%), and 2,500 (20%) m contraction/displacement on the left-hand end-wall, see text for discussion.
In this first experiment, we can observe the growth of a simple, almost classical, thrust wedge (Figure 2; cf. Figure 1B). The wedge grows both in height and width through time due to progressive displacement/shortening via the end-wall (Figures 2A–E). The final thrust-wedge is made up of an array of seven fore-thrusts and one back-thrust against the left mobile-wall of the experiment. In reality, many of these structures are fault-related folds or shear zones at higher levels. Thrust T1 is the first to form, quickly followed by thrust T2 in a forward-breaking sequence (Figure 2A). Thrust T3 then forms adjacent to the mobile-wall (Figure 2B), with T4 then developing as the wedge grows outwards (Figure 2C). This pattern continues with T5 forming close to the mobile-wall, followed by T6 and T7 developing in a forward breaking sequence (Figures 2D,E). Thrusts T1 and T4 show the most visible offsets/displacement. The final surface slope of the wedge is c. 12 degrees and it reaches a maximum height/thickness of c. 2.5 km. Overall, in this experiment, thrust fault activation is from left to right, with some out of sequence thrusts/fault-related folds (T3 and T5) occurring adjacent to the mobile-wall (Figures 2A–E). In all models without syn-tectonic sedimentation, this generally forward-breaking sequence of thrust activity is seen producing a typical wedge structure.
Experiment 2–Thrust Wedge Development With Low Syn-Tectonic Sedimentation
In the second experiment (Figure 3), we show the growth of a thrust wedge in which there is contemporaneous “low” syn-tectonic sedimentation. Thus, this is the first case in which the effect of syn-tectonic sedimentation on thrust fault activity and wedge development can be assessed. This “low” rate of syn-tectonic sedimentation is achieved by having a slowly rising baselevel which creates “accommodation space”, all of which is subsequently filled by newly added discrete elements. Over the duration of the model run the base-level rise creates approximately 250 m of accommodation space. However, this baselevel rise never fully overwhelms the emergent topography of the evolving thrust wedge. All other model parameters and boundary conditions are identical to those of Experiment 1.
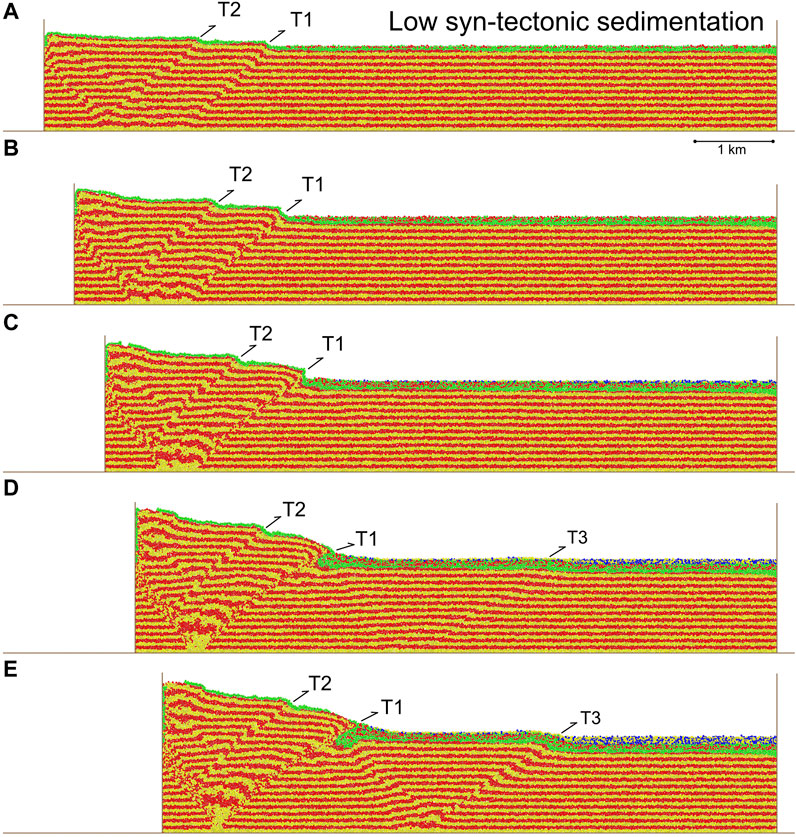
FIGURE 3. Experiment 2, progressive evolution of a contractional model with “low” syn-tectonic sedimentation. Results are shown after 500 (4%), 1,000 (8%), 1,500 (12%), 2,000 (16%), and 2,500 (20%) m contraction/displacement on the left-hand end-wall. Two distinct growth packages are highlighted/coloured in order to show the stratal architectures developed in early (green-red package) and mid/late (blue-yellow package) fault array growth, the transition occurring at c. 1,250 (10%) m of lateral contraction, see text for discussion.
In this experiment we can see the growth of a thrust wedge that is strikingly different to that of the previous experiment (Figures 3A–E, cf. Figure 2) as a consequence of only minor syn-tectonic sedimentation. As expected, the thrust wedge grows, from left to right, in both height and width through time with progressive shortening. However, its development is quite distinct to that of the thrust wedge seen Experiment 1. The first, and striking, difference is that only three fore-thrusts develop in this model. The first thrust to develop, T1, is actually more “outboard” than thrust T2, but fault activity then switches inboard to thrust T2 (Figures 3A,B). Thereafter, both thrust faults operate simultaneously. Overall, thrust T1 accumulates much of the displacement. It becomes emergent with continued shortening and overrides the syn-tectonic strata (Figures 3C–E). Adjacent to the mobile end-wall a complex zone of folding, uplift and interference of structures develops. Finally, a late, more symmetric, structure develops approximately 3 km outboard of the previous thrust front (Figures 3D,E). This structure is quite symmetric with a frontal thrust T3 and a backlimb/thrust. The final surface slope of the wedge is c. 13 degrees, with a flatter, outboard area and the wedge reaches a maximum height/thickness of c. 2.5 km (Figure 3E). Syn-tectonic sediments thin somewhat towards the growing wedge and across the outboard structure. However, some of the syn-tectonic sediments deposited during the earliest stages of shortening now form some of the highest parts of the wedge. One remarkable package of syn-tectonic strata occurs in the footwall of thrust T1. These strata are caught between T1 and the back-thrust of T3 and form a tear-drop shaped package that is surrounded on three sides by pre-tectonic strata. Finally, throughout the growth of the wedge, fold and fault scarps develop at the wedge surface in the frictional-cohesive pre-tectonic and syn-tectonic strata.
Experiment 3–Thrust Wedge Development With Medium Syn-Tectonic Sedimentation
In the third experiment (Figure 4), we show the growth of a thrust wedge in which there is “medium” syn-tectonic sedimentation. This “medium” rate of syn-tectonic sedimentation is achieved by having a rising base level which creates twice the “accommodation space” of Experiment 2–all of which, again, is filled by syn-tectonic discrete elements. The final maximum thickness of syn-tectonic strata is thus approximately 500 m (Figure 4E). All other model parameters and boundary conditions are identical to those of Experiment 1.
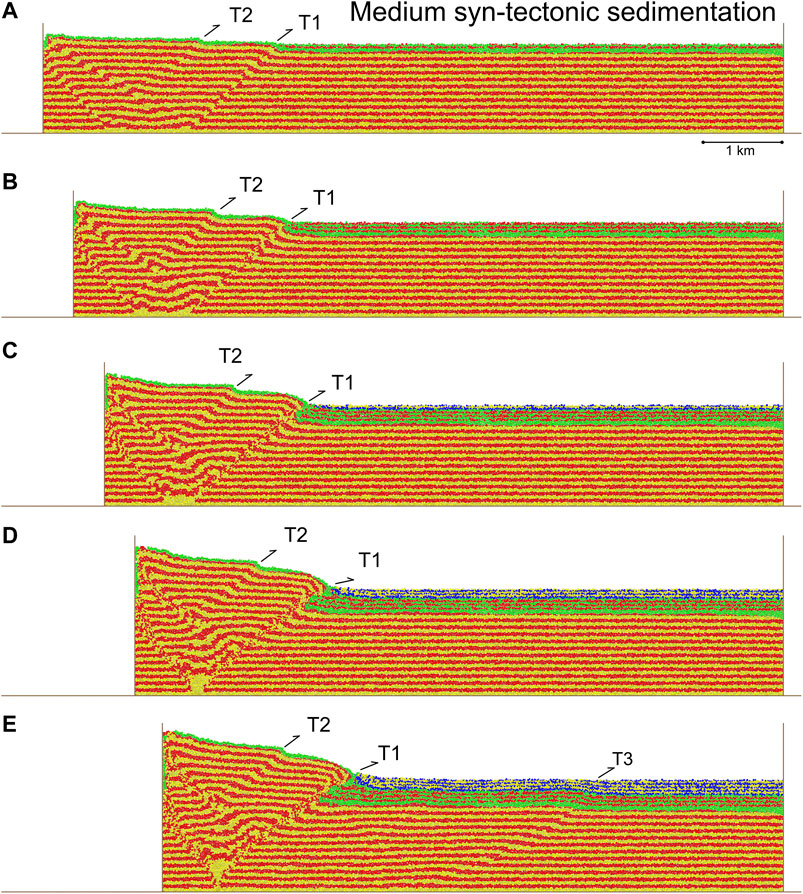
FIGURE 4. Experiment 3, progressive evolution of a contractional model with “medium” syn-tectonic sedimentation. Results are shown after 500 (4%), 1,000 (8%), 1,500 (12%), 2000 (16%), and 2,500 (20%) m contraction/displacement on the left-hand end-wall. Two distinct growth packages are highlighted/coloured in order to show the stratal architectures developed in early (green-red package) and mid/late (blue-yellow package) fault array growth, the transition occurring at c. 1,250 (10%) m of lateral contraction, see text for discussion.
As before, the thrust wedge in this experiment grows (from left to right) in both height and width through time with progressive shortening (Figures 4A–E). However, its growth is quite distinct to that of Experiment 2, as now only two major fore-thrusts develop. The first thrust to develop is T1, which is once again more outboard that thrust T2. However, very quickly fault activity switches inboard to T2 and then both faults operate simultaneously. T1 is not really emergent and appears to flatten as it enters the syn-tectonic sedimentary sequence (Figures 4D,E). Simultaneously with the growth of T1 and T2, internally, two back-thrusts develop forming a complex interference structure. Eventually, thrust T1 accumulates much of the boundary displacement. With continued shortening, a late outboard, more symmetric, structure develops, with an associated fore-thrust T3 (Figures 3C–E). Compared to Experiment 2, it is of much lower amplitude but nonetheless produces a broad zone of uplift. Syn-tectonic strata thin towards the growing thrust wedge and across the outboard structure (Figure 4E). Note the thick, folded and faulted package of syn-tectonic strata in the footwall of the thrust T1, and also the upper part of this thrust ramp shallowing as it enters the growth strata. Finally the wedge is narrower than that of Experiment 2, with a surface slope of around 11° and a maximum height/thickness of c. 2.5 km.
Experiment 4–Thrust Wedge Development With High Syn-Tectonic Sedimentation
In the fourth experiment (Figure 5), we show the growth of a thrust wedge in which there is “high” syn-tectonic sedimentation. This “high” rate of syn-tectonic sedimentation is achieved by having a rising base level which creates four times the accommodation space of Experiment 2–all of which is filled by syn-tectonic discrete elements. The final maximum thickness of syn-tectonic strata is now approximately 1,000 m (Figure 5E). All other model parameters and boundary conditions are identical to those of Experiment 1.
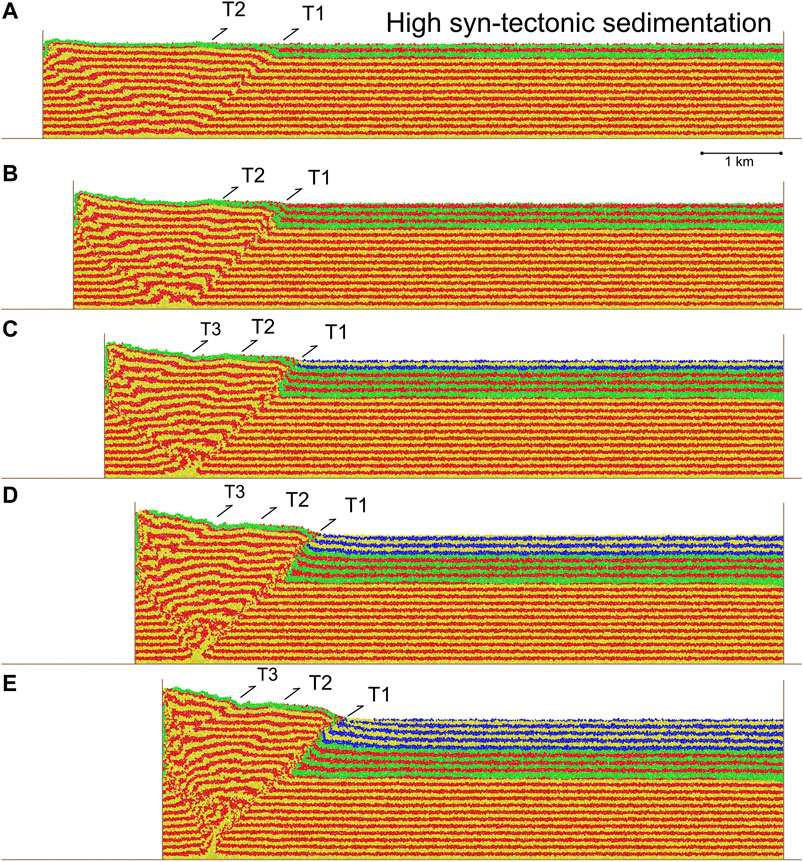
FIGURE 5. Experiment 4, progressive evolution of a contractional model with “high” syn-tectonic sedimentation. Results are shown after 500 (4%), 1,000 (8%), 1,500 (12%), 2000 (16%), and 2,500 (20%) m contraction/displacement on the left-hand end-wall. Two distinct growth packages are highlighted/coloured in order to show the stratal architectures developed in early (green-red package) and mid/late (blue-yellow package) fault array growth, the transition occurring at c. 1,250 (10%) m of lateral contraction, see text for discussion.
The key, and clear, difference seen in this model is that only one major fore-thrust (labelled T1) is dominant during much of the experiment. Thrust T2 is active to a minor degree whilst thrust T3 appears midway through the experiment to accommodate the effect of the moving end-wall (Figures 5C–E). In addition, there are no late outboard structures (Figures 5A–E; cf. Figures 3, 4). There are however two early, back-thrusts associated with T1 and T2 which form part of a complex zone of deformation in the thickest part of the wedge adjacent to the mobile-wall. The result of this change in structural style is a narrower “wedge” which has a surface slope of c. 8°.
Syn-tectonic strata are, for the most part, flat-lying and occupy much of the foreland. They do however thin towards and (initially) across the growing wedge. They often terminate against, or at, the active T1 thrust front. Note the extensive, folded and upturned package of growth strata over-ridden by the thrust T1 (Figure 5E) and the narrow footwall syncline. This thrust ramp has a fairly constant angle as it enters the syn-tectonic strata, only shallowing slightly as it begins to override the youngest syn-tectonic sediments.
Experiment 5 –Thrust Wedge Development With Very High Syn-Tectonic Sedimentation
In the fifth experiment (Figure 6), we show the growth of a thrust wedge in which there is very high syn-tectonic sedimentation. This “very high” rate of syn-tectonic sedimentation is achieved by having a rising base level which creates six times the accommodation space of Experiment 2–all of which is filled by syn-tectonic discrete elements. The final maximum thickness of growth strata is approximately 1,500 m. All other model parameters and boundary conditions are identical to those of Experiment 1.
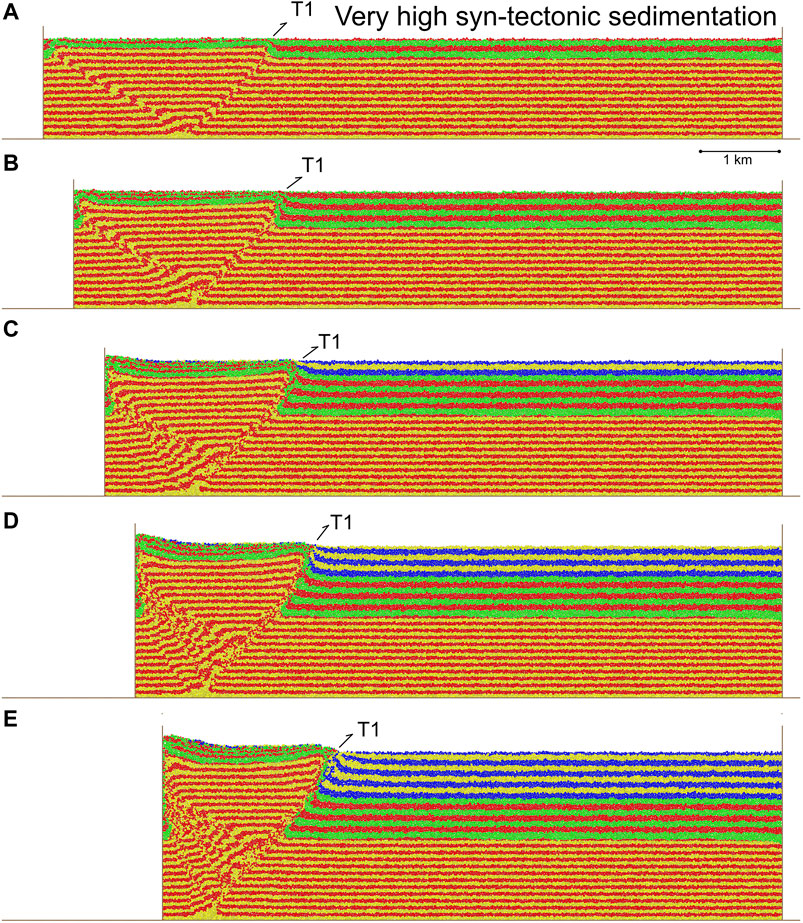
FIGURE 6. Experiment 5, progressive evolution of a contractional model with “very high” syn-tectonic sedimentation. Results are shown after 500 (4%), 1,000 (8%), 1,500 (12%), 2000 (16%), and 2,500 (20%) m contraction/displacement on the left-hand end-wall. Two distinct growth packages are highlighted/coloured in order to show the stratal architectures developed in early (green-red package) and mid/late (blue-yellow package) fault array growth, the transition occurring at c. 1,250 (10%) m of lateral contraction, see text for discussion.
In this model, it can be seen that only one fore-thrust (T1) is active during the entirety of the experiment, and that no late outboard structures are formed at all. In fact, this is not really a thrust wedge per se. This singular structure is quite symmetric initially as it also has a distinct back-thrust (Figures 6A,B). However, with continued shortening, the structure becomes more asymmetric as displacement accrues on the fore-thrust (Figures 6C–E) and a hanging wall anticline forms. The early syn-tectonic strata are found in both the hanging wall and footwall of thrust T1. In contrast, later syn-tectonic strata thin towards and abut against the active thrust front.
Note the extensive, folded and upturned package of syn-tectonic strata immediately adjacent to and in the footwall of thrust T1 (Figure 6E). In addition, the upper part of the thrust ramp has a fairly constant angle initially in the pre-growth strata and as it enters the growth strata, but it progressively steepens with continued shortening.
Snapshots of Fault Activity at Early Stage (4% Shortening) and Late Stage (20% Shortening) of Each Experiment
For each model we now discuss the incremental maximum shear strain (a useful proxy for fault activity) over the previous 20 m of mobile-wall contraction at an early, and at a later, stage of each experiment (movies of the incremental maximum shear strain over time are included in theSupplementary Material). These figures illustrate the manner in which deformation is distributed and localised at each, different, stage of wedge development (Figures 7, 8).
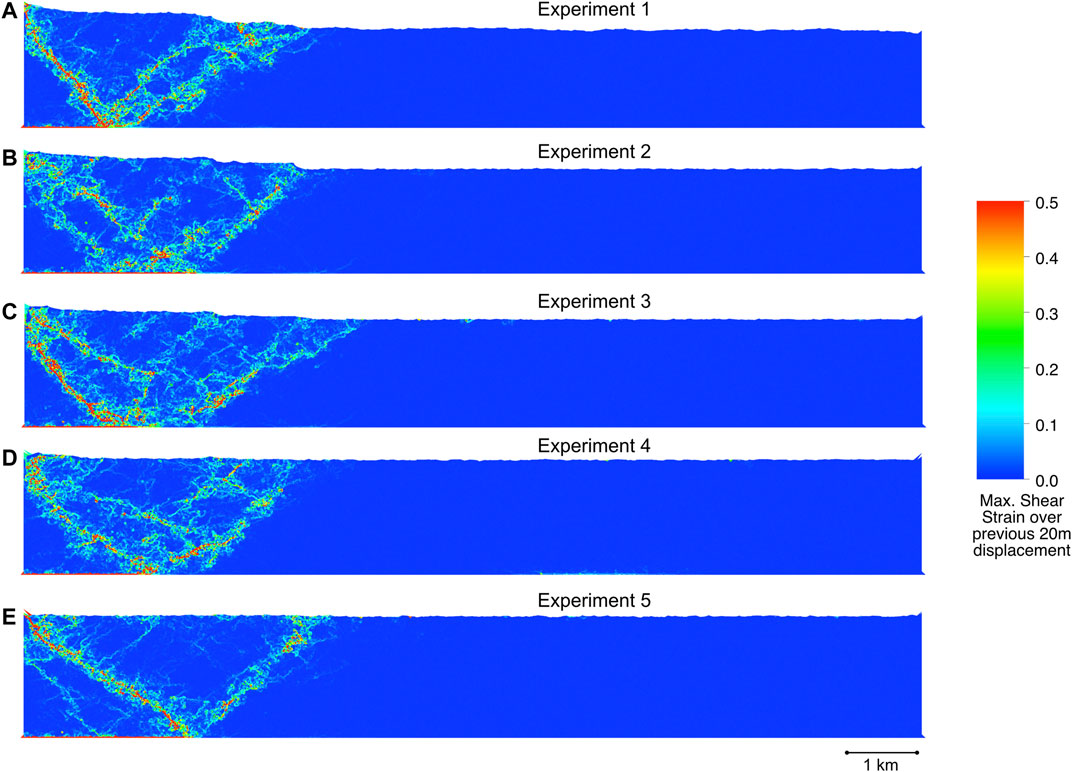
FIGURE 7. Incremental maximum shear strain in all models over the previous 20 m of displacement at 4% shortening. Maximum shear strain colour scale is included to the right. See text for discussion.
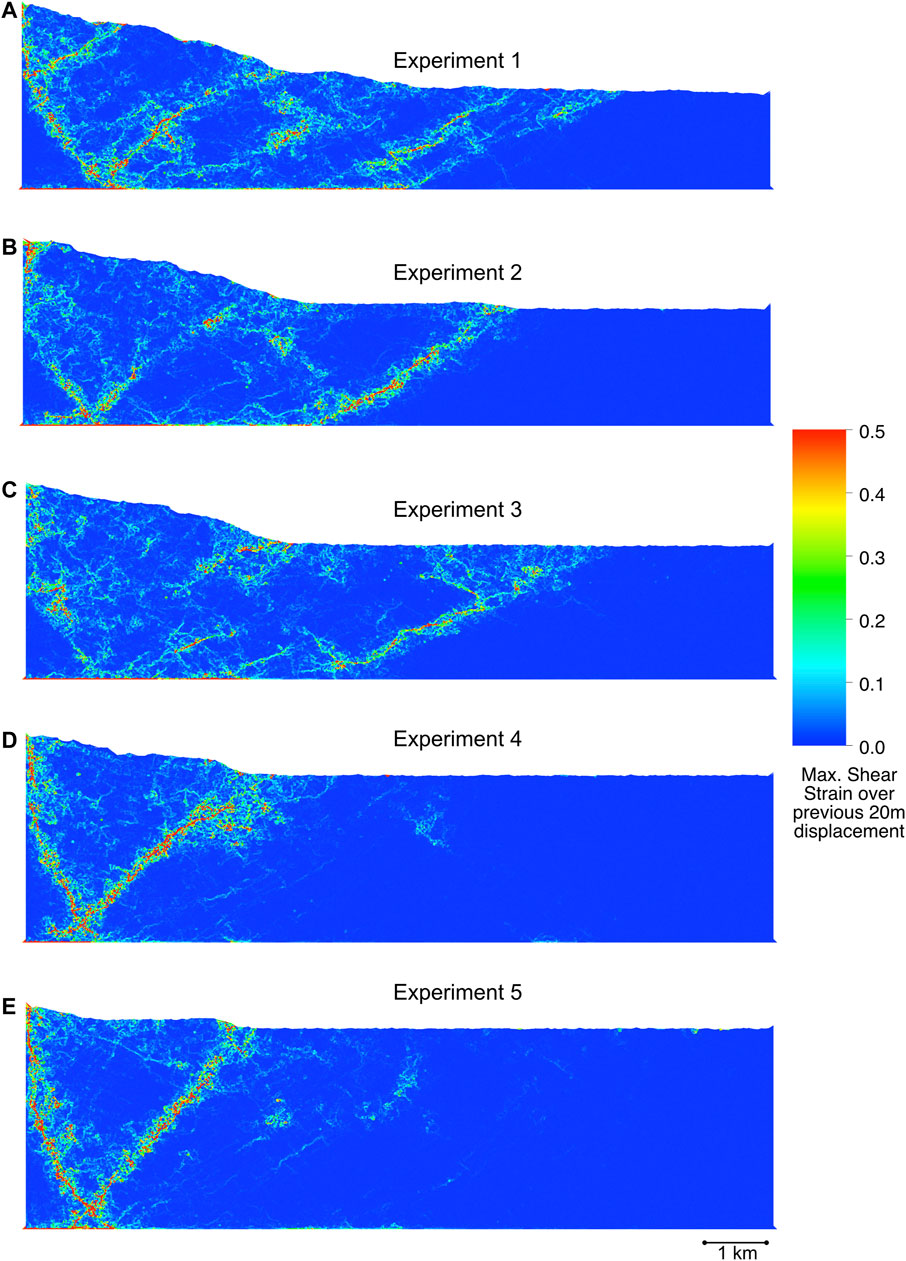
FIGURE 8. Incremental maximum shear strain in all models over the previous 20 m of displacement at 20% shortening. Maximum shear strain colour scale is included to the right. See text for discussion.
Early Stage
Here we see the difference between experiments subject to increasing amounts of syn-tectonic sedimentation at an early stage of wedge development (4% shortening) (Figures 7A–E). At this stage, in nearly all experiments, deformation is restricted to a fairly narrow zone adjacent to the mobile, left-hand, end-wall. With no, or low, syn-tectonic sedimentation several thrusts are active simultaneously during this increment of shortening, as well as a portion of the basal decollement (Figures 7A,B). Both fore-thrusts and back-thrusts can be seen, as well as imbricates/ramps not immediately visible from the simple geometric results (e.g., Experiment 3, compare Figure 4A, Figure 7C). As the magnitude of syn-tectonic sedimentation increases, the style of active thrusting changes from imbrication to more symmetric structures (Figures 7C–E).
Late Stage
Here we see more distinct differences between experiments subject to increasing amounts of syn-tectonic sedimentation at a late stage (20% shortening) of each experiment (Figures 8A–E). With no, or low, syn-tectonic sedimentation many thrusts are active simultaneously during this increment of shortening, as well as much of the basal decollement (Figures 8A,B). So clearly the simple idea of a foreland-propagating sequence of thrust activation (baton-passing) doesn’t really work when examined in detail (cf. Hardy et al., 1998; Hardy et al., 2009). Both fore-thrusts and back-thrusts can be seen, as well as imbricates/ramps not immediately visible from the simple geometric results (e.g., Experiment 3, compare Figure 4E, Figure 8C). As the magnitude of syn-tectonic sedimentation increases, the number of active thrusts decreases, as does the extent of the activation of the basal decollement (Figures 8C–E).
Analysis of Excess Area of the Experiments
The experiments presented here can also be analysed in terms of the excess area (area above the regional) of the layer boundaries at the end of the simulation (see Epard and Groshong, 1993). This is a technique commonly used when analysing seismic and outcrop data (e.g. Bulnes et al., 2019), and it is informative to assess its applicability to our experimental results. Figure 9 shows selected interpreted layers (left) and their area-depth graph (right) for experiments 2 (A) to 5 (D) for a “window” of each model excluding the back-wall. The interpreted layers are four pre-growth layer boundaries (layers 1–4), the top pre-growth (layer 5), and the tops of the early (layer 6) and mid/late (layer 7) growth sequences. For illustration, the measurement of depth (D1) and excess area (A1) of layer one in experiment 2 is depicted (Figure 9A, left); this layer plots as point 1 in the area-depth graph (Figure 9A, right). We make the same measurements for all the other layers, and plot them in the area-depth graph (points 2–7). The best-fit line to the pre-growth tops (black dashed lines in Figure 9, right) has a depth intersect of 3 km in all experiments, which is consistent with the detachment depth of the experiments. The inverse of the slope of this line corresponds to the pre-growth displacement (Sp), and in all experiments Sp is ∼1.2–1.3 km. This is essentially the displacement of the thrust fault array in this window (Eichelberger et al., 2017), which as syn-tectonic sedimentation increases, gets more concentrated on thrust T1. The inverse of the slopes of the lines from the depth-intercept to the growth layers (red dashed lines to points 6 and 7 in Figure 9, right) give their displacement (Sg). What is interesting is how the displacement of the growth strata (Sg) decreases with syn-tectonic sedimentation (steeper red dashed lines from 9A to 9D, right), particularly in the mid/late growth sequence. The displacement of the top of the growth sequence (layer seven in Figure 9) is 0.75, 0.48, 0.16, and 0.057 km in experiments 2, 3, 4, and 5, respectively. Thus, syn-tectonic sedimentation produces less displacement and less strain of the growth strata. The area-depth graphs also highlight additional issues that can arise due to complexities associated with individual structures. In experiment 2, the top of the pre-growth strata (layer 5 in Figure 9A) does not fall on the best-fit line to the strata below. This is because of thickening of the pre-growth sequence between layers 4 and 5 in the footwall syncline associated to thrust T1, and possibly because of the back-thrust of the pop-up structure between 2 and 4 km (interpreted section, Figure 9A). There are, of course, some errors due to the proximity of the mobile left-wall, and the interpretation of the layer boundaries themselves is not everywhere straightforward. However, this analysis shows that the excess area technique is indeed applicable to our experimental results and produces consistent, accurate results.
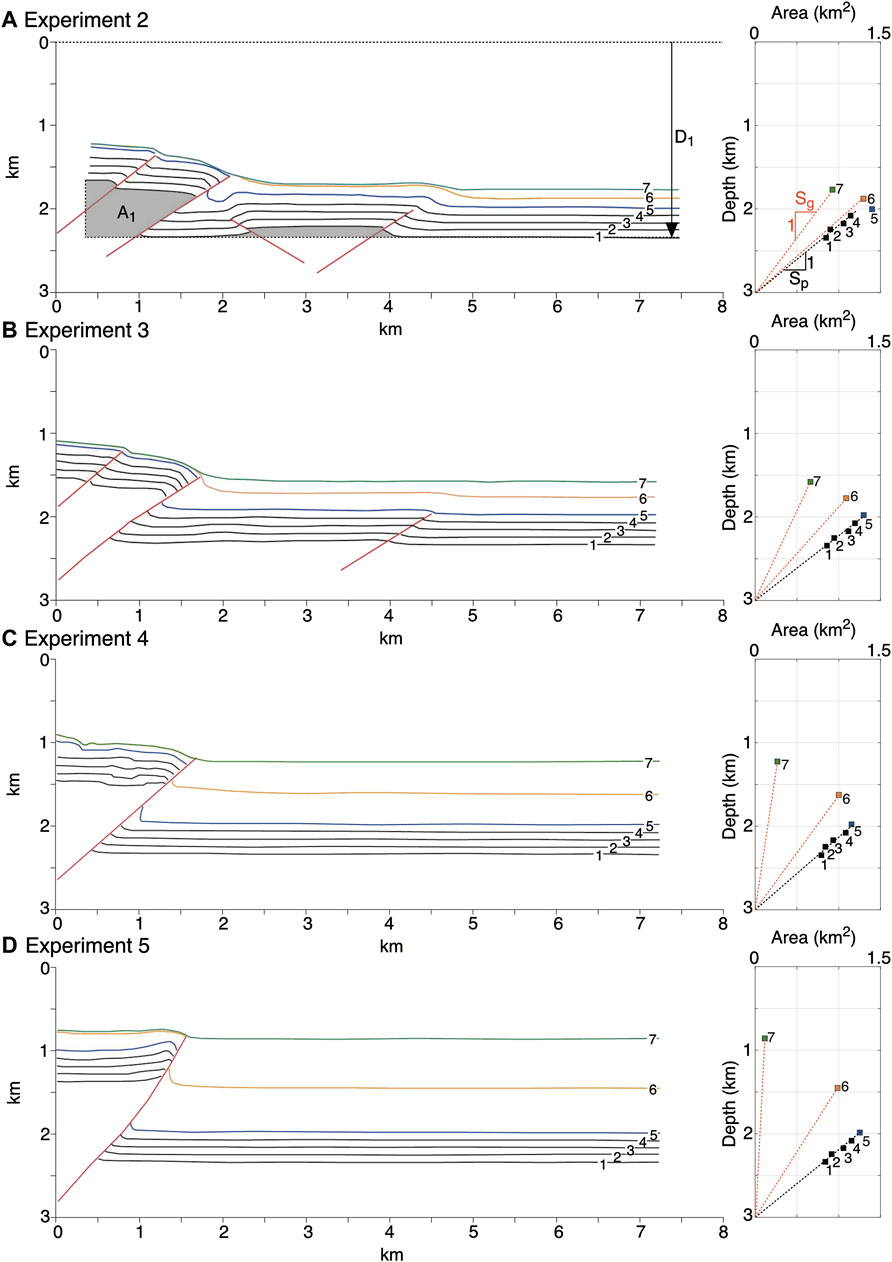
FIGURE 9. Interpretations (left) and excess area versus depth graphs (right) of experiments (A) 2, (B) 3, (C) 4, and (D) 5. The experimental detachment is at 3 km in these graphs, 1.3 km in undeformed sections. Four pre-growth layer boundaries (layers 1–4), the top pre-growth (layer 5), and the tops of the early (layer 6) and mid/late (layer 7) growth sequences are included. (A) shows how the depth (D1) and excess area (A1, grey polygon) of layer one are determined. This layer then plots as point 1 in the area-depth graph. The same measurements are taken for the other layers, which are then plotted in the area-depth graph (points 2–7). (A) also shows how the pre-growth displacement Sp, and growth displacement Sg are estimated from the area-depth graph. Sp and Sg are the inverse of the slopes of the black and red dashed lines, respectively.
Discussion and Conclusion
In this paper we have simulated, using the discrete element method, the growth of thrust wedges under increasing amounts/rates of syn-tectonic sedimentation. These experiments have allowed us to assess the influence that such sedimentation has on tectonics rather than the usual perspective of “tectonics and sedimentation” where the growth strata are some kind of passive recorder of fault or fold activity. We can perhaps think of them as “mechanical growth strata” as they interact with, and influence, the growing thrust wedge. While similar analogue and numerical studies have been undertaken previously, here we have examined the detailed interaction of sedimentation and tectonics at a high-resolution, allowing structural and stratigraphic relationships to be observed at the local, almost outcrop, scale.
The first-order result of these experiments is that they confirm that, indeed, syn-tectonic sedimentation can have a profound effect upon thrust wedge development (cf. Wu and McClay, 2011; Graveleau et al., 2012; Butler et al., 2019; Butler, 2020). In the experiment of thrust wedge development without syn-tectonic sedimentation (experiment 1), a forward-breaking sequence of thrust activity is seen: producing a typical thrust-wedge structure, consistent with many analogue, numerical and conceptual models (Figure 2; cf. Storti and McClay, 1995; Burbridge and Braun, 2002; Wu and McClay, 2011). In general, the inclusion of syn-tectonic sedimentation produces thrust wedges composed of fewer major forward-vergent thrusts and with only minor thrust activity in the foreland (experiments 2 to 5; Figures 3–6). In most models the sequence of thrust activity is complex and not simply forward-breaking. Very high syn-tectonic sedimentation (experiment 5) results in the formation of a single basin-bounding thrust fault and no thrust-wedge per se (Figure 6). Thus, with increasing syn-tectonic sedimentation, the frontal thrust has greater offset/displacement and overrides a much thicker package of earlier syn-tectonic sediments. Clearly, tectonics remains the driving force behind contraction and the formation of a thrust wedge (in nature and in the models). However, sedimentation clearly has a more local effect upon the nature of the wedge itself and particularly on structural style.
In a sense, these results for the dynamic development of thrust wedges are predictable/understandable from a minimum work perspective (e.g., Hardy et al., 2009; McBeck et al., 2020). In straightforward terms, minimum work is based on the principle that there is a continual tradeoff/balance between frictional and gravitational work during wedge growth, and that the “path” of minimum work or resistance is favoured during deformation (e.g., Masek and Duncan, 1998; Del Castello and Cooke, 2007; Cooke and Madden, 2014; McBeck et al., 2020). Without syn-tectonic sedimentation (or erosion), the minimum work model predicts propagation of thrust fault activity towards the foreland through time as a result of increasing topographic (gravitational) loads and frictional work on deformed hinterland faults. As regards our models, stated simply, with increasing syn-tectonic sedimentation, there is a “penalty” for propagating forward along the decollement to create outboard structures rather than simply uplifting or imbricating close to the moving end-wall. The physical basis for this “penalty” is that more (frictional and gravitational) work is required to displace a thicker pile of sediment, which thus favours reactivation of, or continued activity on, pre-existing faults that are overlain by less overburden (i.e., a thinner pile of sediment). Consequently, these experimental results support the idea that minimum work optimization techniques can provide critical insights into crustal tectonic evolution (e.g., Hardy et al., 1998; Masek and Duncan, 1998; Del Castello and Cooke, 2007; Cooke and Madden, 2014; McBeck et al., 2020).
A simple chronology, or sequence, of fault activity in our models is not observed. Out-of-sequence thrusting and folding occurs during overall foreland propagation of deformation. The detailed spatial and temporal activity of faults is complex and reflects the interaction between the development of topography, the contrast between basal (décollement) and internal coefficients of friction, and the loading effect of sedimentation. The key factor is the relative rates of sedimentation and tectonic deformation. As with all complex systems, these two rates cannot be considered independently. In particular, and the specific focus of this study, rates of sedimentation are shown to be important controls on fault activity both spatially and temporally. Sedimentation acts to increase gravitational and frictional work on a given fault, and therefore has the potential to “blanket” faults and render them inactive. However, sedimentation clearly does not “shut down” all faults, as many of the frontal thrusts here show continued activity while overriding the sedimented footwalls. Model results emphasise the complex, and subtle, feedbacks that can exist between tectonic and surficial mass transport processes.
At a more local, outcrop, scale the effects of contemporaneous sedimentation and tectonics are quite marked in our experiments. Figure 10 shows detailed zooms of the “thrust-front” in each of the models with syn-tectonic sedimentation. What is obvious is that a wide range of distinct geometries and relationships can be produced due solely to changes in the magnitude of syn-tectonic sedimentation. The first, obvious, effect is the increase in displacement/offset on one or two major faults with increasing syn-tectonic sedimentation. Secondly, and as a consequence, is the greater area and thickness of syn-tectonic sediments that are over-ridden at the thrust front. Thirdly, the main, frontal, thrust in each experiment also becomes steeper with increasing syn-tectonic sedimentation (compare Figures 10A–D).
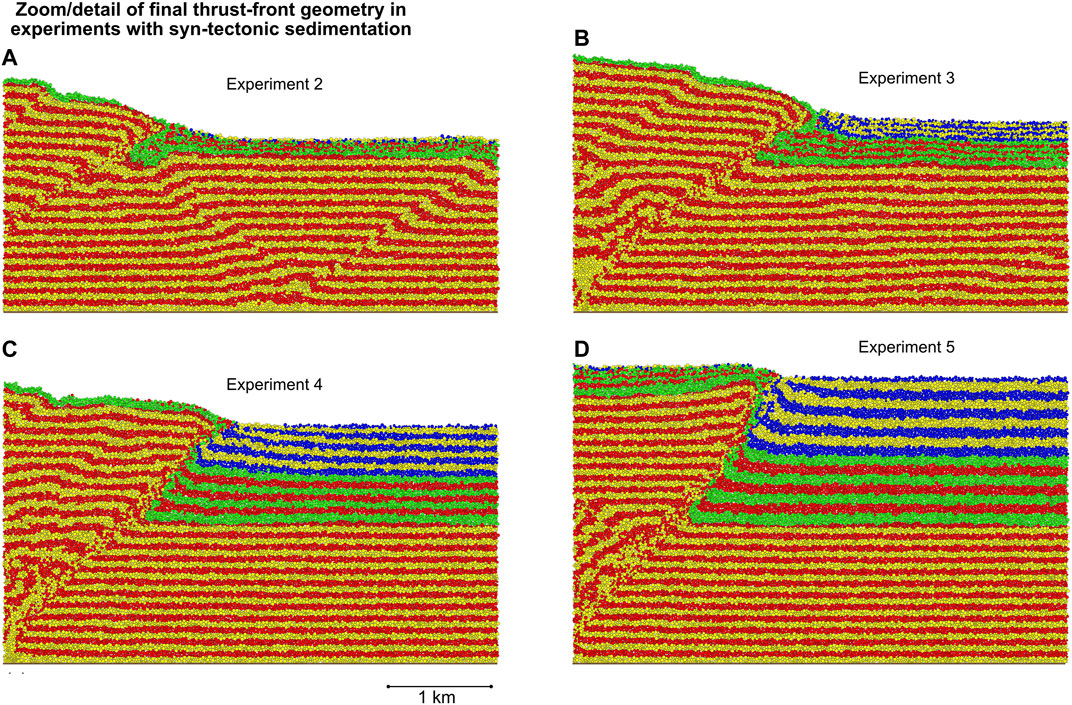
FIGURE 10. Zoom/detail of thrust front in all models (Experiments 2–5) with syn-tectonic sedimentation after 20% shortening at the end of the model runs. See text for discussion.
What is also clear from our results is that the manner in which sediments are introduced to analogue or numerical models is important. Many studies have included only hinterland sediment supply and/or diffusive erosion/sedimentation, or sedimentation that thins and is wedge-like towards the foreland (e.g., Selzer et al., 2007; Wu and McClay, 2011). This approach is entirely reasonable, but in a sense produces very straightforward, and perhaps biased, results. This is because by adding sediments to the wedge in this manner, deformation is being driven towards the foreland. On the other hand, basinal, banking aggradational sedimentation as implemented herein is a very different set-up/approach that produces a buffering effect on thrust propagation rather than a driving effect. Natural systems, most likely, lie somewhere between these extremes and we must consider both possibilities when examining exhumed, ancient basins. The objective of this study was not to compare our results directly to specific structures and, in addition, the total amount of displacement in our experiments (2.5 km) is low compared to natural orogenic belts. However, some general comparisons can be made. At a local level, Nichols (1987a, b) noted that in the Western External Sierras of the Pyrenees (N. Spain) complex, high-displacement frontal thrust structures were associated with localised thrust-front fanglomerates appearing to “buffer” forward propagation. At a much larger scale, Butler (2020) highlighted that in the northern Apennines thrust systems are ramp-dominated where syn-tectonic sedimentation was high. In contrast, in the southern Apennines, the Lagronegro allochthon is a high displacement structure (>65 km) as the foredeep basin received little sedimentation. Our experiments are consistent with these observations.
The excess-area analysis (Epard and Groshong, 1993) of our experimental results has tested its applicability in analysing thrust-fault arrays where we know the boundary conditions, depth to detachment and displacement (i.e., the answer). This serves to illustrate that its application to typical (incomplete) surface and subsurface geological data can provide robust estimates of several key parameters. Finally, these model results are only a first step in unravelling the complex interaction between sedimentation and tectonics. There are many other internal and external facets which can be important in conditioning the growth of a thrust wedge - climate change, erosion, isostasy, more complex mechanical stratigraphy, basal friction etc. These and other topics are subjects of ongoing research.
Data Availability Statement
The original contributions presented in the study are included in the article/Supplementary Material, further inquiries can be directed to the corresponding author.
Author Contributions
SH and NC collaborated equally on the writing of the paper. SH created many of the Figures, whilst their generation was a result of NC, SH coded the base code to run the models, NC coded the analysis and post-processing.
Conflict of Interest
The authors declare that the research was conducted in the absence of any commercial or financial relationships that could be construed as a potential conflict of interest.
Publisher’s Note
All claims expressed in this article are solely those of the authors and do not necessarily represent those of their affiliated organizations, or those of the publisher, the editors and the reviewers. Any product that may be evaluated in this article, or claim that may be made by its manufacturer, is not guaranteed or endorsed by the publisher.
Acknowledgments
Discussions with, and the patience of, many colleagues over many years is appreciated; thanks must go particularly to Dave Waltham for stimulating SH’s interest in numerical modelling. Discrete element modelling and visualisation was carried out using cdem2D, cdem and SSPX by the authors. We thank Validé in Stavanger for financial support to further develop the cdem program. Insightful comments of the reviewers are greatly appreciated as is BraseriaJavis for proving a Covid-safe environment in which to work remotely.
Supplementary Material
The Supplementary Material for this article can be found online at: https://www.frontiersin.org/articles/10.3389/feart.2021.742204/full#supplementary-material
References
Allen, M. P., and Tildesley, D. J. (1987). Computer Simulation of Liquids. Oxford, UK: Oxford Science Publications.
Benesh, N. P., Plesch, A., Shaw, J. H., and Frost, E. K. (2007). Investigation of Growth Fault bend Folding Using Discrete Element Modeling: Implications for Signatures of Active Folding above Blind Thrust Faults. J. Geophys. Res. 112, B03S04. doi:10.1029/2006JB004466
Bigi, S., Di Paolo, L., Vadacca, L., and Gambardella, G. (2010). Load and Unload as Interference Factors on Cyclical Behavior and Kinematics of Coulomb Wedges: Insights from Sandbox Experiments. J. Struct. Geol. 32, 28–44. doi:10.1016/j.jsg.2009.06.018
Botter, C., Cardozo, N., Hardy, S., Lecomte, I., and Escalona, A. (2014). From Mechanical Modeling to Seismic Imaging of Faults: A Synthetic Workflow to Study the Impact of Faults on Seismic. Mar. Pet. Geol. 57, 187–207. doi:10.1016/j.marpetgeo.2014.05.013
Botter, C., Cardozo, N., Hardy, S., Lecomte, I., Paton, G., and Escalona, A. (2016). Seismic Characterisation of Fault Damage in 3D Using Mechanical and Seismic Modelling. Mar. Pet. Geol. 77, 973–990. doi:10.1016/j.marpetgeo.2016.08.002
Bulnes, M., Poblet, J., Uzkeda, H., and Rodríguez-Álvarez, I. (2019). Mechanical Stratigraphy Influence on Fault-Related Folds Development: Insights from the Cantabrian Zone (NW Iberian Peninsula). J. Struct. Geol. 118, 87–103. doi:10.1016/j.jsg.2018.10.002
Burbidge, D. R., and Braun, J. (2002). Numerical Models of the Evolution of Accretionary Wedges and Fold-And-Thrust Belts Using the Distinct-Element Method. Geophys. J. Int. 148, 542–561. doi:10.1046/j.1365-246x.2002.01579.x
Butler, R. W. H., Maniscalco, R., and Pinter, P. R. (2019). Syn-kinematic Sedimentary Systems as Constraints on the Structural Response of Thrust Belts: Re-examining the Structural Style of the Maghrebian Thrust belt of Eastern Sicily. Ijg 138, 371–389. doi:10.3301/IJG.2019.11
Butler, R. W. H. (2020). Syn-kinematic Strata Influence the Structural Evolution of Emergent Fold-Thrust Belts. Geol. Soc. Lond. Spec. Publications 490 (1), 57–78. doi:10.1144/SP490-2019-14
Cardozo, N., and Allmendinger, R. W. (2009). SSPX: A Program to Compute Strain from Displacement/velocity Data. Comput. Geosci. 35, 1343–1357. doi:10.1016/j.cageo.2008.05.008
Chapman, B., Jost, G., and van der Pas, R. (2007). Using OpenMP : Portable Shared Memory Parallel Programming. Cambridge: The MIT Press.
Christophoul, F., Soula, J. C., Brusset, S., Elibana, B., Roddaz, M., Bessière, G., et al. (2003). Time, Place and Mode of Propagation of Foreland basin Systems as Recorded by the Sedimentary Fill: Examples of the Late Cretaceous and Eocene Retro-Foreland Basins of the north-eastern Pyrenees. Special Publication - Geological Society of London, 229–252. doi:10.1144/GSL.SP.2003.208.01.11
Cooke, M. L., and Madden, E. H. (2014). Is the Earth Lazy? A Review of Work Minimization in Fault Evolution. J. Struct. Geol. 66, 334–346. doi:10.1016/j.jsg.2014.05.004
Cundall, P. A., and Strack, O. D. L. (1979). A Discrete Numerical Model for Granular Assemblies. Géotechnique 29, 47–65. doi:10.1680/geot.1979.29.1.47
Dean, S. L., Morgan, J. K., and Fournier, T. (2013). Geometries of Frontal Fold and Thrust Belts: Insights from Discrete Element Simulations. J. Struct. Geol. 53, 43–53. doi:10.1016/j.jsg.2013.05.008
Dean, S., Morgan, J., and Brandenburg, J. P. (2015). Influence of mobile Shale on Thrust Faults: Insights from Discrete Element Simulations. Bulletin 99 (3), 403–432. doi:10.1306/10081414003
Del Castello, M., and Cooke, M. L. (2007). Underthrusting-accretion Cycle: Work Budget as Revealed by the Boundary Element Method. J. Geophys. Res. 112, B12404. doi:10.1029/2007JB004997
Egholm, D. L., Sandiford, M., Clausen, O. R., and Nielsen, S. B. (2007). A New Strategy for Discrete Element Numerical Models: 2. Sandbox Applications. J. Geophys. Res. 112, B05204. doi:10.1029/2006JB004558
Eichelberger, N. W., Nunns, A. G., Groshong Jr., R. H., and Hughes, A. N. (2017). Direct Estimation of Fault Trajectory from Structural Relief. Bulletin 101, 635–653. doi:10.1306/08231616065
Epard, J. L., and Groshong, R. H. (1993). Excess Area and Depth to Detachment. AAPG Bull. 77, 1291–1302. doi:10.1306/bdff8e66-1718-11d7-8645000102c1865d
Fillon, C., Huismans, R. S., van der Beek, P., and Muñoz, J. A. (2013). Syntectonic Sedimentation Controls on the Evolution of the Southern Pyrenean Fold-And-Thrust belt: Inferences from Coupled Tectonic-Surface Processes Models. J. Geophys. Res. Solid Earth 118, 5665–5680. doi:10.1002/jgrb.50368
Finch, E., Hardy, S., and Gawthorpe, R. (2004). Discrete-element Modelling of Extensional Fault-Propagation Folding above Rigid Basement Fault Blocks. Basin Res. 16, 467–488. doi:10.1111/j.1365-2117.2004.00241.x
Graveleau, F., Malavieille, J., and Dominguez, S. (2012). Experimental Modelling of Orogenic Wedges: A Review. Tectonophysics 538-540, 1–66. doi:10.1016/j.tecto.2012.01.027
Hardy, S., and Ford, M. (1997). Numerical Modeling of Trishear Fault Propagation Folding. Tectonics 16 (5), 841–854. doi:10.1029/97TC01171
Hardy, S., Duncan, C., Masek, J., and Brown, D. (1998). Minimum Work, Fault Activity and the Growth of Critical Wedges in Fold and Thrust Belts. Basin Res. 10, 365–373. doi:10.1046/j.1365-2117.1998.00073.x
Hardy, S., McClay, K., and Anton Muñoz, J. (2009). Deformation and Fault Activity in Space and Time in High-Resolution Numerical Models of Doubly Vergent Thrust Wedges. Mar. Pet. Geol. 26 (2), 232–248. doi:10.1016/j.marpetgeo.2007.12.003
Hardy, S. (2008). Structural Evolution of Calderas: Insights from Two-Dimensional Discrete Element Simulations. Geology 36, 927–930. doi:10.1130/G25133A.1
Hardy, S. (2011). Cover Deformation above Steep, Basement normal Faults: Insights from 2D Discrete Element Modeling. Mar. Pet. Geol. 28, 966–972. doi:10.1016/j.marpetgeo.2010.11.005
Hardy, S. (2015). The Devil Truly Is in the Detail. A Cautionary Note on Computational Determinism: Implications for Structural Geology Numerical Codes and Interpretation of Their Results. Interpretation 3 (4), SAA29–SAA35. doi:10.1190/INT-2015-0052.1
Hardy, S. (2016). Does Shallow dike Intrusion and Widening Remain a Possible Mechanism for Graben Formation on Mars? Geology 44, 107–110. doi:10.1130/G37285.1
Hardy, S. (2018). Coupling a Frictional-Cohesive Cover and a Viscous Substrate in a Discrete Element Model: First Results of Application to Thick- and Thin-Skinned Extensional Tectonics. Mar. Pet. Geol. 97 (32), 32–44. doi:10.1016/j.marpetgeo.2018.06.026
Hardy, S. (2019a). Discrete Element Modelling of Extensional, Growth, Fault‐propagation Folds. Basin Res. 31, 584–599. doi:10.1111/bre.12335
Hardy, S. (2019b). Novel Discrete Element Modelling of Gilbert-type delta Formation in an Active Tectonic Setting-First Results. Basin Res. 31, 77–91. doi:10.1111/bre.12309
Hardy, S. (2021). Discrete Element Modelling of Pit Crater Formation on Mars. Geosciences 11, 268. doi:10.3390/geosciences11070268
Holohan, E. P., Schöpfer, M. P. J., and Walsh, J. J. (2011). Mechanical and Geometric Controls on the Structural Evolution of Pit Crater and Caldera Subsidence. J. Geophys. Res. 116, B07202. doi:10.1029/2010jb008032
Masek, J. G., and Duncan, C. C. (1998). Minimum-Work Mountain Building. J. Geophys. Res. 103, 907–917. doi:10.1029/97JB03213
McBeck, J. A., Aiken, J. M., Mathiesen, J., Ben‐Zion, Y., and Renard, F. (2020). Deformation Precursors to Catastrophic Failure in Rocks. Geophys. Res. Lett. 47 (24), e2020GL090255. doi:10.1029/2020GL090255
McClay, K. R., and Whitehouse, P. S. (2004). “Analogue Modeling of Doubly Vergent Thrust Wedges,” in Thrust Tectonics and Hydrocarbon Systems: AAPG Memoir 82. Editor K. R. McClay (Tulsa, OK, United States: American Association of Petroleum Geologists), 184–206.
Mora, P., and Place, D. (1993). A Lattice Solid Model for the Nonlinear Dynamics of Earthquakes. Int. J. Mod. Phys. C 04, 1059–1074. doi:10.1142/S0129183193000823
Mora, P., and Place, D. (1994). Simulation of the Frictional Stick-Slip Instability. Pageoph 143, 61–87. doi:10.1007/BF00874324
Mugnier, J. L., Baby, P., Colletta, B., Vinour, P., Bale, P., and Leturmy, P. (1997). Thrust Geometry Controlled by Erosion and Sedimentation: A View from Analogue Models. Geology 25, 427. doi:10.1130/0091-7613(1997)025<0427:TGCBEA>2.3.CO;2
Naylor, M., Sinclair, H. D., Willett, S., and Cowie, P. A. (2005). A Discrete Element Model for Orogenesis and Accretionary Wedge Growth. J. Geophys. Res. 110, B12. doi:10.1029/2003jb002940
Nichols, G. J. (1987a). Syntectonic Alluvial Fan Sedimentations, Southern Pyrenees. Geol. Mag. 124 (2), I2l–133. doi:10.1017/s0016756800015934
Nichols, G. J. (1987b). The Structure and Stratigraphy of the Western External Sierras of the Pyrenees, Northern Spain. Geol. J. 22, 245–259. doi:10.1002/gj.3350220307
Noda, A., Koge, H., Yamada, Y., Miyakawa, A., and Ashi, J. (2020). Forearc Basin Stratigraphy Resulting from Syntectonic Sedimentation during Accretionary Wedge Growth: Insights from Sandbox Analog Experiments. Tectonics 39 (3), e2019TC006033. doi:10.1029/2019TC006033
Oger, L., Savage, S. B., Corriveau, D., and Sayed, M. (1998). Yield and Deformation of an Assembly of Disks Subjected to a Deviatoric Stress Loading. Mech. Mater. 27, 189–210. doi:10.1016/s0167-6636(97)00066-5
Place, D., Lombard, F., Mora, P., and Abe, S. (2002). Simulation of the Micro-physics of Rocks Using LSMearth. Pure Appl. Geophys. 159, 1911–1932. doi:10.1007/s00024-002-8715-x
Schreurs, G., Buiter, S. J. H., Boutelier, J., Burberry, C., and Callot, J.-P. (2016). Benchmarking Analogue Models of Brittle Thrust Wedges. J. Struct. Geol. 92, 116–139. doi:10.1016/j.jsg.2016.03.005
Schultz, R. A. (1996). Relative Scale and the Strength and Deformability of Rock Masses. J. Struct. Geol. 18, 1139–1149. doi:10.1016/0191-8141(96)00045-4
Selzer, C., Buiter, S. J. H., and Pfiffner, O-A. (2007). Sensitivity of Shear Zones in Orogenic Wedges to Surface Processes and Strain Softening. Tectonophysics 437 (1-4), 51–70. doi:10.1016/j.tecto.2007.02.020
Simpson, G. (2010). Formation of Accretionary Prisms Influenced by Sediment Subduction and Supplied by Sediments from Adjacent Continents. Geology 38 (2), 131–134. doi:10.1130/g30461.1
Smart, K. J., and Ferrill, D. A. (2018). Discrete Element Modeling of Extensional Fault‐related Monocline Formation. J. Struct. Geol. 115, 82–90. doi:10.1016/j.jsg.2018.07.009
Storti, F., and McClay, K. R. (1995). Influence of Syntectonic Sedimentation on Thrust Wedges in Analogue Models. Geology 23 (11), 999–1002. doi:10.1130/0091-7613(1995)023<0999:iossot>2.3.co;2
Storti, F., Salvini, F., and McClay, K. (1997). Fault-related Folding in Sandbox Analogue Models of Thrust Wedges. J. Struct. Geol. 19, 583–602. doi:10.1016/s0191-8141(97)83029-5
Strayer, L. M., Erickson, S. G., and Suppe, J. (2004). “Influence of Growth Strata on the Evolution of Fault‐related Folds: Distinct‐element Models,” in Thrust Tectonics and Hydrocarbon Systems. Editor K. McClay (Tulsa, OK, United States: American Association of Petroleum Geologists Memoir), 82, 413–437.
Thompson, N., Bennett, M. R., and Petford, N. (2010). Development of Characteristic Volcanic Debris Avalanche deposit Structures: New Insights from Distinct Element Simulations. J. Volcanol. Geothermal Res. 192, 191–200. doi:10.1016/j.jvolgeores.2010.02.021
van Gent, H. W., Holland, M., Urai, J. L., and Loosveld, R. (2010). Evolution of Fault Zones in Carbonates with Mechanical Stratigraphy - Insights from Scale Models Using Layered Cohesive Powder. J. Struct. Geol. 32, 1375–1391. doi:10.1016/j.jsg.2009.05.006
Willett, S. D., Beaumont, C., and Fullsack, P. (1993). Mechanical Model for the Tectonics of Doubly Vergent Compressional Orogens. Geology 21, 371–374. doi:10.1130/0091-7613(1993)021<0371:mmftto>2.3.co;2
Willett, S. D. (1999). Rheological Dependence of Extension in Wedge Models of Convergent Orogens. Tectonophysics 305, 419–435. doi:10.1016/s0040-1951(99)00034-7
Wu, J. E., and McClay, K. R. (2011). “Two-dimensional Analog Modeling of Fold and Thrust Belts: Dynamic Interactions with Syncontractional Sedimentation and Erosion,” in Thrust Fault-Related Folding: AAPG Memoir 94. Editors K. McClay, J. H. Shaw, and J. Suppe (Tulsa, OK, United States: American Association of Petroleum Geologists), 301–333.
Keywords: tectonics, sedimentation, modelling, thrust, faulting
Citation: Hardy S and Cardozo N (2021) Discrete Element Modelling of Sedimentation and Tectonics: Implications for the Growth of Thrust Faults and Thrust Wedges in Space and Time, and the Interpretation of Syn-Tectonic (Growth) Strata. Front. Earth Sci. 9:742204. doi: 10.3389/feart.2021.742204
Received: 15 July 2021; Accepted: 09 September 2021;
Published: 23 September 2021.
Edited by:
Alexander Cruden, Monash University, AustraliaReviewed by:
Julia Morgan, Rice University, United StatesPatrice Rey, The University of Sydney, Australia
Copyright © 2021 Hardy and Cardozo. This is an open-access article distributed under the terms of the Creative Commons Attribution License (CC BY). The use, distribution or reproduction in other forums is permitted, provided the original author(s) and the copyright owner(s) are credited and that the original publication in this journal is cited, in accordance with accepted academic practice. No use, distribution or reproduction is permitted which does not comply with these terms.
*Correspondence: Stuart Hardy, c3R1YXJ0LmhhcmR5QGljcmVhLmNhdA==