 Neil J. Tabor1
 John Geissman2,3*
 Paul R. Renne4,5
 Roland Mundil4
 William S. Mitchell III6Timothy S. Myers1
 Jacob Jackson2
 Cindy V. Looy7,8,9
 Renske P. Kirchholtes7,9
- 1Department of Earth Sciences, Southern Methodist University, Dallas, TX, United States
- 2Department of Geosciences, ROC 21, University of Texas at Dallas, Richardson, TX, United States
- 3Department of Earth and Planetary Sciences, University of New Mexico, Albuquerque, NM, United States
- 4Berkeley Geochronology Center, Berkeley, CA, United States
- 5Department of Earth and Planetary Science, University of California, Berkeley, Berkeley, CA, United States
- 6Department of Chemistry, University of California, Berkeley, Berkeley, CA, United States
- 7Department of Integrative Biology, University of California, Berkeley, Berkeley, CA, United States
- 8University Herbarium, University of California, Berkeley, Berkeley, CA, United States
- 9Museum of Paleontology, University of California, Berkeley, Berkeley, CA, United States
The Whitehorse Group and Quartermaster Formation are extensive red-bed terrestrial sequences representing the final episode of sedimentation in the Palo Duro Basin in north-central Texas, U.S.A. Regionally, these strata record the culmination of a long-term regression sequence beginning in the middle to late Permian. The Whitehorse Group includes beds of abundant laminated to massive red quartz siltstone to fine sandstone and rare dolomite, laminated to massive gypsum, and claystones, as well as diagenetic gypsum. The Quartermaster Formation exhibits a change from nearly equal amounts of thin planar and lenticular fine sandstone and laminated to massive mudstone in its lower half to overlying strata with coarser-grained, cross-bedded sandstones indicative of meandering channels up to 7 m deep and rare overbank mudstones. Paleosols are absent in the Upper Whitehorse Group and only poorly developed in the Quartermaster Formation. Volcanic ash-fall deposits (tuffs) present in uppermost Whitehorse Group and lower Quartermaster Formation strata permit correlation among five stratigraphic sections distributed over ∼150 km and provide geochronologic age information for these rocks. Both the Whitehorse Group and Quartermaster Formation have traditionally been assigned to the late Permian Ochoan (Changhsingian) stage, and workers assumed that the Permian-Triassic boundary is characterized by a regionally significant unconformity. Chemostratigraphic or biostratigraphic evidence for this age assignment, however, have been lacking to date. Single zircon U-Pb CA-TIMS analyses from at least two distinct volcanic ash fall layers in the lower Quartermaster Formation, which were identified and collected from five different localities across the Palo Duro Basin, yield interpreted depositional ages ranging from 252.19 ± 0.30 to 251.74 ± 0.28 Ma. Single zircon U-Pb CA-TIMS analyses of detrital zircons from sandstones located only a few meters beneath the top of the Quartermaster Formation yield a range of dates from Mesoproterozoic (1418 Ma) to Middle Triassic (244.5 Ma; Anisian), the latter of which is interpreted as a maximum depositional age, which is no older than Anisian, thus indicating the Permian-Triassic boundary to lie somewhere within the lower Quartermaster Formation/upper Whitehorse Group succession. Stable carbon isotope data from 180 samples of early-burial dolomicrite cements preserve a chemostratigraphic signal that is similar among sections, with a large ∼−8‰ negative isotope excursion ∼20 m beneath the Whitehorse Group-Quartermaster Formation boundary. This large negative carbon isotope excursion is interpreted to be the same excursion associated with the end-Permian extinction and this is in concert with the new high precision radioisotopic age data presented and the fact that the excursion lies within a normal polarity stratigraphic magnetozone. Dolomite cement δ13C values remain less negative (between about −5 and −8 permil) into the lower part of the Quartermaster Formation before becoming more positive toward the top of the section. This long interval of negative δ13C values in the Quartermaster Formation is interpreted to represent the earliest Triassic (Induan) inception of biotic and ecosystem “recovery.” Oxygen isotope values of dolomicrite cements show a progressive trend toward more positive values through the boundary interval, suggesting substantially warmer conditions around the end-Permian extinction event and a trend toward cooler conditions after the earliest Triassic. Our observations on these strata show that the paleoenvironment and paleoclimate across the Permian-Triassic boundary in western, sub-equatorial Pangea was characterized by depositional systems that were not conducive to plant preservation.
Introduction
A continuous sedimentary record across the Permian-Triassic boundary (PTB) has yet to be identified and well-documented in continental and/or paralic basins of North America. The absence of such a record is thought to reflect two general observations. First, the upper Permian and Lower Triassic continental strata in North America typically lack faunas or floras that provide a high-resolution biostratigraphy for correlation to marine strata, in which the biostratigraphy was developed that defines the Permian-Triassic boundary (e.g., Brookfield et al., 2003). Second, a major sea-level fall in the Early Triassic resulted in erosion of the PTB sedimentary record in many paralic and shallow marine sedimentary basins (e.g., Hallam and Wignall, 2000), resulting in major regional unconformities in many paralic and continental sections. Although continental biostratigraphy has seen great progress in correlating uppermost Paleozoic terrestrial stratigraphic sequences over recent years (Lucas, 2004; Sidor et al., 2005; Benton, 2012), much of that progress has been achieved using vertebrate biostratigraphy and many Permian-Triassic sedimentary basins are barren with respect to these fossils. However, an important characteristic of the PTB recognized in complete marine as well as several terrestrial sections across the world is a large negative excursion in δ13C values associated with the end-Permian biotic crisis and is closely associated with the PTB (e.g., Korte and Kozur, 2010). Although not all perceived negative carbon isotope excursions in the vicinity of the Permian-Triassic boundary are diagnostic evidence of the end-Permian biotic crises (e.g., Tabor et al., 2007), chemostratigraphy may prove useful for locating the PTB in unfossiliferous sections, especially if additional chronostratigraphic information is available.
We present lithostratigraphic, petrographic, mineralogic, stable isotope, magnetic polarity stratigraphy and U-Pb zircon geochronology data from strata of the Whitehorse Group and Quartermaster Formation exposed at five different study localities distributed across ∼150 km of the Palo Duro Basin, northwest Texas, U.S.A. (Figure 1). A fifth section (Clarendon) was only sampled for U-Pb zircon geochronologic analyses and magnetic polarity stratigraphy. Facies models are developed to reconstruct changing paleoenvironments that define a long-term retrogradational cycle moving from continental salt-lake and sand/mud-flat to fluvial depositional systems. The carbon and oxygen isotope compositions of calcite and dolomite cements were analyzed to evaluate their potential as a chemostratigraphic tool and paleoenvironmental proxy. Petrographic inspection and δ18O vs. δ13C arrays suggest that calcite cement is not applicable to chemostratigraphy or paleoenvironmental reconstruction across the Permian-Triassic boundary section at this time, but that dolomite cements likely preserve an original record of depositional conditions. Dolomite δ13C chemostratigraphic data show a large, 6–8‰, negative isotope excursion in the upper part of the Whitehorse Group. This negative isotope excursion is largely recorded in strata of normal magnetic polarity. In conjunction with high-precision U-Pb zircon radioisotopic age data from volcanic ash fall deposits preserved within the stratigraphic succession that provide age estimates that cluster around 251.9 Ma, the data reported here are interpreted to indicate that the Permian-Triassic extinction event and subsequent Early Triassic biotic recovery are preserved in uppermost Permian and Lower Triassic strata (Whitehorse and Quartermaster strata) of the Palo Duro Basin. Oxygen isotope values of dolomite cements suggest very warm conditions during and immediately following the PTB, with gradually cooling conditions into progressively younger, Lower Triassic rocks which, coincidentally, also become dominated by calcite cements instead of dolomite cements. The implications of this newly discovered PTB sequence are considered in the context of other terrestrial and marine boundary sections and discussed in the context of the paleoclimate and paleoecology of the end-Permian extinction.
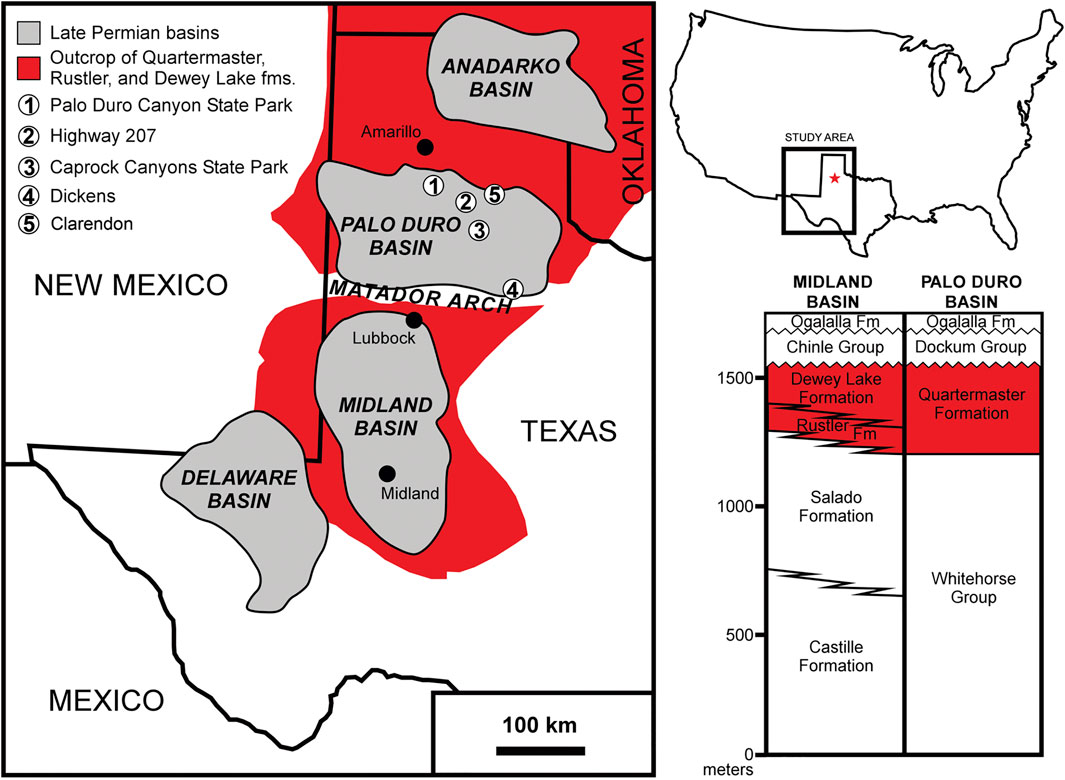
FIGURE 1. Location map of study area and generalized stratigraphy for the uppermost Permian to lowermost Triassic strata studied. Gray regions represent Late Permian basins that accommodated upper Permian strata in Oklahoma, west Texas and eastern New Mexico whereas the red areas represent the extent of outcrop of uppermost Permian to lowermost Triassic strata, including the Quartermaster, Rustler and Dewey Lake formations. Major cities are located by the position of black circles. White circles with numerals in them locate the different outcrop exposures examined in this study: 1 = Palo Duro Canyons State Park, 2 = Highway 207 roadside outcrop, 3 = Caprock Canyons State Park, 4 = Dickens roadside outcrop (State Highway 114/82), 5 = Clarendon. Permian exposures associated within the Palo Duro Basin include the upper part of the Whitehorse Group and the Quartermaster Formation, both of which were previously thought to be “Ochoan” in age and which are unconformably overlain by Norian-age (Upper Triassic) strata of the Dockum Group. See text for discussion.
Background
Stratigraphy of the Palo Duro Basin
In the Palo Duro Basin, the Whitehorse Group is primarily composed of gypsiferous red sandstone and mudstone, gypsum, and dolomite deposits (Gustavson et al., 1982). Equivalent strata in the subsurface are referred to as the Alibates Formation (Figure 1). The Whitehorse (Alibates) Group is equivalent to the upper part of the Rustler Formation in the Midland Basin in west Texas and southeast New Mexico (Dixon, 1967) and is probably equivalent to the Doxey Shale in the Anadarko Basin in north Texas and western Oklahoma (Johnson, 1978).
The Quartermaster Formation applies only to surface exposures of strata across the Texas Panhandle that conformably overlie the Whitehorse Group. The same strata in the subsurface are referred to as the Dewey Lake Formation (Johnson, 1978). The lower part (∼20–30 m) of the Quartermaster Formation is typically characterized by a red-bed sequence of thin-bedded mudstones, siltstones and sandstones. The upper Quartermaster Formation, however, is composed of red sandstones and mudstones organized in large-scale clinoforms that are interpreted as prograding sub-aqueous delta-front or laterally migrating meandering stream deposits. The Quartermaster (Dewey Lake) Formation is disconformably overlain by Upper Triassic Dockum (Chinle in New Mexico) Group strata in the Palo Duro Basin (Figure 1).
For this work we have focused our attention on four separate stratigraphic successions of the upper Whitehorse and Quartermaster rocks, including, from south-to-north, the Dickens section, the Caprock Canyons section, the Highway 207/Red-Rocks Ranch section, and Palo Duro Canyon section (Figure 1). A fifth section, near Clarendon (Figure 1), was sampled for geochronologic and magnetic polarity stratigraphy purposes. In their modern context, these four sections studied in detail compose an ∼150 km-long transect of strata exposed along the edges of the famous “Llano Estacado,” or “Staked Plain,” which is a series of 50–100 m high palisades and canyonlands exposed by headward erosion of streams through the Quaternary Blackwater Draw Formation, the Miocene Ogallala Formation caprock, Triassic Dockum Group, and the underlying Quartermaster Formation and Whitehorse Group strata (Figure 2).
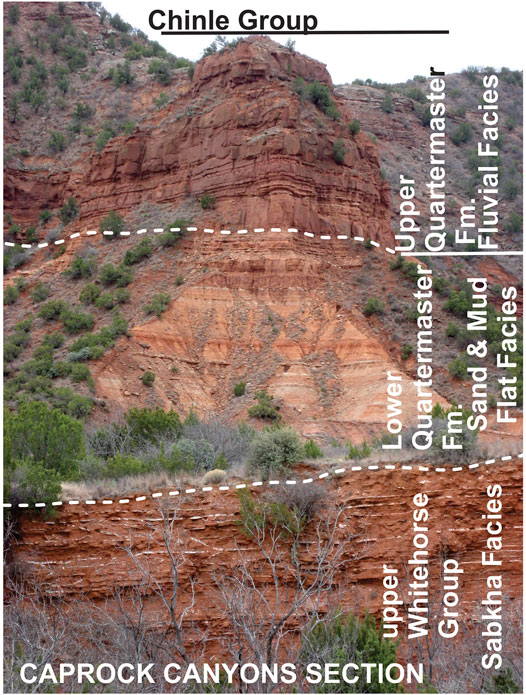
FIGURE 2. Outcrop photograph of Whitehorse Group and Quartermaster Formation strata exposed in Caprock Canyons State Park near the town of Quitaque, TX U.S.A. The Whitehorse Group strata are equivalent to the salt-lake facies belt (sabkha facies). The lower ∼31 m of the Quartermaster Formation make up the sand-flat facies belt, and the overlying ∼75 m of the Quartermaster Formation in this exposure make up the fluvial facies belt. See text for discussion.
Previous Paleomagnetic/Polarity Stratigraphy Studies
In a regional study of Permian age sedimentary rocks in the American Southwest, Peterson and Nairn (1971) reported data from one site in what they referred to as the Dewey Lake Formation, exposed near Carlsbad, New Mexico. The site yielded a north-northwest declination and shallow positive inclination magnetization estimated mean direction (thus normal polarity). Overall, the study reported few examples of progressive demagnetization behavior and no supporting rock magnetic data.
The initial investigation of strata of what were assumed to be entirely of the Quartermaster Formation (again referred to as the Dewey Lake Formation) in west Texas were reported by Molina-Garza et al. (1989). The goal of that study, conducted in the Palo Duro Canyon and vicinity, was to establish an approximate age of the end of the late Paleozoic long reverse polarity (super)chron (Kaiman superchron), given that recent K-Ar age determinations had been carried out on biotite in the volcanic ash deposits of west Texas (Kolker and Fracasso, 1985). These age determinations, ranging from ∼261 to ∼251 Ma, were associated with relatively low precision and inherently biased toward older values. Molina-Garza et al. (1989) showed that these strata yielded interpretable paleomagnetic data of dual polarity, with a remanence largely carried in hematite. Overall, four magnetozones, beginning with one of reverse polarity, were identified in the sequence. The volcanic ash deposit sampled by Kolker and Fracasso (1985) was located within the older normal polarity magnetozone at each of the three sections sampled. Molina-Garza et al. (1989) reported an estimated (reverse polarity) mean direction, based on data from 16 sites of Decl. = 152.4o, Incl. = -11.1o, a95 = 5.9o, k = 39.5. This mean direction, uncorrected for any potential inclination shallowing related to compaction/diagenesis processes, provides an estimated paleolatitude of about 6oN, with associated errors.
Molina-Garza et al. (2000) reported data from the Dewey Lake Formation exposed at the Maroon Cliffs near Carlsbad, southeast New Mexico. They reported a N-R-N polarity magnetozone sequence, with the reverse magnetozone being confined to a stratigraphically thin interval. By correlation with a continuous drill core, which contains a volcanic ash deposit, obtained some 15 km south of the Maroon Cliffs section, Molina-Garza et al. (2000) proposed that the top of their sampled section was some 20 m below the volcanic ash deposit.
Steiner (2011) provided a summary of work on strata of the Whitehorse Group and Quartermaster Formation in west Texas and laterally equivalent strata in southeast New Mexico. Actual data were shown from Quartermaster Formation strata (again referred to as Dewey Lake Formation) exposed as the upper part of the Dickens section. Steiner (2011) showed that the thick (>0.5 m) volcanic ash deposit of this section lies in a reverse polarity magnetozone with much of the remaining sampled section defining a normal polarity magnetozone. This contribution also refers to data from the Quartermaster Formation (referred to as Dewey Lake) exposed at Caprock Canyons, but no data are actually shown, other than an interpreted magnetic polarity stratigraphy and paleomagnetic pole positions derived from an unreported number of sampled sites. In the reported Caprock Canyons magnetic polarity stratigraphy, a lower volcanic ash deposit lies in a normal polarity magnetozone and the upper volcanic ash deposit is interpreted to lie in a reverse polarity magnetozone. On the basis of the graphically plotted paleomagnetic pole positions and the interpreted magnetic polarity stratigraphy as compared with results from several sections of middle to upper Permian to Lower (?) Triassic strata on different continents, Steiner (2011) proposed that the age of the Quartermaster Formation (referred to as Dewey Lake) in northwest Texas is early late Permian (Wujiapingian Stage) to early latest Permian (into the Changhsingian Stage). Several in preparation studies are listed in the references for Steiner (2011), but we are not aware of their publication.
Methods
Sedimentology and Stratigraphy
Stratigraphic sections presented here were measured and described following standardized field geology methods (e.g., Compton, 1985). Beds were delineated by recognizable differences in color, composition, sedimentary grain size, sedimentary structure, sedimentary architecture, and were measured using a 150 cm high Jacob’s staff mounted with a topographic Abney level while paying particular attention to the upper contacts between beds as descriptions were made upward through the stratigraphic succession. In particular, this work sought to document approximations of the dominant sedimentary grain size, color, sedimentary structure and sedimentary architecture as well as the contact relationships of bedding contacts which were observed amongst the strata in the sections in Palo Duro State Park, Highway 207, Caprock Canyons State Park, and Texas State Highway 82 (i.e. Dickens) outcrops. Schematic stratigraphic sections for these sections are presented as Supplementary Figures S1–S5. They are not presented in the main text because the emphasis of this work is to demonstrate the existence of the Permian-Triassic boundary within the Palo Duro Basin. The stratigraphic sections in Supplementary Figures S1–S5 provide an accurate representation of the dominant sedimentary grain size, color, sedimentary structure and sedimentary architecture as well as the contact relationship of bedding contacts that are observed among the strata at these sections.
Mineralogy and Geochemistry
Fresh hand samples were collected at each section by excavating ∼30 cm into the outcrop face. Samples were thin sectioned and examined petrographically using a transmitted polarizing light microscope. Powders used for X-ray diffraction analysis of carbonate mineralogy and analysis of carbonate δ13C and δ18O were drilled from hand samples using a rotary Dremel tool.
The carbonate mineralogy of each powdered sample was determined by X-ray diffraction (XRD) analysis at SMU using a Rigaku Ultima III X-ray diffractometer with a step size of 0.05° over a range of 27°–32° 2θ. The relative abundance of calcite and dolomite was determined using the ratio of the background-subtracted peak intensities of the 001 d(hkl) for the two minerals (3.03–3.04Å for calcite, 2.88–2.89Å for dolomite).
Methods for carbonate dissolution and extraction of CO2 are based on empirically determined reaction times and temperatures for calcite and dolomite (Table 1; Al-Aasm et al., 1990). Samples containing only calcite were reacted with 100% orthophosphoric acid at 25°C for 2 h and cryogenically purified to produce CO2 (McCrea, 1950). Samples containing both calcite and dolomite were reacted for 2 h, cryogenically purified for 30 min to remove the CO2 gas evolved, then returned to the 25°C water bath and allowed to react for a further 24 h. After 24 h, the gases evolved were evacuated for 30 min, and the samples were transferred to a 50°C water bath for 4 h and then cryogenically purified to isolate CO2. Samples containing only dolomite were reacted for 26 h at 25°C, and the evolved gasses were evacuated for 30 min. Then the samples were allowed to react for 4 h at 50°C, and the evolved gasses were cryogenically purified to isolate CO2. The carbon and oxygen isotope composition of CO2 evolved from both the 25°C and 50°C reactions was measured at SMU using a Finnigan MAT 252 or MAT 253 isotope ratio mass spectrometer and is reported here in per mil (‰) units relative to the PeeDee Belemnite standard (PDB; Craig, 1957).
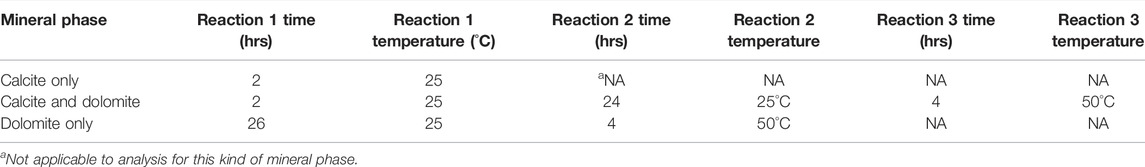
TABLE 1. Parameters used for extraction of CO2 from calcite and dolomite phases.
Magnetic Polarity Stratigraphy
Samples for magnetic polarity stratigraphy were typically collected by either drilling cores using a portable field drill with a non-magnetic diamond bit or as oriented block samples. We concentrated our sampling on hematitic siltstones and fine sandstones wherever possible, as previous work (e.g., Molina Garza et al., 1989; Molina Garza et al., 2000; Steiner, 2011) demonstrated that these rock types in this general area yield highly interpretable demagnetization data. In the case of field drilling, seven to 12+ independently-oriented core samples were typically obtained from each suitable bed at each locality. Core samples were processed into standard 2.2 cm high specimens for remanence and rock magnetic measurements. In the latter case, stratigraphic intervals lacking beds suitable for drilling or in sensitive areas (i.e. Palo Duro Canyon State Park), oriented blocks samples of suitable size were obtained by marking the orientation of any flat surface of a block that could be removed from the outcrop. At some sections, at least five oriented blocks were obtained from a single (<0.5 m) stratigraphic interval. At the Palo Duro Canyon section, oriented blocks were collected in succession, with sampling distance typically about 0.5 m. The oriented block samples were typically recut into multiple ∼8 cm3 cubic-like specimens using a non-magnetic diamond saw blade.
Remanence measurements were made on either a 2G Enterprise, DC SQUID, three-axis pulse cooled superconducting rock magnetometer, interfaced with an automated specimen handler and an on-line alternating field (AF) degausser system, or JR5A or JR6A AGICO spinner magnetometers. The principal magnetic phase in Whitehorse Group and Quartermaster Formation rocks is hematite and progressive thermal demagnetization was carried out and used an ASC TD48, dual zone thermal demagnetizer, involving 10–20 steps to maximum laboratory unblocking temperatures of 680°C (+/−). Selected, suitably indurated specimens were subjected to progressive chemical demagnetization (Collinson, 1975; Henry, 1979). To assure uniformity of leaching of authigenic hematite by reagent grade HCl, the surface area of the specimens was increased by making thin slices in the sides of the specimens with a fine, non-magnetic diamond saw. Specimens were incrementally leached over progressively longer amounts of time until the remanence remaining was less than 1% of the natural remanent magnetization (NRM) or until the specimen began to disintegrate to where it could no longer be measured. Acquisition of isothermal remanent magnetization (IRM) and backfield demagnetization of saturation IRM utilized an ASC multi-coil impulse magnet system. Three component thermal demagnetization of IRM acquired in different DC fields followed the method of Lowrie (1990). Anisotropy of magnetic susceptibility (AMS) determinations were made using a KLY-3S AGICO automated magnetic susceptibility device. All remanence measurements and demagnetization procedures, with the exception of chemical leaching, were performed in a magnetic shield (∼9 m x ∼7 m x ∼3 m) constructed by Lodestar Magnetics. Measurements of the bulk magnetic susceptibility as a function of continuous heating (to about 680°C)/cooling were made with an AGICO MFK1-A susceptibility instrument equipped with a CS-4 furnace apparatus. Additional details regarding methods utilized in this study may be found in Collins (2014) and Jackson (2016).
Results of progressive demagnetization were inspected using orthogonal demagnetization diagrams (Zijderveld, 1967) and the directions of magnetization components identified by the colinearity of several demagnetization data points determined using principal components analysis (Kirschvink, 1980), typically using the Remasoft software provided by AGICO. Magnetization directions at the site level were estimated as mean directions using as many independent observations as accepted, following the method of Fisher (1953). These estimated site-mean magnetization directions are transformed into virtual geomagnetic poles (VGPs), which then can be transformed into rotated VGP latitudes relative to a paleomagnetic pole position for North America for the time of the Permian-Triassic transition and plotted on stratigraphic columns to show the magnetic polarity stratigraphy of each section (Opdyke and Channell, 1996). Estimated paleomagnetic pole positions for the late Permian/Early Triassic for North America (e.g., Torsvik et al., 2012; their Table 2, APWP for Laurentia, corrected for inclination shallowing in sedimentary rocks: 260 Ma: 54.9 N, 125.4E, a95 = 3.5o; 250 Ma: 53.1 N, 114.8 E, a95 = 13.6o; 240 Ma: 53.2N, 115.3 E, a95 = 4.7o; their Table 11, Global APWaP in North America coordinates: 260 Ma: 56.1N, 128.0 E a95 = 2.6o; 250 Ma: 55.8N, 126.6 E, a95 = 3.6o; 240 Ma: 55.5N, 118.1E, a95 = 3.6o) are such that normal polarity magnetizations in Whitehorse Group and Quartermaster Formation strata in west Texas should have a north-northwest declination and shallow to moderate positive inclination.
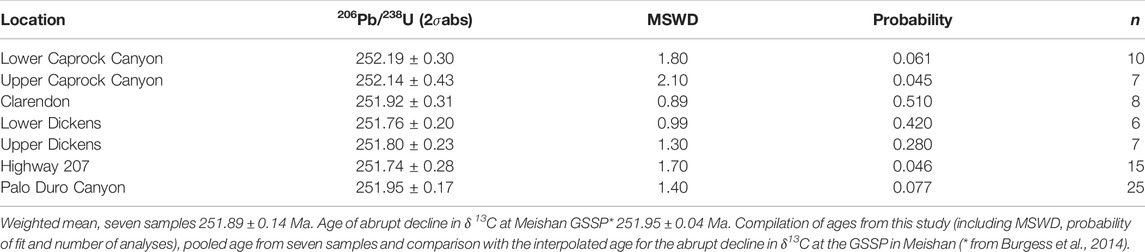
TABLE 2. Summary of U-Pb zircon isotopic age results (in MA).
U-Pb Zircon Geochronology
U-Pb zircon CA-TIMS analytical techniques are described in detail in Mundil et al. (2004) and adaptations and calibrations pertaining to this study in Mitchell (2014). Zircons from sedimentary rocks and volcanic ash deposits were separated using standard mineral separation techniques. Selected zircon crystals were subsequently annealed at 850°C for 48 h and chemically abraded for 8–12 h at 220°C in HF (Mattinson, 2005) followed by HF dissolution and mixing with tracer solution, ion exchange chemistry (where indicated) and thermal ionization mass spectrometry (Mundil et al., 2004; Mitchell, 2014). The utilized tracer solutions were repeatedly calibrated against standard solutions and natural zircon standards at the Berkeley Geochronology Center (see Mundil et al., 2004; Mitchell, 2014 for methods and results). Additional calibrations against artificial age solutions made available by the EARTHTIME initiative suggest that our U-Pb zircon ages are accurate within the 1 permil level (for details see Irmis et al., 2011, Mitchell, 2014; Griffis et al., 2018). In addition, the 202Pb-205Pb-233U-235U spike mixed at the Berkeley Geochronology Center (BGC) was calibrated against replicate analyses of Temora 2 (collected by Black et al., 2004) zircon yielding a weighted mean of 417.69 ± 0.17 Ma (n = 10, MSWD 1.2, 0 rejects), which is consistent with the age of 417.43 ± 0.06 Ma (n = 11, MSWD = 0.8) reported by (Davydov et al., 2010) using the EARTHTIME 535 tracer. The 100 Ma EARTHTIME solution yielded a mean age of 100.247 ± 0.040 Ma (n = 7, MSWD 1.5, 0 rejects).
Mass spectrometric data were reduced using Isoplot (Ludwig, 2008) and Tripoli and U-Pb Redux (Bowring et al., 2011; McLean et al., 2016), and include corrections for procedural common Pb, spike Pb, mass fractionation, oxygen isotope interference for UO2, and initial 230Th disequilibrium. Numerical age estimates for each sample are reported as weighted mean 206Pb/238U ages using the youngest subset with a permissible probability of fit (>0.05). Dispersion of 206Pb/238U ages suggests that residual Pb loss occurs (most notably in OCH12-7) and that slightly older crystals, predating the eruption age, are present in most samples. Analytically discordant ages (resolved from the Concordia curve including errors on λ235U and λ238U), as well as analyses with elevated common Pb (>3 pg) and elevated uncertainties (>2% on 206Pb/238U) are reported but excluded from the calculation of the mean. Ages are reported at the 2σ level. Results from U-Pb single zircon CA-TIMS analyses are summarized in Table 2 from the seven samples analyzed and presented in detail in Table 3.
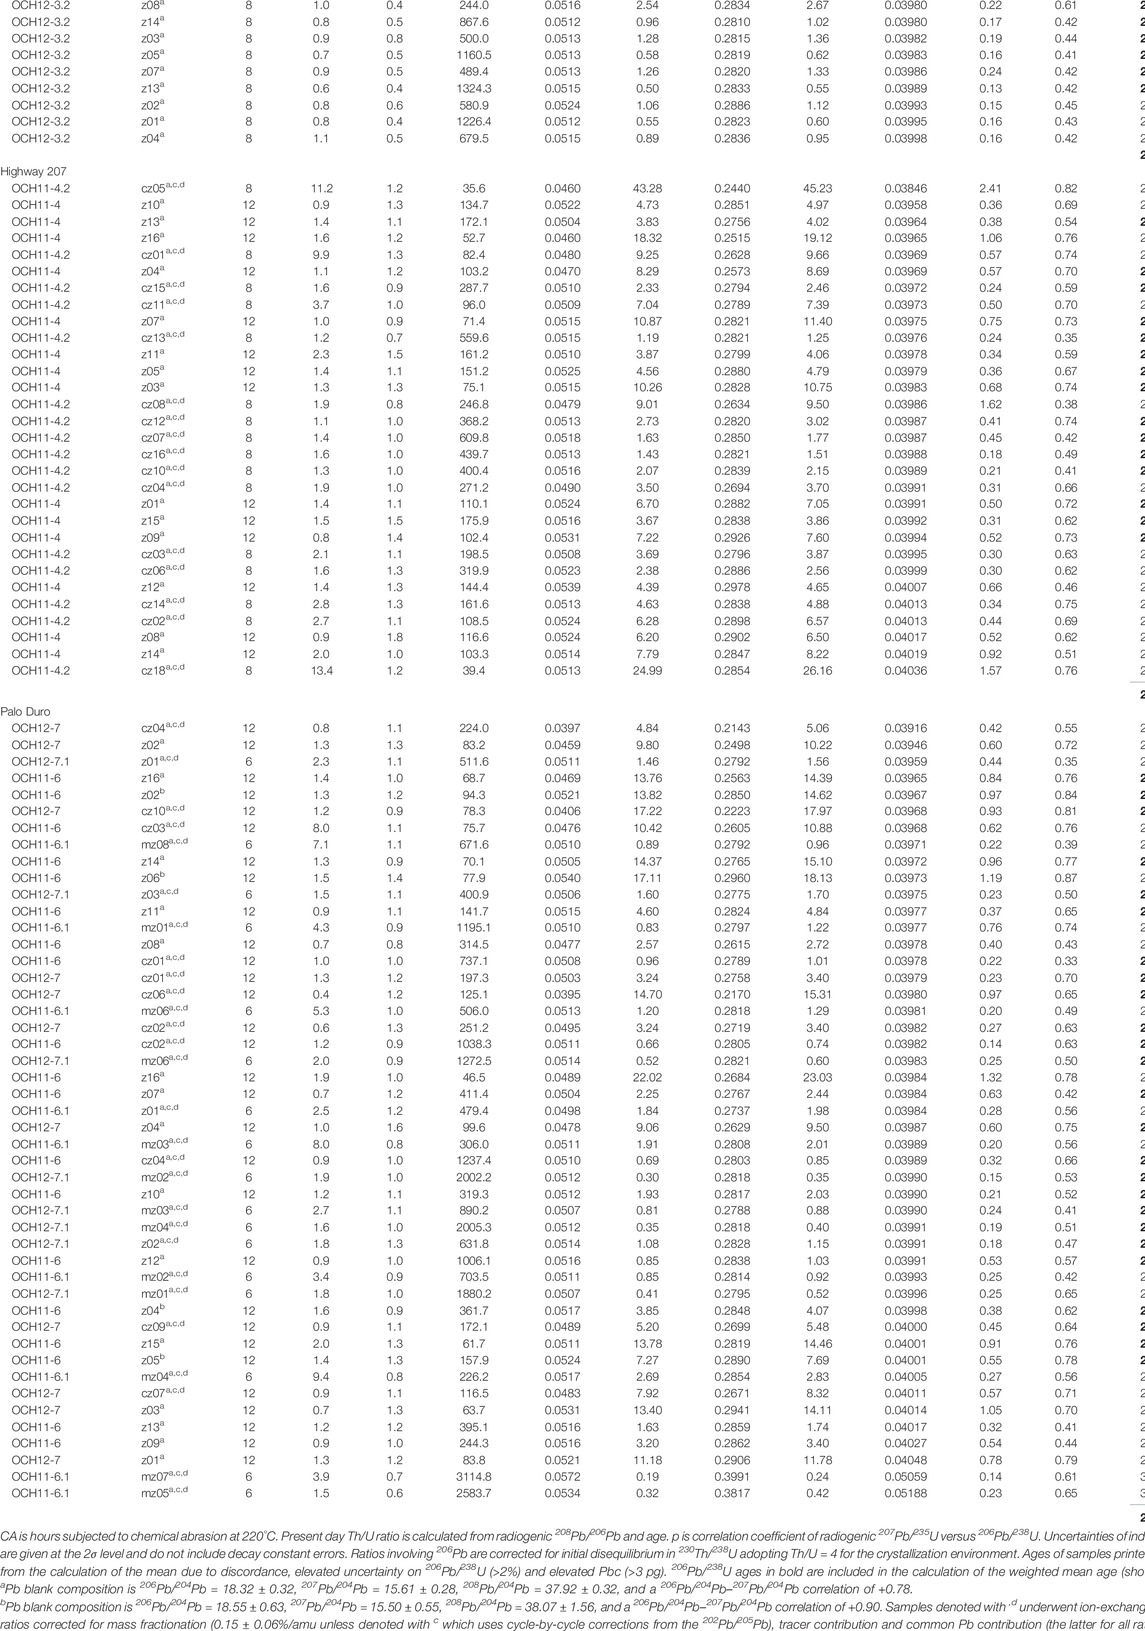
TABLE 3. U-Pb isotopic data from individual zircon crystals from each of the sampling locations discussed in this study.
Results
Field Sedimentology
The composite stratigraphic thicknesses of sections measured at the Palo Duro Canyon, Highway 207, Caprock Canyon, and Dickens localities (Figure 1) are 63, 28, 125, and 45 m, respectively. A comparison of rock types, bedding characteristics, sedimentary structures, and paleocurrent directions allows separation of the upper Whitehorse Group and Quartermaster Formation into salt-lake, sand-flat and fluvial facies belts (or associations). The depositional facies within each of the facies belts are summarized in Tables 4, 5, 6 and examples of all three facies belts exposed within an outcrop at the Caprock Canyons State Park section are shown in Figure 2 (see also Supplementary Figures S1–S5).
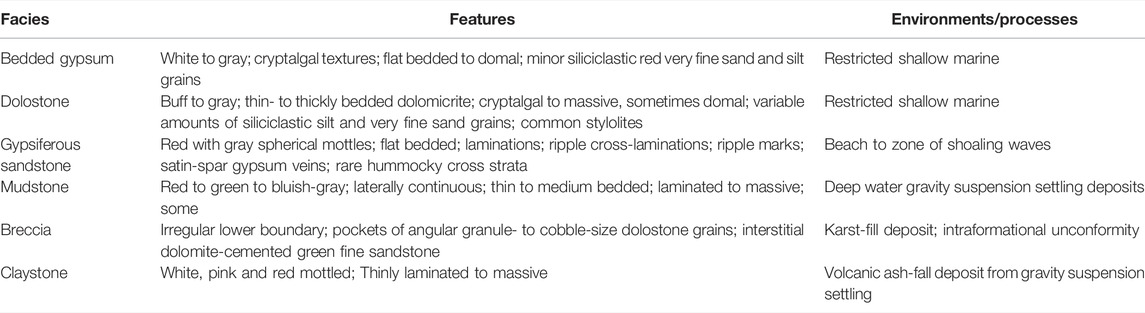
TABLE 4. Sebkha (salt lake) facies.
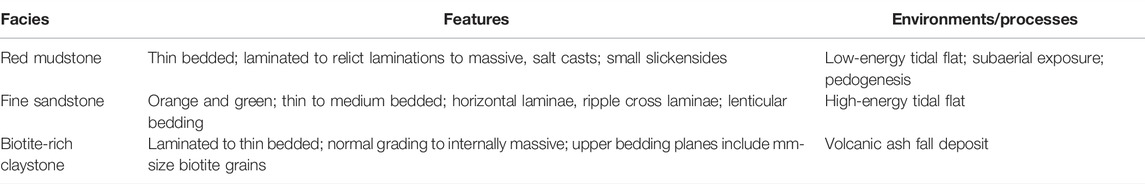
TABLE 5. Mud/Sand-flat facies.
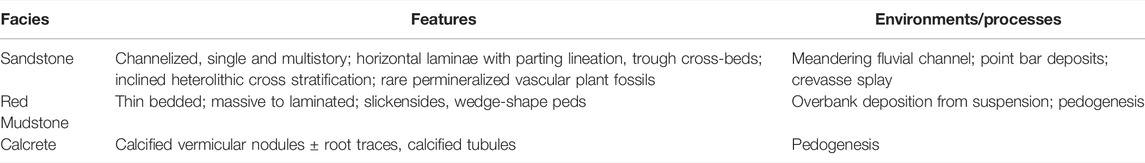
TABLE 6. Fluvial facies belt association elements.
Salt-lake Facies Belt
Sedimentary rocks of the salt-lake facies belt are present only in the upper Whitehorse Group strata, which are well exposed in the sections at Palo Duro Canyon, Highway 207, and Caprock Canyons (Figures 1–3). The salt-lake facies belt lies at the base of the Dickens stratigraphic section but is poorly exposed in areas of public access. The salt-lake facies belt consists of interbedded sandstones, mudstones, dolostones and evaporites deposited within a restricted basin (Figures 2, 3; Table 4). The most abundant and widespread salt-lake facies is red to orange, gypsiferous quartz sandstone beds ranging from a few centimeters to 1.1 m thick. Generally ripple cross-laminated, some beds are massive or exhibit normal graded thick laminations or symmetrical ripples (e.g., Figure 4A), and nearly all beds include dolomite or calcite cement. The red to orange sandstone represents subaqueous deposition of detritus via traction transport under both unidirectional and bi-directional currents. The red and orange coloration derives from hematite cements that preserve a primary remanence (Molina-Garza et al., 1989; 2000; also see below) and suggests that waters in the basin at the time of deposition were well oxidized.
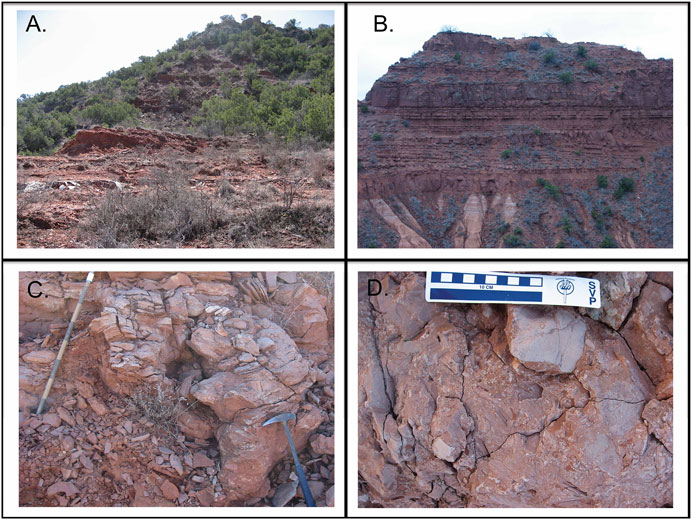
FIGURE 3. (A) Outcrop of the Dickens stratigraphic section located along State Highway 114/82 ∼2 km west of the town of Dickens, TX U.S.A. Gypsiferous redbed of the salt-lake facies (=Whitehorse Group) belt are exposed in the foreground and the transition to lower Quartermaster Formation strata associated with the sand-flat facies belt occurs in the top bench within the foreground. The lower ash in this stratigraphic section is exposed just behind the lower set of breaks on private property (the authors asked for, and received, permission to access this property for this study). (B) Outcrop of part of the Caprock Canyons stratigraphic section located in Caprock Canyons State Park near Quitaque, TX U.S.A. The lower pinkish-orange exposures are sandstone and mudstone facies of the sand-flat facies belt. The upper strata are dominantly clinoform sandstone facies (note the low-angle cross strata in the middle of the outcrop) of the fluvial facies belt. The low-angle cross stratified beds in the middle of the outcrop is 7 m thick. (C) Limestone breccia filling karst fissures from exposure and dissolution of dolomite strata in the Whitehorse Group strata of the salt-lake facies in outcrops of the Highway 207 road cut. The breccia is best exposed next to the rock hammer (which is 40 cm long) and is overlain by thin-bedded dolomitic sandstones of the lower sand-flat facies (adjacent to the Jacob’s staff, which has 10 cm divisions). (D) Close up of the karst-fill breccia exposed along the Highway 207 road cut.
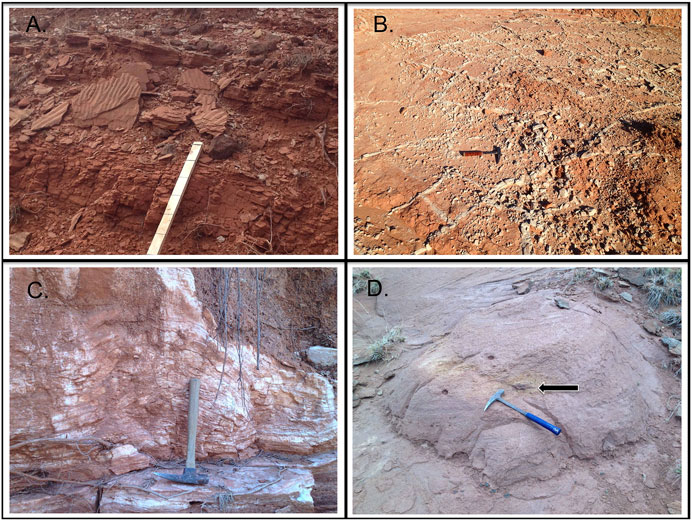
FIGURE 4. (A) Rippled fine sandstone from strata in the sand-flat facies of the lower Quartermaster Formation from exposures in the stratigraphic section near Dickens, TX. The staff beneath the rippled flagstones has 10 cm graduations. (B) Fine-sand filled desiccation cracks in red mudstones of the sand-flat facies from exposures in the stratigraphic section exposed in Caprock Canyons State Park. The rock hammer near the center of the photograph is 30 cm long. (C) Domal, cryptalgal, gypsum strata of the in the salt-lake facies belt of the Whitehorse Group strata sampled from the lower Caprock Canyons stratigraphic section located just east of the Caprock Canyons State Park. The rock hammer is 30 cm long. (D) Trough-cross bedded fine sandstones of the fluvial facies belt from the upper exposures of the Caprock Canyons stratigraphic section. The hammer in the foreground is 40 cm long. The arrow is pointing to a brownish-red cross section of the long axis of a fossil branch or trunk. See text for further discussion.
The salt-lake facies belt also contains a mudstone facies composed of red beds ranging from 1 to 15 cm thick with occasional green to greenish blue-gray reduction mottles. Most mudstones are laterally continuous and thickly laminated to massive, although some mudrocks are drapes upon underlying ripples of the gypsiferous sandstone facies. Other mudstones preserve desiccation cracks that deform the upper surfaces of the beds. Most mudrock beds are weakly cemented by dolomite and calcite cements although a few beds are noncalcareous. The laterally continuous beds of thickly laminated to massive mudrock represent subaqueous deposition of detrital material via gravity suspension settling, whereas the mud drapes represent deposition during either subaqueous gravity-suspension settling during slack-water conditions or stranding of fine-grained sediments during waning-flow conditions. Mudrocks with desiccation marks (Figure 4B) represent initial subaqueous deposition via gravity suspension settling followed by subaerial drying and cracking. Like the gypsiferous sandstone facies, the red color of the mudrocks derives from early hematite cements that are demonstrated to retain a primary remanence and suggests well-oxidized conditions during deposition (Molina-Garza et al., 1989; 2000). The green to greenish blue-gray beds may represent deposition under anoxic conditions but the irregular distribution of this color in the strata suggests it is more likely that original hematite cements were reduced and removed during post-burial (e.g., Lewis and Byrne, 1996).
The bedded gypsum facies is only present in strata ∼20 m beneath the Whitehorse Group-Quartermaster Formation contact and consists of white to gray beds ranging from 0.5 to 2.6 m thick. Gypsum beds are internally organized into thickly laminated to thinly bedded layers with irregular cryptalgal upper bedding surfaces (Figure 4C). Most beds are laterally continuous, although a few examples from the Caprock Canyons section exhibit cryptalgal textures and domal bedding surfaces suggestive of microtopography up to 30 cm (Figure 4C). Occasionally upper bedding surfaces within the bedded gypsum facies are red to pink colored from comminuted hematite-cemented silt and very fine sand grains. All examples of the bedded gypsum facies are strongly calcareous. The bedded gypsum facies represents chemical sedimentation in restricted waters that were supersaturated with respect to CaSO4·n(H2O). The cryptalgal textures and domal bedding in these strata represent colonization of these substrates by bacteria or algae and development of stromatolites. Because there is no evidence of reworking and transport of the gypsum beds, they were likely deposited either in slack-water environments, although cryptalgal textures and domal structures associated with photosynthetic organisms necessitates deposition within the photic zone. The red to pink colored, hematite-cemented, silt and very fine sand grains comminuted with the gypsum represents gravity-suspension deposits possibly derived from eolian dust settling through the water column and furthermore indicates well-oxidized conditions during deposition. The calcareous cements associated with the bedded gypsum facies may have been co-deposited as an evaporite at times when solutions were supersaturated with respect to CaCO3 or CaMg(CO3)2, implying decreased restriction in the basin. Alternatively, some of the calcareous cements may derive from dissolution of CaSO4 and recrystallization as carbonate in the burial environment.
The dolostone facies occurs only in the Palo Duro and Highway 207 (Figure 3C) sections and consists of buff to gray micritic beds ranging in thickness from 9 cm to 1.2 m. Dolostone facies beds that are less than 0.2 m thick are internally massive. Dolostone beds thicker than 0.2 m typically exhibit massive structure near the base of the unit grading upward into undulating, very thin to thin, bedded domal structures with cryptalgal textures. Dolostone beds often include detrital quartz silt grains without hematite cement pigments. Internal to the thicker dolostone beds are stylolites oriented parallel to bedding with amplitudes up to 1 cm. At the Highway 207 section the uppermost dolomite bed includes an irregular upper contact that breaks internal bedding in the dolostone and defines a microtopographic surface that extends up to 90 cm beneath the uppermost surfaces of the dolostone bed (Figure 3C). In addition, the upper contact of the uppermost dolostone at the Highway 207 section exhibits mm-to cm-scale flutes and runnels. The dolostone facies represents chemical sedimentation in restricted marine waters that were supersaturated with respect to CaCO3 or CaMg(CO3)2. The micritic texture of the carbonate in the dolostone facies reflects deposition in a low energy marine environment, and the cryptalgal textures indicate that this facies was deposited in shallow water, within the photic zone. Considering that detrital quartz silt in the dolostone facies does not include authigenic hematite cement and that hematite cement is ubiquitous in other facies of the salt-lake facies belt, it is possible that the dolostone facies experienced anoxic conditions during deposition or soon after burial that reduced and removed hematite from this facies in the early burial environment. The presence of stylolites is indicative of pressure dissolution in post-burial, diagenetic environments. However, those stylolites and other microtopographic surfaces, flutes and runnels at the upper contact of the uppermost dolostone at the Highway 207 section reflect exposure and dissolution by meteoric water (i.e., karst, Figures 3C,D) and could represent short-term exposure surfaces, also called intraformational disconformities.
The breccia facies is only exposed at the Highway 207 section and consists of angular, granule- to cobble-size, dolostone fragments in pockets and on the uppermost bed of the dolostone facies. Hematitic coarse silt to very fine sand fills the interstitial spaces between angular dolostone fragments (Figure 3D). The breccia facies represents the residuum from surface weathering and karstification of the exposure surfaces of the dolostone facies. Descriptively, similar facies have been identified in the middle Permian strata of Niger (Tabor et al., 2011; Smith et al., 2015).
The claystone facies is represented in the salt-lake facies belt at the Caprock Canyons and Palo Duro Canyon sections (Figure 5A). This facies is a single, internally massive bed at each locality. The claystone facies is a white, 12 cm thick, bed at the Palo Duro Canyon section and a red, 8 cm thick, bed at the Caprock Canyons section. Both of these facies are ∼18–20 m beneath the base of the Quartermaster Formation. The dominant mineral in these beds is analcime, although sanidine and zircon grains have been isolated from these beds for radioisotopic age determinations (Chang, 2008). The claystone facies is a gravity-suspension deposit of volcanic ash that settled through the water column, also referred to as a “tuff” or “tuffite.” The similar stratigraphic position of the claystone facies at Caprock Canyons and Palo Duro Canyon sections suggests that they are contemporaneous and representing the same volcanic event, although geochronologic data leave that correlation equivocal (see below). The hematitic color of the claystone facies at the Caprock Canyons section may be related to more intense chemical alteration during burial.
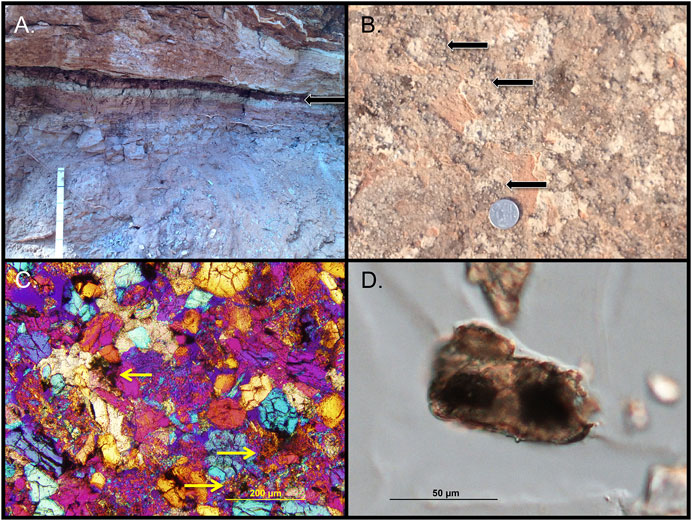
FIGURE 5. (A) Claystone facies (indicated by arrow) exposed in the salt-lake facies (Whitehorse Group) of Caprock Canyons stratigraphic section. This claystone, the weathering product of a volcanic ash, occurs 17.8 m beneath the top of the Whitehorse strata in this stratigraphic section. See text for discussion. Jacob’s staff in foreground has 10 cm graduations. (B) Bladed calcite textures arranged into calcareous spherules and clusters of spherules that occlude coarse silt to fine-sand sized grains in the sand-flat facies belt of the stratigraphic section exposed near Dickens, TX U.S.A. See text for further discussion. (C) Transmitted-light, crossed nicols, photomicrograph of a very fine sandstone from the sand-flat facies of the stratigraphic section exposed near Dickens, TX U.S.A. The blue, yellow and pink grains are detrital quartz sands, whereas the dark clotted areas are (some areas indicated by arrows) are zones of dolomicrite cementation. See text for discussion. (D) Reflected light image of an opaline phytolith separated from bulk sediment sampled from the sand-flat facies belt in the Caprock Canyons stratigraphic section. The dark cores are inclusions of plant organic matter. UCMP collection locality number PA1201h, specimen number 254961, England Finder Coordinate E25-1. See text for discussion.
Sand-Mud Flat Facies Belt
Sediments of the sand-mud flat facies (referred to as sand-flat facies elsewhere in this text) belt are exposed in the lower Quartermaster Formation, in particular this facies belt occurs at Palo Duro Canyon, Highway 207, Caprock Canyons and Dickens sections (e.g., Figures 3A–C). The stratigraphic thickness of the sand-flat facies belt is 35 m at Palo Duro Canyon, 11 m at Highway 207, 31 m at Caprock Canyons, and 32 m at Dickens. The sand-flat facies belt consists of sub-equal amounts of interbedded sandstones facies and mud/claystone facies across the study area (Table 5). However, the sandstone facies dominates the stratigraphy at the Palo Duro Canyon and Highway 207 sections, and is less important in the southern Caprock Canyons and Dickens sections.
The sandstone facies is composed of green and orange-to-red, very fine to fine sandstone. Most of the beds in the sandstone facies are thin, a few are 20–30 cm thick although some examples reach thicknesses of ∼3.5 m and they typically are intercalated with mudstone facies rocks. Some beds within the sandstone facies are remarkably uniform in thickness and lateral continuity. One ∼0.5 m thick, ledge-forming marker sandstone (Figure 2) about 13 m above the base of the Quartermaster Formation, has been traced for several kilometers across Caprock Canyons State Park. Ripple cross-laminated, asymmetric and symmetric ripples (e.g., Figure 4A) as well as lenticular and flaser bedding are common and thin (0.3–0.5 m) trough cross-bedded strata occur rarely in the sand-flat facies. The few paleocurrent indicators recorded from this facies belt indicate a generally northward sediment transport direction. Cubic salt casts up to 1 cm on edge are present in flaggy red sandstone beds 20–30 cm thick at ∼10 and ∼8 m above the base of the Quartermaster Formation at the Highway 207 and Caprock Canyons sections, respectively. All of the beds in the sandstone facies are calcareous. There are two different types of calcareous cements recognized in this facies: 1) a bladed calcite spar texture that occludes silt and sand grains and macroscopically forms spheroidal clusters (Figure 5B) and 2) micrite and microspar cements that incompletely fill the pore spaces between sand grains (Figure 5C). The bladed calcite texture is present in two horizons in both the Caprock Canyons and Dickens stratigraphic sections. However, X-ray diffraction analyses of samples with micrite and microspar cements indicate that both dolomite and calcite cements are present. The sandstone facies represents subaqueous deposition of detritus via traction transport under both unidirectional and bidirectional currents, although a prevailing northward transport direction is most prevalent. The uniform thickness and lateral continuity of many of these strata indicates smooth depositional surfaces with low-gradient slopes likely dipping toward the north side of the Palo Duro Basin, based on sediment transport directions. The cubic salt casts indicate crystallization of halite in the depositional or very early burial environment. The presence of halite salt casts in some these sandstone beds suggests that waters associated with deposition of these beds were extremely restricted and probably required evaporation of well over 90 percent of H2O from interstitial or bottom waters to initiate crystallization of halite crystals (Borchert and Muir, 1964). Restricted conditions throughout the deposition of the sandstone facies are further supported by the presence of inorganic dolomite and calcite cements that grow into primary void spaces between grains (Figure 5C), indicating waters that are supersaturated with respect to these minerals in early burial. Collectively, the sandstone facies correspond to shallow subaqueous sheet flows of the sand flat facies belt (e.g., Dalrymple et al., 1992). The bladed calcite cement texture that occludes silt and sand grains in the sandstone facies (Figure 5A) is evidently of a different generation of carbonate growth from those of the micrite and microspar cements, and may represent a later diagenetic phase of cementation. Bladed textures similar to those in the sandstone facies are interpreted as late meteoric (Minero, 1988) and late-burial (Mazullo, 1986; Sellwood et al., 1989) cements in other sedimentary successions.
The red mud/claystone facies is composed of dusky-red mudstone from 1 cm to ∼5 m thick. Mudstone facies beds are laterally continuous and most are internally massive although thin beds of finely laminated mudstone are present. Some mudstones preserve desiccation cracks that deform the upper surfaces of the beds (e.g., Figure 4B). The upper half of the sand-flat facies belt at the Caprock Canyons and Dickens sections includes red mud/claystone facies beds that preserve arcuate slickenplanes that cross-cut mudstone beds up to 30 cm thick. The mudrock facies likely represents subaqueous deposition of detritus via gravity suspension settling or stranding of fine-grained sediment during waning-flow conditions. Mudrocks with desiccation marks represent initial subaqueous deposition via gravity suspension settling followed by subaerial cracking of the mudrocks. The mudrock strata that preserve arcuate slickenplanes represent subaerial exposure and incipient soil development (vertic Protosols of Mack et al., 1993; Tabor et al., 2017). Collectively, the mudrock facies of the sand flat facies belt corresponds to the slack-water and episodically exposed parts of a sand-flat depositional system (e.g., Dalrymple et al., 1992).
The biotite-rich claystone facies lies in the sand-flat facies belt at the Highway 207, Caprock Canyons, and Dickens stratigraphic sections. The biotite-rich claystone facies is at 3.6 and 23.6 m above the Whitehorse-Quartermaster contact at Dickens, 5.8 and 25.1 m above the Whitehorse-Quartermaster contact at Caprock Canyons, and 2.7 m above the Whitehorse-Quartermaster contact at Highway 207. The lower beds of this facies are ∼10 cm thick at both Dickens and Caprock Canyons sections, whereas the upper beds are ∼10 cm thick at Dickens and ∼30 cm thick at Caprock Canyons. The single occurrence of this facies at Highway 207 is also a ∼10 cm thick bed. The biotite-rich claystone facies is typically organized into thin beds that are internally massive, although relict ripple cross laminations are occasionally preserved in upper beds of this facies. Biotite grains up to fine sand size are concentrated at the base of these beds and along the bases of ripple-cross laminated zones. As in the claystone facies of the salt-lake facies belt, the dominant mineral in these beds is analcime. Sanidine and zircon grains have been separated from these beds (Chang, 2008; Mitchell, 2014). The biotite-rich claystone facies represent a gravity-suspension deposit of volcanic ash that settled in the shallow subaqueous channels and runnels of the sand flat facies belt. Relict ripple cross laminations in the upper parts of these beds indicate local reworking by subaqueous currents. The similar stratigraphic positions of this facies in the Dickens and Caprock Canyons stratigraphic sections suggests they are contemporaneous deposits from the same volcanic eruption, although geochemical data for the biotite and zircon grains from this facies are unable to demonstrate whether they truly are contemporaneous deposits between locations (Chang, 2008; Mitchell, 2014; see also discussion below). It is unclear if the red mud-claystone facies that is exposed in the Highway 207 section correlates to exposures of this facies at the Dickens and Caprock Canyons sections. However, based on magnetic polarity stratigraphy data from the study sections (see below), the biotite-rich claystone at Highway 207 likely correlates with the lower occurrences of this facies in the sand-flat facies belt in Caprock Canyons and Dickens sections.
A remarkable exception to the character of the sand-flat facies belt in the Quartermaster Formation is evidence for macroscopic life. To date, neither macrofossils nor fossil traces have been observed in this facies belt. However, microscopic phytoliths including ones with organic cores have been identified in samples from the sand-flat facies belt in the Caprock Canyons stratigraphic section (Figure 5D). This suggests that plants existed in the region, but they did not have a substantial impact on the lithostratigraphy of the sand flat facies belt as in other places and times that include well-developed rooted horizons reflective of saltmarshes and other vegetated sand- and mud-flat landscapes (e.g., Dalrymple et al., 1992).
Fluvial Facies Belt
Sediments of the fluvial facies belt are exposed in the Caprock Canyons and Highway 207 sections (Figures 1, 2, 3B and Table 6) and conformably overlie sand flat facies belt rocks at those locations. The fluvial facies belt is ∼45 m thick in the Caprock Canyons section and is disconformably overlain by mudrock and sandstone strata of the Upper Triassic Dockum Group (Figure 2). Basal Dockum Group rocks lie 78 m above the base of the Quartermaster Formation at Caprock Canyons and are defined by a polymictic mudstone that includes extraformational detrital chert granules and pebbles. The fluvial facies belt is at least 15 m thick in the Highway 207 section but its complete thickness could not be measured because the upper contact with the Dockum Group is located on private land, and in this case was not able to be accessed. The fluvial facies belt is absent at Dickens and Palo Duro Canyons sections, perhaps due to erosion prior to deposition of the Upper Triassic Dockum Group (Figure 1), or that the fluvial facies, perhaps being an axial sedimentary system across the Quartermaster landscape, was never deposited in those regions.
The clinoform sandstone facies is composed of red-to buff-colored, fine to medium sandstone (Figures 2, 3B). Clinoform sandstone units are thick-bedded and are internally organized into trough-cross bed (Figure 4D) or plane-bed structures (Figure 3B). Plan-view exposures of the trough-cross bedded sandstones indicate northward transport. Some sandstone beds exhibit horizontal laminae with parting lineations that also indicate a dominantly northward transport direction. Thick clinoform sandstone beds are separated by drapes of thin bedded to laminated red mudstone layers that drape upon sandstone beds that imply a channelized structure. Channelized sandstones form both single and multistory sets that correspond to channel topographies of up to 7 m (Figure 3B). The bases and sides of these channel structures occasionally are lined by red mudstone clasts ranging from pebble to boulder size. Most sandstone beds are calcareous although a few noncalcareous strata lie in the upper ∼15 m of sandstone fluvial facies in the Caprock Canyons section. The upper 6 m of the Quartermaster Formation at Caprock Canyons section include permineralized axes, branches, and fallen trunks of fossilized trees (Figure 4D). Similar to sandstones in the salt-lake and sand flat facies belts, petrographic analysis shows that carbonate cements incompletely fill the pore spaces between sand grains (e.g., Figure 5C). X-ray diffraction analyses indicate that calcite is the dominant cement and dolomite cement is not present in this facies. The sandstone facies represents subaqueous deposition of detritus transported via unidirectional traction transport directed northward in meandering fluvial channel systems. Inclined mudstones separating clinoform sandstones (e.g., Figure 3B) represent deposition during slack-water conditions (standing water) or waning flow. Desiccation cracks are not present on the upper surfaces of the inclined mudstones suggesting that slack-water conditions or subaqueous waning flow may be more appropriate for the conditions of mud-drape deposition. The red mudstone clasts lining the bases of some channel forms are eroded blocks from either mud drape deposits within the channels or from overbank mudstones. The clinoform sandstone facies are hematite-rich, suggesting well-oxidized conditions during deposition. The dominance of calcite cement in the clinoform sandstone facies may indicate less restricted/evaporitic pore waters in the early-burial environment than those associated with the salt-lake and sand flat facies belts. The preservation of fossil trees in the uppermost clinoform sandstones (Figure 4D) is important, because it is the first direct evidence of macroscopic life in the Whitehorse Group-Quartermaster succession. However, microscopic organic matter associated with biogenic silica (i.e., phytoliths) have been recovered from samples throughout the fluvial facies (Figure 5D).
The mudstone facies is composed of dark red mudstone beds from a few cm to ∼30 cm thick. Mudstone facies beds are laterally continuous and organized internally as laminated, thin-bedded, or massive to angular blocky. The angular blocky mudstones are organized into wedge-shaped aggregates that define arcuate slickenplanes that cut across most of the thickness of the unit. The mudstone facies makes up only a small part of the fluvial facies belt; it is rare in the lower half, but more common in the upper half of the fluvial facies belt succession in the Caprock Canyons stratigraphic section. Most mudstones are slightly calcareous although noncalcareous mudstone beds lie near the top of the fluvial facies belt stratigraphic succession at Caprock Canyons. X-ray diffraction analysis of mudstone facies samples indicates that carbonate cements are dominated by calcite; dolomite is not present in the mudstone facies. The mudstone facies represents interchannel, perhaps floodplain or medial bar, depositional environments in which fine-grained detrital clastic material was stranded subsequent to flood-stage conditions. The blocky mudstones with slickenplanes are Vertisols (i.e., paleosols; Mack et al., 1993; Tabor and Myers, 2015) and reflect seasonal wetting and drying of the interchannel floodplains. The dominance of calcite cements in the mudstone facies may represent interaction with rainwater and groundwater of lower salinity, perhaps meteoric, than strata in the underlying sand-flat and salt-lake facies belts where dolomite was the dominant carbonate cement. The mudstone facies contains abundant authigenic hematite cement and indicates oxidizing conditions during deposition, pedogenesis, and early burial.
The calcrete facies is present in the fluvial facies belt of the Caprock Canyons stratigraphic section and occurs at only one stratigraphic level, ∼70 m above the base of the Quartermaster Formation. This horizon is ∼2 m beneath the part of the stratigraphy that preserves permineralized fossil plants and ∼8 m beneath the Quartermaster-Chinle unconformity. The calcrete is composed of light-yellow to buff colored, massive, fine to medium sandstone that is irregularly cemented by calcite in a laterally continuous, ∼30 cm thick horizon. Calcite cements are organized into 1) vermicular patterns with internal micritic calcite texture and 2) tubular micritic calcite up to 2 cm in diameter and 10 cm long oriented in vertical to subvertical patterns. The calcrete facies represents pedogenesis of an abandoned channel deposit. The vermicular cements with internal micritic calcite texture may represent either groundwater-derived crystallization (e.g., Semeniuk, 1985) or the depth of wetting and leaching of calcite in a well-drained soil. The vertical to subvertical calcite-cemented tubules are cementation after roots (i.e., rhizoliths; Klappa, 1980), which supports an interpretation of the vermicular carbonates as a product of the depth of leaching in a well-drained soil. This reflects the fact that most plant root systems do not develop vertical root structures in poorly drained soils (e.g., Pfefferkorn and Fuchs, 1991). The presence of rhizoliths in the calcrete facies is important because it represents the first trace evidence for macroscopic terrestrial life in the Quartermaster Formation.
Mineralogy
X-ray diffraction analysis of the 001 d(hkl) peaks for dolomite and calcite in bulk samples indicate that many Whitehorse Group and Quartermaster Formation samples contain both types of carbonate cements, although some samples contain only dolomite or calcite. Cement concentrations of the collected samples range from 32–100% dolomite in the Palo Duro Canyon section, 26–100% dolomite in the Caprock Canyons section, and 38–100% dolomite in the Dickens section whereas the Highway 207 section is 100% dolomite. With the exception of the Highway 207 section, which contains only dolomite cement throughout the exposures, there is a stratigraphic trend in the distribution of carbonate mineralogy wherein cements from the salt-lake facies belt are dominated by dolomite, cements in the sand flat facies belt are mixed dolomite and calcite with increasing proportions of calcite upward through the stratigraphy, and cements in the fluvial facies belt are dominated by calcite. Note that these weight percent cement values are not tabulated in this manuscript, but are available to any interested parties upon request.
Based on yields of CO2 generated by the differential reaction times of the carbonate cements with H3PO4 (Al-Aasm et al., 1990), the weight-percent of calcite and dolomite cements in samples from the (1) Palo Duro Canyon section range from 1.8 to 38.0 calcite and 1.0 to 21.5 dolomite, (2) Caprock Canyons section range from 0.1 to 27.7 calcite, and 1.0 to 29.7 dolomite, (3) Dickens section range from 0.1 to 15.7 calcite and 1.0 to 10.7 dolomite. Weight percent dolomite in samples from the Highway 207 section range from 1.9 to 20.9.
Petrographic and x-ray diffraction analysis of samples from the four composite stratigraphic sections suggests that dolomite is likely the dominant syn-depositional and early post-depositional cement in the salt-lake and sand flat facies belts, whereas calcite may have precipitated early in the fluvial facies belt. Because it is likely that calcite cements throughout these stratigraphic successions reflect post-depositional diagenetic conditions, an emphasis was placed on isotopic analysis of dolomite cements in order to develop a carbon-isotope chemostratigraphy as a means of correlation among sections, and to assess whether there is a substantial negative δ13C excursion of the carbonate cements, as has been found to characterize Permian-Triassic boundary stratigraphic successions around the world (e.g., Korte and Kozur, 2010).
Zircon U-Pb Geochronology
Zircon crystals extracted from seven volcanic ash deposits (tephras) exposed in five sections within the salt-lake and sand flat facies belts were subjected to CA-TIMS (Chemical Abrasion-Thermal Ionization Mass Spectrometry) analysis. The populations of zircon crystals yield indistinguishable U-Pb zircon ages with 0.1% level precision and these cluster around 251.9 Ma (Figure 6, Tables 3,4, and Mitchell 2014). The biostratigraphically defined marine Permian-Triassic boundary (FAD Hindeodus parvus) has been interpolated to 251.902 ± 0.024 Ma at the type-section for the global stratotype and point (GSSP) in the Meishan section, Zhejiang Province, China, and the abrupt decline in δ13Ccarb slightly prior to 251.950 ± 0.042 Ma lasting about 2.1–18.8 ka (Burgess et al., 2014). Within this context, there is an explicit expectation that the Permian-Triassic boundary should be present within the strata of the upper Whitehorse Group/Quartermaster Formation sequence and, furthermore, that the fluvial facies belt of the Quartermaster Formation is earliest Triassic in age, rather than Permian as has long been described and mapped up to this time. Considering that a significant negative shift in stable carbon isotope values of carbonate (e.g., Magaritz et al., 1988; Magaritz, 1989) as well as organic matter (Magaritz et al., 1992) appear to be a diagnostic feature of the chemostratigraphy of the Permian-Triassic transition, and that there is relatively well-documented global geomagnetic polarity time scale for the time interval that spans the Permian-Triassic boundary (e.g., Steiner, 2006; Henderson et al., 2012; Ogg, 2012; Szurlies, 2013; Hounslow and Balabanov, 2018; Pan et al., 2021), we consider below the stable carbon isotope chemostratigraphy of dolomite cements, as well as the magnetic polarity stratigraphy record from the upper Whitehorse Group and Quartermaster Formation strata to estimate more accurately the location of the Permian-Triassic boundary within these strata. We chose to use only the data from dolomite cements for this exercise of stable carbon isotope chemostratigraphy, because of the petrographic support (e.g., Figure 5C) for early formation of dolomite in the salt-lake and sand flat facies belts, given the likelihood that the Permian-Triassic boundary is most likely to reside in those facies belts that host the volcanic ash deposits (tephra/tuff) providing the U-Pb age determinations. We do not consider the stable carbon isotope data from calcite cements any further in this work, because of the petrographic evidence for these phases often including a secondary origin and a substituent cement in the salt-lake and sand flat facies. Calcite only appears as a primary cement in the upper parts of the sand flat facies and throughout the overlying fluvial facies belt.
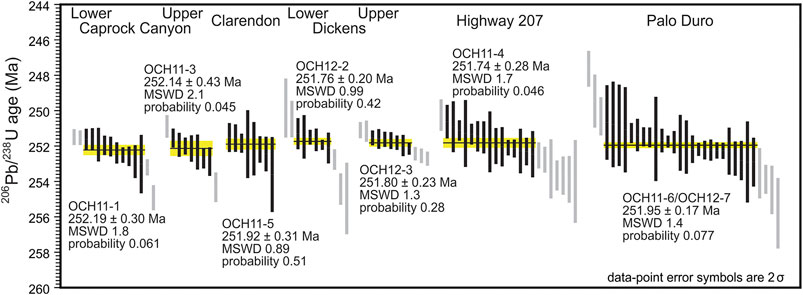
FIGURE 6. Age ranked 206Pb/238U ages of U-Pb single zircon CA-TIMS analyses of seven samples from five sections. Black bars show the largest youngest subset with an acceptable probability of fit (see text), grey bars are omitted from the calculation of the mean (interpreted as Pb loss and crystals predating the eruption/deposition age). Yellow horizontal bars depict the weighted mean age for each sample (errors are given at the 95% confidence level).
Magnetic Polarity Stratigraphy
Response to thermal demagnetization by the hematitic red beds we sampled indicates that the NRM in these rocks is readily interpretable and usually consists of one vector component or, at most, two vector components resolved during thermal unblocking (Figure 7). Samples from some sites contain a low intensity and relatively unstable first-removed component that is completely unblocked by ≈ 400°C. This component is typically north-directed and of steep positive inclination, consistent with the present local field. The stable endpoint component, with a direction that is northwest to north-northwest and shallow positive inclination, is isolated above 400°C to complete unblocking at about 680°C. The laboratory unblocking temperature spectrum for this component is typically very discrete, with a sharp decrease above 650°C. Typical NRM intensities are about 10 mA/m, with a few more strongly magnetized horizons having intensities of about 200 mA/m.
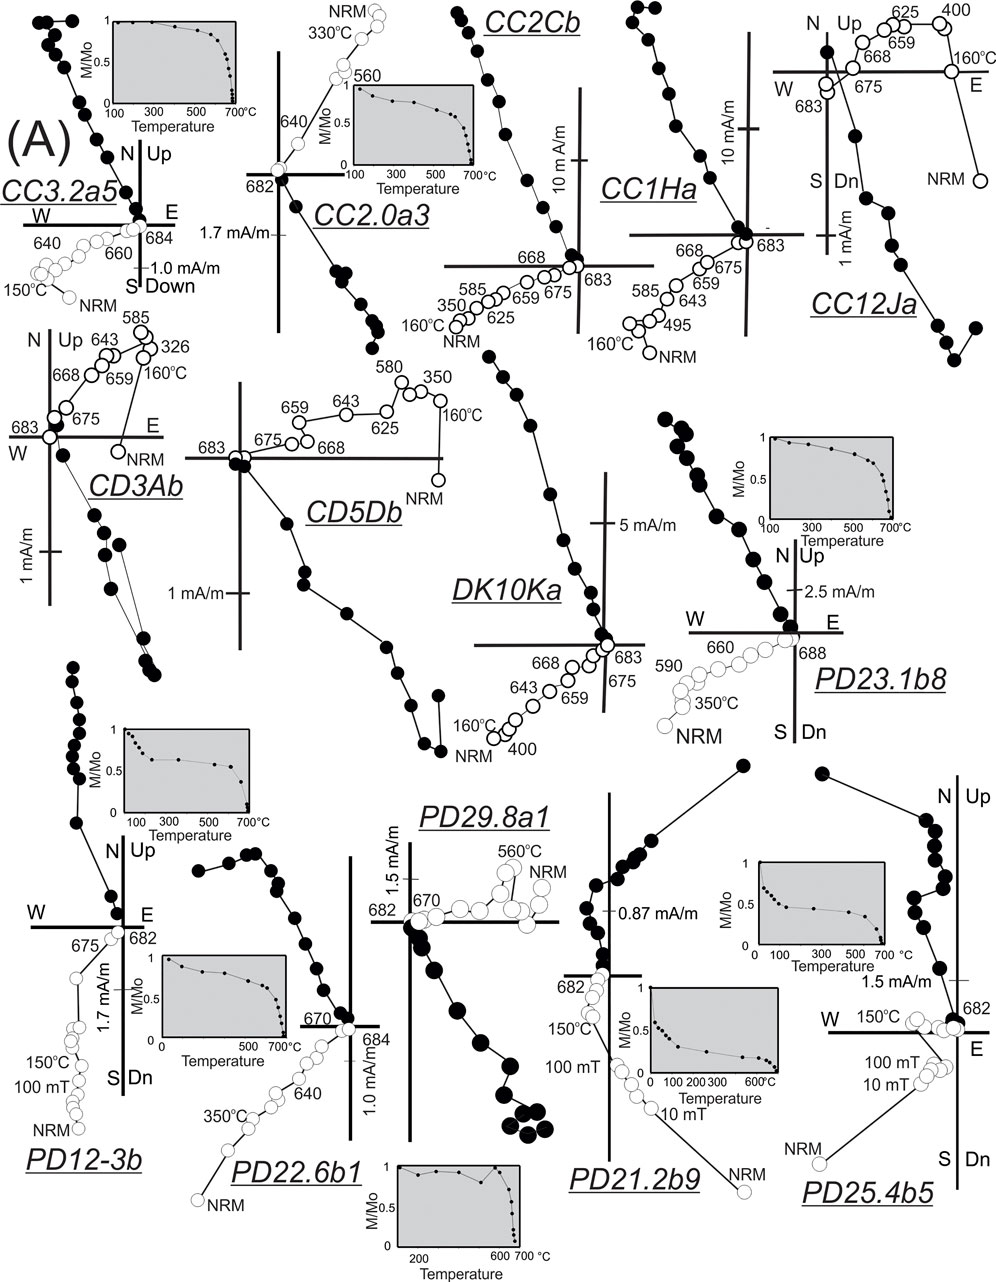
FIGURE 7. Orthogonal progressive demagnetization diagrams (Zijderveld, 1967) showing the end point of the magnetization vector plotted onto the horizontal (filled symbols) and vertical (open symbols) planes (NS-EW, EW-Up/Dn) for individual specimens from samples from selected sites at some of the northwest Texas sections sampled for this study. Specimens have been subjected to either progressive thermal demagnetization or a combination of alternating field and then thermal demagnetization. Selected demagnetization steps are shown for data points in the vertical projection. In some cases, normalized intensity decay plots show response to progressive demagnetization. CC, Caprock Canyons; PD, Palo Duro Canyon; D, Dickens; CD, Clarendon. Additional details are in Supplemental Information.
Response to other demagnetization methods further demonstrates that hematite is the principal remanence carrier in these rocks. AF demagnetization followed by thermal demagnetization treatment successfully randomizes the north directed low laboratory unblocking temperature remanence, leaving the ChRM of north-northwest declination and shallow positive inclination. This first removed component is likely a viscous remanent magnetization, at least in part residing in magnetite, again reflecting the modern geomagnetic field. Specimens initially subjected to AF demagnetization do not exhibit the relatively erratic behavior at low laboratory unblocking temperatures shown by those only thermally demagnetized. The first removed component in thermal demagnetization is also likely removed in AF demagnetization and is carried by the same assemblage of low coercivity grains. In progressive chemical demagnetization, specimens with strong calcite cement completely disaggregated after several seconds to minutes of leaching. On the other hand, those with considerable dolomite and quartz cement responded favorably to leaching, with all authigenic (pigment) hematite completely dissolved and specimens bleached uniformly white after about 12 total hours of leaching (Figure 8). Chemical demagnetization resulted in a decrease in intensity of about 50 percent with leaching times up to about 6 h. After substantial leaching of pigment hematite, a considerable fraction of the NRM intensity persisted after 10 steps (≈15 h) of treatment, implying that both disseminated hematite pigment and detrital hematite grains carry much of the ChRM in the Quartermaster strata. Notably, the direction of the remanence unblocked over a temperature interval well below about 580°C, and likely carried in detrital magnetite, is identical to the dominant remanence carried by hematite.
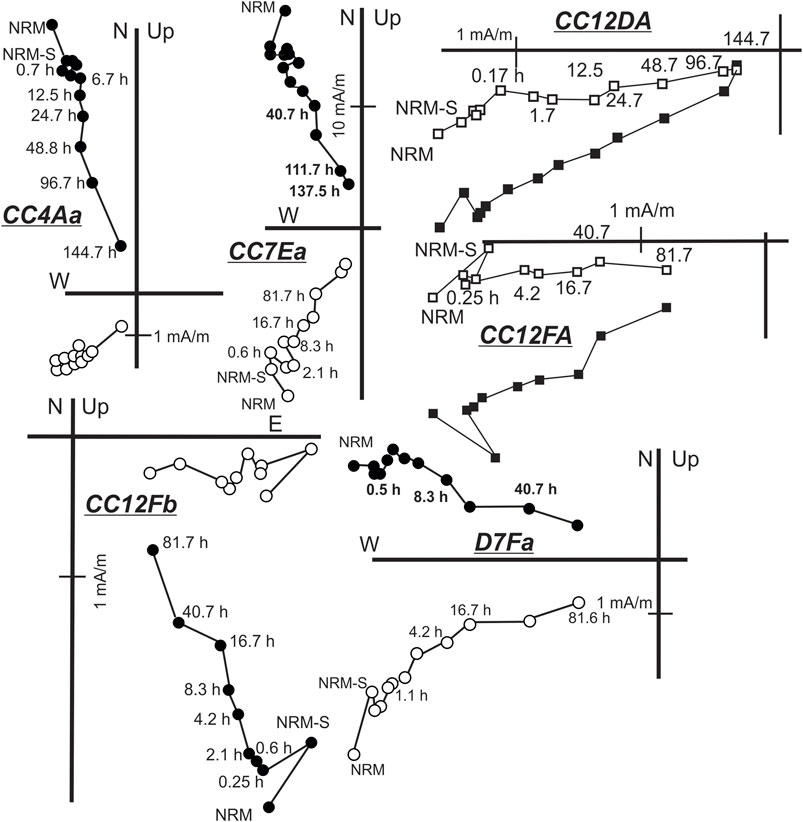
FIGURE 8. Orthogonal progressive demagnetization diagrams (Zijderveld, 1967) showing the end point of the magnetization vector plotted onto the horizontal (filled symbols) and vertical (open symbols) planes (NS-EW, EW-Up/Dn) for individual specimens from samples from selected sites at some of the northwest Texas sections sampled for this study. Specimens have been subjected to progressive chemical demagnetization. Selected demagnetization steps are shown for data points in the horizontal projection.
Progressive acquisition of isothermal remanent magnetization (IRM) data are consistent with the presence of both hematite and a low coercivity magnetic phase. Each specimen reached full saturation at about 2.0–2.9 T indicating hematite as the significant IRM carrier (Figure 9A). IRM curves are concave down, however, and reveal a low coercivity phase that is largely saturated by about 100 mT. Acquisition curves below ∼100 mT are steep positive, and the rate of IRM increase decreases as the field approaches ≈300 mT. The IRM acquisition data are consistent with demagnetization data that reveal a low coercivity phase, likely detrital magnetite, and both hematite pigment and detrital hematite in these rocks. Backfield measurements yield coercivity of remanence values between 100 and 140 mT.
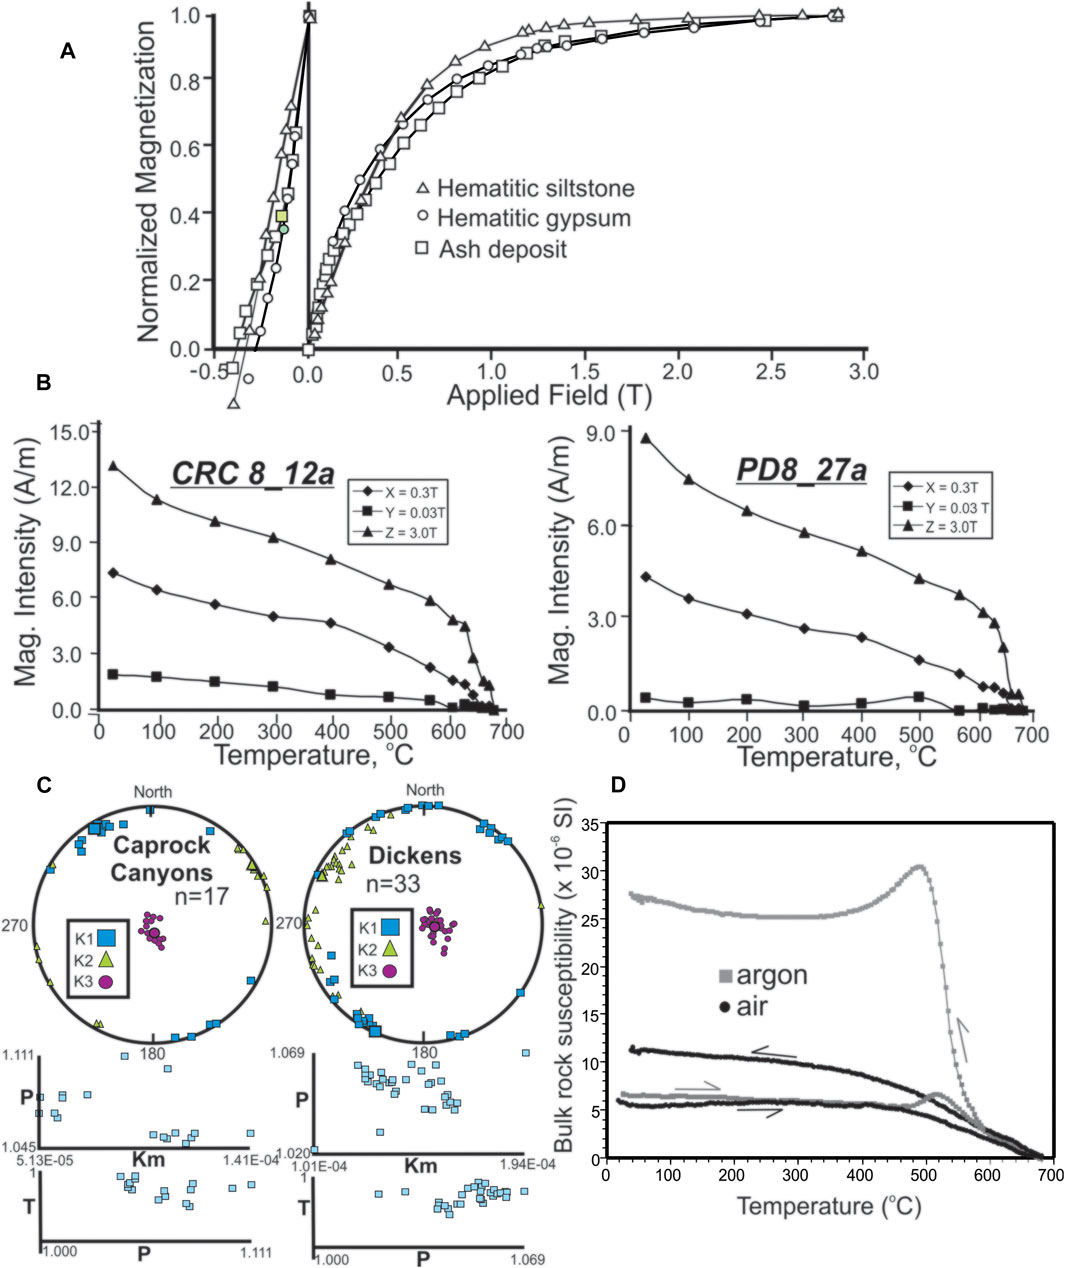
FIGURE 9. (A) Plots showing the acquisition of isothermal remanent magnetization (IRM) and backfield direct-field demagnetization for specimens from selected samples from the Dickens locality. In backfield demagnetization, the cross-over point provides the coercivity of remanence. The fact that saturation or near-saturation by close to 3.0 T indicates that a high coercivity magnetic phase (likely hematite) is the principal magnetic phase present. This is consistent with the coercivity of remanence values obtained. The concave-downward shapes to the curves, however, shows the additional presence of a considerably lower coercivity phase (most likely a combination of magnetite and maghemite). Additional details are in Supplemental Information. (B) Plots showing the results of progressive thermal demagnetization of three-component thermal demagnetization of isothermal remanent magnetization (IRM) following the approach of Lowrie (1990). Specimens from samples collected at the Caprock Canyons and Palo Duro Canyon sections. In each case, specimens are given an IRM of 3.0, 0.3, and 0.03 T along three perpendicular axes. The high coercivity and intermediate coercivity components document the presence of a magnetic phase of laboratory unblocking temperatures well above 600°C. The low coercivity component in all cases is of very low intensity, indicating that magnetite/maghemite are of very low concentrations in these rocks. Additional details are in Supplemental Information. (C) Examples of anisotropy of magnetic susceptibility data from collections obtained from selected northwest Texas localities sampled in this study. For each of the two sites shown, the stereographic projection shows the principal susceptibility axes for each specimen measured (lower hemisphere projections) and the mean principal susceptibility directions for the site. In addition, the anisotropy parameter P (degree of anisotropy, P = Kmax/Kmin), is plotted vs. bulk susceptibility for each specimen measured. Also shown is a plot of the AMS shape parameter T (T = [lnF-lnL/lnL + lnF]) versus the anisotropy parameter P for each specimen. The data from each locality show a fabric that is typical of very fine grained detrital sedimentary rocks, with the minimum susceptibility axis essential vertical and well-grouped. Additional details are in Supplemental Information. (D) Plots showing the behavior of bulk magnetic susceptibility as a function of continuous heating and cooling. Runs made in both argon atmosphere and in air, on different sub-samples.
Thermal demagnetization of three-component IRM data (Figure 9B) typically show a small drop of intensity of the intermediate component beginning around 200°C and ending by 300°C, as well as a small drop in intensity of all components around 580°C indicating a range of magnetite chemistry and grain size. Also of interest in these plots is a common crossover of intensity by the maximum and intermediate components, with both components eventually unblocked by 680°C. This likely indicates a strong contribution of coarse grained (detrital) hematite to the remanence of these rocks.
Anisotropy of magnetic susceptibility (AMS) data from collections obtained from selected northwest Texas localities sampled in this study yield a well-defined fabric that is typical of fine-grained detrital sedimentary rocks that have preserved an original depositional fabric (Figure 9C). Minimum susceptibility axes are clustered in a near vertical orientation with maximum and intermediate susceptibility axes generally scattered along the perimeter. The anisotropy parameter P (degree of anisotropy, P = Kmax/Kmin) shows little to minor dependence on bulk susceptibility (Km) for each collection. The AMS shape parameter T (T = [lnF-lnL/lnL + lnF]) shows a consistent oblate fabric, not dependent on the magnitude of the P parameter.
The monitoring of bulk rock magnetic susceptibility as a function of continuous heating and cooling (Figure 9D) reveals the presence of only a very minor concentration of a cubic magnetic phase (i.e. magnetite and/or maghemite of inferred detrital origin) and the dominance of hematite, with the clear resolution of a phase losing magnetic susceptibility by about 680°C. For experiments performed in air, the heating/cooling curves are irreversible, with an increase of typically about 50 percent in bulk susceptibility upon cooling, indicating the formation of new magnetic material in the heating process. In addition, there is only slight evidence of the presence of a cubic phase. For experiments in argon gas, on the other hand, the heating curves show a slight Hopkinson peak below about 550°C. Upon cooling, there is a 3–4 fold increase in bulk susceptibility, and a very well-developed Hopkinson peak, indicating the production of a cubic phase of higher susceptibility. The results of all of the rock magnetic experiments described above, supporting the presence of both abundant authigenic (pigmentary) hematite, as well as a mixture of hematite and magnetite as detrital phases, are supported by and consistent with petrographic observations.
In principal components analysis (PCA) (Kirschvink, 1980) the last several (at least three and usually six or more) measurement steps were used for PCA, as identified from the most well-resolved segment of the orthogonal demagnetization plot (Zijderveld, 1967). PCA directions from specimens from stratigraphic levels of normal polarity are generally north-northwest seeking (∼335°) with shallow positive inclination (∼+20°). Horizons of reverse polarity are characterized by southeast seeking declinations (∼155°) with shallow negative inclinations (∼−10°). Specimen directions from individual stratigraphic levels (sites) show minimal to minor dispersion of ChRM directions and are usually sufficiently well-grouped to provide polarity determinations.
Virtual geomagnetic poles (VGPs) were calculated for each stratigraphic layer sampled using the estimated site mean direction from individual layers (beds). Before calculating the VGP, each individual site mean direction was corrected for inclination shallowing with a flattening factor of f = 0.59 which is commonly assumed to be valid for most hematitic red beds (Bilardello and Kodama, 2010; Domeier et al., 2012). A formation mean direction calculated from each sampling site (reverse sites transposed through the origin) is D = 340.0° I = + 26.0° k = 21.18 α95 = 5.8° n = 30 distinct, independent stratigraphic layers. VGPs yield a grand mean paleomagnetic pole located at pLat = +62N, pLon = 123E, A95 = 5.8o. These results are slightly higher latitude than previous paleomagnetic pole work on Whitehorse Group/Quartermaster Formation strata (Molina-Garza et al., 1989; 2000). These two studies, however, did not correct results for potential inclination shallowing. The estimated paleomagnetic pole is also at a slightly higher latitude than paleomagnetic poles for the North America apparent polar wander path for the latest Paleozoic (Van der Voo, 1993; Domeier et al., 2012; Torsvik et al., 2012). If specimens with a larger mean angular deviation (MAD, >20°) are excluded from this analysis, the formation mean direction, corrected for inclination shallowing, is D = 340.1° I = +16.2° k = 20.42 α95 = 6.2° n = 28 horizons, providing a slightly revised paleomagnetic pole at pLat = +61N, pLon = 122E, A95 = 5.8o. The estimated mean inclination of about 16o corresponds to a paleolatitude of about +8o.
These data permit an estimate of composite polarity sequences for the Caprock Canyon, Palo Duro Canyon, Highway 207, and the Clarendon sections. The Palo Duro sequence is defined by a relatively thick normal polarity magnetozone beginning at the first exposed level that was capable of being sampled (1.9 m) above the top of the last massive bedded gypsum in the uppermost Whitehorse Group, which is exposed at the base of the sampled section. The normal magnetozone is followed by a relatively narrow stratigraphic interval of reverse polarity, with the remaining stratigraphic section defined by another normal polarity magnetozone, and thus a N-R-N inferred sequence. Samples from the Caprock Canyons section define a reverse polarity magnetozone at the base of the sampled section, which is in the upper part of the bedded massive gypsum sequence of the Whitehorse Group, followed by a relatively thick normal polarity magnetozone in the remainder of section where we were able to collect material for measurement. For the Caprock Canyons section we were able to sample several meters lower in Whitehorse Group strata than at the Palo Duro section. However, our sampling at Caprock Canyon did not continue far enough up section to identify the reverse polarity magnetozone found at the Palo Duro section. At the Highway 207 section, the uppermost part of the Whitehorse Group section that is exposed is of reverse polarity. The remainder of the exposed section, in the Quartermaster Formation, is entirely of normal polarity, and this includes horizons immediately above and below the volcanic ash deposit at that locality. We also sampled the Clarendon section (Figure 1) for geochronologic and magnetic polarity stratigraphy purposes. Similar to the Highway 207 section, the lower part of the Clarendon section exposes the uppermost part of the Whitehorse Group, with abundant karstification features, which is of reverse polarity. The rest of the exposed section is in the lower Quartermaster Formation, and the lower part of the formation, which contains the volcanic ash deposit referred to Table 2, is largely of normal polarity, with the very uppermost part of the exposed section being of reverse polarity.
Stable Isotope Geochemistry
In total, 260 analyses of dolomite cement δ13C and δ18O values were completed: 89 from the Palo Duro Canyon section (Table 7), 27 from the Highway 207 section (Table 8), 91 from the Caprock Canyons section (Table 9), and 53 from the Dickens section (Table 10). There is no clear parametric correlation between dolomite δ18O values and corresponding dolomite δ13C values among the sections (Figure 10).
TABLE 7. Results of analysis of dolomite cements from Palo Duro Canyon State Park.
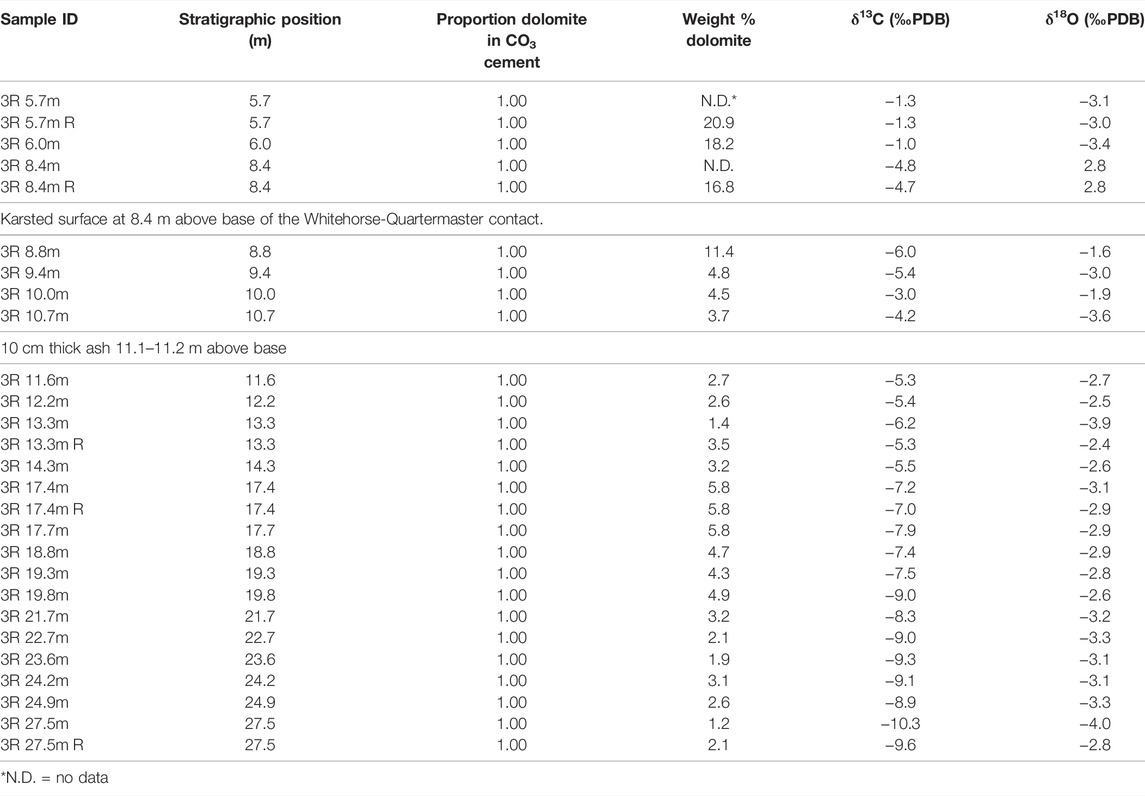
TABLE 8. Results of analysis of dolomite cements from Highway 207.
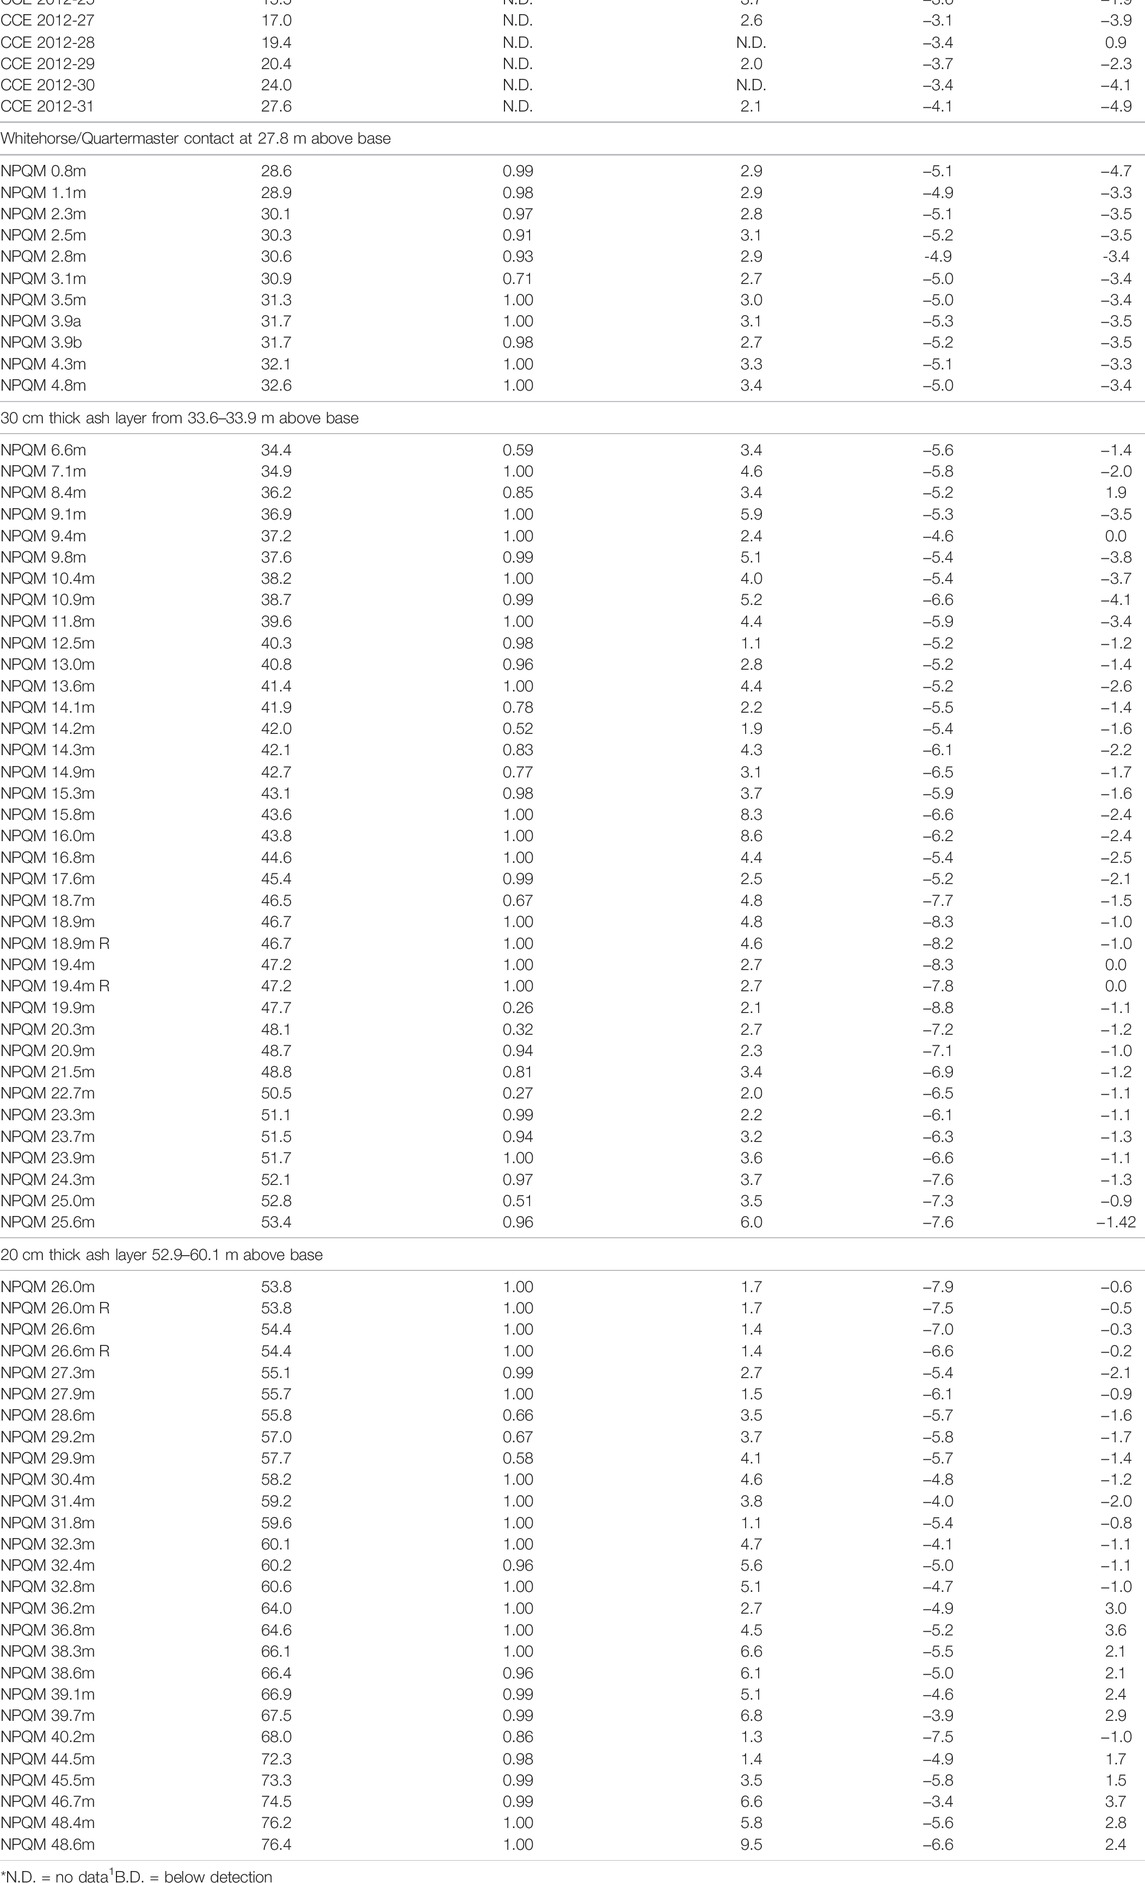
TABLE 9. Results of analysis of dolomite cements from Caprock Canyons State Park.
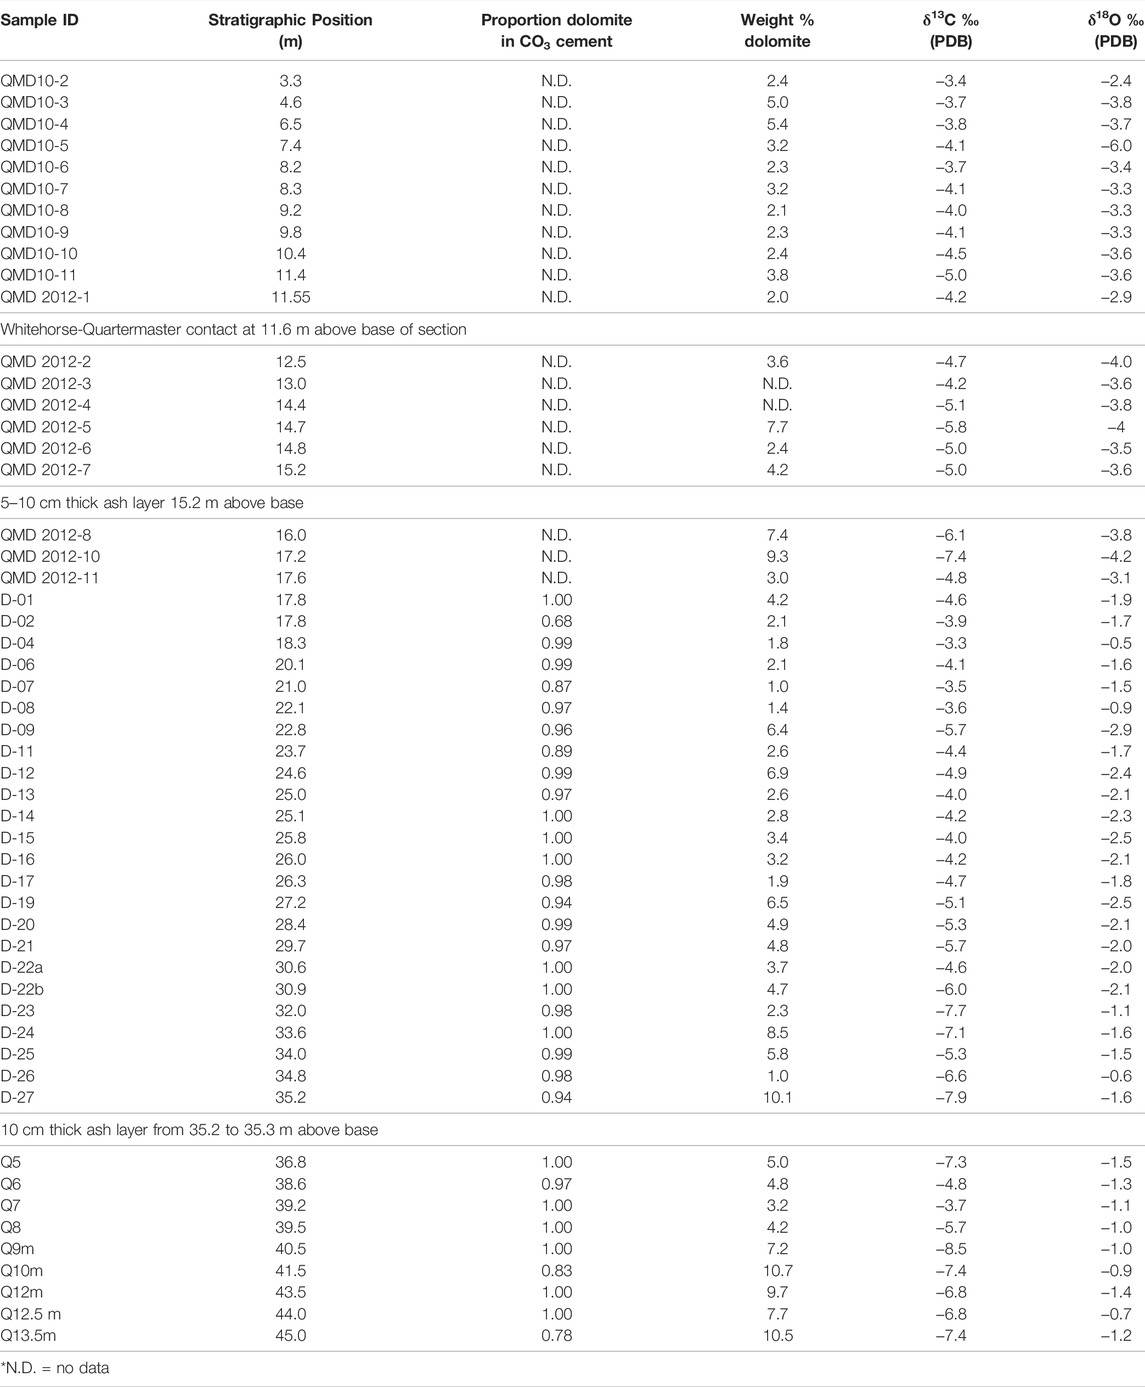
TABLE 10. Results of analysis of dolomite cements from Dickens.
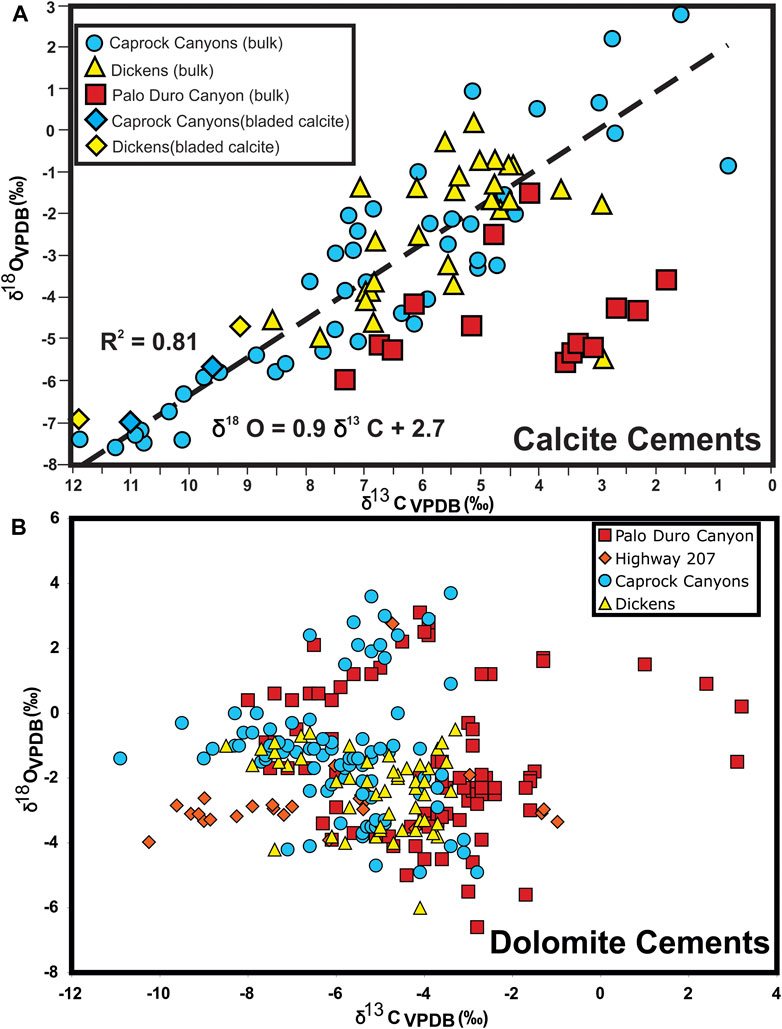
FIGURE 10. (A) Cross plot of δ18O and δ13C values of calcite cements in bulk sediments among the three stratigraphic sections which include calcite cement as well diagenetic bladed calcite cements from the Caprock Canyons and Dickens stratigraphic sections. The strong parametric correlation seen within each, and among all, section(s) suggests that the measured δ18O and δ13C value reflects a mass-dependent contribution of one population of relatively 18O- and 13C-rich early cement and a relatively 16O- and 12C-rich later diagenetic cement. See text for further discussion. (B) Cross plot of δ18O and δ13C values of dolomicrite cements in bulk sediments among the four stratigraphic sections. The lack of strong parametric correlation among these samples suggests that there is no mass-based contribution of different generations of dolomite cement with different end-member δ18O and δ13C values and therefore may represent primary or very early burial conditions during Permian-Triassic time. See text for further discussion.
Dolomite samples from the Palo Duro Canyon section were collected from rocks of the salt-lake facies belt (n = 58) and the sand-flat facies belt (n = 31). Dolomite δ13C and δ 18O values range from −8.0 to 3.2‰ and −6.6 to 3.1‰, respectively (Figures 10, 11). There is a shift in δ13C of dolomite from isotopically heavy values (∼1–4‰) near the base of the section to more negative values (∼−4‰) over a short stratigraphic distance within the Whitehorse Group strata (Figure 11A). Above the negative excursion, dolomite δ13C values remain between ∼−4 and −2‰ through the upper Whitehorse Group. Dolomite δ13C values shift toward generally more negative values, ranging from −4 to −8‰, across the upper boundary of the Whitehorse Group and through the Quartermaster Formation (Figure 11A). Dolomite δ18O values exhibit substantial, and somewhat erratic, stratigraphic variation between -6.6 and 1.7‰ in the Whitehorse Group at Palo Duro Canyon section (Figure 11B). However, there is a trend toward more positive dolomite δ 18O values (from −5 to 3‰) upward through the strata of the Quartermaster Formation in the Palo Duro section.
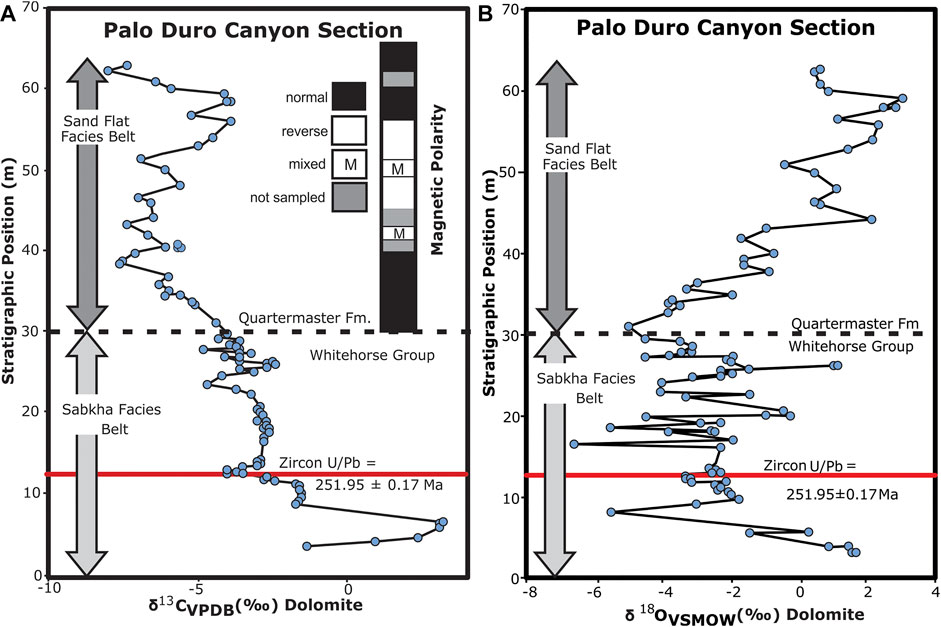
FIGURE 11. (A) Chemostratigraphic chart of the stratigraphic position vs. dolomite δ13C value of dolomicrite cements from the Palo Duro Canyon stratigraphic section. (B) Chemostratigraphic chart of the stratigraphic position vs. dolomite δ18O value of dolomicrite cements from the Palo Duro Canyon stratigraphic section. The red and dashed black lines in both graphs represent the position of a radioisotopically dated volcanic ash and the formational contact between the lower Whitehorse Group strata and upper Quartermaster Formation strata, respectively. See text for detailed discussion.
Dolomite δ13C and δ18O values from the Highway 207 section range from −10.3 to −1.0‰ and −4.0 to 2.8‰, respectively (Figures 10, 12). There is a negative carbon isotope shift from values of ∼−1‰ to ∼−8‰ over a short stratigraphic distance in the upper 2.7 m of the Whitehorse Group (Figure 12A). Moving into the Quartermaster Formation, there is an abrupt stratigraphic shift toward more positive values of ∼2‰ that is stratigraphically followed by a gradual upward trend toward more negative values of ∼−10‰ at the top of the Highway 207 section. With the exception of the one sample directly beneath the karsted surface exposed at the Highway 207 section, dolomite δ18O values exhibit minor stratigraphic variation and range from −4 to −1.5‰ through the salt-lake, sand-flat, and fluvial facies belts in the Whitehorse Group and Quartermaster Formation (Figure 12B). The dolomite sample directly beneath the karst surface has a more positive value than other samples in the Highway 207 stratigraphic section, at 2.8‰.
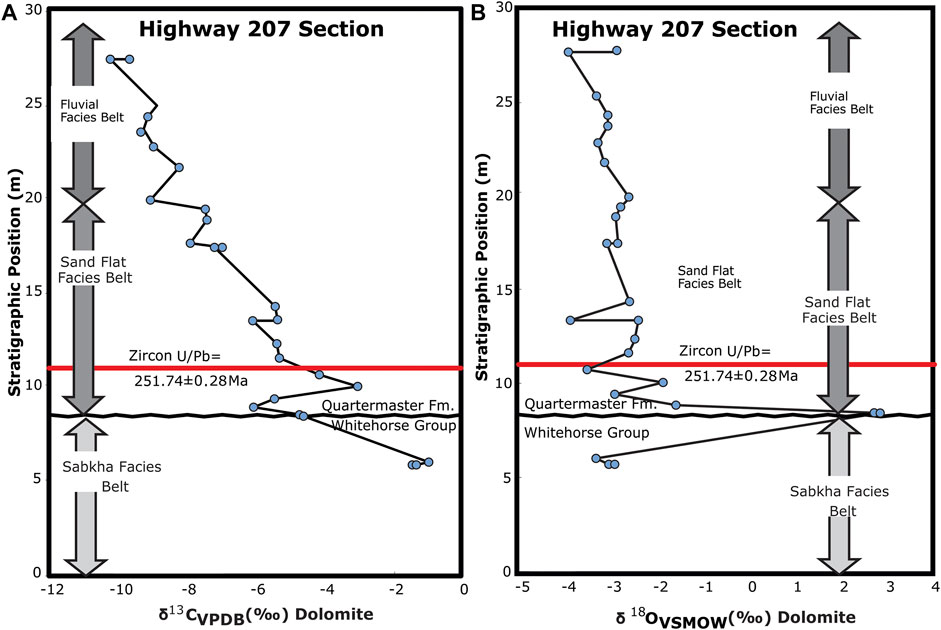
FIGURE 12. Chemostratigraphic chart of the stratigraphic position vs. dolomite δ13C value of dolomicrite cements from the Highway 207 road cut stratigraphic section. (B) Chemostratigraphic chart of the stratigraphic position vs. dolomite δ18O value of dolomicrite cements from the Highway 207 road cut stratigraphic section. The red and black-hatcher lines in both graphs represent the position of a volcanic ash and the disconformable boundary between the lower Whitehorse Group strata and the upper Quartermaster Formation strata, respectively. See text for detailed discussion.
Dolomite δ13C and δ18O values from the Caprock Canyons section range from −10.9 to −2.8‰ and −4.9 to 3.7‰, respectively (Figures 10, 13). There is a large negative carbon isotope excursion from dolomite δ13C values of ∼−3 to ∼−11‰ in the lower 7.4 m of the Whitehorse Group strata (Figure 13A), and dolomite δ13C values in the overlying Whitehorse strata vary between ∼−4 and ∼−3‰. There is another negative carbon isotope shift (to values ∼−5‰) moving upward from the upper Whitehorse Group into the lower ∼10 m of strata in the Quartermaster Formation, above which there is a negative carbon isotope trend from −5‰ to ∼−9‰. Beginning ∼20 m above the base of the Quartermaster Formation, the negative trend reverses and moves toward more positive δ13C values in the upper 30 m of the Caprock Canyons section (Figure 13A). Above this is a general trend toward more positive δ13C values in the basal ∼15 m of the fluvial facies belt. Dolomite is not present in strata above the lower 15 m of the fluvial facies belt (Table 9). Like dolomites from the Palo Duro section, dolomite δ 18O values in the Whitehorse Group of the Caprock Canyons section exhibit substantial variation, ranging between ∼−5 and 1‰ (Figure 13B). Dolomite δ18O values in the overlying Quartermaster Formation exhibit an upward stratigraphic trend toward more positive values from ∼−5 to ∼4‰.
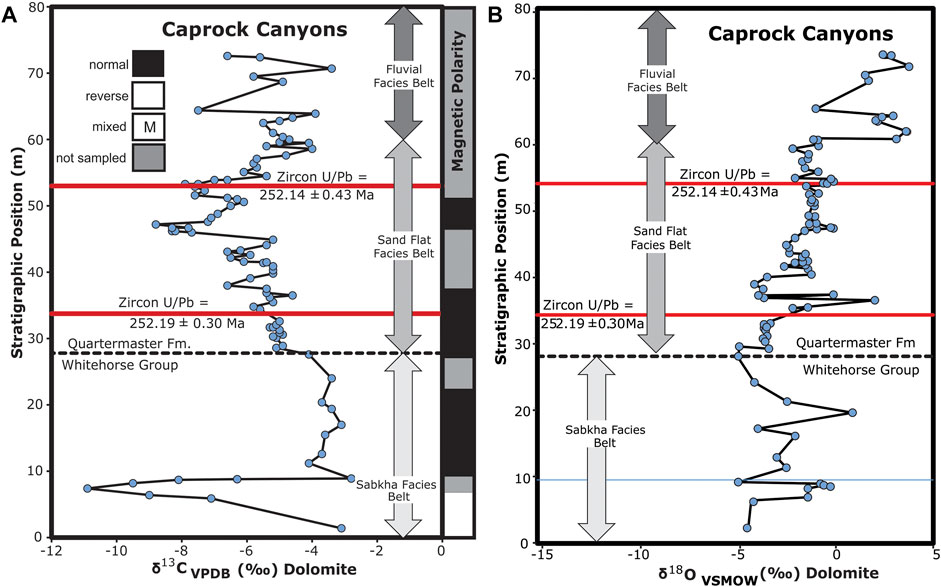
FIGURE 13. (A) Chemostratigraphic chart of the stratigraphic position vs. dolomite δ13C value of dolomicrite cements from the Caprock Canyons stratigraphic section. (B) Chemostratigraphic chart of the stratigraphic position vs. dolomite δ18O value of dolomicrite cements from the Caprock Canyons stratigraphic section. Red lines and black dashed line in both graphs represent the position of volcanic ashes and the stratigraphic boundary between the lower Whitehorse Group strata and the upper Quartermaster Formation strata, respectively. See text for detailed discussion.
Dolomite δ13C and δ18O values from the Dickens section range from −8.5 to −3.3‰ and −6.0 to −0.5‰, respectively (Figures 10, 14). The δ13C values range from ∼−3.5 to −5‰ in the upper Whitehorse Group (Figure 14A). There is a negative δ13C trend from ∼−4 to ∼−7‰ in the lower ∼5 m of the Quartermaster Formation, above which there is an abrupt shift toward more positive values of ∼3‰ over ∼1.1 m. This positive excursion is followed by a gradual trend (over ∼27 m) toward more negative δ13C values. Dolomite δ18O values in the upper Whitehorse Group exhibit substantial variability (−6.0 and −2.4‰; Figure 14B). In the overlying Quartermaster Formation, δ18O values show an upward trend toward isotopically more positive values, ranging from ∼−4 to ∼−0.5‰, with a positive excursion of 3.8‰ about 5.5 m above the base of the formation.
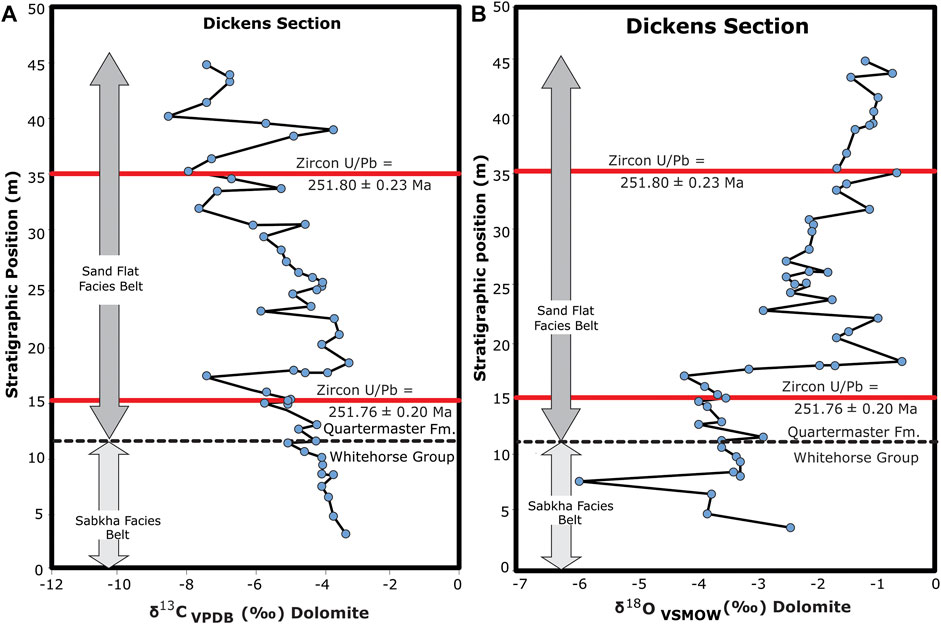
FIGURE 14. (A) Chemostratigraphic chart of the stratigraphic position vs. dolomite δ13C value of dolomicrite cements from the stratigraphic section near Dickens (B) Chemostratigraphic chart of the stratigraphic position vs. dolomite δ18O value of dolomicrite cements from the stratigraphic section near Dickens. Red lines and black dashed line in both graphs represent the position of volcanic ashes and the stratigraphic boundary between the lower Whitehorse Group strata and the upper Quartermaster Formation strata, respectively. See text for detailed discussion.
Discussion
Synthesis of Geochronology
The lack of a parametric correlation among microspar dolomite cement δ13C and δ18O values in the salt-lake, sand-flat and lower fluvial facies belts, in conjunction with lack of petrographic evidence for different generations of dolomite cementation, suggests that dolomite δ13C and δ18O values in the Whitehorse Group and Quartermaster Formation may faithfully reflect early-burial environmental conditions and may be used to provide a chemostratigraphic correlation among the different stratigraphic sections in this study.
A weighted mean 206Pb/238U age of 251.95 ± 0.17 Ma on 25 zircons for the lower ash fall deposit collected from the uppermost part of the Whitehorse Group in the Palo Duro Canyon section, and zircons in the lower (n = 10) and upper (n = 7) tuffs in the Quartermaster Formation from Caprock Canyons sections yield ages of 252.19 ± 0.30 and 252.14 ± 0.43 Ma, respectively (Tables 2, 3; Figures 11, 13, 14). Similar, and statistically indistinguishable, zircon crystal U-Pb age estimates have been obtained from ash fall deposits in the Clarendon section (251.92 ± 0.31 Ma), in the lower (251.76 ± 0.20 Ma) and upper (251.80 ± 0.2316 Ma) Dickens section as well as the Highway 207 (251.74 ± 0.28 Ma) section (Tables 2, 3 and Figures 12, 14).
Weighted mean 206Pb/238U ages on zircon crystals from volcanic ash deposits intercalated with marine sedimentary strata from southern China (GSSP in Meishan) date the biostratigraphically defined Permian-Triassic boundary at 251.902 ± 0.024 Ma (Burgess et al., 2014). Assuming that the U-Pb zircon age constraints from the ash fall deposits in the upper Whitehorse Group and lower Quartermaster Formation represent true depositional events (in the sense that the zircon crystallization age closely approximates the age of deposition), the ages of these ashes, tightly clustering around 251.9 Ma (Tables 2,3), are analytically indistinguishable from that of the age constraints for the end-Permian extinction event, Permian-Triassic boundary, and δ13Ccarb excursion that are well documented in southeast China (e.g., Burgess et al., 2014). Additionally, the end-Permian extinction event is characterized by a large and abrupt decrease in the δ13C values of carbonate and organic matter formed in both marine and terrestrial environments. Although the magnitude of the negative δ13C shift varies from ∼3–4‰ in open marine biogenic calcite (e.g., Gruszcynski et al., 1989) to greater than 20‰ in terrestrial organic matter (Krull et al., 2000; Krull and Retallack, 2000), the shift itself is a global phenomenon, as it has been documented in at least 40 different boundary sequences around the world (Korte and Kozur, 2010). This prominent negative excursion in δ13C has even been used to identify the approximate location of the PTB in strata that are not datable by other means (Holser and Magaritz, 1985; 1987; Holser et al., 1989; 1991; Magaritz, 1989; Magaritz et al., 1988; 1992). More recent high-resolution studies of marine carbonate δ13C values from southern China demonstrate that a negative δ13C excursion began prior to the end-Permian marine extinction event with sustained and more negative δ13C values continuing in post-extinction, Lower Triassic strata (Lou et al., 2011).
Strata of the Whitehorse Group and Quartermaster Formation sampled at five different section localities in northwest Texas yield well-defined magnetization components of NNW and shallow positive inclinations, and their antipodes, which we interpret as being of normal and reverse polarity, respectively. These magnetization components are mainly carried by hematite of both detrital and authigenic origin. Notably, the stratigraphic intervals within which the prominent ash fall deposits, which have yielded high precision U-Pb zircon age data consistent with their emplacement at the time of the Permian-Triassic boundary, are either directly identified to be of normal polarity or are closely bounded by normal polarity magnetozones (Figure 15). At face value, based on the high precision U-Pb zircon age data, the pattern of terrestrial sedimentation in western Pangea preserved in strata of the Whitehorse Group and Quartermaster Formation, could be essentially time equivalent to the pattern of marine sedimentation and extinction, which, based on magnetic polarity data from the Meishan and Shangsi sections in SE and Central China, respectively, is thought to have occurred within a normal polarity chron of about 700 ka duration (Li and Wang, 1989; Yin et al., 2007; Szurlies, 2013, Glen et al., 2009; Huang et al., 2011; Pan et al., 2021). At the Palo Duro Canyon, Dickens, and Clarendon sections we have identified reverse polarity magnetozones above the normal polarity magnetozone containing the studied ash fall deposits, and at the Caprock Canyons, Highway 207, and Clarendon sections, we have identified reverse polarity magnetozones below this normal polarity magnetozone. On this basis, there is a plausible means to correlate these sections to proposed global magnetic polarity time scales and/or specific sets of polarity data for the time interval across the Permian-Triassic boundary (Steiner, 2006; Hounslow and Muttoni, 2010; Ogg, 2012; Henderson et al., 2012; Szurlies, 2013; Hounslow and Balabanov, 2018; Glen et al., 2009; Huang et al., 2011; Pan et al., 2021; Figure 15). Many magnetic polarity time scales referenced here differ in their placement of the Permian-Triassic boundary in the chron record and in the approach used to develop each polarity time scale, as discussed in Gastaldo et al. (2021), Hounslow and Muttoni (2010) and Hounslow and Balabanov, 2016) indicate the Permian-Triassic boundary at the very base of a ∼700 ka duration chron of entirely or almost entirely normal polarity. These two estimates of the magnetic polarity time scale, as well as that of Steiner (2006) represent a composite of a number of magnetic polarity stratigraphic sections from numerous localities, some of which have more robust age control than others. On the other hand, Ogg (2012), Henderson et al. (2012), and Szurlies (2013) place the Permian/Induan boundary, and the span of marine extinction events, within a comparable ∼700 ka duration normal polarity chron. Notably, the magnetic polarity time scale of Szurlies (2013) is based on data from the largely non-marine Germanic Basins and has complete stratigraphic superposition. The period-level time scales of Ogg (2012) and Henderson et al. (2012) are also composites from a number of sources. The recent study by Pan et al. (2021) documents the presence of a primary magnetization in the carbonate rocks at the Meishan section and, because of the detailed level of sampling, provides a magnetic polarity record that can be tied to the numerous high-precision age U-Pb zircon age determinations for the section. Notably, according to their work, the Changhsingian is dominated by normal polarity and that the normal polarity magnetozone within which the Permian-Triassic boundary lies is at least 600 ka in duration.
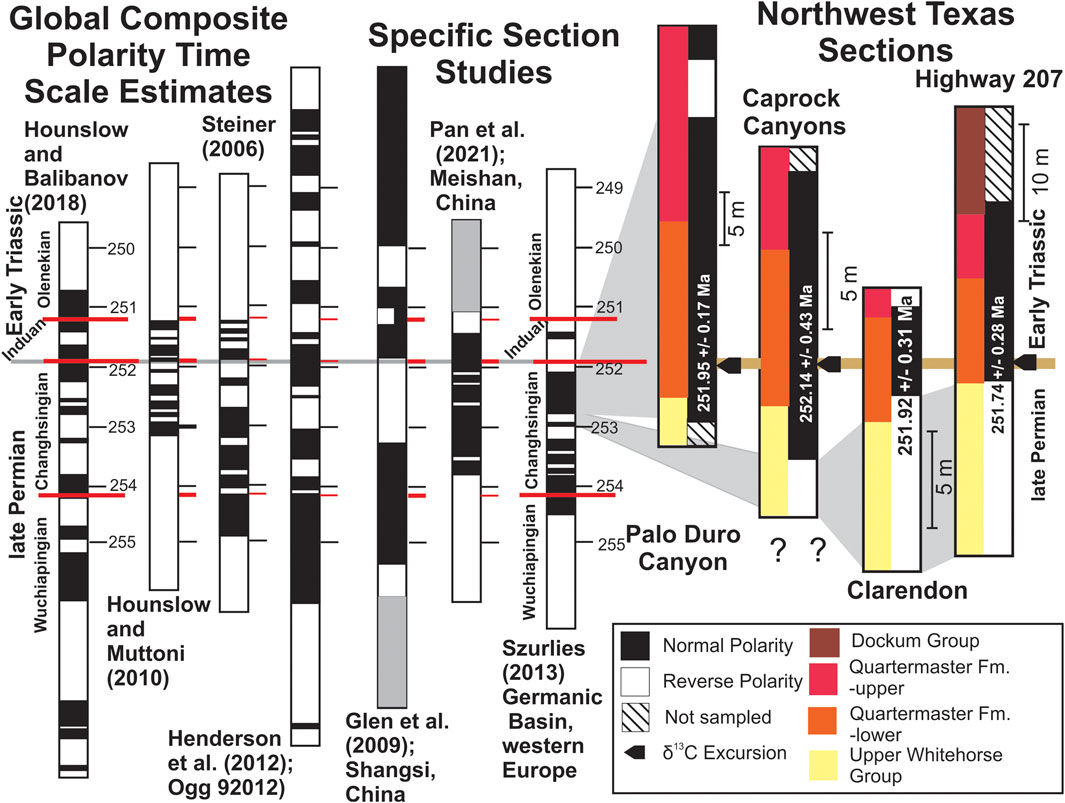
FIGURE 15. Synthesis of magnetic polarity stratigraphy information from the four stratigraphic sections from northwest Texas discussed in this study, compared with several magnetic polarity time scales for the time interval across the Permian-Triassic boundary, as either proposed global geomagnetic polarity time scales or as results from specific studied sections. The proposed magnetic polarity time scales are scaled to a global chronostratigraphy time scale for the latest Permian/earliest Triassic taken from Yang et al. (2021). For the four stratigraphic sections shown here, we indicate the approximate position, using a heavy tan line, of the stratigraphic interval containing the ash fall (volcanic) deposit(s) that have yielded high-precision U-Pb zircon age determinations (also shown). We also show, via a rectangular arrow, the approximate position of the carbon isotope excursion identified in three of the sections. In addition, for each of the sections, we show the approximate locations of the intervals of strata belonging to the upper Whitehorse Group, the lower part of the Quartermaster Formation, the upper part of the Quartermaster Formation, and the lower part of the Dockum Group. Three of the four of the global composite magnetic polarity time scales shown were published before revisions to the estimated age of the end-Permian extinction event and the Permian-Triassic boundary (presently ca. 251.9 Ma; see text). This is also the case for the polarity record for the greater Germanic Basin, from Szurlies (2013). We used the numerical ages of the published polarity records (if provided), rather than attempt to adjust the ages of all chron boundaries. Thus, for example, the long normal polarity chron just prior to the Permian-Triassic boundary in Szurlies (2013) would move to a younger time interval and correlates with the long interval of normal polarity documented at the Meishan section (Pan et al., 2021). The polarity time scale of Pan et al. (2021) incorporates the many high precision U-Pb zircon age determinations from ash beds in that section. For the (Hounslow and Balabanov, 2018) global Permian polarity time scale, we use their proposed ages provided in their Table 3. For the Shangsi section of Glen et al. (2009), no numerical age information was provided in this study; we used the high-precision U-Pb zircon data in Yuan et al. (2019) from specific numbered beds that contain ash deposits to estimate the ages of magnetozone boundaries. In light gray, we show an interpreted correlation between the reverse polarity chron, immediately prior to the normal polarity chron considered to contain the end-Permian extinction event and the Permian-Triassic boundary (Szurlies, 2013), with the reverse polarity magnetozone identified in three of the four sections shown.
With this as a background, we propose that the upper, reverse polarity magnetozone at the Palo Duro Canyon, Dickens, and Clarendon sections can be correlated with the first reverse polarity chron in the Triassic (Induan), the base of which is about 251.40 Ma, according to Pan et al. (2021). The normal polarity magnetozone containing the ash fall deposits that yield U-Pb zircon ages that cluster at ∼251.9 Ma correlates with the ∼700 ka long normal polarity chron within which the Permian-Triassic boundary, as well as the end-Permian extinction event, have been proposed by many workers to lie. In addition, the reverse polarity magnetozone identified in the upper part of Whitehorse Group strata is interpreted to correlate with the youngest reverse polarity chron in the Changhsingian.
Based on the carbon isotope record of dolomite cements in the Whitehorse Group and Quartermaster Formation, the large negative δ13C excursion of ∼8‰ near the bases of both the Palo Duro Canyon and Caprock Canyons stratigraphic sections, in the salt-lake facies, is interpreted to correspond to the pre-extinction negative isotope excursion (Korte and Kozur, 2010) whereas the subsequent sustained upward pattern of relatively negative δ13C values is consistent with the post-extinction, Early Triassic continuation of relatively negative marine calcite δ13C values that has been documented in strata of southern China (Lou et al., 2011). Therefore, the carbon isotope chemostratigraphy and U-Pb zircon age estimates for the ash fall deposits in the uppermost Whitehorse Group and lower Quartermaster Formation indicate that the upper ∼20 m of Whitehorse Group strata, at most sections, and the entire Quartermaster Formation are earliest Triassic in age, contrary to previous interpretations of these strata as Ochoan (Changhsingian), late Permian (e.g., Gradstein et al., 2012).
Implications
Paleoenvironmental Perspectives
Although paleosol profiles are a relatively rare feature of the Whitehorse Group and Quartermaster Formation sections, there is clear evidence of common subaerial exposure in the form of desiccation cracks, clastic dikes (Figure 4B), and shrink-swell features and even some calcrete and rhizomorph-type calcareous features near the top of the Quartermaster Formation in Caprock Canyons section. Collectively, these paleosol types, Vertisols, calcic Vertisols, and Calcisols (e.g., Mack et al., 1993; Tabor and Myers, 2015; Tabor et al., 2017) are similar, but typically thinner and not as well developed, as paleosol profiles found in older strata from lower and middle Permian strata of the region around modern-day Texas (Tabor and Montañez, 2004; DiMichele et al., 2006; Tabor et al., 2008; Zambito and Benison, 2013) and middle to upper Permian strata of paleotropical basins within the interior of Pangea (Tabor et al., 2011; Smith et al., 2015; Michel et al., 2015, 2016) and northeast Pangea (Yang et al., 2010; Thomas et al., 2011), which was part of a great and long-duration drying trend of tropical continental environments throughout the Permian (Tabor, 2013; Michel et al., 2015) and into the Triassic as the so-called “Pangean Megamonsoon” (Parrish, 1993), which resulted in global-scale changes in atmospheric circulation, climate, and biodiversity (Tabor and Montañez, 2002; Sidor et al., 2005; Tabor and Poulsen, 2008; Looy et al., 2016).
It is well-known that semi-arid and arid climates are not conducive for plant preservation (DiMichele et al., 2006; Gastaldo and Demko, 2011), which is why we know little about late Permian to Early Triassic plant life in the equatorial region of Euramerican Pangea. Here also, despite evidence for the abundance of liquid water on the surface during formation of the Whitehorse Group and Quartermaster Formation is, most sections offer little evidence for macroscopic examples of plant life. This is akin to the increasing attention to the concept of “wet deserts” which, among arid-land sedimentologists, studying both modern and ancient environments, that deserts may periodically experience wet conditions and this may be applicable to the equatorial regions of Permian continental landmasses (e.g., Smith et al., 2009, 2015; Tabor et al., 2011; Tabor, 2013; Looy et al., 2016). The rhizostructures in the fluvial facies belt of the Quartermaster Formation and rare fossilized tree trunks in the upper few meters of the section at Caprock Canyons, however, show that large woody plants were present on the landscape (Supplementary Figure S12). Future work will endeavor to further investigate the phytoliths and petrified wood, and evaluate in more detail the environmental conditions, which may have kept this region seemingly inhospitable during the latest Permian and earliest Triassic (Table 7).
Fluvial Style
Based on field studies of continental Permian-Triassic strata of the Karoo Supergroup exposed in the central Karoo Basin, in South Africa, Ward and others (2000) hypothesized that continental fluvial morphologies, at least at mid-latitudes, shifted from dominantly meandering systems in the latest Permian to braided stream systems in the earliest Triassic, on a relatively global scale, as a result of the mass extinction of plants, which led to increased soil erosion rates and sediment supplies to fluvial systems. These workers argued that the increased sediment supply overburdened continental fluvial systems, which then developed braided morphologies (Ward et al., 2000). In the late Permian to Early Triassic, the central Karoo Basin was located at a southern paleolatitude in Gondwana of about 45°. Although a braided fluvial system is not preserved at the Palo Duro Basin sites presented here, we argue that there is considerable field evidence for the existence of meandering stream systems in the Lower Triassic fluvial facies belt strata of the upper Quartermaster Formation, and that this information can be used to test the vegetation extinction/fluvial style hypothesis. In addition, although macromorphologic evidence for vascular plants is lacking until the uppermost fluvial facies belt strata near the top of the Caprock Canyons section, vascular plants were present within the basin based on the abundance of phytoliths within the sand-flat and fluvial facies belts of the Quartermaster Formation (Figure 5D). Future work will attempt to gather organic matter constituents from the phytoliths preserved in Whitehorse Group and Quartermaster Formation rocks and will further explore for strata exposed below the large negative δ13C excursion documented here in the lowermost-exposures of the Whitehorse Group. Nevertheless, the presence of Lower Triassic meandering fluvial deposits of Early Triassic age in the Quartermaster Formation, in conjunction with ubiquity of phytoliths in the sand flat and fluvial facies of the Caprock Canyons section, does not support the hypothesized global transition from Permian age meandering fluvial systems to Triassic age braided morphologies. Fluvial systems in the Palo Duro Basin, which were deposited at low (∼5–10°) northern latitudes in western Pangea, had enough streambank cohesiveness in this region to maintain meandering fluvial systems soon after the end-Permian extinction.
Atmospheric Oxygen Concentrations in the Early Triassic
Numerous studies have cited evidence for low atmospheric oxygen levels in the earliest Triassic, which either caused, or were a consequence of processes responsible for the end-Permian extinction. Inferred low oxygen levels were based on reports of the presence of specific pedogenic minerals that form under anoxic conditions (Sheldon and Retallack, 2002), the sedimentary record of fusain (burnt fossil wood; Uhl et al., 2008) and vertebrate functional morphology (Retallack et al., 2003). However, we find the abundance of hematite cement as an early-formed authigenic phase, which clearly is an important carrier of a very-well defined remanence of Permian-Triassic age through most of the salt-lake, sand flat, and fluvial facies belts, to be inconsistent with the hypothesis of low oxygen levels for these depositional environments. If low oxygen levels had prevailed in the Early Triassic atmosphere, ferrous iron-bearing authigenic sedimentary minerals such as siderite, ankerite, berthierine, pyrite, magnetite or maghemite would be prevalent in these strata. The absence of these minerals in Whitehorse Group and Quartermaster Formation rocks argues strongly against an oxygen-minimum life-crisis during the earliest Triassic. Although there is strong evidence for oxygen-poor marine waters in Tethys and Panthalassa during Early Triassic time (e.g., Wignall and Twitchett, 2002), our results suggest that that terrestrial ecosystems were not affected in a deleterious way by low oxygen levels.
Oxygen Isotope Composition of Dolomite Cements
In sub-aqueous environments such as those in which Whitehorse Group and Quartermaster Formation sediments were deposited, the δ18O value of dolomite cements reflects 1) the composition of water from which the dolomite crystallized and 2) the temperature at which dolomite crystallization occurred. The temperature dependence of oxygen isotope fractionation between dolomite and water is:
(1) 1000 lnαdolomite-water = 2.73X10⁶/T2 + 0.26
Where T is temperature in degrees Kelvin and 1000 lnαdolomite-water corresponds to per mil units on the SMOW scale (Vasoncelos et al., 2005). Dolomite cements in the Whitehorse Group and Quartermaster Formation range from ∼−6 to +3‰ on the PDB scale, which corresponds to 24.9 and 34.1‰, respectively, on the SMOW scale. Assuming a water δ18O composition of ∼0‰ (SMOW), dolomite δ18O values of 24.9 and 34.1‰ would correspond to crystallization temperatures of ∼65°C and ∼10°C, respectively. Although the Permian and Triassic periods are characterized by both hot (Joachimski et al., 2013; Zambito and Benison, 2013) and cool (Romano et al., 2013) phases, this range of possible temperatures is extreme. Instead, there was likely some variation in the δ18O values of water that contributes to the range of dolomite cement δ18O values. For example, the shift to more positive values across the Whitehorse-Quartermaster/salt-lake to sand-flat boundary in the Palo Duro Canyon, Caprock Canyons and Dickens sections is coincident with a transition from gypsum evaporite deposition at the time of Whitehorse Group sedimentation to more extreme evaporite phases (e.g., halite) during the early part of Quartermaster Formation sedimentation. The δ18O value of water in an evaporative setting is dependent upon the humidity of the overlying airmass over a pool, and generally the liquid fraction becomes more positive as evaporation proceeds. Therefore, the more positive values in the lower strata of the Quartermaster Formation may reflect 18O-enrichment of waters associated with halite deposition. Similarly, the most positive dolomite δ18O values in the Highway 207 section are from rocks directly beneath the karst surface and may reflect evaporative enrichment of waters associated with exposure of that unit. Notably, gypsum deposition in the Whitehorse Group implies that some evaporative enrichment of the salt-lake water δ18O values occurred prior to dolomite cementation. In this respect, the relatively low dolomite δ18O values (∼−6‰VPDB) may have smaller 1000lnα values than those supposed in the preceding discussion (and based on waters of ∼0‰SMOW) and thus would correspond to even higher temperatures of crystallization. Although a quantitative assessment of paleotemperatures from these dolomite data is problematic, the highest temperatures of dolomite crystallization occurred during deposition of Whitehorse Group strata during and after the large negative carbon isotope excursion in the salt-lake facies, and lower crystallization temperatures of dolomite crystallization occurred toward the top of the sand-flat and fluvial facies. Future work will seek to evaluate more precisely the paleotemperatures of deposition through these strata using carbonate isotopologue data (e.g., Ghosh et al., 2006; Suarez et al., 2011; Hill et al., 2014) and phyllosilicate stable oxygen and hydrogen isotope values (e.g., Tabor and Montanez, 2005; Tabor 2007; Rosenau and Tabor, 2013; Andrzejewski and Tabor, 2020).Conclusions
Carbon-isotope chemostratigraphy and radioisotopic dating, combined with magnetic polarity stratigraphy, indicate that the Permian-Triassic boundary is present in continental strata of the uppermost Whitehorse Group and lowermost Quartermaster Formation in the Palo Duro Basin. Based on these data, the Quartermaster Formation in northern Texas, which previously was considered to be late Permian, is instead largely of Early Triassic age. The persistence of meandering fluvial morphologies and continual presence of large, woody plants in Early Triassic terrestrial environments both argue against suggestions of profound changes in erosion rates and sedimentation style related to a large-scale die-off of land plants. Evidence for widespread anoxia in Permian-Triassic strata in the Palo Duro Basin is lacking. Crystallization temperature estimates derived from the δ18O values of dolomite cements reveal a paleoclimate transition across the Permian-Triassic boundary, with higher temperatures during deposition of the upper Permian Whitehorse Group and a shift to lower temperatures in the Lower Triassic Quartermaster Formation. Our findings for terrestrial deposits across the Permian-Triassic boundary in a continental basin in North America await corroboration from contemporaneous continental sedimentary sequences elsewhere.
Data Availability Statement
The original contributions presented in the study are included in the article/Supplementary Materials, further inquiries can be directed to the corresponding author.
Author Contributions
NT collected all of the stable isotope geochemistry data and conducted field stratigraphic measurements and observations. JG and JJ were involved in the sampling of all materials for magnetic polarity stratigraphy and conducted many measurements in the laboratory. JG prepared many of the figures for the manuscript. PR, WM and RM sampled all of the volcanic ash deposits and carried out the U-Pb zircon age determinations. TM assisted in field stratigraphic studies and assisted with stable isotope measurements. CL and RK provided all of the paleontologic observations and interpretations.
Funding
This research was supported by the US National Science Foundation, Division of Earth Sciences. Award numbers: 0844147 (NT and TM), 0843839 (JG), 0844009 (CL), and 0844098 (PR and RM).
Conflict of Interest
The authors declare that the research was conducted in the absence of any commercial or financial relationships that could be construed as a potential conflict of interest.
Publisher’s Note
All claims expressed in this article are solely those of the authors and do not necessarily represent those of their affiliated organizations, or those of the publisher, the editors and the reviewers. Any product that may be evaluated in this article, or claim that may be made by its manufacturer, is not guaranteed or endorsed by the publisher.
Acknowledgments
We would like to thank the landowners and park staff that provided access to, and allowed us to sample, sections on private and Texas State Parks (Caprock Canyons and Palo Duro Canyon) lands, respectively. Thanks to K. Ables and N. Reynolds (UT Dallas) for help with some of the field sampling for magnetic polarity studies. Some of the magnetic polarity stratigraphy data reported here originate from the MS thesis research of D. Collins. We thank Gregory H. Mack for his field insights on the Permian and Triassic strata of the Palo Duro Basin.
Supplementary Material
The Supplementary Material for this article can be found online at: https://www.frontiersin.org/articles/10.3389/feart.2021.747777/full#supplementary-material
References
Adrzejewski, K., and Tabor, N. J. (2020). Paleoenvironmental and Paleoclimatic Reconstruction of Cretaceous (Aptian-Cenomanian) Terrestrial Formations of Texas and Oklahoma Using Phyllosilicates. Palaeogeogr. Palaeoclimatol. Palaeoecol. 543, 109491. doi:10.1016/j.palaeo.2019.109491
Al-Aasm, I. S., Taylor, B. E., and South, B. (1990). Stable Isotope Analysis of Multiple Carbonate Samples Using Selective Acid Extraction. Chem. Geology. Isotope Geosci. section 80, 119–125. doi:10.1016/0168-9622(90)90020-d
Benton, M. J. (2012). No Gap in the Middle Permian Record of Terrestrial Vertebrates. Geology 40, 339–342. doi:10.1130/g32669.1
Bilardello, D., and Kodama, K. P. (2010). Rock Magnetic Evidence for Inclination Shallowing in the Early Carboniferous Deer Lake Group Red Beds of Western Newfoundland. Geophys. J. Int. 181, 275–289. doi:10.1111/j.1365-246x.2010.04537.x
Black, L. P., Kamo, S. L., Allen, C. M., Davis, D. W., Aleinikoff, J. N., Valley, J. W., et al. (2004). Improved 206Pb/238U Microprobe Geochronology by the Monitoring of a Trace-Element-Related Matrix Effect; SHRIMP, ID-TIMS, ELA-ICP-MS and Oxygen Isotope Documentation for a Series of Zircon Standards. Chem. Geol. 205, 115–140. doi:10.1016/j.chemgeo.2004.01.003
Borchert, H., and Muir, R. O. (1964). Salt Deposits: The Origin, Metamorphism and Deformation of Evaporites. Princeton, NJ: D. Van Nordstrand, 300.
Bowring, J. F., McLean, N. M., and Bowring, S. A. (2011). Engineering Cyber Infrastructure for U-Pb Geochronology: Tripoli and U-Pb_Redux. Geochem. Geophys. Geosys. 12. doi:10.1029/2010gc003479
Brookfield, M. E., Twitchett, R. J., and Goodings, C. (2003). Palaeoenvironments of the Permian-Triassic Transition Sections in Kashmir, India. Palaeogeogr. Palaeoclimatol. Palaeoecol. 198, 353–371. doi:10.1016/s0031-0182(03)00476-0
Burgess, S. D., Bowring, S., and Shen, S.-Z. (2014). High-precision Timeline for Earth's Most Severe Extinction. Proc. Natl. Acad. Sci. USA 111, 3316–3321. doi:10.1073/pnas.1317692111
Chang, S. (2008). Applications of High-Precision Geochronology in Evolution of Mass Extinctions. Berkeley: University of California, 168.
Collins, D. R. (2014). Paleomagnetic and Magnetostratigraphic Investigations of the Whitehorse Group/Quartermaster (Dewey Lake) Formation (Upper Permian/lowermost Triassic) in the The Palo Duro Basin, Northwest Texas. M.S. Thesis. Richardson, TX: University of Texas at Dallas.
Collinson, D. W. (1975). Instruments and Techniques in Paleomagnetism and Rock Magnetism. Rev. Geophys. 13, 659–686. doi:10.1029/rg013i005p00659
Craig, H. (1957). Isotopic Standards for Carbon and Oxygen and Correction Factors for Mass-Spectrometric Analysis of Carbon Dioxide. Geochimica et Cosmochimica Acta 12, 133–149. doi:10.1016/0016-7037(57)90024-8
Dalrymple, R. W., Zaitlin, B. A., and Boyd, R. (1992). Estuarine Facies Models; Conceptual Basis and Stratigraphic Implications. J. Sediment. Res. 62, 1130–1146. doi:10.1306/d4267a69-2b26-11d7-8648000102c1865d
Davydov, V. I., Crowley, J. L., Schmitz, M. D., and Poletaev, V. I. (2010). High-precision U-Pb Zircon Age Calibration of the Global Carboniferous Time Scale and Milankovitch Band Cyclicity in the Donets Basin, Eastern Ukraine. Geochem. Geophys. Geosystems 11, Q0AA04. doi:10.1029/2009gc002736
DiMichele, W. A., Tabor, N. J., Chaney, D. S., and Nelson, W. J. (2006). “From Wetlands to Wet Spots: Environmental Tracking and the Fate of Carboniferous Elements in Early Permian Tropical Floras,” in Wetlands through Time. Editors S. F. Greb, and W. A. DiMichele (Boulder, CO, United States: Geological Society of America Special Paper), 399, 223–248. doi:10.1130/2006.2399(11)
Dixon, G. H. (1967). Paleotectonic Investigations of the Permian System in the United States: U.S. Denver, CO, United States: Geological Survey Professional, 65–80.
Domeier, M., Van der Voo, R., and Torsvik, T. H. (2012). Paleomagnetism and Pangea: The Road to Reconciliation. Tectonophysics 514-517, 14–43. doi:10.1016/j.tecto.2011.10.021
Fisher, R. (1953). Dispersion on a Sphere. Proc. R. Soc. A: Math. Phys. Eng. Sci. 217, 295–305. doi:10.1098/rspa.1953.0064
Gastaldo, R. A., and Demko, T. M. (2011). “The Relationship between continental Landscape Evolution and the Plant-Fossil Record: Long Term Hydrologic Controls on Preservation,” in Taphonomy Process and Bias through Time. Editors P. A. Allison, and D. J. Bottjer (Dordrecht: Springer), 249–285.
Gastaldo, R. A., Neveling, J., Geissman, J. W., Kamo, S. L., and Looy, C. V. (2021). A Tale of Two Tweefonteins: What Physical Correlation, Geochronology, Magnetic Polarity Stratigraphy, and Palynology Reveal about the End-Permian Terrestrial Extinction Paradigm in South Africa. Boulder, CO, United States: Geological Society of America Bulletin. doi:10.1130/B35830.1
Ghosh, P., Adkins, J., Affek, H., Balta, B., Guo, W., Schauble, E. A., et al. (2006). 13C-18O Bonds in Carbonate Minerals: A New Kind of Paleothermometer. Geochimica et Cosmochimica Acta 70, 1439–1456. doi:10.1016/j.gca.2005.11.014
Glen, J. M. G., Nomade, S., Lyons, J. J., Metcalfe, I., Mundil, R., and Renne, P. R. (2009). Magnetostratigraphic Correlations of Permian-Triassic marine-to-terrestrial Sections from China. J. Asian Earth Sci. 36, 521–540. doi:10.1016/j.jseaes.2009.03.003
Gradstein, F. M., Ogg, J. G., Schmitz, M. D., and Ogg, G. M. (2012). The Geologic Time Scale 2012. Amsterdam: Elsevier Science.
Griffis, N. P., Mundil, R., Montañez, I. P., Isbell, J., Fedorchuk, N., Vesely, F., et al. (2018). A New Stratigraphic Framework Built on U-Pb Single-Zircon TIMS Ages and Implications for the Timing of the Penultimate Icehouse (Paraná Basin, Brazil). Geol. Soc. America Bull. 130, 848–858. doi:10.1130/b31775.1
Gruszczynski, M., Halas, S., Hoffman, A., and Malkowski, K. H. (1989). A Brachiopod Calcite Record of the Oceanic Carbon and Oxygen Isotope Shifts at the Permian/Triassic Transition. Nature 337, 64–67. doi:10.1038/337064a0
Gustavson, T. C., Smpkins, W. W., Alhades, A., and Hoadley, A. (1982). Evaporite Dissolution and Development of Karst Features on the Rolling Plains of the Texas Panhandle. Earth Surf. Process. Landforms 7, 545–563. doi:10.1002/esp.3290070604
Hallam, A., and Wignall, P. B. (2000). Mass Extinctions and Their Aftermath. New York, NY: Oxford University Press, 320.
Henderson, C. M., Davydov and, V. I., Wardlaw, B. R., Gradstein, F. M., and Hammer, O. (2012). “The Permian Period,” in The Geologic Time Scale 2012. Editors F. M. Gradstein, J. G. Ogg, M. Schmitz, and G. Ogg, 653–679. doi:10.1016/b978-0-444-59425-9.00024-x
Henry, S. G. (1979). Chemical Demagnetization: Methods, Procedures, and Applications through Vector Analysis. Can. J. Earth Sci. 16, 1832–1841. doi:10.1139/e79-167
Hill, P. S., Tripati, A. K., and Schauble, E. A. (2014). Theoretical Constraints on the Effects of pH, Salinity, and Temperature on Clumped Isotope Signatures of Dissolved Inorganic Carbon Species and Precipitating Carbonate Minerals. Geochimica et Cosmochimica Acta 125, 610–652. doi:10.1016/j.gca.2013.06.018
Holser, W. T., and Magaritz, M. (1987). Events Near the Permian-Triassic Boundary. Mod. Geology. 11, 155–180.
Holser, W. T., and Magaritz, M. (1985). The Late Permian Carbon Isotope Anomaly in the Bellerophon basin, Carnic and Dolomite Alps. Jahrbuch fur Geologie Bundes – A 128, 75–82.
Holser, W. T., Schönlaub, H.-P., Attrep, M., Boeckelmann, K., Klein, P., Magaritz, M., et al. (1989). A Unique Geochemical Record at the Permian/Triassic Boundary. Nature 337, 39–44. doi:10.1038/337039a0
Holser, W. T., Schonlaub, H. P., Boeckelmann, K., and Magaritz, M. (1991). The Permian-Triassic of the Gartnerkofel-1 Core (Carnic Alps, Austria): Synthesis and Conclusions. Geologie Budesandstalt 45, 213–232.
Hounslow, M. W., and Balabanov, Y. P. (2018). A Geomagnetic Polarity Timescale for the Permian, Calibrated to Stage Boundaries. Geol. Soc. Lond. Spec. Publications. 450, 61–103. doi:10.1144/SP450.8
Hounslow, M. W., and Muttoni, G. (2010). “The Geomagnetic Polarity Timescale for the Triassic: Linkage to Stage Boundary Definitions,” in The Triassic Timescale. Editor S. G. Lucas (London: Geological Society), 334, 61–102. doi:10.1144/SP334.4
Huang, C., Tong, J., Hinnov, L., and Chen, Z. Q. (2011). Did the Great Dying of Life Take 700 k.y.? Evidence from Global Astronomical Correlation of the Permian-Triassic Boundary Interval. Geology 39, 779–782. doi:10.1130/g32126.1
Irmis, R. B., Mundil, R., Martz, J. W., and Parker, W. G. (2011). High-resolution U-Pb Ages from the Upper Triassic Chinle Formation (New Mexico, USA) Support a Diachronous Rise of Dinosaurs. Earth Planet. Sci. Lett. 309, 258–267. doi:10.1016/j.epsl.2011.07.015
Jackson, J. D. (2016). Neogene Crustal Rotations in the Western Great Basin, Cyclostratigraphy of the Eocene Wind River Formation, and Magnetic Polarity Stratigraphy across the End Permian Extinction Event. Ph.D. Dissertation. Richardson, TX: University of Texas at Dallas, 155.
Joachimski, M. M., Lai, X., Shen, S., Jiang, H., Luo, G., Chen, B., et al. (2013). Climate Warming in the Latest Permian and the Permian-Triassic Mass Extinction. Geology 40, 195–198. doi:10.1130/G32707
Johnson, K. S. (1978). “Stratigraphy and mineral Resources of Guadalupian and Ochoan Rocks in the Texas Panhandle and Western Oklahoma,” in Geology and mineral Deposits of Ochoan Rocks in Delaware Basin and Adjacent Areas: New Mexico Bureau of Mines and Mineral Resources Circular. Editor G. S. Austin 159, 57–62.
Kirschvink, J. L. (1980). The Least-Squares Line and Plane and the Analysis of Palaeomagnetic Data. Geophys. J. Int. 62, 699–718. doi:10.1111/j.1365-246x.1980.tb02601.x
Klappa, C. F. (1980). Rhizoliths in Terrestrial Carbonates: Classification, Recognition, Genesis and Significance. Sedimentology 27, 613–629. doi:10.1111/j.1365-3091.1980.tb01651.x
Kolker, A., and Fracasso, M. A. (1985). K-ar Age of a Volcanic Ash Bed in the Quartermaster and Dewey Lake Formations (Late Permian), Texas panhandle. Isochron West 42, 17–19.
Korte, C., and Kozur, H. W. (2010). Carbon-isotope Stratigraphy across the Permian-Triassic Boundary: A Review. J. Asian Earth Sci. 39, 215–235. doi:10.1016/j.jseaes.2010.01.005
Krull, E. S., and au, G. J. (2000). δ13C Depth Profiles from Paleosols across the Permian-Triassic Boundary: Evidence for Methane Release. Geol. Soc. America Bull. 112, 1459–1472. doi:10.1130/0016-7606(2000)112<1459:cdpfpa>2.0.co;2
Krull, E. S., Campbell, G. J., Lyon, H. J., and au, G. L. (2000). δ13Corgchemostratigraphy of the Permian‐Triassic Boundary in the Maitai Group, New Zealand: Evidence for High‐latitudinal Methane Release. New Zealand J. Geology. Geophys. 43, 21–32. doi:10.1080/00288306.2000.9514868
Lewis, J. C., and Byrne, T. (1996). Deformation and Diagenesis in an Ancient Mud Diapir, Southwest Japan. Geol 24, 303–306. doi:10.1130/0091-7613(1996)024<0303:dadiaa>2.3.co;2
Li, H., and Wang, J. (1989). Magnetostratigraphy of PermoTriassic Boundary Section of Meishan of Changxing. Zhejang Sci. China 8 (6), 652–658.
Looy, C. V., Ranks, S. L., Chaney, D. S., Sanchez, S., Steyer, J.-S., Smith, R. M. H., et al. (2016). Biological and Physical Evidence for Extreme Seasonality in central Permian Pangea. Palaeogeogr. Palaeoclimatol. Palaeoecol. 451, 210–226. doi:10.1016/j.palaeo.2016.02.016
Lou, G., Wang, Y., Yang, H., Algeo, T. J., Kump, L. R., Huang, J., et al. (2011). Stepwise and Large-Magnitude Negative Shift in δ13Ccarb Preceded the Main Marine Mass Extinction of the Permian-Triassic Crisis Interval. Palaeogeogr. Palaeoclimatol. Palaeoecol. 299, 70–82. doi:10.1016/j.palaeo.2010.10.035
Lowrie, W. (1990). Identification of Ferromagnetic Minerals in a Rock by Coercivity and Unblocking Temperature Properties. Geophys. Res. Lett. 17, 159–162. doi:10.1029/gl017i002p00159
Lucas, S. G. (2004). A Global Hiatus in the Middle Permian Tetrapod Fossil Record. Stratigraphy 1, 47–64.
Ludwig, M. (2008). Mathematik und der weiße Sport. User's manual for Isoplot 3.6. Berkeley, CA: Berkeley Geochronology Center, 77–84. doi:10.1007/978-3-8348-9604-9_7
Mack, G. H., James, W. C., and Monger, H. C. (1993). Classification of Paleosols. Geol. Soc. America Bull. 105, 129–136. doi:10.1130/0016-7606(1993)105<0129:cop>2.3.co;2
Magaritz, M. (1989). 13C Minima Follow Extinction Events: A Clue to Faunal Radiation. Geol 17, 337–340. doi:10.1130/0091-7613(1989)017<0337:cmfeea>2.3.co;2
Magaritz, M., Bart, R., Baud, A., and Holser, W. T. (1988). The Carbon-Isotope Shift at the Permian/Triassic Boundary in the Southern Alps Is Gradual. Nature 331, 337–339. doi:10.1038/331337a0
Magaritz, M., Krishnamurthy, R. V., and Holser, W. T. (1992). Parallel Trends in Organic and Inorganic Carbon Isotopes across the Permian/Triassic Boundary. Am. J. Sci. 292, 727–739. doi:10.2475/ajs.292.10.727
Mattinson, J. M. (2005). Zircon U-Pb Chemical Abrasion ("CA-TIMS") Method: Combined Annealing and Multi-step Partial Dissolution Analysis for Improved Precision and Accuracy of Zircon Ages. Chem. Geology. 220, 47–66. doi:10.1016/j.chemgeo.2005.03.011
Mazullo, S. J. (1986). Mississippi Valley-type Sulfides in Lower Permian Dolomites, Delaware basin, Texas: Implications for basin Evolution. Am. Assoc. Pet. Geology. Bull. 70, 943–952. doi:10.1306/94886641-1704-11D7-8645000102C1865D
McCrea, J. M. (1950). On the Isotopic Chemistry of Carbonates and a Paleotemperature Scale. J. Chem. Phys. 18, 849–857. doi:10.1063/1.1747785
McLean, N. M., Bowring, J. F., and Gehrels, G. (2016). Algorithms and Software for U‐Pb Geochronology by LA‐ICPMS. Geochem. Geophys. Geosyst. 17, 2480–2496. doi:10.1002/2015gc006097
Michel, L. A., Tabor, N. J., Montañez, I. P., Schmitz, M. D., and Davydov, V. I. (2015). Chronostratigraphy and Paleoclimatology of the Lodève Basin, France: Evidence for a Pan-Tropical Aridification Event across the Carboniferous-Permian Boundary. Palaeogeogr. Palaeoclimatol. Palaeoecol. 430, 118–131. doi:10.1016/j.palaeo.2015.03.020
Michel, L. A., Tabor, N. J., Schmitz, M., Montanez, I. P., and Davydov, V. I. (2016). Reply to the Comment on “Chronostratigraphy and Paleoclimatology of the Lodève Basin, France: Evidence for a pan-tropical aridification event across the Carboniferous-Permian boundary” by Michel et al., (2015). Palaeogeography, Palaeoclimatology, Palaeoecology 430, 118-131. Palaeogeogr. Palaeoclimatol. Palaeoecol. 441, 1000–1004. doi:10.1016/j.palaeo.2015.10.023
Minero, C. J. (1988). “Sedimentation and Diagenesis along an Island-Sheltered Platform Margin, El Abra Formation, Cretaceous of Mexico,” in Paleokarst. Editors N. P. James, and P. W. Choquette (New York, NY: Springer), 385–405. doi:10.1007/978-1-4612-3748-8_19
Mitchell, W. S. (2014). High-resolution U-Pb Geochronology of Terrestrial Cretaceous-Paleogene and Permo-Triassic Boundary Sequences in North America. Berkeley, CA: University of California, 92.
Molina Garza, R. S., Geissman, J. W., and Lucas, S. G. (2000). Palaeomagnetism and Magnetostratigraphy of Uppermost Permian Strata, Southeast New Mexico, USA: Correlation of the Permian-Triassic Boundary in Non-marine Environments. Geophys. J. Int. 141, 778–786. doi:10.1046/j.1365-246x.2000.00116.x
Molina-Garza, R. S., Geissman, J. W., and Van der Voo, R. (1989). Paleomagnetism of the Dewey Lake Formation (Late Permian), Northwest Texas: End of the Kiaman Superchron in North America. J. Geophys. Res. 94, 17881–17888. doi:10.1029/jb094ib12p17881
Mundil, R., Ludwig, K. R., Metcalfe, I., and Renne, P. R. (2004). Age and Timing of the Permian Mass Extinctions: U/Pb Dating of Closed-System Zircons. Science 305, 1760–1763. doi:10.1126/science.1101012
Ogg, J. G. (2012). “Triassic,” in The Geologic Time Scale 2012. Editors F. M. Gradstein, J. G. Ogg, M. Schmitz, and G. Ogg, 681–730. doi:10.1016/b978-0-444-59425-9.00025-1
Opdyke, N. D., and Channell, J. E. T. (1996). Magnetic Stratigraphy. San Diego, CA: Academic Press, 346.
Parris, J. T. (1993). Climate of the Supercontinent Pangea. J. Geol. 101, 215–233. doi:10.1086/648217
Pan, Y., Zhang, M., Qin, H., He, K., Shen, S.-Z., Deng, C., et al. (Forthcoming 2021). Magnetostratigraphy across the End-Permian Mass Extinction Event from the Meishan Sections, Southeastern China.
Peterson, D. N., and Nairn, A. E. M. (1971). Palaeomagnetism of Permian Redbeds from the South-Western United States. Geophys. J. Int. 23, 191–205. doi:10.1111/j.1365-246x.1971.tb01812.x
Pfefferkorn, H. W., and Fuchs, K. (1991). A Field Classification of Fossil Plant Substrate Interactions. Neues Jahrbuch Geologie Palaeontologie, Abhandlungen 183, 17–36.
Retallack, G. J., Smith, R. M. H., and Ward, P. D. (2003). Vertebrate Extinction Across Permian-Triassic Boundary in Karoo Basin, South Africa. Geo. Soc. Am. Bull. 115, 1133–1152. doi:10.1130/b25215.1
Romano, C., Goudemand, N., Vennemann, T. W., Ware, D., Schneebeli-Hermann, E., Hochuli, P. A., et al. (2013). Climatic and Biotic Upheavals Following the End-Permian Mass Extinction. Nat. Geosci 6, 57–60. doi:10.1038/ngeo1667
Roseanau, N. A., and Tabor, N. J. (2013). Oxygen and Hydrogen Isotope Composition of Paleosol Phylllosilicates: Differential Burial Histories and Determination of Middle-Late Pennsylvanian Low-Latitude Terrestrial Paleotemperatures. Palaeogeogr. Palaeoclimatol. Palaeoecol. 392, 382–397. doi:10.1016/j.palaeo.2013.09.020
Sellwood, B. W., Shepherd, T. J., Evans, M. R., and James, B. (1989). Origin of Late Cements in Oolitic Reservoir Facies: a Fluid Inclusion and Isotopic Study (Mid-jurassic, Southern England). Sediment. Geology. 61, 223–237. doi:10.1016/0037-0738(89)90059-6
Semeniuk, V. (1985). Distribution of Calcrete in Holocene Coastal Sands in Relationship to Climate, Southwestern Australia. J. Sediment. Petrology 55, 86–95. doi:10.1306/212f861b-2b24-11d7-8648000102c1865d
Sheldon, N. D., and au, G. J. (2002). Low Oxygen Levels in Earliest Triassic Soils. Geol 30, 919–922. doi:10.1130/0091-7613(2002)030<0919:loliet>2.0.co;2
Shen, S.-z., Crowley, J. L., Wang, Y., Bowring, S. A., Erwin, D. H., Sadler, P. M., et al. (2011). Calibrating the End-Permian Mass Extinction. Science 334, 1367–1372. doi:10.1126/science.1213454
Sidor, C. A., O'Keefe, F. R., Damiani, R., Steyer, J. S., Smith, R. M. H., Larsson, H. C. E., et al. (2005). Permian Tetrapods from the Sahara Show Climate-Controlled Endemism in Pangaea. Nature 434, 886–889. doi:10.1038/nature03393
Smith, R. M. H., Sidor, C. A., Tabor, N. J., Steyer, J. S., and Chaney, D. S. (2009). Vertebrate Taphonomy and Ichnology of a Permian ‘wet Desert’ in central Pangea. Palaeontol. Africana 44, 179–183.
Smith, R. M. H., Sidor, C. A., Tabor, N. J., and Steyer, J. S. (2015). Sedimentology and Vertebrate Taphonomy of the Moradi Formation of Northern Niger: A Permian Wet Desert in the Tropics of Pangaea. Palaeogeogr. Palaeoclimatol. Palaeoecol. 440, 128–141. doi:10.1016/j.palaeo.2015.08.032
Steiner, M. B. (2006). The Magnetic Polarity Time Scale across the Permian-Triassic Boundary. Geol. Soc. Lond. Spec. Publications 265, 15–38. doi:10.1144/GSL.SP.2006.265.01.02
Steiner, M. (2011). Magnetostratigraphic Correlation and Dating of West Texas and New Mexico Late Permian Strata. New Mexico Geol. Soc. Guidebook, 52nd Field Conf., 59–68.
Suarez, M. B., Passey, B. H., and Kaakinen, A. (2011). Paleosol Carbonate Multiple Isotopologue Signature of Active East Asian Summer Monsoons during the Late Miocene and Pliocene. Geology 39, 1151–1154. doi:10.1130/g32350.1
Szurlies, M. (2013). Late Permian (Zechstein) Magnetostratigraphy in Western and Central Europe. Geol. Soc. Lond. Spec. Publ. 376, 73–85. doi:10.1144/SP376.7
Tabor, N. J., and Montañez, I. P. (2004). Morphology and Distribution of Fossil Soils in the Permo-Pennsylvanian Wichita and Bowie Groups, north-central Texas, USA: Implications for Western Equatorial Pangean Palaeoclimate during Icehouse-Greenhouse Transition. Sedimentology 51, 851–884. doi:10.1111/j.1365-3091.2004.00655.x
Tabor, N. J., and Montañez, I. P. (2005). Oxygen and Hydrogen Isotope Compositions of Permian Pedogenic Phyllosilicates: Development of Modern Surface Domain Arrays and Implications for Paleotemperature Reconstructions. Palaeogeogr. Palaeoclimatol. Palaeoecol. 223, 127–146. doi:10.1016/j.palaeo.2005.04.009
Tabor, N. J., Montañez, I. P., Scotese, C. R., Poulsen, C. J., and Mack, G. H. (2008). “Paleosol Archives of Environmental and Climatic History in Paleotropical Western Pangea during the Latest Pennsylvanian through Early Permian,” in Resolving the Late Paleozoic Ice Age in Time and Space (Denver, CO, United States: Geological Society of America Special Paper), 441, 291–303. doi:10.1130/2008.2441(20)
Tabor, N. J., and Montañez, I. P. (2002). Shifts in Late Paleozoic Atmospheric Circulation Over Western Equatorial Pangea: Insights from Pedogenic mineral δ18O Compositions. Geol 30, 1127–1130. doi:10.1130/0091-7613(2002)030<1127:silpac>2.0.co;2
Tabor, N. J., Montañez, I. P., Steiner, M. B., and Schwindt, D. (2007). δ13C Values of Carbonate Nodules Across the Permian-Triassic Boundary in the Karoo Supergroup (South Africa) Reflect a Stinking Sulfurous Swamp, Not Atmospheric CO2. Palaeogeogr. Palaeoclimatol. Palaeoecol. 252, 370–381. doi:10.1016/j.palaeo.2006.11.047
Tabor, N. J., Myers, T. S., and Michel, L. A. (2017). “Sedimentologist's Guide for Recognition, Description, and Classification of Paleosols,” in Terrestrial Depositional Systems: Deciphering Complexities through Multiple Stratigraphic Methods. Editors K. E. Ziegler, and W. G. Parker, 165–208. doi:10.1016/b978-0-12-803243-5.00004-2
Tabor, N. J., and Myers, T. S. (2015). Paleosols as Indicators of Paleoenvironment and Paleoclimate. Annu. Rev. Earth Planet. Sci. 43, 333–361. doi:10.1146/annurev-earth-060614-105355
Tabor, N. J. (2007). Permo-Pennsylvanian Palaeotemperatures from Fe-Oxide and Phyllosilicate δ18O Values. Earth Planet. Sci. Lett. 253, 159–171. doi:10.1016/j.epsl.2006.10.024
Tabor, N. J., and Poulsen, C. J. (2008). Palaeoclimate across the Late Pennsylvanian-Early Permian Tropical Palaeolatitudes: A Review of Climate Indicators, Their Distribution, and Relation to Palaeophysiographic Climate Factors. Palaeogeogr. Palaeoclimatol. Palaeoecol. 268, 293–310. doi:10.1016/j.palaeo.2008.03.052
Tabor, N. J., Smith, R. M. H., SteyerSidor, J. S. C. A., Sidor, C. A., and Poulsen, C. J. (2011). The Permian Moradi Formation of Northern Niger: Paleosol Morphology, Petrography and Mineralogy. Palaeogeogr. Palaeoclimatol. Palaeoecol. 299, 200–213. doi:10.1016/j.palaeo.2010.11.002
Tabor, N. J. (2013). Wastelands of Tropical Pangea: High Heat in the Permian. High Heat Permian: Geology. 41, 623–624. doi:10.1130/focus052013.1
Thomas, S. G., Tabor, N. J., Yang, W., Myers, T. S., Yang, Y., and Wang, D. (2011). Palaeosol Stratigraphy Across the Permian-Triassic Boundary, Bogda Mountains, NW China: Implications for Palaeoenvironmental Transition Through Earth's Largest Mass Extinction. Palaeogeogr. Palaeoclimatol. Palaeoecol. 308, 41–64. doi:10.1016/j.palaeo.2010.10.037
Torsvik, T. H., Van der Voo, R., Preeden, U., Mac Niocaill, C., Steinberger, B., Doubrovine, P. V., et al. (2012). Phanerozoic Polar Wander, Palaeogeography and Dynamics. Earth-Science Rev. 114, 325–368. doi:10.1016/j.earscirev.2012.06.007
Uhl, D., Jasper, A., Abu Hamad, A. M. B., and Montenari, M. (2008). “Permian and Triassic Wildfires and Atmospheric Oxygen Levels,” in 1st WSEAS international conference on Environmental and Geological Science and Engineering, Malta, September 11–13, 2009, 179–187.
Van der Voo, R. (1993). Paleomagnetism of the Atlantic, Tethys, and Iapetus Oceans. Cambridge, UK: Cambridge University Press, 411.
Vasoncelos, C., McKenzie, J. A., Warthmann, R., and Bernasconi, S. M. (2005). Calibration of the d18O Paleothermometer for Dolomite Precipitated in Microbial Cultures and Natural Environments. Geology 33, 317–320. doi:10.1130/G20992.1
Ward, P. D., Montgomery, D. R., and Smith, R. M. H. (2000). Altered River Morphology in South Africa Related to the Permian-Triassic Extinction. Science 289, 1740–1743. doi:10.1126/science.289.5485.1740
Wignall, P. B., and Twitchett, R. J. (2002). Extent, Duration and Nature of the Permian-Triassic Superanoxic Event. Geol. Soc. America Spec. Paper 356, 305–413. doi:10.1130/0-8137-2356-6.395
Yang, W., Feng, Q., Liu, Y., Tabor, N., Miggins, D., Crowley, J. L., et al. (2010). Depositional Environments and Cyclo- and Chronostratigraphy of Uppermost Carboniferous-Lower Triassic Fluvial-Lacustrine Deposits, Southern Bogda Mountains, NW China - A Terrestrial Paleoclimatic Record of Mid-latitude NE Pangea. Glob. Planet. Change 73, 15–113. doi:10.1016/j.gloplacha.2010.03.008
Yang, W., Wan, M., Crowley, J. L., Wang, J., Luo, X., Tabor, N., et al. (Forthcoming 2021). Paleoenvironmental and Paleoclimatic Evolution and Cyclo-And Chrono-Stratigraphy of Upper Permian-Lower Triassic Fluvial-Lacustrine Deposits in Bogda Mountains, NW China – Implications for Diachronous Plant Evolution across the Permian-Triassic Boundary. Earth Sci. Rev., 103741.
Yin, H. F., Fang, Q. I., Lai, X. L., Baud, A., and Tong, J. N. (2007). The Protracted Permo-Triassic Crisis and Multi-Episode Extinction Around the Permian-Triassic Boundary. Glob. Planet. Change 55, 1–20.
Yuan, D.-X., Shen, S.-Z., Henderson, C. M., Chen, J., Zhang, H., Zheng, Q.-F., et al. (2019). Integrative Timescale for the Lopingian (Late Permian): A Review and Update from Shangsi, South China. Earth-Science Rev. 188, 190–209. doi:10.1016/j.earscirev.2018.11.002
Zambito, J. J., and Benison, K. C. (2013). Extremely High Temperatures and Paleoclimate Trends Recorded in Permian Ephemeral lake Halite. Geology 41, 587–590. doi:10.1130/g34078.1
Keywords: Permian-Triassic boundary, geochronology, stable C isotope 13, stratigraphy, magnetic polarity stratigraphy
Citation: Tabor NJ, Geissman J, Renne PR, Mundil R, Mitchell WS, Myers TS, Jackson J, Looy CV and Kirchholtes RP (2022) Evidence of a Continuous Continental Permian-Triassic Boundary Section in western Equatorial Pangea, Palo Duro Basin, Northwest Texas, U.S.A.. Front. Earth Sci. 9:747777. doi: 10.3389/feart.2021.747777
Received: 26 July 2021; Accepted: 05 October 2021;
Published: 09 May 2022.
Edited by:
Bernard A Housen, Western Washington University, United StatesReviewed by:
William DiMichele, Smithsonian Institution, United StatesKatherine A. Giles, The University of Texas at El Paso, United States
Copyright © 2022 Tabor, Geissman, Renne, Mundil, Mitchell, Myers, Jackson, Looy and Kirchholtes. This is an open-access article distributed under the terms of the Creative Commons Attribution License (CC BY). The use, distribution or reproduction in other forums is permitted, provided the original author(s) and the copyright owner(s) are credited and that the original publication in this journal is cited, in accordance with accepted academic practice. No use, distribution or reproduction is permitted which does not comply with these terms.
*Correspondence: John Geissman, Z2Vpc3NtYW5AdXRkYWxsYXMuZWR1